Abstract
In this work, the properties of concrete modified with dosages of natural pozzolans (NP) in substitution of cement or superfine aggregates were evaluated. Proportions of 20/80 pozzolan/cement or pozzolan/superfine aggregates were selected for the additions of quarry and tuff pozzolans. Pozzolanic activity, durability, compressive strength, characteristic resistance, settling consistency, density, electrical resistivity, depth of water penetration, accessible porosity, and carbonation and chloride penetration were determined for the resulting concrete mixtures, and they were subsequently compared to the values obtained for the reference concrete batches without additions. The results of the cementitious mixtures supplemented with tuff (PZT) and quarry (PZQ) pozzolans, expressed in mmol/L, are consistent with the pozzolanism test, with [Ca(OH)2]/[OH−] ratios at 7 days are 6.03/60.19 for PZQ and 1.78/92.78 PZT. In addition to the pozzolanic activity at these dosages, the characteristic resistance and durability parameters required by EHE-08 were verified. Particular attention was given to the determination of the diffusion of chloride ions, introducing an instrumental modification of the accelerated integral method. The modification provides values of diffusion coefficients similar to those obtained by the other methods with the advantage of greater stability and quality of the measurement.
1. Introduction
The reduction in CO2 emissions into the atmosphere has become a subject of great importance in recent decades in order to reduce the greenhouse effect [1]. Among the various types of industries, the cement sector is one of the largest contributors to CO2, estimated at around 8% of total anthropogenic greenhouse gas (GHG) emissions [2,3,4,5,6,7,8]. One of the ways to reduce this impact is to reduce cement consumption by partially replacing it with supplementary cementitious materials (SCMs), which can be by-products from industry or natural pozzolans (NP), such as fly ash (FA), ground granulated blast furnace slag (GGBS), silica fume (SF), metakaolin (MK), limestone (L), fine glass powder (GP), rice husk ash (RHA), and volcanic tuffs (natural pozzolans) [5,6,9,10,11,12,13,14,15,16,17,18,19,20]. These latter SCMs include both pozzolanic tuffs and those from the extraction of quarry aggregates. Indeed, the abundance of these materials in certain geographic areas, such as volcanic regions, makes them attractive candidates as a partial substitute for cement, mortar, and concrete [1,10,21,22,23,24,25]. These materials are often disposed of in landfills, thus constituting a major environmental problem [5]. Therefore, its reuse would reduce the environmental impact, apart from CO2 emissions, the reduction in the cost of concrete manufacturing, and the improvement of mechanical properties [17]. On the other hand, it is difficult to draw general conclusions on the behavior or to predict the reactivity of a given pozzolan, thus arousing a growing interest in the study of these tuffs or zeolitic deposits [26,27,28,29,30,31].
The effect of pozzolan additions to mortars and concretes varies depending on the type of pozzolan and the percentage of cement or aggregate substituted, among other factors. Generally speaking, pozzolan additions have been reported to increase durability [5,13,14,15,21,26,32,33,34,35,36,37,38], decrease the heat of hydration [1,38], increase resistance to sulfate attack [1,39], increase setting time, prevent water penetration [1,40], and reduce energy cost per unit of cement [37]. Specifically, the effect these additions have on mechanical strength depends on many factors, and conflicting results can often be found in the literature.
When natural pozzolans were used as a cement substitute in the range of 10–30%, Xia et al. [14] reported that the mechanical strength varied differently depending on the type of pozzolan, a fact corroborated by other authors [29,41]. Najimi et al. [1] found that the compressive strength was only affected slightly (actually less than 5%) by substituting about 25% of the Portland cement with natural tuff pozzolan. Costafreda et al. [11] recommend the industrial manufacturing of pozzolanic cement with the proportions 75:25% and 70:30% with natural pozzolans since they provide practically the same mechanical strength. Çullu et al. [42] observed that increasing the percentage of various natural pozzolans at the expense of cement produced a decrease in compressive strength, proposing that the optimum dose may be 10%. Turanli et al. [43] found that the compressive strength of mortar containing large amounts of volcanic ash was lower than that of Portland cement at any age less than 90 days. Khan et al. [18] found that improved fineness of volcanic ash up to 30% mass replacement of cement in mortar demonstrated compressive strength comparable to control and reference fly ash mortars at all ages. In recent work, these authors [19] demonstrated that the incorporation of those ultrafine volcanic ashes in percentages of 10% to 30% improved the compressive strength after 91 days of curing. These results, therefore, do not make it possible to extract a clear trend as to the effect exerted by the additions of natural pozzolans.
Regarding the penetration of aggressive substances, the addition of pozzolans leads to an improvement in the reduction in chloride ion penetration [1], but not in the carbonation process. Thus, Xia et al. [14] found that the addition of natural pozzolans caused a decrease in the resistance to carbonation and a decrease in the diffusion coefficients of chlorides, parameters related to the corrosion of reinforced concrete, chloride being the main cause of reinforcement corrosion [44,45]. The corrosive process has arisen interest in the last decades because it has been identified as the main process related to the durability of reinforced concrete, which leads to great economic losses and, on the other hand, a huge environmental cost due to increased CO2 emissions originated by the consumption of raw materials in the repair or replacement of damaged structures [46,47]. Although authors such as Kaid et al. [48] and Fajardo et al. [49] found that concrete mixed with natural pozzolan showed excellent corrosion resistance, quantification is necessary when these concretes are going to be used in areas with a high chloride content in the environment. For this reason, the penetration of aggressive agents is the basis for quantifying the durability of a structure, although there is no rigorous standardized methodology for predicting its useful life [50]. The first proposals for systematizing the notion of useful life were introduced in the 1970s [51,52] from the observation of the first degradations. These initiatives were by Tuutti reviewed these initiatives [53], and their use among researchers is currently widespread, even if their concretization in codes or recommendations is still very nascent [54].
In the present study, the behavior of concrete samples dosed with additions of natural pozzolans present in the Canary Islands (i.e., tuff pozzolan and quarry pozzolan) in substitution of cement or fine aggregates was tested by physico-chemical and mechanical assays according toto the regulations in force. The pozzolanic activity of the samples and the penetration of aggressive agents were evaluated and compared to samples without addition. The study of the penetration of chlorides in samples of reinforced concrete dosed with these additions stands out for its importance in the corrosion of the reinforcements, using the pool immersion method, the multi-regime test, and the integral method with an instrumental modification. In this way, the diffusion coefficients of the chlorides in the samples were determined. The durability of the tested mixtures was determined from the carbonation and chloride penetration models included in the Spanish regulation EHE-08 [54]. The feasibility of the additions was established based on the results obtained from mechanical and durability tests.
2. Materials and Methods
2.1. Materials and Sample Preparation
Two existing pozzolans in the study area, namely tuff (PZT) and quarry (PZQ) pozzolans, were investigated as possible additives for reinforced concrete. PZT comes from the crushing and grinding of rock classified as unwelded Ignimbrite lithotype (IGNS) [55]. They are made up of a chaotic mix of pumice fragments, ashes, rock fragments, and crystals. They have a trachytic or phonolitic composition, and petrographic microscopy reveals crystals of anorthoclase or sanidine, vitreous fragments of irregular morphology, fragments of aegirine, hornblende, and opaque minerals, all in a microcrystalline or vitreous matrix. PZT is a residue that comes from the clearing of an aggregate quarry located in the area (SATOCAN quarry in the municipality of Arico, Tenerife, Canary Islands). It is a powder with a real density or a specific weight of 2550 kg/m3, which is produced as waste during the exploitation in search of the optimal layers for the extraction of aggregates. Particle size analysis was performed for both pozzolans, and XFR analysis of PZT was also performed.
In this work, an II/A-P/42.5R MR-type cement was used, and Table 1 lists its chemical, physical and mechanical properties. Reinforced concretes were dosed in the laboratory with characteristic resistances 25, 30, and 35 N/mm2 (HA25, HA30, and HA 35, respectively) using this cement and additions of either PZT or PZQ. The concrete samples were assayed using the Fuller [56] method, and their main characteristics are given in Table 2. Pozzolans were introduced in a percentage of 20% by subtracting the amount of cement in the D3 samples, while in the D4 samples, the pozzolans were included as superfine aggregates by subtracting their weight from the basalt sand and not from cement. All proposed dosages and mixtures have been manufactured with expressed water/cement ratios (w/c), in which the moisture of the aggregates has been subtracted from the amount of water.

Table 1.
Chemical, physical, and mechanical properties of the cement (type II/A-P/42.5R MR).
Table 2.
Identification, classification and characteristics of all concrete samples tested. All were made with type II/A-P/42.5R MR cement.
The pozzolanic activity index with lime (PAI) of the concretes with pozzolan contents was determined according to the ASTM C311/C311M-13 standard [57] and further established in the UNE 80303-2 standard [58] in item 7.2.b), and according to the test method UNE EN 196-5 [59] after 7 days.
The aggregates used were gravel and sand from a local quarry with CE marking. The basaltic aggregate, coded A, was selected from the typical quarry materials of the Canary Islands for the manufacture of concrete. These are gravel particles with an approximate size of 20 mm, chosen from the storage material of the assays.
The specimens of each sample were manufactured and stored in accordance with the UNE-EN 12390-1:2001 [60] and UNE-EN 12390-2:2009 [61] standards and according to the geometry established for each particular test. Thus, cylindrical specimens with a diameter of 15 cm and a height of 30 cm were fabricated for the tests of bending and compression, water penetration, chloride penetration by the pond method, direct resistivity, and Wenner. Next, cubic specimens with 10 cm edges were fabricated for chloride penetration tests using the integral method and accessible porosity. Sections 15 cm in diameter and 2.5 cm thick were employed in the multi-regime method. Finally, prismatic specimens of dimensions 15 cm × 15 cm × 60 cm were used in the natural and accelerated carbonation tests. For the integral method, a corrugated steel bar was embedded, such as armor, in each of the specimens. These bars were insulated and then laid out so that the exposed surface was 6 cm long, fully embedded in the concrete. In all cases, once the concrete was properly vibrated, it was hardened in a humid chamber for 28 days. After the hardening period, the specimens were subjected to various tests.
The samples were coded according to a letter-number-letter (DXY) sequence as described below, according to its definition according to EHE-08 [54], and taking into account their main characteristics, such as the grade and type of cement, the water/cement ratio and type of addition. The letter D indicates that the samples were mixed concrete made in the laboratory, whereas the digit X indicates the number of the mix, up to a total of 3 types of concrete dosages. They were followed by letters or acronyms, Y, which indicated the modifications that were made, depending on whether or not it included an addition (e.g., the letter P, to codify the concrete reference mixes, without addition; the letters PZT, for concrete mixes with the addition of pozzolan extracted from a block of tuff, and the letters PZQ, for concrete mixes with the addition of quarry pozzolan). Table 2 also shows sample coding and identification.
2.2. Tests and Methods
The concrete specimens were subjected to various tests as follows. Compressive strength at 28 days, according to UNE-EN 12390-3 [62], and resistance, according to UNE-EN 196-1:2005 [63]. Determination of fresh or settling consistency using the Abrams cone, according to UNE EN 12350-2 [64]. The density of hardened concrete UNE-EN 12390-7 [65]. Electrical resistivity using the direct method (Direct Resistivity) according to UNE 83988-1 [66] and by the four points or Wenner method (Indirect Resistivity) according to UNE 83988-2 [67]. Depth of penetration of water under pressure according to UNE 83309-90 [68] and UNE-EN 12390-8 [69]. Accessible porosity, according to UNE-EN 1936 [70] and according to UNE 83980:2014 [71]. Measurement of carbonation by the natural method at 90 days according to UNE 112011-94 [72], UNE 112011:2011 [73], and UNE 83993-1 [74], as well as by the accelerated method according to UNE 83993-2 [75]. Measurement of chloride penetration through the “Pond” arrangement according to PrUNE 83986 [76] and CEN/TS 12390-11 [77]. Determination of chloride content in hardened concrete according to UNE-EN 14629 [78]. The multi-regime test was performed according to UNE 83987 [79], whereas the integral method is described in UNE 83992-2 [80], and the polarization resistance was measured according to UNE 112072 [81]. Finally, the pozzolanic activity with lime (PAI) was determined according to ASTM C311/C311M-13 [57], UNE 80303-2 [58], and UNE EN 196-5 [59].
2.3. Modification of the Accelerated Integral Method
The assembly of the experimental cell was carried out in accordance with the specifications in standard UNE 83992-2 [80]. Once the concrete specimen was prepared, PVC cylinders were attached to its top side to serve as containers for a 0.6 M NaCl + 0.4 M CuCl2 solution, and a Cu electrode was introduced to serve as the cathode of an electrochemical cell. The union of the plastic cylinder with the surface of the concrete specimen was sealed using neutral silicone, and the whole assembly is shown on the left side of Figure 1.
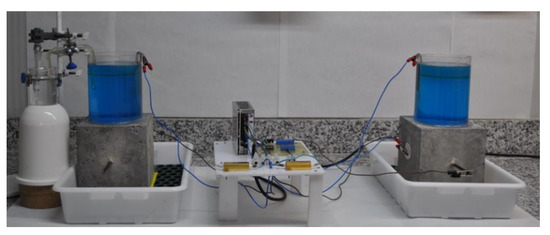
Figure 1.
An assembly comprising two samples in parallel is used in the accelerated integral method.
Along with this setup, an instrumental modification is proposed here, which, although it does not affect the electrochemical nature of the assay, would improve the quality of the data for correct interpretation. Although the standard method indicates that a conventional reference electrode (calomel or Ag/AgCl, for instance) can be introduced into the attached electrochemical cell to determine the potential values of the embedded rods, we instead propose to include a fixed electrode along the plane perpendicular to the location of the embedded bar. This arrangement is shown schematically in Figure 2 and can be found for the specimen on the right of Figure 1.
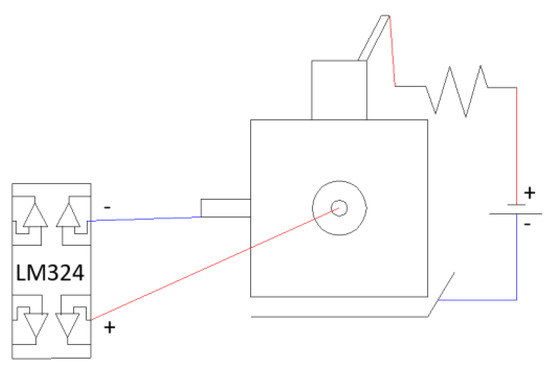
Figure 2.
Wiring diagram of the implemented system. An electrode is fixed to the free side of the specimen on a plane perpendicular to that of the embedded bar.
While the standard method indicates a conventional reference electrode (either calomel or Ag/AgCl, etc.) can be introduced in the attached electrochemical cell in order to determine the potential values of the embedded bars, we propose instead to include a fixed electrode along the plane perpendicular to the location of the embedded bar. This arrangement is schematically described in Figure 2, and it can be observed for the specimen on the right in Figure 1. Thus, to measure a reference potential, the negative pole of the voltmeter is connected to the embedded steel, and the positive pole is to the electrode attached to the concrete. In this way, a measurement without fluctuations is obtained by having the constant reference of the external electrode. The two assemblies were set in parallel and with the same power supply potential in order to analyze any eventual differences arising. It was found that a voltage drop occurred after connecting the multimeter to the sample using the standard arrangement of the method. To overcome this problem, and taking into account that the values obtained at the time of connection and just before the voltage drop occurred were identical to those observed with the assembly proposed in the standard, an electrical circuit was included in the assembly, which would allow stabilization of the signal, although without affecting its value. The modification consists of introducing in the measuring clamp a control component powered by an external DC power supply, thus making it possible to measure data at any time without the drawbacks of the aforementioned instabilities.
As can be seen in Figure 2 and Figure 3, the control element is an operational model LM324 which, powered by a TDK-Lambda power supply, model LS75-12, delivers a stable reading. The time drift and characteristic ripple of the power supply were characterized using a Pintek oscilloscope, model PS-605. A 0.1 Ω resistor in series with the potential source allowed measuring the current entering each probe without the need to disconnect the circuit. According to Ohm’s law, the intensity of the current circulating through a component of known resistance can be determined if we know the potential that is established across it.
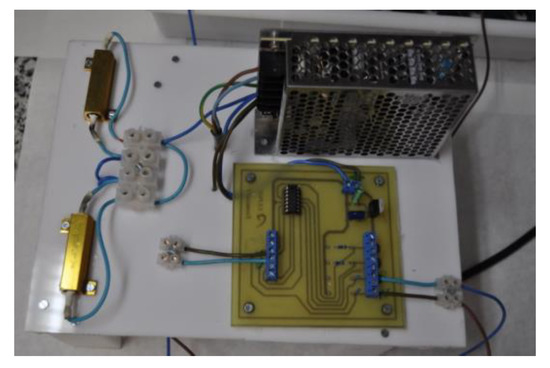
Figure 3.
Voltage source and data acquisition system.
2.4. Determination of the Durability
In order to assess the feasibility of the proposed dosages, the durability of the mixtures was determined using the carbonation and the chloride penetration models given in Annex 9 of EHE-08 [82]. Thus, the time required for carbonation at a distance d from the concrete surface was determined using the carbonation model:
where dp is the carbonation depth in mm and t is the time in years. The carbonation factor Kc was determined using:
where fcm is the compressive strength of the concrete, in N/mm2, which can be estimated from the specified characteristic strength (fck) as (). cenv is the environmental factor, cair is the air-entraining factor, and a’ and b’ are parameters which depend on the type of binder (see [82] for more details).
On the other hand, the time required for a certain chloride concentration Cth to occur at a distance d from the concrete surface is estimated according to the chloride penetration model by:
where dp is the depth in mm, and t is the time in years. The chloride penetration coefficient KCl is given by:
where α is a unit conversion factor equal to 56,157; D(t) is the chloride effective diffusion coefficient, for age t, expressed in cm2/s; Cth is the chloride concentration on the surface of the concrete, expressed in % of cement weight; Cb is the content of chloride from materials (aggregates, cement, water, etc.), when the concrete mix is prepared. The diffusion coefficient of chloride varies with the age of the concrete according to:
where D(t0) is the chloride diffusion coefficient at age t0, D(t) is the coefficient at age t, and n is the age factor. The latter can be taken as equal to 0.5 in the absence of precise values determined by tests on the concrete considered. The value of D(t0) comes from EHE-08 [82], depending on the type of cement and the w/c ratio.
In order to predict the useful life in the design phase from the calculation of the initiation and propagation models described above, the following considerations were made for the starting data of certain parameters, which were kept fixed in all cases. The considered structure was classified as a tenement, whose minimum required value of the useful life in the project (tg) is 50 years. This implies a calculated useful life (td) of 55 years according to Equation (6):
The diameter of the steel bar (generic) was taken as Ø = 12 mm. Accordingly, on the basis of the EHE-08, the covers of the steel bar (dr) would be: (1) 20 mm for an IIa environment, with cement, additions, and a characteristic resistance between 25 and 40 N/mm2; (2) 25 mm for an IIb environment, with cement, additives and characteristic resistance between 25 and 40 N/mm2; or (3) 45 mm for an IIIa environment and our type of cement and projected useful life of 50 years. Regarding the environmental coefficient, the most unfavorable condition was selected, which corresponds to an “environment protected from the rain,” adopting the value cenv = 1. The aeration coefficient takes the value cair = 1 for entrained air below 4.5%. The chloride content provided by the raw materials was set as Cb = 0. Although the critical concentration (Cth, given as a percentage by weight of cement) should be 0.6% according to EHE-08, it was 0.4% for the samples tested using the pond method. Other parameters of the tested samples that are necessary for the calculation of the models (i.e., type of concrete, environment, water/cement ratio, and amount of cement) are introduced in the following Sections as employed.
The working life due to the corrosion of reinforcements was determined by adding together the initiation period and the corrosion propagation period, that in the case of corrosion by carbonation, is given by:
In the case of corrosion by chlorides, this will be:
3. Results and Discussion
3.1. Characterization of the Components and the Concrete
Table 3 shows the particle size distribution of the tuff and quarry pozzolans used as additives in this study, whereas Figure 4 shows their particle size distributions. In addition, the XRF analysis of the PZT is given in Table 4. Next, Table 5 summarizes the most relevant characteristics of the aggregates used.
Table 3.
Particle size analysis of additives by wet sieving.
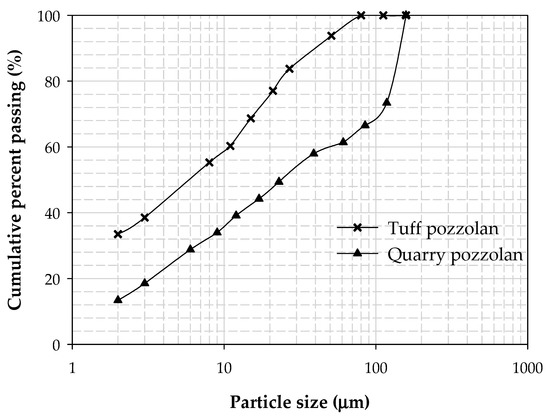
Figure 4.
Particle size distribution of the used tuff and quarry pozzolans.
Table 4.
XRF analysis of the tuff pozzolan.
Table 5.
Origin, size, and absorption coefficient of the aggregates.
Particle size distribution of the used tuff pozzolan and quarry pozzolan is shown in Figure 4. It can be seen that the tuff pozzolan had finer particles than the quarry pozzolan used in this study. The median particle size (50% passing size) of tuff pozzolan was almost 6 µm, while quarry pozzolan showed a particle size of 24 µm.
Table 6 presents the results of the flexural strength, compressive strength, and resistance activity index [58] of the additions with the reference cement. According to the test method of the UNE EN 196-1 standard [63], with a 75/25 mixture by weight, the compressive strength determined after 28 days must be equal to or greater than 75% of that corresponding to the standard cement I 42.5 R/S.
Table 6.
Flexural strength, compressive strength, and resistance activity index of the additives in the reference cement.
The reference samples, as well as the various additions, were characterized by means of the tests indicated in Section 2.3. Table 7 presents the results both from the tests carried out and from the calculation processes described in the standard that governs each of the tests.
Table 7.
Experimental results of the tests made on the concrete mixtures.
The chemical analysis carried out for PZQ, according to ASTM C618 [83], shows a SiO2 + Al2O3 + Fe2O3 composition of 70.62% (type N pozzolan). This value is greater than the 70% set by the standard. Furthermore, the SO3 value is below 3%. On the other hand, the LOI value is greater than the 12% set by the standard. This abnormal value is justified by the late geochemical alteration of the sample due to corrosion, in particular of the pumice stone in the simple. In fact, analysis of samples taken near the quarry from which the material was obtained showed LOI values below 4% [47]. Both types of pozzolans showed pozzolanic activity according to the lime pozzolanic activity index (PAI). The results of the cement mixtures with the additions of PZT and PZQ, expressed in mmol/L, are consistent with the pozzolanism test (see Figure 5). The [Ca(OH)2]/[OH−] ratios at 7 days are 6.03/60.19 for PZQ and 1.78/92.78 PZT, with values under the saturation curve.
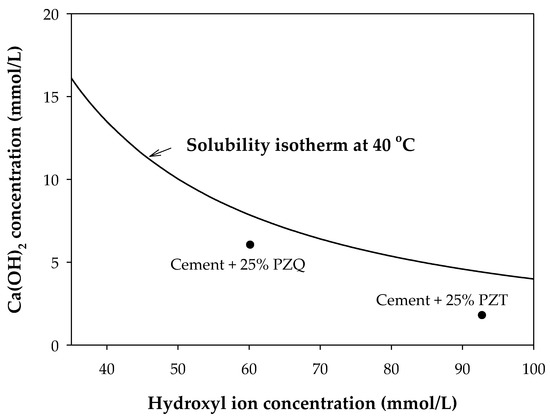
Figure 5.
Variation of the pozzolanic behavior of the samples analyzed at 7 days.
The additions of PZT and PZQ give concretes whose strengths correspond well to those required for concrete HA-25 (dosages D4) and HA-30 (dosages D3). When these are added to replace superfine aggregate, the pozzolan tuff shows increases of 22% and pozzolan quarry of 5% over the reference mix. When added as a replacement for cement, they cause a small decrease in resistance. All mixes exceed the required minimum characteristic strengths of 25 N/mm2 and 30 N/mm2, respectively. The dosages with the two pozzolans far exceed the limit of 75% of the resistant activity index with respect to the reference cement according to the UNE EN 196-1 standard. These results are in agreement with similar studies [1,47].
The additions cause a change in the consistency of the concrete, making it more fluid. Thus, according to the classification of the Abrams cone, it varies from plastic and liquid (between 3 and >16 cm) to the fluid (10 to 15 cm) and liquid (≥16 cm) range. The density values ranged between 2100 and 2500 kg/m3. In general, a decrease in the density is observed 24 h after demolding compared to fresh, followed by an increase in the density of the saturated specimens after 28 days of curing in a humid chamber, and finally, exhibits an expected decrease in the dry density, which varies between 3 and 10%. All of these increases and decreases in density are due to the increase or decrease in the amount of water in the sample.
The additions cause an appreciable change in the porosity of the samples. In the D3 dosages, with a lower water/cement ratio, the additions cause an increase in porosity that ranges from 31.23% in the case of tuff pozzolan to 18.71% in the case of quarry pozzolan. With regard to the D4 dosage, by maintaining the amount of cement and introducing the additions as superfine aggregate, the porosities were reduced in both cases by approximately 31%, thus improving the properties of the concrete. This variation in porosity complies with the results of water penetration required by EHE-08 for the durability control of concrete exposed in environments III and IV. In D3 concretes, water penetration results equal to or greater than the reference dosage are obtained, while for D4 dosages, in which the percentage of addition to the cement has not been subtracted, the results are not maintained but improved compared to the reference. The addition of pozzolan in the dosages with the highest water/cement ratio (i.e., 0.73%) effectively slows down the penetration of water.
It is also observed that the resistivity values obtained by the direct and the indirect (four-point) methods are close to 100 Ω m in all the batches. Pozzolanic additions cause a slight decrease in resistivity value when added to replace cement. However, when replacing the superfine aggregate, the tuff pozzolan causes a small increase in the resistivity values, while the quarry pozzolan causes almost no change in the measurement.
3.2. Modified Integral Method
As mentioned above, an instrumental modification was made to the integral method described in Section 2.3. From the measurement of the power supply ripple, a maximum of 15 mV AC was obtained at the 12 V DC output of the power supply. Note that, in the characteristics provided by the manufacturer, a maximum ripple of 120 mV is fixed for this model. On the other hand, we proceeded to obtain the drift over time of the source by performing two measurements at different times. The first was performed at time 0, which gave an output of 12.00 VDC. After 90 min, a second measurement was made, obtaining a value of 12.01 V on the screen, to obtain a value of 12.12 V after a month of testing.
After a month of testing had passed, the concrete specimen used in the experimental device validation experiment was broken. A colorimetric technique was used to determine the chloride penetration. By adding a solution of silver nitrate (0.1 M) and the corresponding reaction of the compound with Cl- ions, it was possible to see with the naked eye a whitish coloration when the two species came into contact. It must be noted that over time, this color turned purple until it almost disappeared 2 weeks after its development. As can be seen in Figure 6, the most unfavorable penetration of the chloride species reached a depth of 0.5 cm. Table 7 shows the values of the diffusion coefficients, as well as the time until the depassivation of the different specimens.
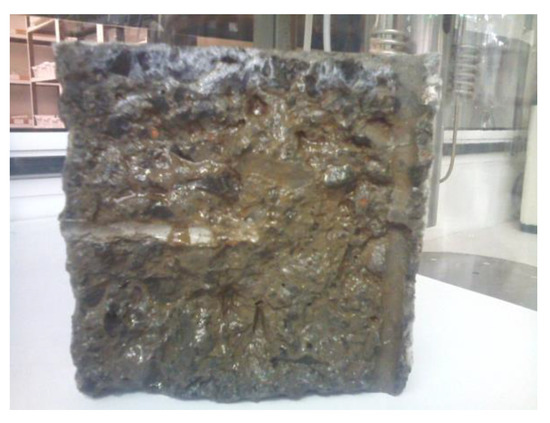
Figure 6.
Chloride penetration profile revealed. The chloride penetration front can be seen in the upper part of the broken sample.
3.3. Penetration of Aggressive Species
Regarding the natural carbonation tests, among the results obtained, dosage 1 (D1P) stands out from the rest because it was not affected by the aggressive process, unlike the rest. In the case of the evolution of the carbonation process, by adding the pozzolans to the detriment of the cement, the natural process is hardly affected, but in the case of the accelerated tests, the carbonation fronts increase by 86.20% when adding tuff pozzolan and 106.79% in the case of quarry pozzolan (cf. Table 7). However, by subtracting superfine aggregate (dosages D4), the samples with additions show penetration rate values lower than the reference (D4P) both for the natural test (namely, −23.77 for D4PZT and −10.80 for D4PZQ) and for the accelerated test (−17.13 for D4PZT, and −6.77% for D4PZQ).
When evaluating the penetration of chlorides, it is found that the non-steady state diffusion coefficients are all of the same order of magnitude, regardless of the method with which they were obtained. The multi-regime method is the one that presents the lowest values of non-stationary diffusion coefficients compared to the other two methods. The reference sample D1P is the one that exhibits the lowest value of the non-stationary diffusivity coefficient. It is found that the additions of pozzolans to the detriment of the superfine aggregate lead to an improvement in the behavior of the dosages with respect to the penetration of chloride ions. When introduced in the part of cement, the dosages improve compared to the reference when analyzed with the multi-regime method but not when analyzed by the pond method, where mixtures containing quarry pozzolan show an increase in 9% in chloride penetration compared to the reference dosage, and of 5.5% in the case of tuff pozzolan. The chloride profiles follow a linear trend when calculated as a percentage of the sample weight with respect to the depth of penetration (mm), with regression indices R2 ranging from 0.891 (in the case of D2P) to 0.994 (for D4PZT).
According to the multi-regime method, mixes dosed with tuff pozzolan and quarry pozzolan have lower diffusion coefficients than their respective reference mixtures, whether they are introduced as either a cement or a superfine aggregate substitute. The greatest decreases in the coefficients were presented by the mixtures containing PZT, between 33 and 50%, and those containing PZQ, between 18 and 48%. These results coincide with those observed by other authors [17,84,85,86,87,88].
Finally, the modified integral method gives values similar to those obtained by the multi-regime method, with the advantage that this method provides information on the depassivation time of the reinforcement. A comparison with the reference dosages cannot be made as these have not been tested.
3.4. Estimation of Durability
Unfortunately, not all existing cement, according to RC-08 [89], are listed in the Durability Annex of the EHE-08 for the carbonation model. This was the case with the cement II/A-P/45.5 R/MR used in the tested samples. For this reason, this cement had to be considered in the model as Portland cement binder or Portland cement + 28% fly ash. On the other hand, an experimental comparison was made to observe the difference between using fck + 8 as the characteristic strength or, alternatively, the average compressive strength of cement, fcm. Table 8 shows the results with the raw data provided by the EHE-08, whereas Table 9 shows the results obtained from the tests carried out. For the resistance data variable, the average compressive strength fcm of each set was taken, and three options were considered to catalog the type of binder, namely, Portland Cement, Portland Cement + 28% fly ash, and Portland Cement + 9% silica fume.
Table 8.
Application of the carbonation model for the general calculation method for the useful life. Carbonation model according to EHE-08 data.
Table 9.
Application of the carbonation model for the general calculation method of the useful life. These values were obtained for each type of conglomerate using data extracted from the batches, and the average resistance of the concretes (fcm).
To estimate the durability by applying the chloride penetration model (Equations (3) and (4)) and the data provided by EHE-08, the diffusion coefficient, the surface, and the critical chloride concentrations were introduced, together with the chloride penetration data obtained by means of the pond method. Table 10 shows the results obtained with the data provided by the EHE-08 when considering D(t0) for a CEM II/A-V cement according to its water/cement ratio. Therefore, the value of D(t) is determined for t = 50 years (Equation (5)), while t0 is taken at 28 days (i.e., 0.0767 years). For the calculation of KCL, the parameter Cth by weight of cement is 0.6%, whereas the concentration of chlorides on the surface in weight of cement, Cs, was taken in all cases as the value corresponding to an IIIa environment (up to 500 m from the sea the shore) of 0.14%, although in reality only the reference sample D1 was manufactured for the IIIa environment. The lifetime values (tL) thus determined were of the same order as those obtained using the carbonation model. All three dosages were found to be well above the design value (td) set at 55 years, confirming that the reference doses are adequate for use in real-world applications. It also predicts that dose D3 (HA-30/F/20/IIb) is the most durable according to the model, followed by D1 (HA-35/P/20/IIIa), although it should be noted that the Vcorr of the latter is always higher due to the assumption of operation in an IIIa environment.
Table 10.
Application of the chloride penetration model for the general calculation method of the useful life according to data included in the EHE-08.
Table 11 presents the data for the calculation of the useful life of all the mixed samples, with the data provided by the EHE-08 and the value of D(t0) taken from each of the samples tested for chloride penetration from the pond method. For the derivation of D(t), t was set as 50 years, and t0 as 90 days (0.2466 years); and for the calculation of the chloride penetration coefficient (KCL), the critical concentration (Cth) by weight of cement was 0.4%, and the concentration of chlorides at the surface by the weight of cement (Cs) corresponded to that of each sample.
Table 11.
Application of the chloride penetration model for the general calculation method of the useful life using data obtained from the pond immersion test.
By applying the durability model for corrosion processes considering carbonation as the relevant process determining the initiation period and using the data provided in the EHE-08, it is observed that the results greatly exceed the design value (td) established in 55 years (cf. Table 8). The three dosage types are suitable for use in fulfilling the conditions of the proposed construction element, being the dosage D3 (HA-30/20/F/IIb), the most durable according to the model, followed by D1 (HA-35/20/P /IIIa). This fact has been observed by other authors [13,33,35].
When introducing the test results of the dosages in the carbonation model (see Table 9), it is observed that the additions of tuff and quarry pozzolans cause an increase in the useful lifetime (tL) which greatly exceeds the design value (td), of 55 years, as well as the value obtained for the reference mixes. Regarding the approach of cataloging the binder in the different batches, it seems that the choice of Portland cement +28% ash in the modeling is the most conservative, although it gives higher values than those of the useful life calculation.
When applying the chloride penetration model for the estimation of durability, the estimated useful life (tL) values for the reference batches greatly exceed the design value (td) set in 55 years, which confirms that the reference dosages are suitable for the use and conditions of the proposed building element. Here again, dosage D3 (HA-30/F/20/IIb) appears to be the most durable according to the model, followed by D1 (HA-35/P/20/IIIa), although it should be clarified that the Vcorr of the latter is always superior due to the premise of being an IIIa environment.
During the introduction of the pozzolanic additions, we observe that for the case of the D1P sample, the results obtained in the prediction from the experimental data largely exceed the estimate made by the EHE-08, while the additions decrease the service life considerably, although all exceed the design value of the useful life (i.e., td = 55 years).
4. Conclusions
All laboratory concrete mixes, both reference and added with tuff or quarry pozzolans, whether used as a substitute for cement or for the superfine aggregate in a percentage of 20%, exceed the minimum characteristic resistance and the durability values required by EHE-08 on the basis of the carbonation and chloride penetration models. Both types of pozzolans showed pozzolanic activity according to the lime pozzolanic activity index (PAI) with [Ca(OH)2]/[OH−] ratios at 7 days are 6.03/60.19 for PZQ, and 1.78/92.78 for PZT.
In general, when replacing the cement, the additions cause an increase in porosity, a decrease in resistivity, and an increase in the depth of the carbonation front, while when replacing the superfine aggregates, they cause a decrease in porosity and a decrease in the carbonation front. The added mixes change their consistency with respect to the reference, so the introduction of the pozzolans influences the consistency of the mixes, making them more fluid.
The non-stationary diffusion coefficients obtained by the three methods are of the same order of magnitude, the highest values being those obtained by the pond method, followed by the integral method, and finally by the multi-regime method. In the pond immersion test, when the pozzolans replaced the cement, an increase in the penetration of chlorides compared to the reference dosage was observed. In the rest of the cases, a lesser diffusion of chlorides was observed when pozzolans replaced cement or superfine aggregates. There were decreases between 33 and 50% for the diffusion coefficients in the cementitious mixtures containing PZT, while those containing PZQ showed a more moderate decrease which varied between 18 and 48%.
Author Contributions
Conceptualization, J.J.S.; investigation, N.R.-B., C.B.-P. and V.F.M.; data curation, J.J.S. and N.R.-B.; methodology, J.J.S. and R.M.S.; supervision, J.J.S. and R.M.S.; writing—original draft preparation, J.J.S. and R.M.S.; writing—review and editing, J.J.S. and R.M.S.; visualization, J.J.S. and R.M.S.; funding acquisition, R.M.S. All authors have read and agreed to the published version of the manuscript.
Funding
The work was supported by the University of La Laguna and the Spanish Ministry of Science, Innovation, and Universities (Madrid, Spain) under contract No. 2022/0000586.
Institutional Review Board Statement
Not applicable.
Informed Consent Statement
Not applicable.
Data Availability Statement
The raw/processed data required to reproduce these findings cannot be shared at this time as the data also forms part of an ongoing study.
Conflicts of Interest
The authors declare no conflict of interest.
References
- Najimi, M.; Jamshidi, M.; Pourkhorshidi, A. Durability of concretes containing natural pozzolan. Proc. Inst. Civ. Eng. Constr. Mater. 2008, 161, 113–118. [Google Scholar] [CrossRef]
- Concrete needs to lose its colossal carbon footprint. Nature 2021, 597, 593–594. [CrossRef] [PubMed]
- Miller, S.A.; Horvath, A.; Monteiro, P.J.M. Readily implementable techniques can cut annual CO2 emissions from the production of concrete by over 20%. Environ. Res. Lett. 2016, 11, 074029. [Google Scholar] [CrossRef]
- Fan, C.; Miller, S.A. Reducing greenhouse gas emissions for prescribed concrete compressive strength. Constr. Build. Mater. 2018, 167, 918–928. [Google Scholar] [CrossRef]
- Tayeh, B.A.; Hamada, H.M.; Almeshal, I.; Bakar, B.H.A. Durability and mechanical properties of cement concrete comprising pozzolanic materials with alkali-activated binder: A comprehensive review. Case Stud. Constr. Mater. 2022, 17, e01429. [Google Scholar] [CrossRef]
- Abiodun, Y.O.; Olanrewaju, O.A.; Gbenebor, O.P.; Ochulor, E.F.; Obasa, D.V.; Adeosun, S.O. Cutting cement industry CO2 emissions through metakaolin use in construction. Atmosphere 2022, 13, 1494. [Google Scholar] [CrossRef]
- Amran, M.; Makul, N.; Fediuk, R.; Lee, Y.H.; Vatin, N.I.; Lee, Y.Y.; Mohammed, K. Global carbon recoverability experiences from the cement industry. Case Stud. Constr. Mater. 2022, 17, e01439. [Google Scholar] [CrossRef]
- Andrew, R.M. Global CO2 Emissions from cement production, 1928–2018. Earth Syst. Sci. Data 2019, 11, 1675–1710. [Google Scholar] [CrossRef]
- Qaidi, S.; Najm, H.M.; Abed, S.M.; Ahmed, H.U.; Al Dughaishi, H.; Al Lawati, J.; Sabri, M.M.; Alkhatib, F.; Milad, A. Fly ash-based geopolymer composites: A review of the compressive strength and microstructure analysis. Materials 2022, 15, 7098. [Google Scholar] [CrossRef] [PubMed]
- Ababneh, A.; Matalkah, F. Potential use of jordanian volcanic tuffs as supplementary cementitious materials. Case Stud. Constr. Mater. 2018, 8, 193–202. [Google Scholar] [CrossRef]
- Costafreda, J.L.; Martín, D.A.; Presa, L.; Parra, J.L. Altered volcanic tuffs from Los Frailes Caldera. A study of their pozzolanic properties. Molecules 2021, 26, 5348. [Google Scholar] [CrossRef]
- Rakhimov, R.Z.; Rakhimova, N.R.; Gaifullin, A.R.; Morozov, V.P. Properties of portland cement pastes enriched with addition of calcined marl. J. Build. Eng. 2017, 11, 30–36. [Google Scholar] [CrossRef]
- Sobol, K.; Markiv, T.; Terlyha, V.; Franus, W. Peculiarities of hydration processes of cements containing natural zeolite. Bud. Archit. 2015, 14, 105–113. [Google Scholar] [CrossRef]
- Xia, J.; Guan, Q.; Zhou, Y.; Wang, J.; Gao, C.; He, Y.; Wang, Z.; Song, P. Use of natural pozzolans in high-performance concrete for the Mombasa–Nairobi railway. Adv. Cem. Res. 2021, 33, 318–330. [Google Scholar] [CrossRef]
- Papadakis, V.G.; Tsimas, S. Supplementary cementing materials in concrete. Part I: Efficiency and design. Cem. Concr. Res. 2002, 32, 1525–1532. [Google Scholar] [CrossRef]
- Wasim, M.; Abadel, A.; Abu Bakar, B.H.; Alshaikh, I.M.H. Future directions for the application of zero carbon concrete in civil engineering—A review. Case Stud. Constr. Mater. 2022, 17, e01318. [Google Scholar] [CrossRef]
- Fazilati, M.; Mohammadi Golafshani, E. Durability properties of concrete containing amorphous silicate tuff as a type of natural cementitious material. Constr. Build. Mater. 2020, 230, 117087. [Google Scholar] [CrossRef]
- Khan, K.; Amin, M.N. Influence of fineness of volcanic ash and its blends with quarry dust and slag on compressive strength of mortar under different curing temperatures. Constr. Build. Mater. 2017, 154, 514–528. [Google Scholar] [CrossRef]
- Khan, K.; Amin, M.N.; Saleem, M.U.; Qureshi, H.J.; Al-Faiad, M.A.; Qadir, M.G. Effect of fineness of basaltic volcanic ash on pozzolanic reactivity, ASR expansion and drying shrinkage of blended cement mortars. Materials 2019, 12, 2603. [Google Scholar] [CrossRef] [PubMed]
- Khan, K.; Amin, M.N.; Usman, M.; Imran, M.; Al-Faiad, M.A.; Shalabi, F.I. Effect of fineness and heat treatment on the pozzolanic activity of natural volcanic ash for its utilization as supplementary cementitious materials. Crystals 2022, 12, 302. [Google Scholar] [CrossRef]
- Kushnir, A.R.L.; Heap, M.J.; Griffiths, L.; Wadsworth, F.B.; Langella, A.; Baud, P.; Reuschlé, T.; Kendrick, J.E.; Utley, J.E.P. The fire resistance of high-strength concrete containing natural zeolites. Cem. Concr. Compos. 2021, 116, 103897. [Google Scholar] [CrossRef]
- Robayo-Salazar, R.A.; de Gutiérrez, M.; Puertas, F. Study of synergy between a natural volcanic pozzolan and a granulated blast furnace slag in the production of geopolymeric pastes and mortars. Constr. Build. Mater. 2017, 157, 151–160. [Google Scholar] [CrossRef]
- Takahashi, T.; Shoji, S. Distribution and classification of volcanic ash soils. Glob. Environ. Res. 2002, 6, 83–97. [Google Scholar]
- Lemougna, P.N.; MacKenzie, K.J.D.; Melo, U.F.C. Synthesis and thermal properties of inorganic polymers (geopolymers) for structural and refractory applications from volcanic ash. Ceram. Int. 2011, 37, 3011–3018. [Google Scholar] [CrossRef]
- Kouamo Tchakoute, H.; Elimbi, A.; Diffo Kenne, B.B.; Mbey, J.A.; Njopwouo, D. Synthesis of geopolymers from volcanic ash via the alkaline fusion method: Effect of Al2O3/Na2O molar ratio of soda–volcanic ash. Ceram. Int. 2013, 39, 269–276. [Google Scholar] [CrossRef]
- Mertens, G.; Snellings, R.; Van Balen, K.; Bicer-Simsir, B.; Verlooy, P.; Elsen, J. Pozzolanic reactions of common natural zeolites with lime and parameters affecting their reactivity. Cem. Concr. Res. 2009, 39, 233–240. [Google Scholar] [CrossRef]
- Kitsopoulos, K.P.; Dunham, A.C. Heulandite and mordenite-rich tuffs from Greece: A potential source for pozzolanic materials. Miner. Depos. 1996, 31, 576–583. [Google Scholar] [CrossRef]
- Martínez-Ramírez, S.; Blanco-Varela, M.T.; Ereña, I.; Gener, M. Pozzolanic reactivity of zeolitic rocks from two different Cuban Deposits: Characterization of reaction products. Appl. Clay Sci. 2006, 32, 40–52. [Google Scholar] [CrossRef]
- Fragoulis, D.; Chaniotakis, E.; Stamatakis, M.G. Zeolitic tuffs of Kimolos Island, Aegean Sea, Greece and their industrial potential. Cem. Concr. Res. 1997, 27, 889–905. [Google Scholar] [CrossRef]
- Varela, M.T.B.; Ramírez, S.M.; Ereña, I.; Gener, M.; Carmona, P. Characterization and pozzolanicity of zeolitic rocks from two Cuban deposits. Appl. Clay Sci. 2006, 33, 149–159. [Google Scholar]
- Liebig, E.; Althaus, E. Pozzolanic activity of volcanic tuff and Suevite: Effects of calcination. Cem. Concr. Res. 1998, 28, 567–575. [Google Scholar] [CrossRef]
- Zhang, M.H.; Malhotra, V.M. Characteristics of a thermally activated alumino-silicate pozzolanic material and its use in concrete. Cem. Concr. Res. 1995, 25, 1713–1725. [Google Scholar] [CrossRef]
- Çavdar, A.; Yetgin, Ş. Availability of tuffs from Northeast of Turkey as natural pozzolan on cement, some chemical and mechanical relationships. Constr. Build. Mater. 2007, 21, 2066–2071. [Google Scholar] [CrossRef]
- Hunyak, O.; Sobol, K.; Markiv, T.; Bidos, V. The effect of natural pozzolans on properties of vibropressed interlocking concrete blocks in different curing conditions. Prod. Eng. Arch. 2019, 22, 3–6. [Google Scholar] [CrossRef]
- Markiv, T.; Sobol, K.; Franus, M.; Franus, W. Mechanical and durability properties of concretes incorporating natural zeolite. Arch. Civ. Mech. Eng. 2016, 16, 554–562. [Google Scholar] [CrossRef]
- Dedeloudis, C.; Zervaki, M.; Sideris, K.; Juenger, M.; Alderete, N.; Kamali-Bernard, S.; Villagrán, Y.; Snellings, R. Natural pozzolans. RILEM State-Art Rep. 2018, 25, 181–231. [Google Scholar]
- Rojas, M.F.; Cabrera, J. The Effect of temperature on the hydration rate and stability of the hydration phases of Metakaolin–Lime–Water systems. Cem. Concr. Res. 2002, 32, 133–138. [Google Scholar] [CrossRef]
- Shi, C. Pozzolanic reaction and microstructure of chemical activated lime-fly ash pastes. ACI Mater. J. 1998, 95, 537–545. [Google Scholar]
- Janotka, I.; Krajči, L. Utilization of natural zeolite in Portland cement of increased sulphate resistance. ACI Spec. Publ. 2003, 221, 223–229. [Google Scholar]
- Ahmadi, B.; Shekarchi, M. Use of natural zeolite as a supplementary cementitious material. Cem. Concr. Compos. 2010, 32, 134–141. [Google Scholar] [CrossRef]
- Mostafa, N.Y.; El-Hemaly, S.A.S.; Al-Wakeel, E.I.; El-Korashy, S.A.; Brown, P.W. Characterization and evaluation of the pozzolanic activity of Egyptian industrial by-products: I: Silica fume and dealuminated Kaolin. Cem. Concr. Res. 2001, 31, 467–474. [Google Scholar] [CrossRef]
- Çullu, M.; Bolat, H.; Vural, A.; Tuncer, E. Investigation of pozzolanic activity of volcanic rocks from the Northeast of the Black Sea. Sci. Eng. Compos. Mater. 2016, 23, 315–323. [Google Scholar] [CrossRef]
- Turanli, L.; Uzal, B.; Bektas, F. Effect of large amounts of natural pozzolan addition on properties of blended cements. Cem. Concr. Res. 2005, 35, 1106–1111. [Google Scholar] [CrossRef]
- Hu, J.Y.; Zhang, S.S.; Chen, E.; Li, W.G. A review on corrosion detection and protection of existing reinforced concrete (RC) structures. Constr. Build. Mater. 2022, 325, 126718. [Google Scholar] [CrossRef]
- Bouteiller, V.; Tissier, Y.; Marie-Victoire, E.; Chaussadent, T.; Joiret, S. The application of electrochemical chloride extraction to reinforced concrete—A review. Constr. Build. Mater. 2022, 351, 128931. [Google Scholar] [CrossRef]
- Syll, A.S.; Kanakubo, T. Impact of corrosion on the bond strength between concrete and rebar: A systematic review. Materials 2022, 15, 7016. [Google Scholar] [CrossRef]
- Boschmann Käthler, C.; Poulsen, S.L.; Sørensen, H.E.; Angst, U.M. Investigations of accelerated methods for determination of chloride threshold for reinforcement corrosion in concrete. Sustain. Resilient Infrastruct. 2021, 6, 1–12. [Google Scholar] [CrossRef]
- Kaid, N.; Cyr, M.; Julien, S.; Khelafi, H. Durability of Concrete containing a natural pozzolan as defined by a performance-based approach. Constr. Build. Mater. 2009, 23, 3457–3467. [Google Scholar] [CrossRef]
- Fajardo, G.; Valdez, P.; Pacheco, J. Corrosion of steel rebar embedded in natural pozzolan based mortars exposed to chlorides. Constr. Build. Mater. 2009, 23, 768–774. [Google Scholar] [CrossRef]
- Andrade, C.; Arriaga, L.Q. Cursos Avanzados Eduardo Torroja: Durabilidad, Rehabilitación y Sostenibilidad; Instituto de Ciencias de la Construcción Ediuardo Torroja: Madrid, Spain, 2014. [Google Scholar]
- Valenta, O. General analysis of the methods of testing the durability of concrete. Mater. Struct. 1970, 3, 333–345. [Google Scholar]
- Fagerlund, G. Prediction of the Service Life of Concrete Exposed to Frost Action; Swedish Cement and Concrete Research Institute: Stockholm, Sweden, 1979. [Google Scholar]
- Tuutti, K. Corrosion of Steel in Concrete; Swedish Cement and Concrete Research Institute: Stockholm, Sweden, 1982. [Google Scholar]
- Real Decreto 1247/2008, de 18 de Julio, por el que se aprueba la instrucción de hormigón estructural (EHE-08). 2008. Available online: https://www.boe.es/eli/es/rd/2008/07/18/1247 (accessed on 10 November 2022).
- Hernández Gutiérrez, L.E. Caracterización Geomecánica de las Rocas Volcánicas de las Islas Canarias; Universidad de La Laguna: La Laguna, Spain, 2014. [Google Scholar]
- Cánovas, M.F. Hormigón; Servicio de Publicaciones Colegio de Ingenieros de Caminos, Canales y Puertos: Madrid, Spain, 2002. [Google Scholar]
- C311/C311M−13; Standard Test Methods for Sampling and testing Fly Ash or natural Pozzolans for Use in Portland-Cement Concrete. ASTM International: West Conshohocken, PA, USA, 2013.
- UNE 80303-2:2011; Cements with Additional Characteristics. Part 2: Sea water Resisting Cements. AENOR, Asociación Española de Normalización y Certificación: Madrid, Spain, 2011.
- UNE-EN 196-5; Methods of Testing Cement—Part 5: Pozzolanicity Test for Pozzolanic Cement. AENOR, Asociación Española de Normalización y Certificación: Madrid, Spain, 2011.
- UNE-EN 12390-1; Testing Hardened Concrete—Part 1: Shape, Dimensions and other Requirements for Specimens and Moulds. AENOR, Asociación Española de Normalización y Certificación: Madrid, Spain, 2001.
- UNE-EN 12390-2; Testing Hardened Concrete—Part 2: Making and curing Specimens for strength Test. AENOR, Asociación Española de Normalización y Certificación: Madrid, Spain, 2009.
- UNE-EN 12390-3; Testing Hardened Concrete—Part 3: Compressive Strength of Test Specimens. AENOR, Asociación Española de Normalización y Certificación: Madrid, Spain, 2009.
- UNE-EN 196-1:2005; Methods of Testing Cement—Part 1: Determination of Strength. AENOR, Asociación Española de Normalización y Certificación: Madrid, Spain, 2005.
- UNE-EN 12350-2; Testing Fresh Concrete—Part 2: Slump Test. AENOR, Asociación Española de Normalización y Certificación: Madrid, Spain, 2009.
- UNE-EN 12390-7; Testing Hardened Concrete—Part 7: Density of Hardened Concrete. AENOR, Asociación Española de Normalización y Certificación: Madrid, Spain, 2009.
- UNE 83988-1; Concrete Durability. Test Methods. Determination of the Electrical Resistivity. Part 1: Direct Test (Reference Method). AENOR, Asociación Española de Normalización y Certificación: Madrid, Spain, 2008.
- UNE 83988-2:2008; Concrete durability. Test methods. Determination of the Electrical Resistivity. Part 2: Four Points or Wenner Method. AENOR, Asociación Española de Normalización y Certificación: Madrid, Spain, 2008.
- UNE 83309:1990 EX; Concrete Tests. Determination of the Depth of Penetration of Water under Pressure. AENOR, Asociación Española de Normalización y Certificación: Madrid, Spain, 1990.
- UNE-EN 12390-8:2001; Testing Hardened Concrete—Part 8: Depth of Penetration of Water under Pressure. AENOR, Asociación Española de Normalización y Certificación: Madrid, Spain, 2001.
- UNE-EN 1936; Natural Stone Test Methods—Determination of Real Density and Apparent Density, and of Total and Open Porosity. AENOR, Asociación Española de Normalización y Certificación: Madrid, Spain, 2007.
- UNE 83980:2014; Concrete Durability. Test Methods. Determination of the Water Absorption, Density and Accessible Porosity for Water in Concrete. AENOR, Asociación Española de Normalización y Certificación: Madrid, Spain, 2014.
- UNE 112011:1994; Assembly Corrosion. Determination of the Carbonatation Depth for in Service Concrete. AENOR, Asociación Española de Normalización y Certificación: Madrid, Spain, 1994.
- UNE 112011:2011; Corrosion of Concrete Reinforcement Steel. Determination of the carbonatation Depth for In-Service Concrete. AENOR, Asociación Española de Normalización y Certificación: Madrid, Spain, 2011.
- UNE 83993-1:2013; Durability of Concrete. Test Method. Measurement of Carbonation Penetration Rate in Hardened Concrete. Part 1: Natural Method. AENOR, Asociación Española de Normalización y Certificación: Madrid, Spain, 2013.
- UNE 83993-2:2013; Durability of Concrete. Test Method. Measurement of Carbonation Penetration Rate in Hardened Concrete. Part 2: Accelerated Method. AENOR, Asociación Española de Normalización y Certificación: Madrid, Spain, 2013.
- PrNE 83986:2009; Ensayo de Durabilidad del Hormigón. Determinación de la Difusión de Iones Cloruro. AENOR, Asociación Española de Normalización y Certificación: Madrid, Spain, 2009.
- CEN/TS 12390-11:2010; Testing Hardened Concrete—Part 11: Determination of the Chloride Resistance of Concrete, Unidirectional Diffusion. ITeh Inc.: Wien, Austria, 2010.
- UNE-EN 14629:2007; Products And Systems For The Protection And Repair Of concrete structures—Test methods—Determination of Chloride Content in Hardened Concrete. AENOR, Asociación Española de Normalización y Certificación: Madrid, Spain, 2007.
- UNE 83987:2014; Concrete Durability. Test Methods. Measurement of Chloride Diffusion Coefficient in Hardened Concrete. Multiregime Method. AENOR, Asociación Española de Normalización y Certificación: Madrid, Spain, 2014.
- UNE 83992-2:2012 EX; Durability of Concrete. Test Methods. Chloride Penetration Tests on Concrete. Part 2: Integral Accelerated Method. AENOR, Asociación Española de Normalización y Certificación: Madrid, Spain, 2012.
- UNE 112072:2011; Laboratory measurement of Corrosion Speed Using the Polarization Resistance Technique. AENOR, Asociación Española de Normalización y Certificación: Madrid, Spain, 2011.
- Annex 9—Additional Considerations on Durability According to the EHE-08. Available online: https://www.mitma.gob.es/recursos_mfom/annex_9.pdf (accessed on 10 November 2022).
- ASTM C618-22; Standard Specification for Coal Fly Ash and Raw or Calcined Natural Pozzolan for Use in Concrete. ASTM International: West Conshohocken, PA, USA, 2022.
- Limbachiya, M.; Meddah, M.S.; Ouchagour, Y. Use of recycled concrete aggregate in fly-ash concrete. Constr. Build. Mater. 2012, 27, 439–449. [Google Scholar] [CrossRef]
- Kim, Y.; Hanif, A.; Kazmi, S.M.S.; Munir, M.J.; Park, C. Properties enhancement of recycled aggregate concrete through pretreatment of coarse aggregates—Comparative assessment of assorted techniques. J. Clean. Prod. 2018, 191, 339–349. [Google Scholar] [CrossRef]
- Kim, T.; Davis, J.M.; Ley, M.T.; Kang, S.; Amrollahi, P. Fly ash particle characterization for predicting concrete compressive strength. Constr. Build. Mater. 2018, 165, 560–571. [Google Scholar] [CrossRef]
- Lee, H.; Hanif, A.; Usman, M.; Sim, J.; Oh, H. Performance evaluation of concrete incorporating glass powder and glass sludge wastes as supplementary cementing material. J. Clean. Prod. 2018, 170, 683–693. [Google Scholar] [CrossRef]
- Zhang, R.; Panesar, D.K. Mechanical properties and rapid chloride permeability of carbonated concrete containing reactive MgO. Constr. Build. Mater. 2018, 172, 77–85. [Google Scholar] [CrossRef]
- Real Decreto 956/2008; Instrucción para la Recepción de Cementos RC-08. Government of Spain: Madrid, Spain, 2008.


Publisher’s Note: MDPI stays neutral with regard to jurisdictional claims in published maps and institutional affiliations. |
© 2022 by the authors. Licensee MDPI, Basel, Switzerland. This article is an open access article distributed under the terms and conditions of the Creative Commons Attribution (CC BY) license (https://creativecommons.org/licenses/by/4.0/).