
Research of Dynamic Tensile Properties of Five Rocks under Three Loading Modes Based on SHPB Device


Abstract
:1. Introduction
2. Experimental Procedure
2.1. Specimen Preparation
2.2. Experimental Setup and Testing Method
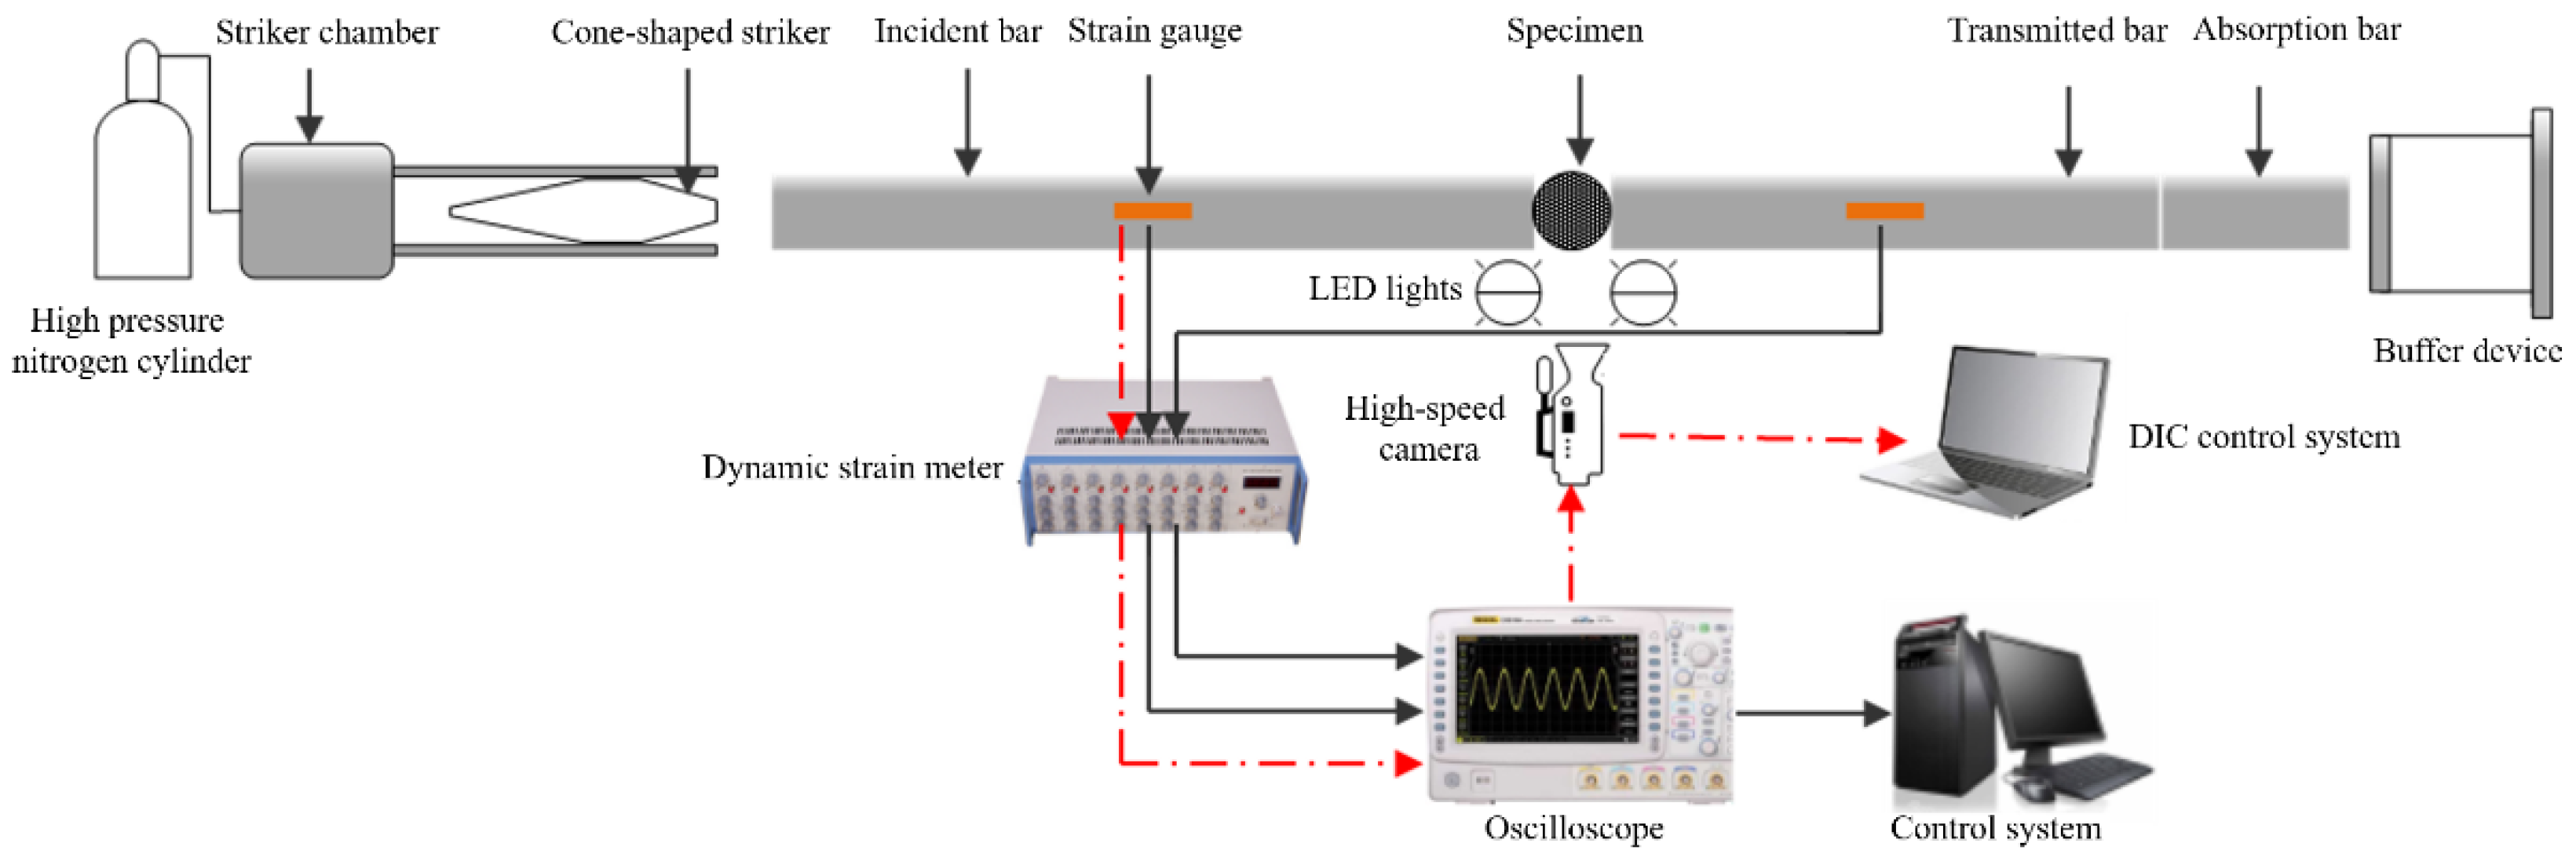
2.2.1. SHPB System
2.2.2. Loading Mode
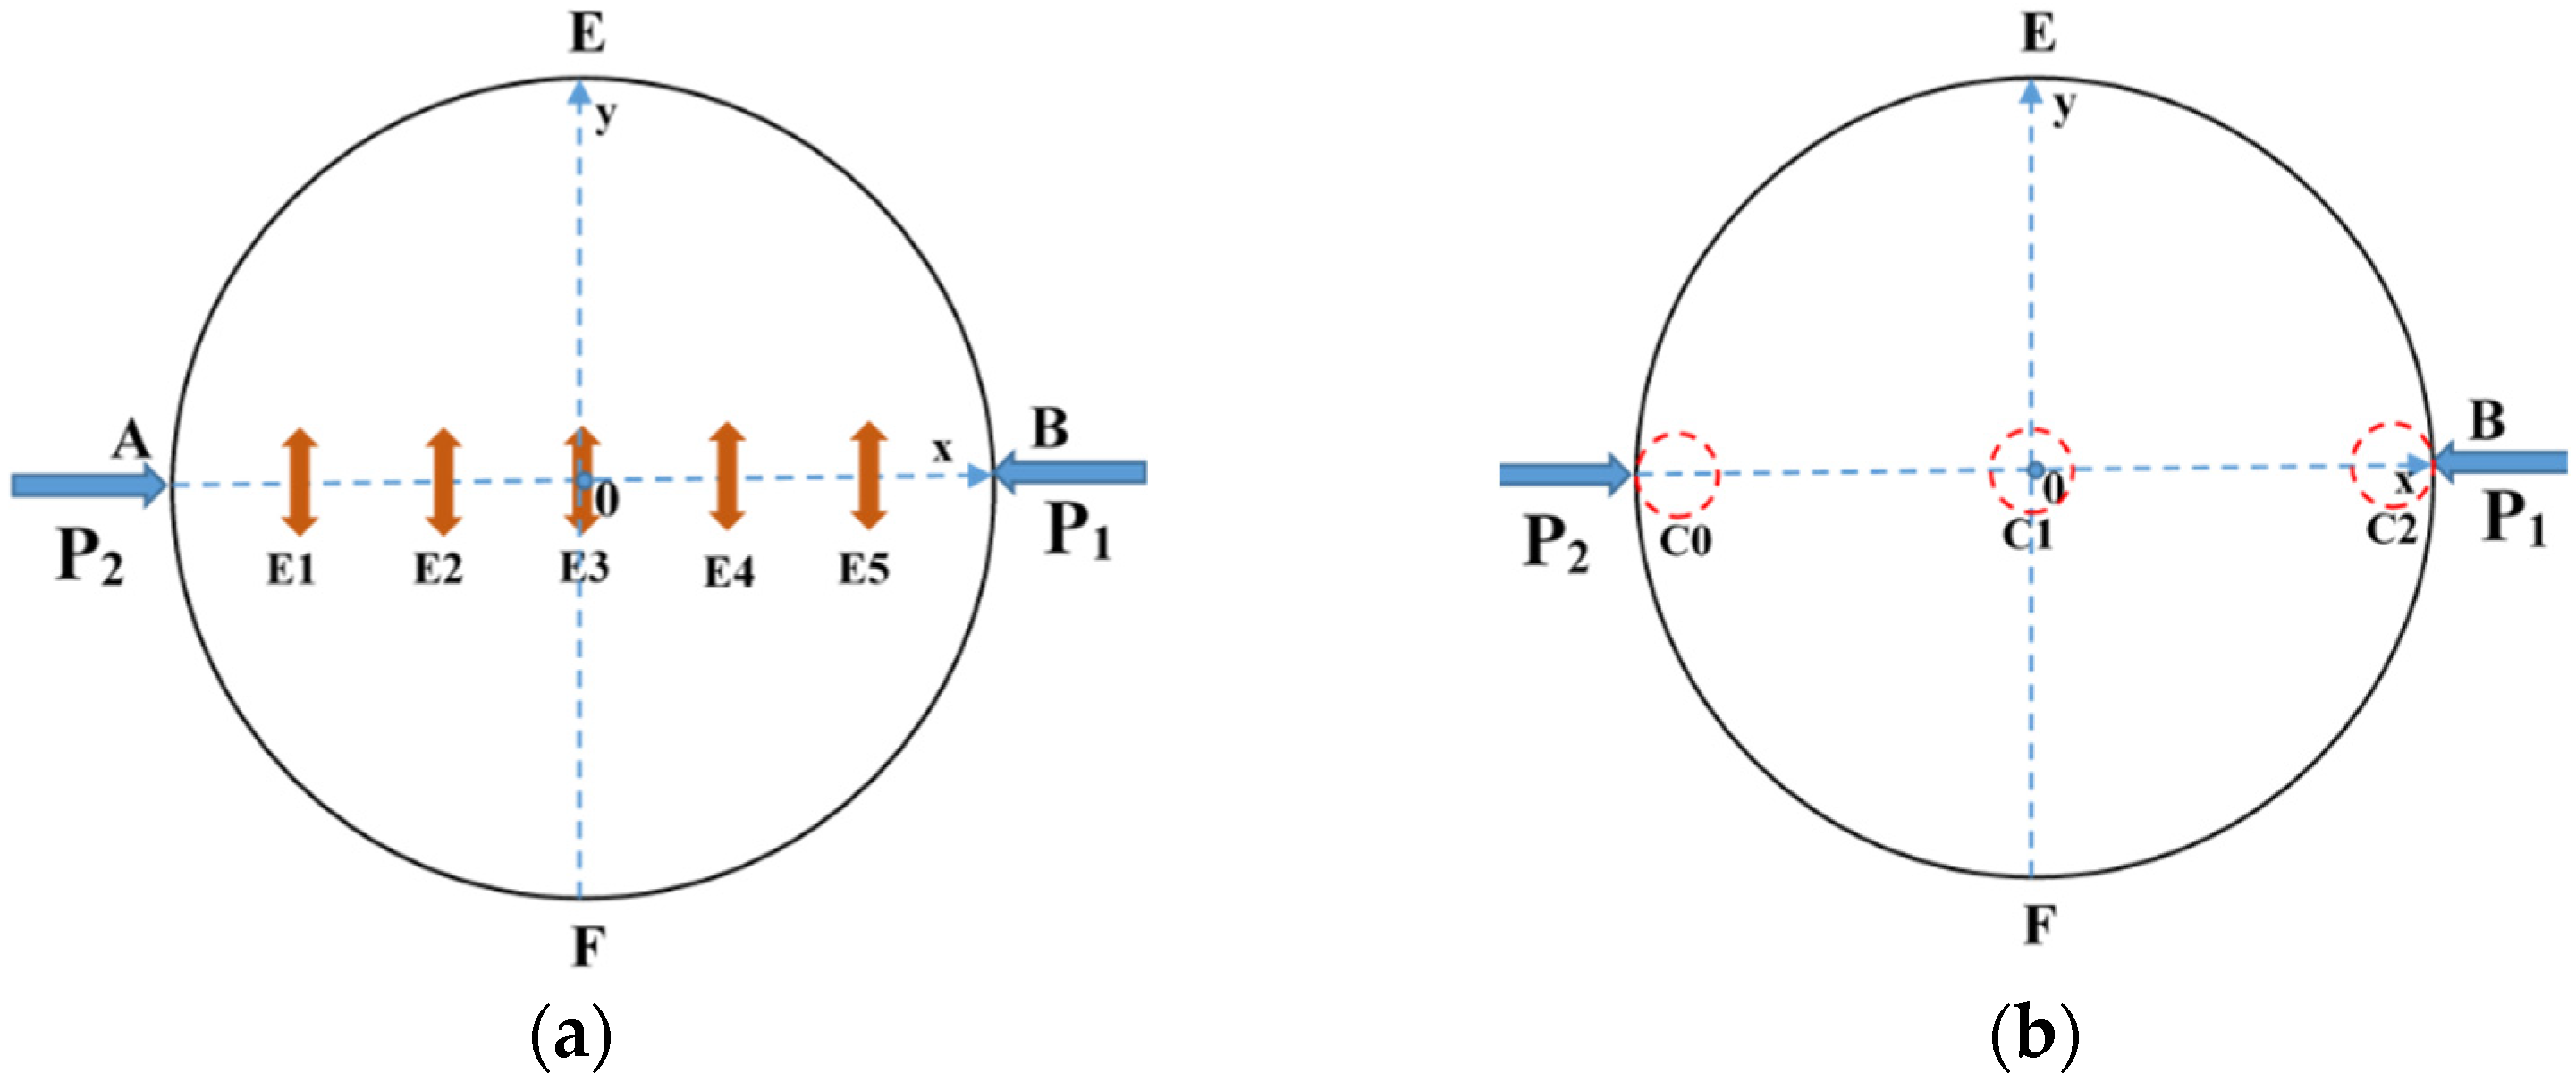
2.2.3. High-Speed Camera and Digital Image Correlation System
3. Experimental Results and Discussion
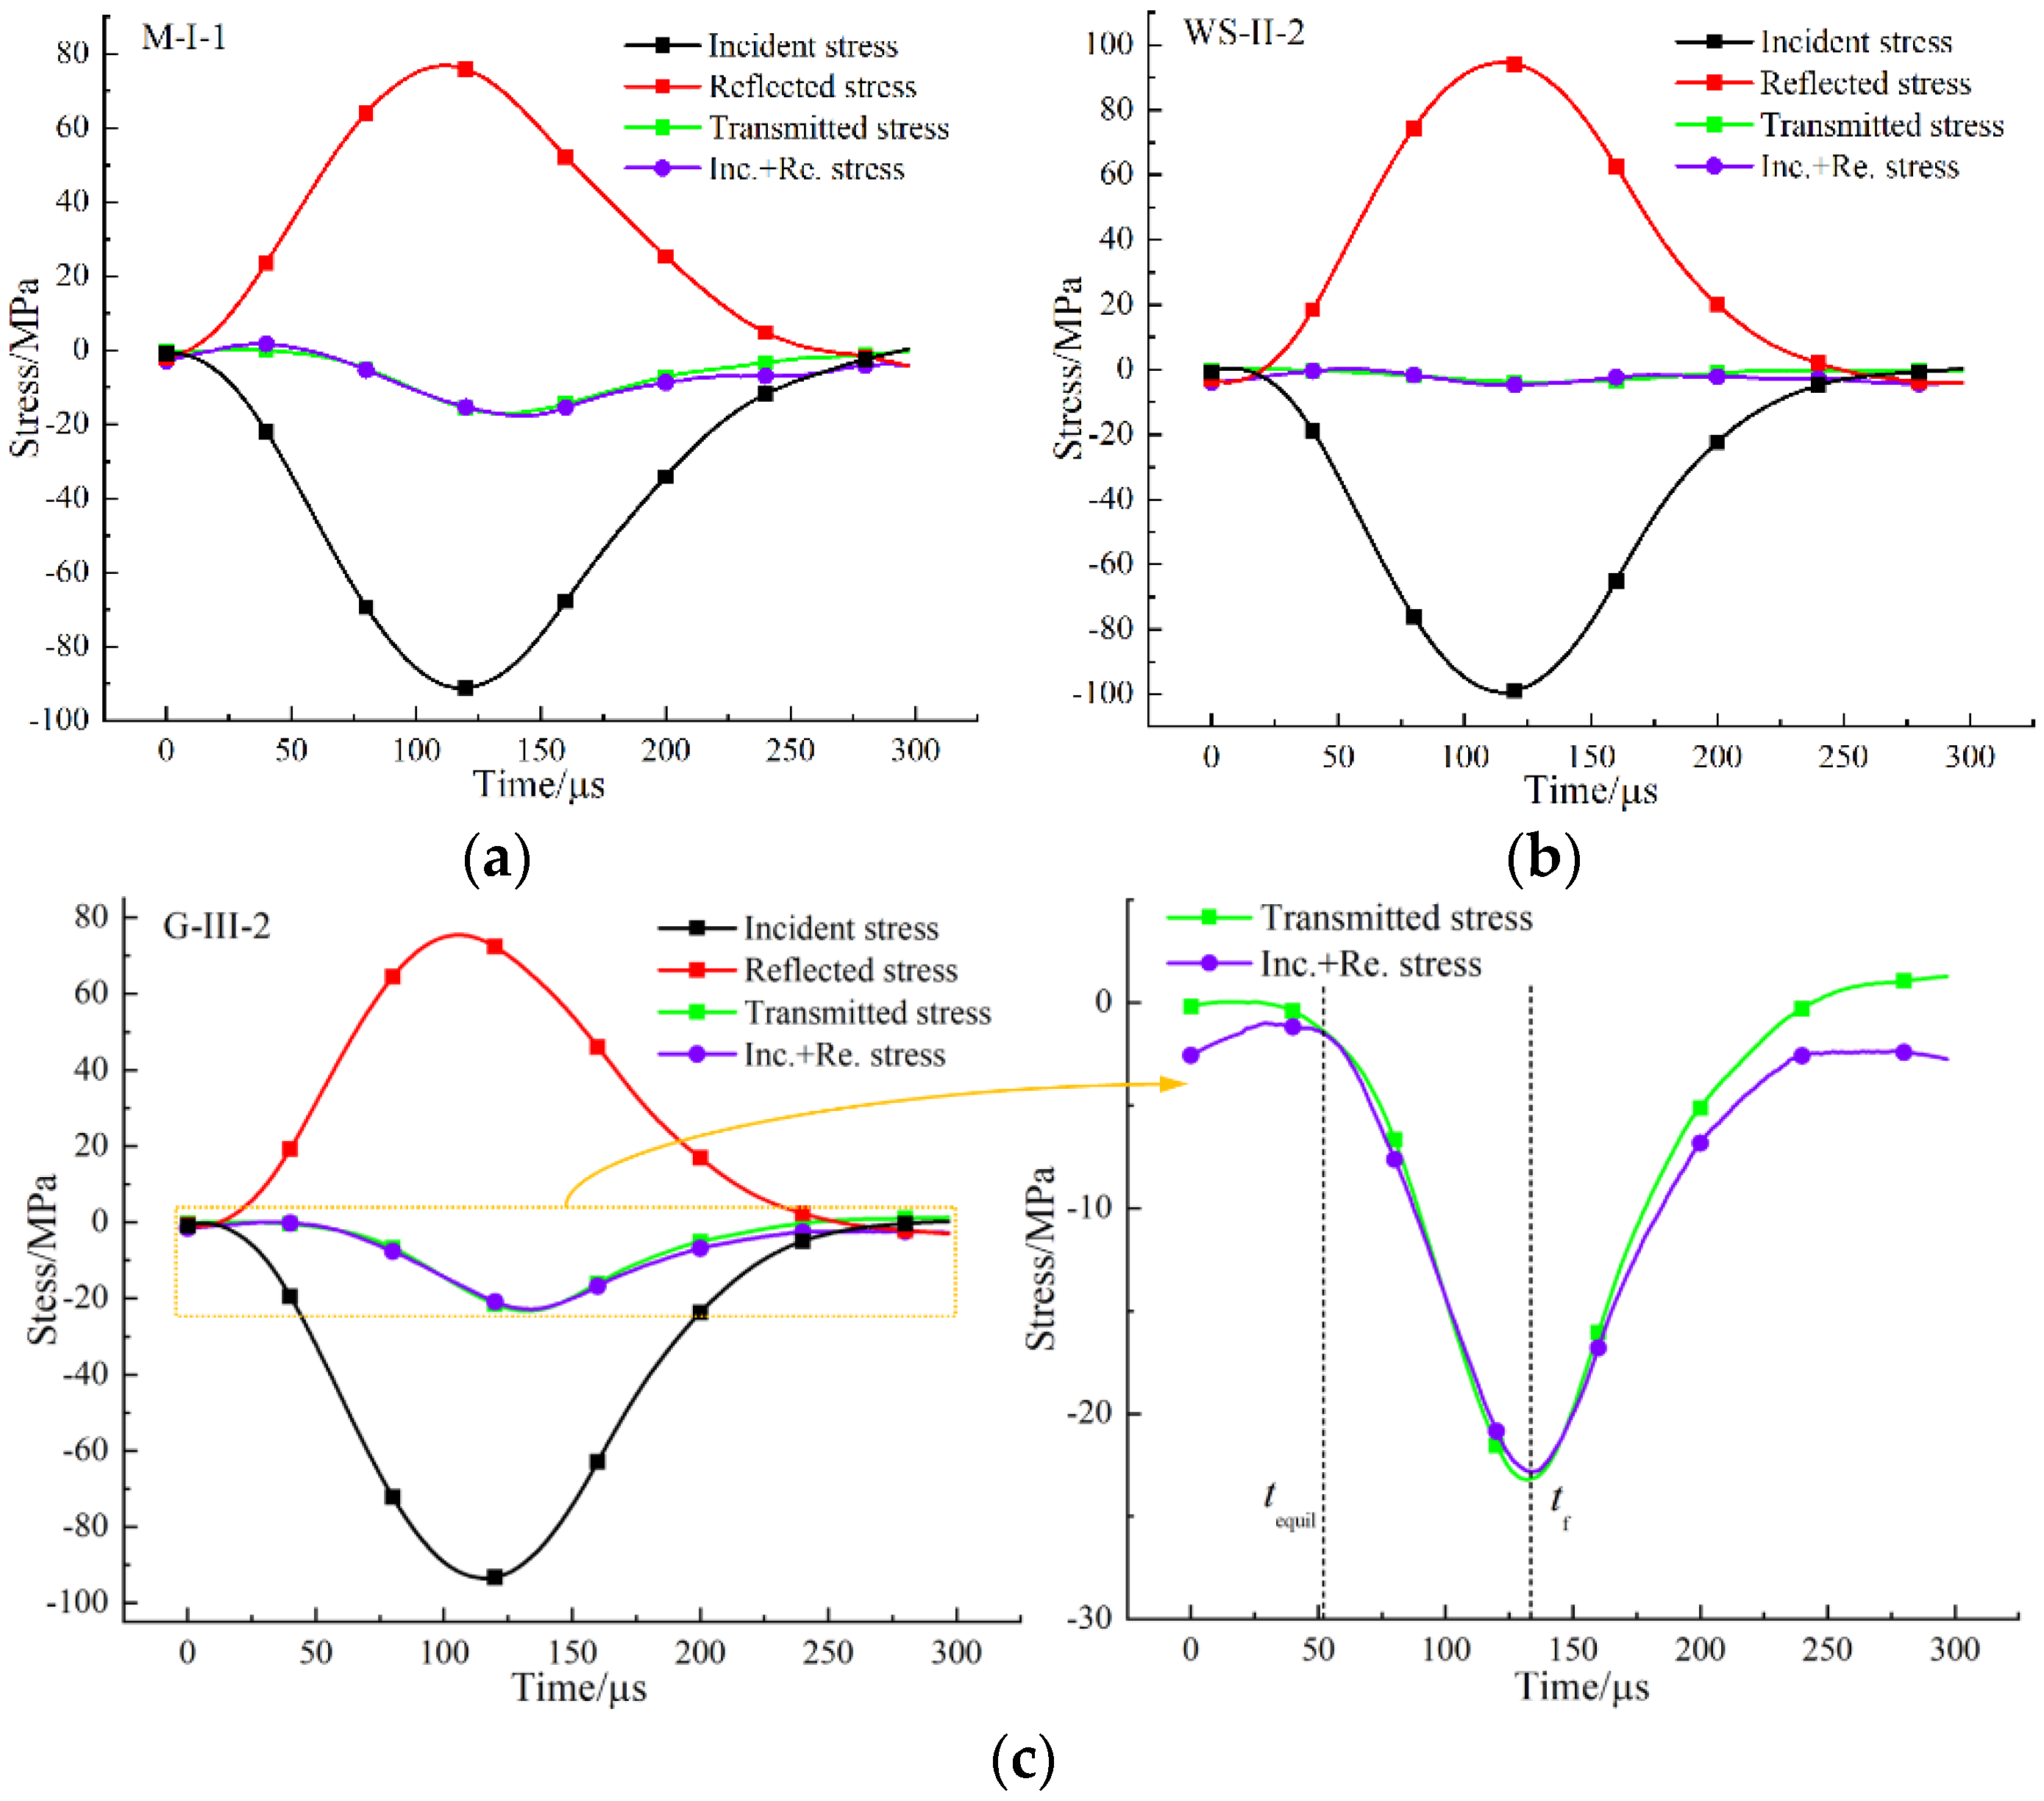
3.1. Dynamic Stress Equilibrium
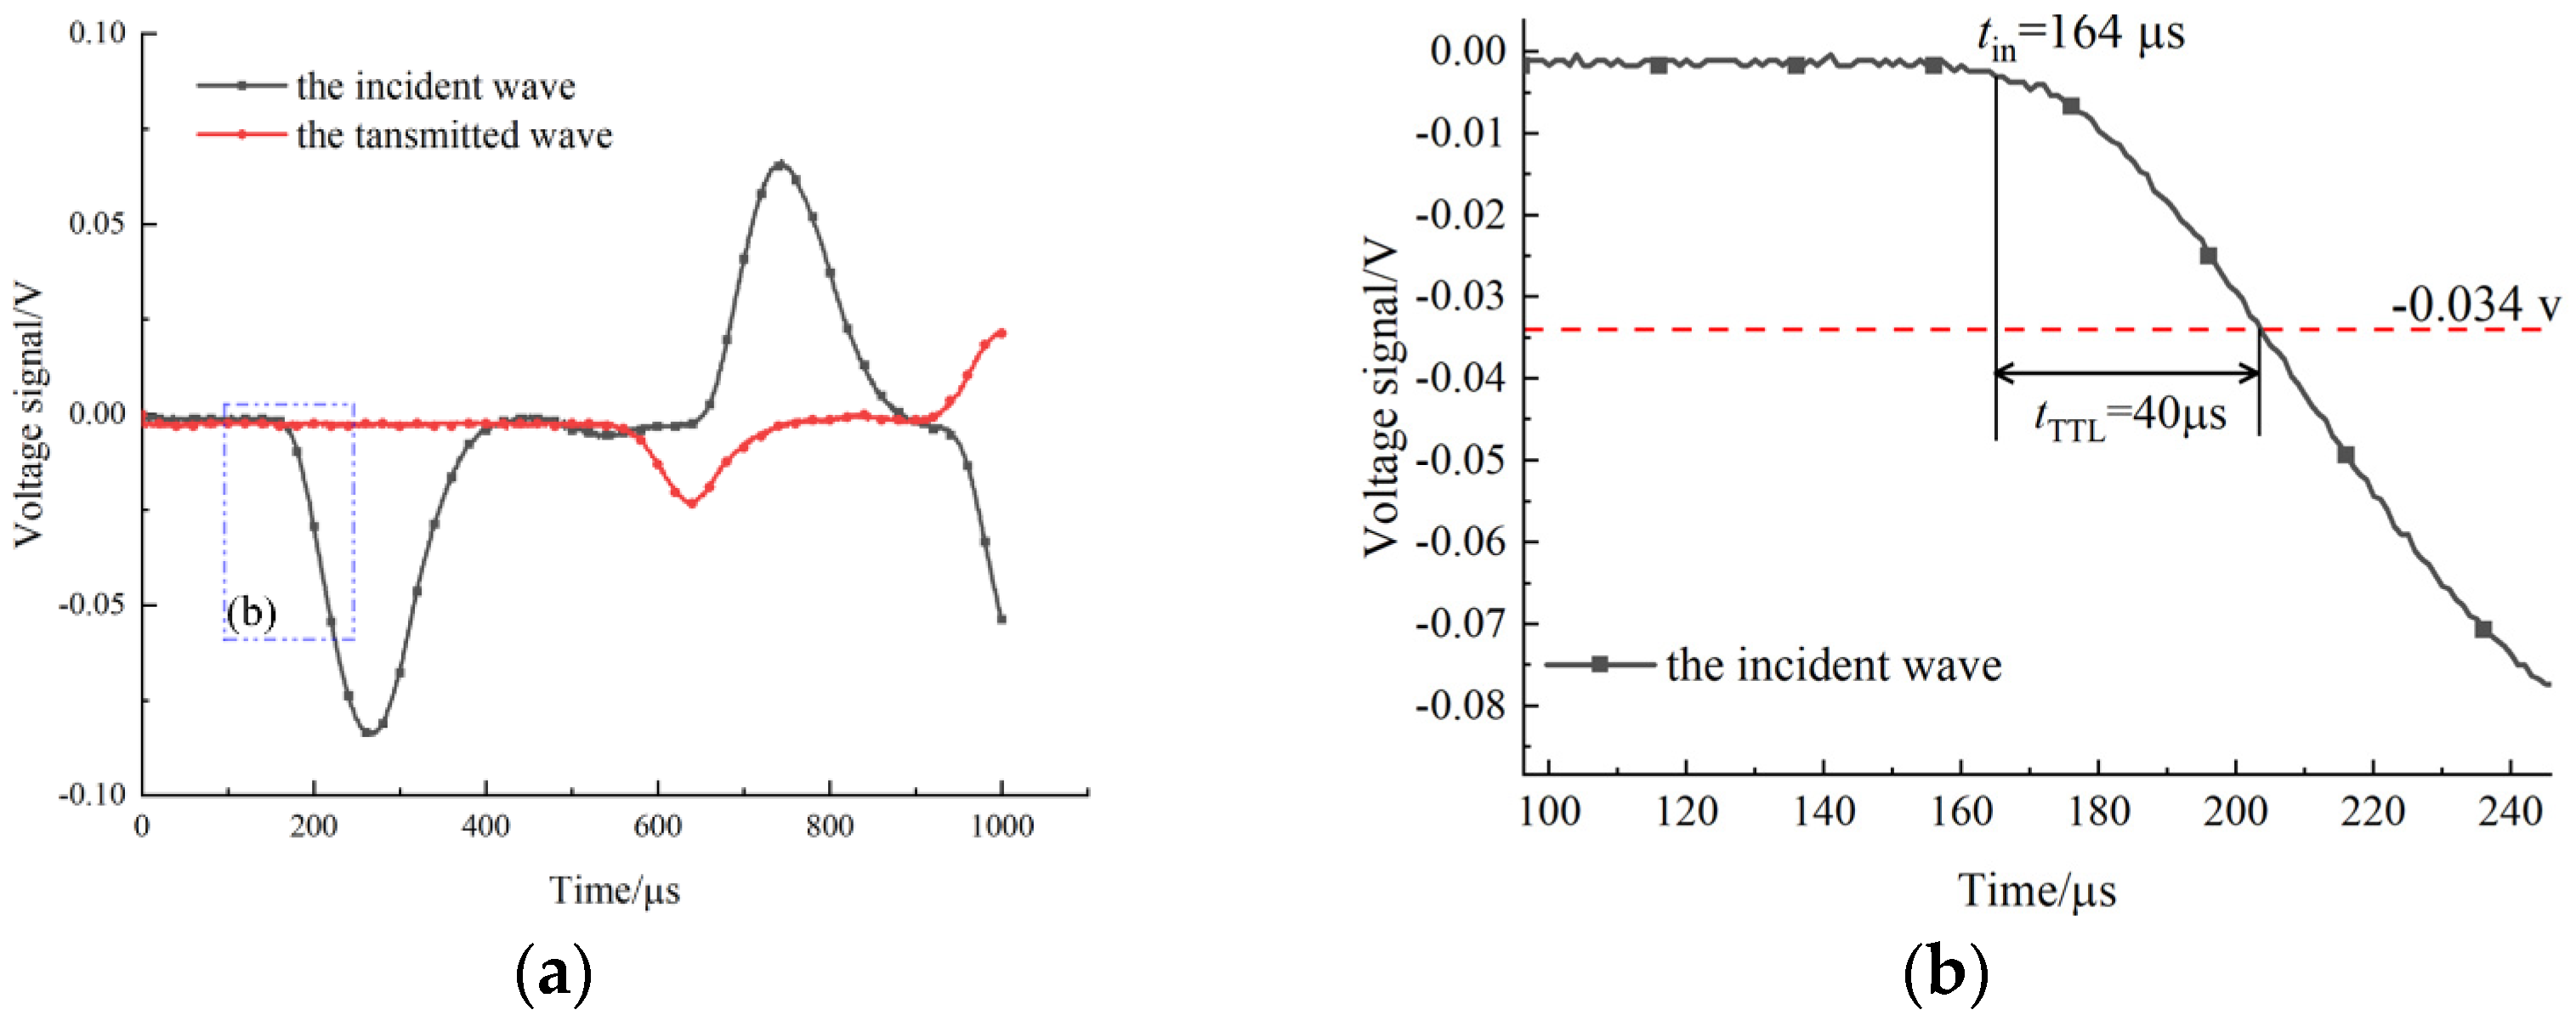
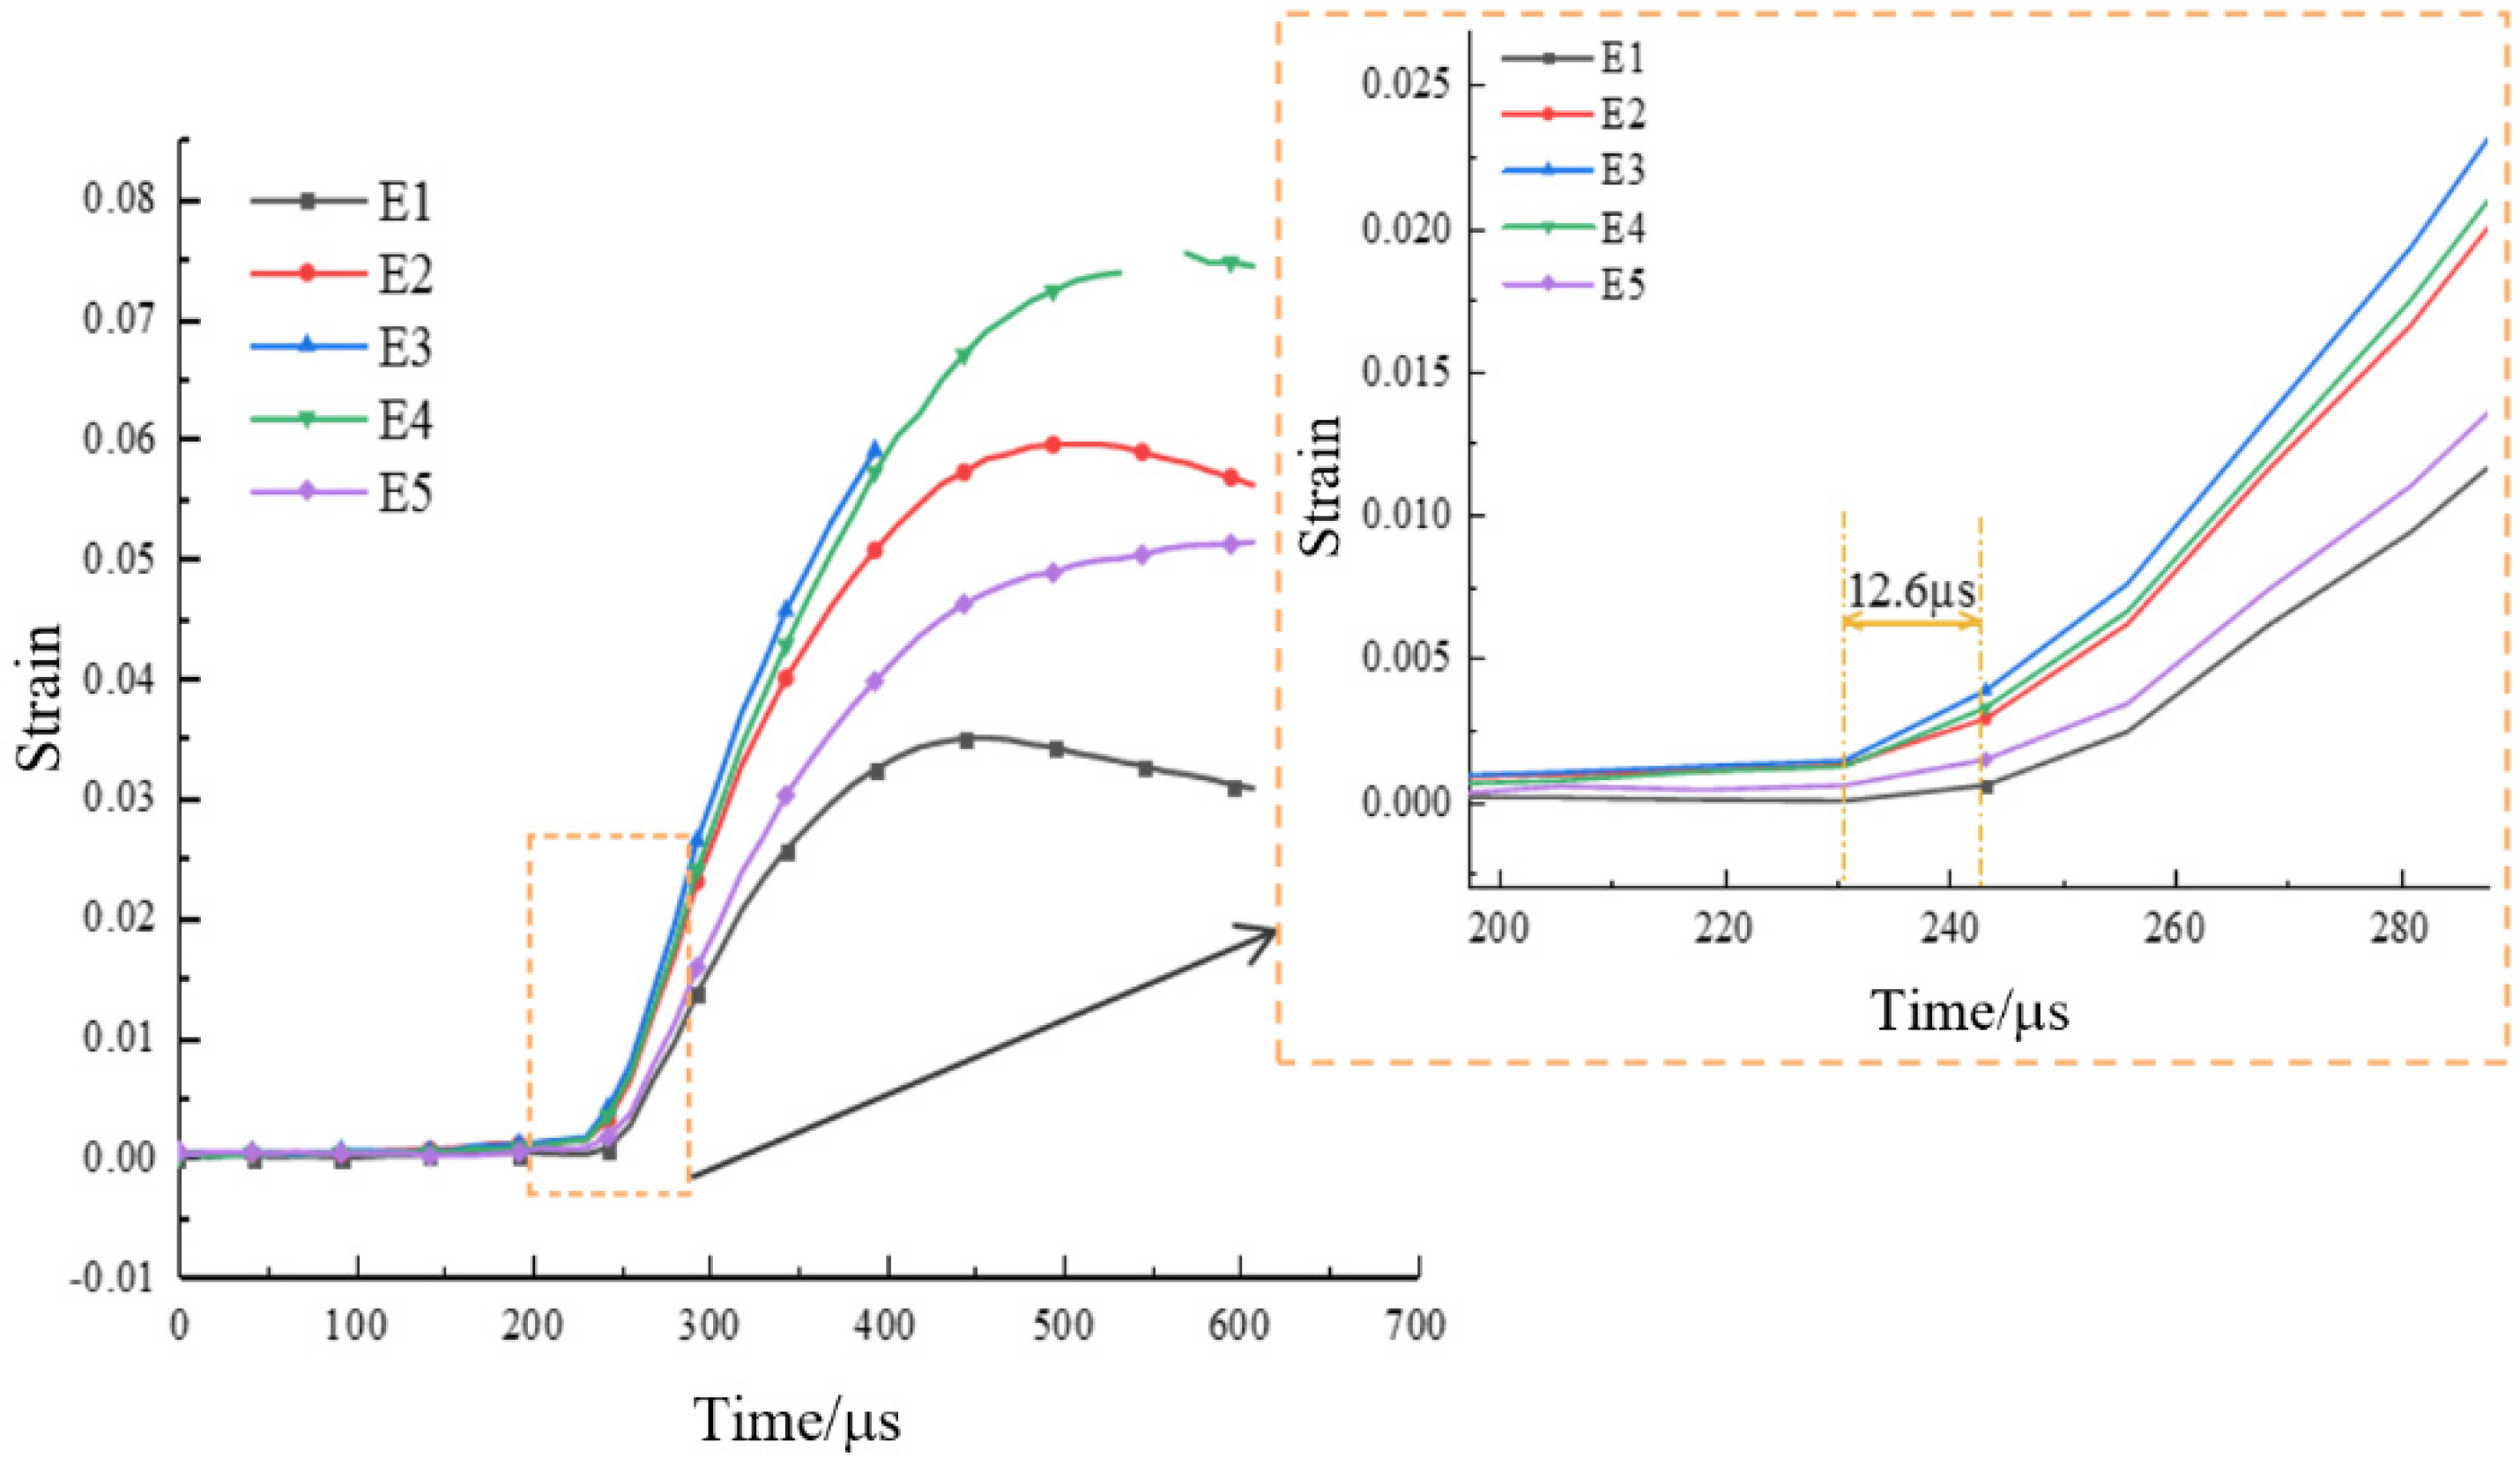
3.2. Matching of the High-Speed Camera to Stress Loading Time
3.3. Loading Rate of the Dynamic Brazilian Tests
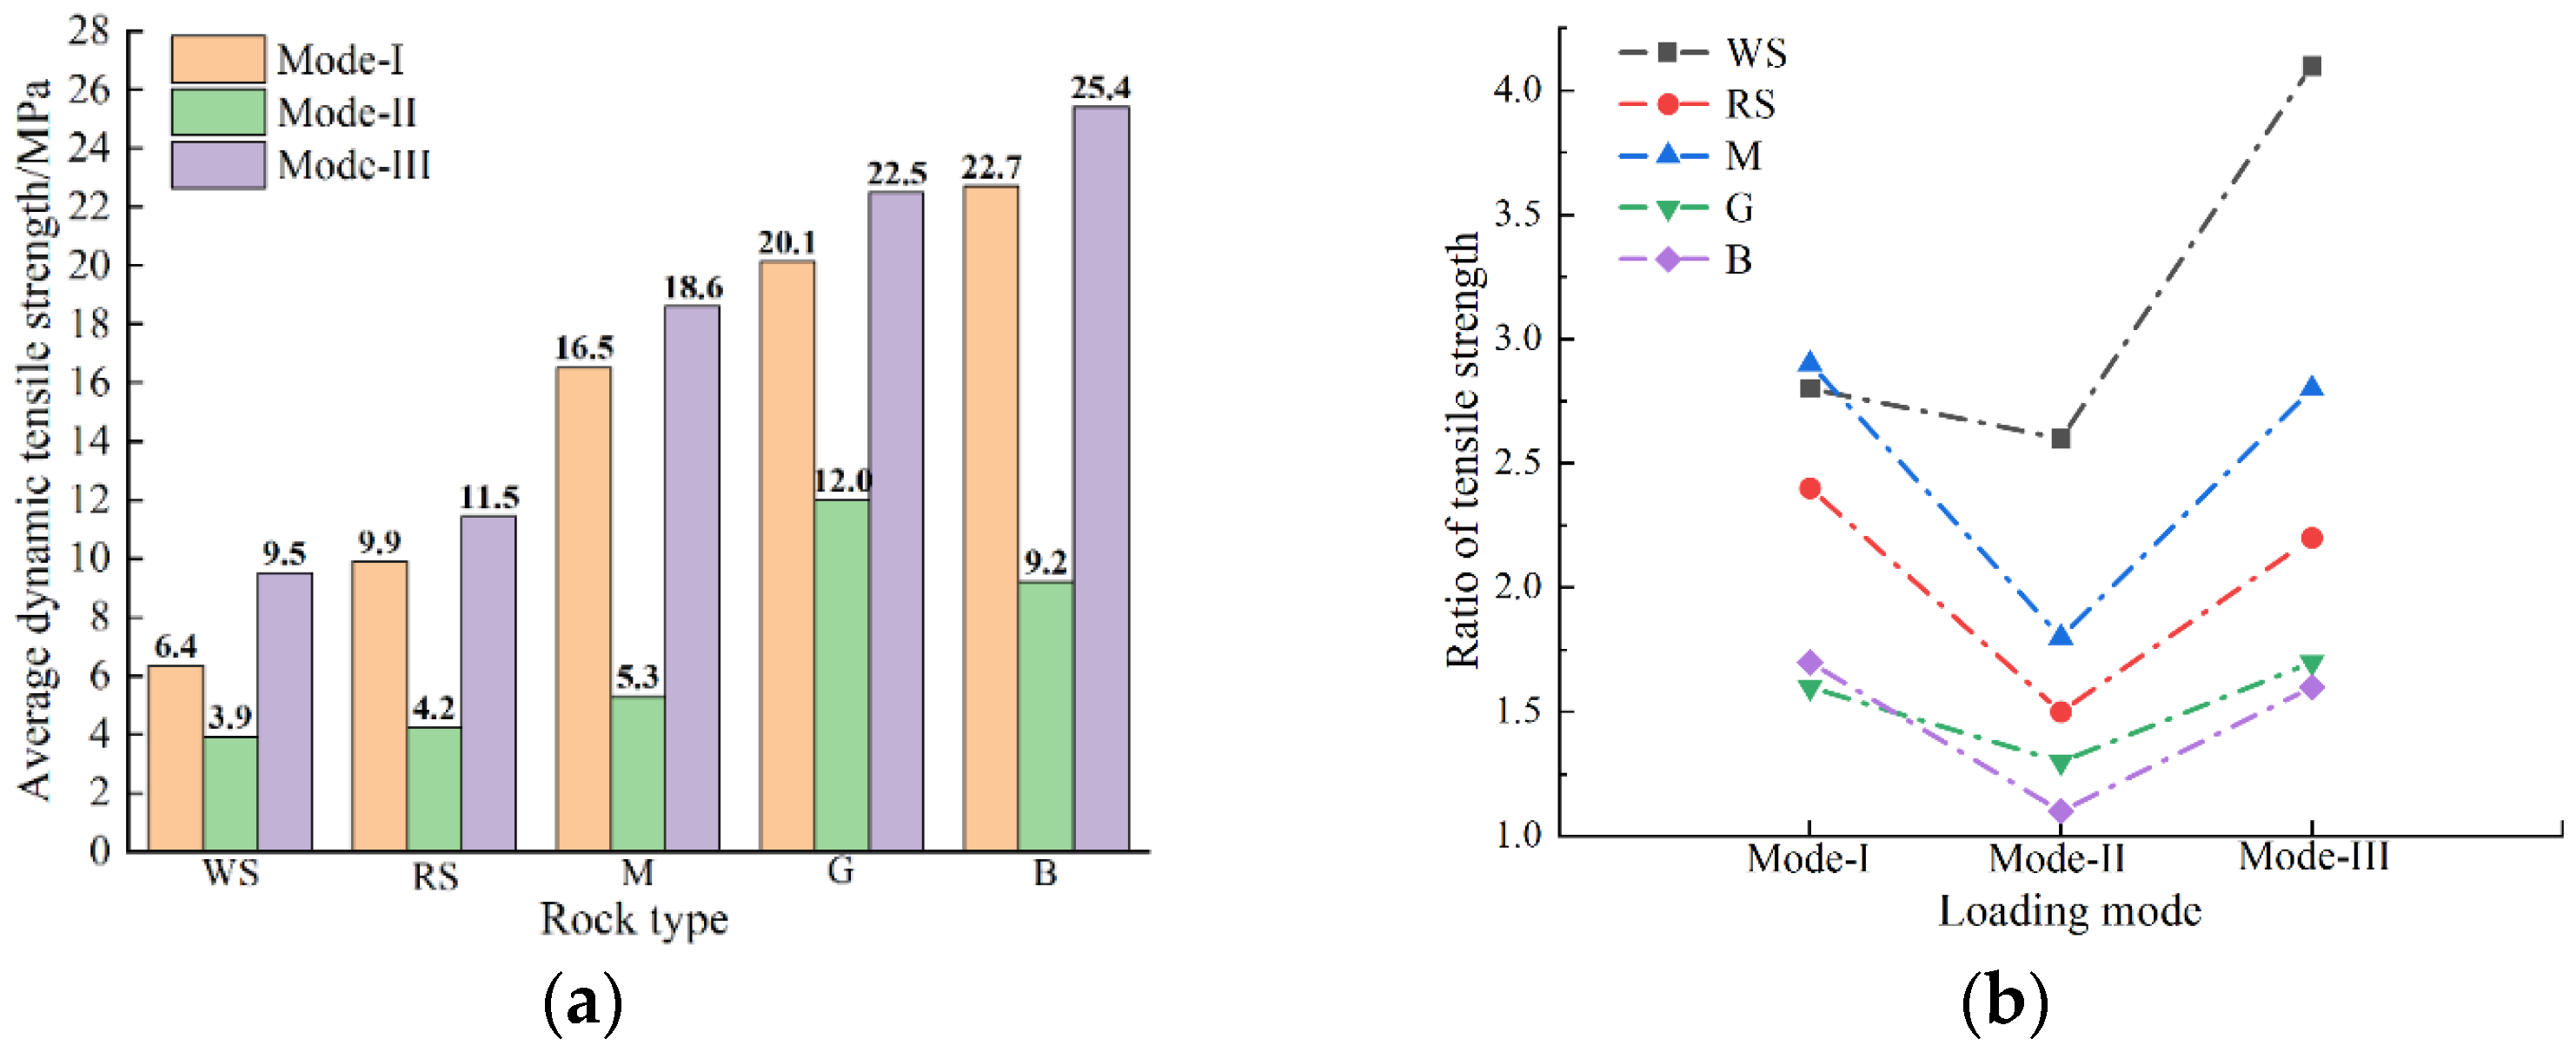
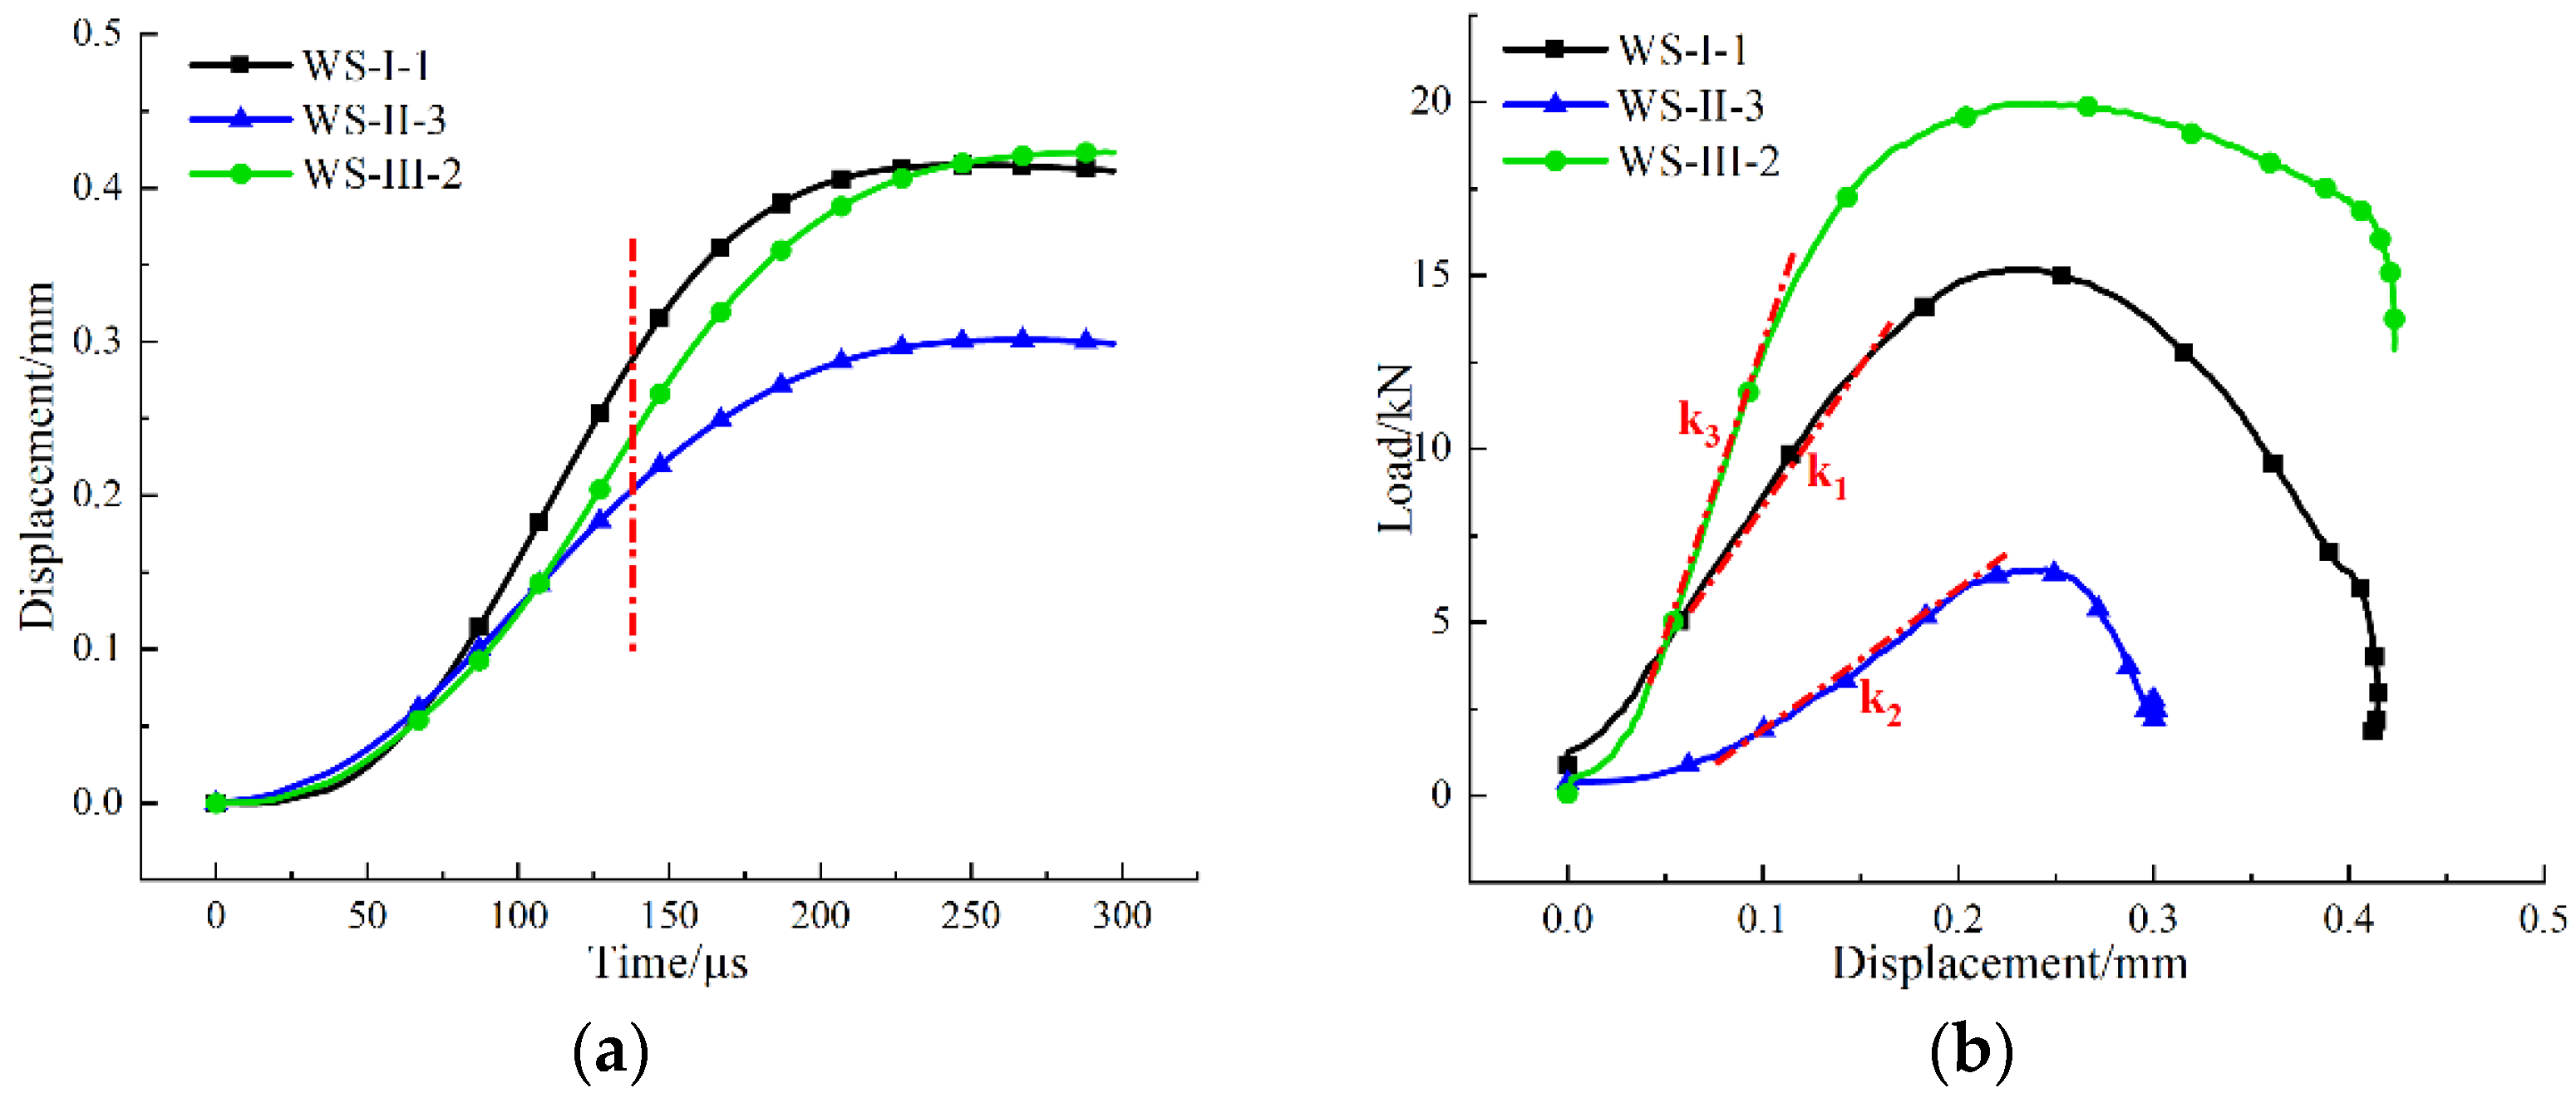
3.4. Dynamic Tensile Strength and Deformation Characteristics of the Specimen
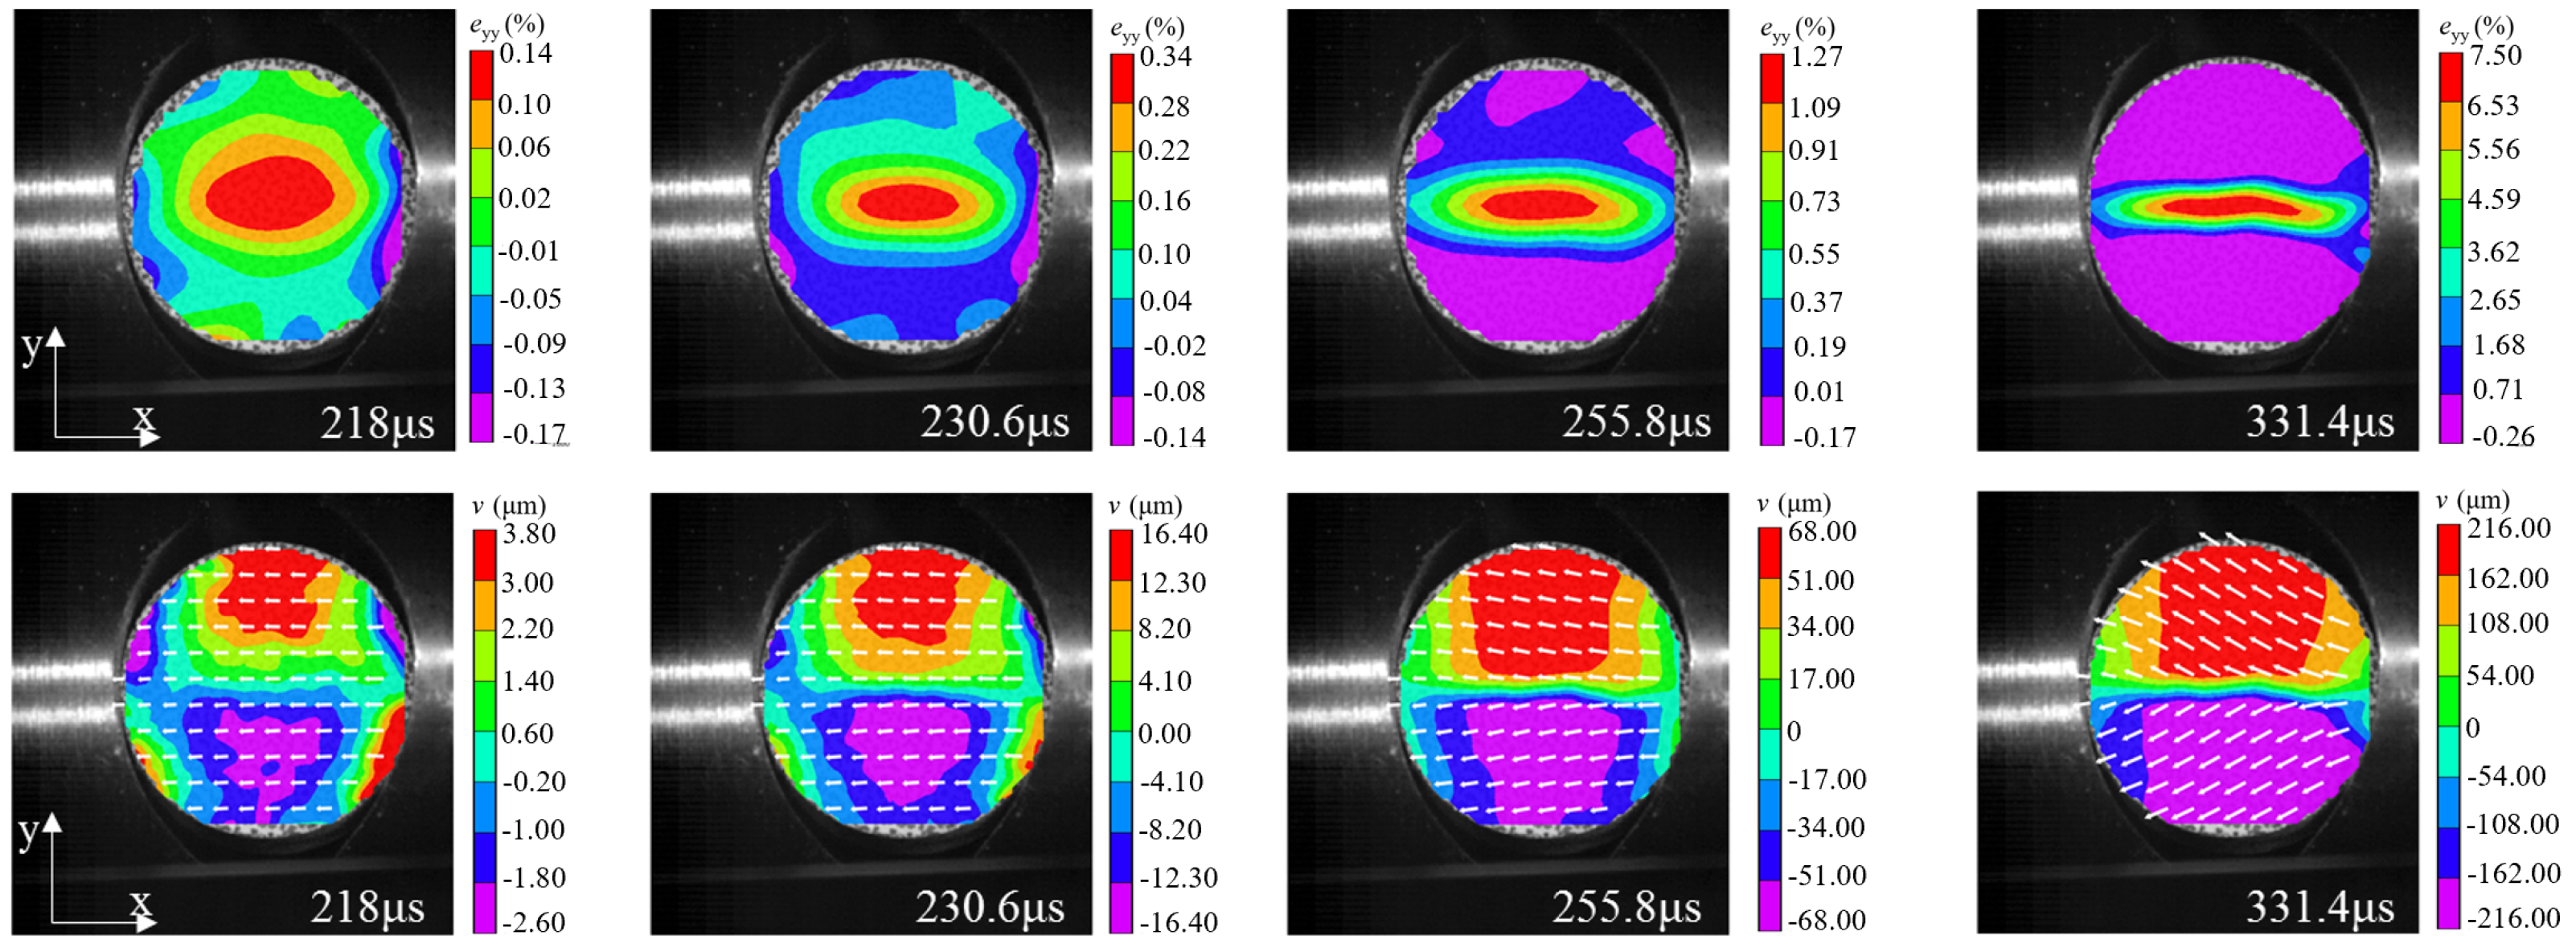
3.5. Dynamic Failure Analysis of Specimens
3.5.1. Typical Fracture Characteristics I
3.5.2. Typical Fracture Characteristics II
3.6. Final Failure Pattern of Specimens
4. Conclusions
- (1)
- The peak load and deformation characteristics of the dynamic Brazilian test were equally strongly influenced by the loading modes. The effects of loading modes on the tensile strength of the specimens were consistent with the static performance, i.e., the dynamic tensile strength determined by mode-III loading was the highest, while it determined that mode-II loading was lowest. In addition, the slope of the load–displacement curve of the specimen under mode-II loading was the smallest, while it was largest in mode-III loading.
- (2)
- There were two typical fracture characteristics in the dynamic Brazilian test. The arc loading method showed outstanding superiority in the dynamic Brazilian test, and the results were more consistent with the Brazilian test theory compared with the other two loading methods. In contrast, the test results under the steel bar loading were unsatisfactory and may greatly underestimate the dynamic tensile strength of the rock.
- (3)
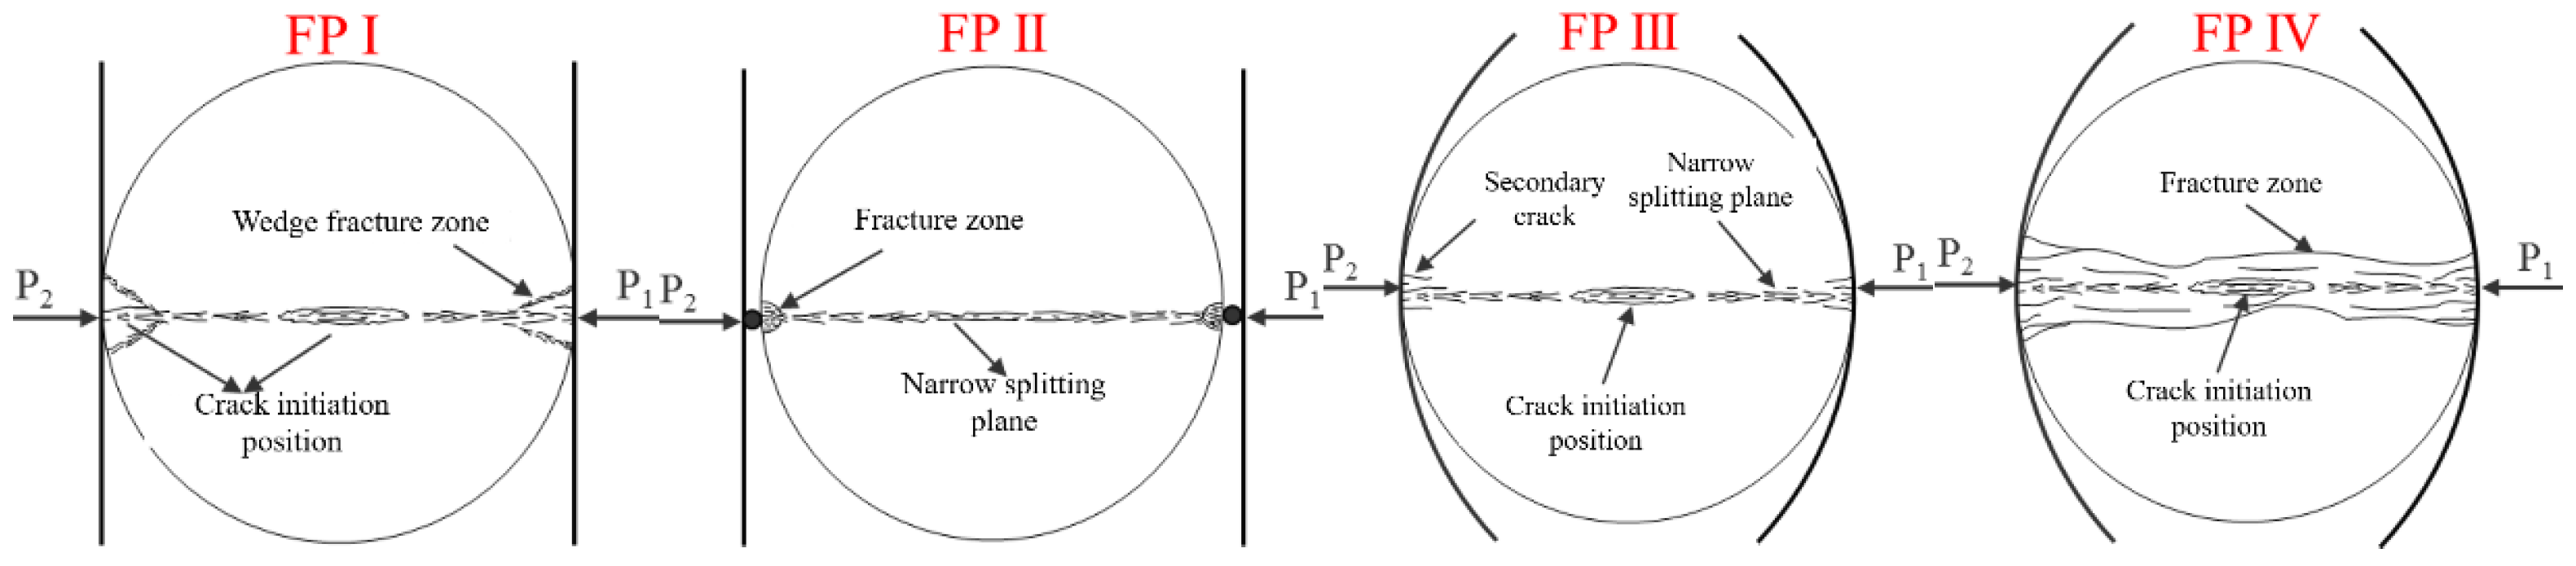
- The specimens exhibited four different damage modes under three loading modes. In addition, it was incomplete or even wrong to collect only the broken pieces of specimens to determine the damage pattern and evaluate the damage mechanism of the specimen. On the contrary, the experiments can help scholars to better understand the evolution of rock fracture and damage mechanism by using the DIC technique.
Author Contributions
Funding
Institutional Review Board Statement
Informed Consent Statement
Data Availability Statement
Conflicts of Interest
References
- Han, Z.; Li, D.; Li, X. Effects of axial pre-force and loading rate on Mode I fracture behavior of granite. Int. J. Rock Mech. Min. Sci. 2022, 157, 105172. [Google Scholar] [CrossRef]
- Han, Z.; Li, D.; Li, X. Dynamic mechanical properties and wave propagation of composite rock-mortar specimens based on SHPB tests. Int. J. Min. Sci. Technol. 2022, 32, 793–806. [Google Scholar] [CrossRef]
- Han, Z.; Li, D.; Zhou, T.; Zhu, Q.; Ranjith, P. Experimental study of stress wave propagation and energy characteristics across rock specimens containing cemented mortar joint with various thicknesses. Int. J. Rock Mech. Min. Sci. 2020, 131, 104352. [Google Scholar] [CrossRef]
- Xiao, P.; Li, D.; Zhao, G.; Liu, H. New criterion for the spalling failure of deep rock engineering based on energy release. Int. J. Rock Mech. Min. Sci. 2021, 148, 104943. [Google Scholar] [CrossRef]
- Zhu, Q.; Li, X.; Li, D.; Ma, C. Experimental investigations of static mechanical properties and failure characteristics of damaged diorite after dynamic triaxial compression. Int. J. Rock Mech. Min. Sci. 2022, 153, 105106. [Google Scholar] [CrossRef]
- Li, Q.; Ma, D.; Zhang, Y.; Liu, Y.; Ma, Y.; Hu, D. Insights into Controlling Factors of Pore Structure and Hydraulic Properties of Broken Rock Mass in a Geothermal Reservoir. Lithosphere 2021, 2021, 3887832. [Google Scholar] [CrossRef]
- Zhao, R.; Tao, M.; Zhao, H.; Cao, W.; Li, X.; Wang, S. Dynamics fracture characteristics of cylindrically-bored granodiorite rocks under different hole size and initial stress state. Theor. Appl. Fract. Mech. 2020, 109, 102702. [Google Scholar] [CrossRef]
- Wang, S.; Li, X.; Yao, J.; Gong, F.; Li, X.; Du, K.; Tao, M.; Huang, L.; Du, S. Experimental investigation of rock breakage by a conical pick and its application to non-explosive mechanized mining in deep hard rock. Int. J. Rock Mech. Min. Sci. 2019, 122, 104063. [Google Scholar] [CrossRef]
- Wang, S.; Sun, L.; Li, X.; Zhou, J.; Du, K.; Wang, S.; Khandelwal, M. Experimental investigation and theoretical analysis of indentations on cuboid hard rock using a conical pick under uniaxial lateral stress. Geomech. Geophys. Geo-Energy Geo-Resour. 2022, 8, 34. [Google Scholar] [CrossRef]
- Wang, S.; Sun, L.; Tang, Y.; Jing, Y.; Li, X.; Yao, J. Field application of non-blasting mechanized mining using high-frequency impact hammer in deep hard rock mine. Trans. Nonferrous Met. Soc. China 2022, 32, 3051–3064. [Google Scholar] [CrossRef]
- Pei, P.; Dai, F.; Liu, Y.; Wei, M. Dynamic tensile behavior of rocks under static pre-tension using the flattened Brazilian disc method. Int. J. Rock Mech. Min. Sci. 2020, 126, 104208. [Google Scholar] [CrossRef]
- Wu, Y.; Yin, T.; Li, Q.; Zhuang, D.; Chen, Y.; Yang, Z. Analytical investigation on the unstable fracture toughness of fine-grained quartz-diorite rock considering the size effect. Eng. Fract. Mech. 2022, 272, 108722. [Google Scholar] [CrossRef]
- Yang, Z.; Yin, T.; Zhuang, D.; Wu, Y.; Yin, J.; Chen, Y. Effect of temperature on mixed mode I/III fracture behavior of diorite: An experimental investigation. Theor. Appl. Fract. Mech. 2022, 122, 103571. [Google Scholar] [CrossRef]
- Wu, Y.; Yin, T.; Zhuang, D.; Li, Q.; Chen, Y. Research on the effect of thermal treatment on the crack resistance curve of marble using notched semi-circular bend specimen. Theor. Appl. Fract. Mech. 2022, 119, 103344. [Google Scholar] [CrossRef]
- Dorji, J.; Zahra, T.; Thambiratnam, D.; Lee, D. Strength assessment of old masonry arch bridges through moderate destructive testing methods. Constr. Build. Mater. 2021, 278, 122391. [Google Scholar] [CrossRef]
- D’Amato, M.; Luchin, G.; De Matteis, G. A preliminary study on properties of a weak units–strong mortar masonry: The case study of matera tufo masonry (Italy). Int. J. Archit. Herit. 2022, 1–22. [Google Scholar] [CrossRef]
- Wu, N.; Fu, J.; Zhu, Z.; Sun, B. Experimental study on the dynamic behavior of the Brazilian disc sample of rock material. Int. J. Rock Mech. Min. Sci. 2020, 130, 104326. [Google Scholar] [CrossRef]
- Yin, T.; Yang, Z.; Wu, Y.; Tan, X.; Li, M. Experimental investigation on the effect of open fire on the tensile properties and damage evolution behavior of granite. Int. J. Damage Mech. 2022, 31, 1139–1164. [Google Scholar] [CrossRef]
- Ross, C.A.; Tedesco, J. Split-Hopkinson pressure-bar tests on concrete and mortar in tension and compression. Mater. J. 1989, 86, 475–481. [Google Scholar]
- Johnstone, C.; Ruiz, C. Dynamic testing of ceramics under tensile stress. Int. J. Solids Struct. 1995, 32, 2647–2656. [Google Scholar] [CrossRef]
- Gomez, J.; Shukla, A.; Sharma, A. Static and dynamic behavior of concrete and granite in tension with damage. Theor. Appl. Fract. Mech. 2001, 36, 37–49. [Google Scholar] [CrossRef]
- Dai, F.; Huang, S.; Xia, K.; Tan, Z. Some fundamental issues in dynamic compression and tension tests of rocks using split Hopkinson pressure bar. Rock Mech. Rock Eng. 2010, 43, 657–666. [Google Scholar] [CrossRef]
- Zhang, Q.; Zhao, J. Determination of mechanical properties and full-field strain measurements of rock material under dynamic loads. Int. J. Rock Mech. Min. Sci. 2013, 60, 423–439. [Google Scholar] [CrossRef]
- Xia, K.; Yao, W. Dynamic rock tests using split Hopkinson (Kolsky) bar system—A review. J. Rock Mech. Geotech. Eng. 2015, 7, 27–59. [Google Scholar] [CrossRef] [Green Version]
- Dai, F.; Xia, K.; Zuo, J.; Zhang, R.; Xu, N. Static and dynamic flexural strength anisotropy of Barre granite. Rock Mech. Rock Eng. 2013, 46, 1589–1602. [Google Scholar] [CrossRef]
- Huang, S.; Xia, K.; Yan, F.; Feng, X. An experimental study of the rate dependence of tensile strength softening of Longyou sandstone. Rock Mech. Rock Eng. 2010, 43, 677–683. [Google Scholar] [CrossRef]
- Wang, Q.; Wu, L. Determination of elastic modulus, tensile strength and fracture toughness of brittle rocks by using flattened Brazilian disk specimen-Part I: Analytical and numerical results. Chin. J. Rock Mech. Eng. 2002, 21, 199–204. [Google Scholar]
- Ruiz, G.; Ortiz, M.; Pandolfi, A. Three-dimensional finite-element simulation of the dynamic Brazilian tests on concrete cylinders. Int. J. Numer. Methods Eng. 2000, 48, 963–994. [Google Scholar] [CrossRef]
- Zhu, W.; Tang, C. Numerical simulation of Brazilian disk rock failure under static and dynamic loading. Int. J. Rock Mech. Min. Sci. 2006, 43, 236–252. [Google Scholar] [CrossRef]
- Mahabadi, O.; Cottrell, B.; Grasselli, G. An example of realistic modelling of rock dynamics problems: FEM/DEM simulation of dynamic Brazilian test on Barre granite. Rock Mech. Rock Eng. 2010, 43, 707–716. [Google Scholar] [CrossRef]
- Li, D.; Li, B.; Han, Z.; Zhu, Q. Evaluation on Rock Tensile Failure of the Brazilian Discs under Different Loading Configurations by Digital Image Correlation. Appl. Sci. 2020, 10, 5513. [Google Scholar] [CrossRef]
- Li, D.; Li, B.; Han, Z.; Zhu, Q.; Liu, M. Evaluation of Bi-modular Behavior of Rocks Subjected to Uniaxial Compression and Brazilian Tensile Testing. Rock Mech. Rock Eng. 2021, 54, 3961–3975. [Google Scholar] [CrossRef]
- Bieniawski, Z.; Hawkes, I. Suggested methods for determining tensile strength of rock materials. Int. J. Rock Mech. Min. Sci. 1978, 15, 99–103. [Google Scholar]
- Ma, J.; Li, D.; Zhu, Q.; Liu, M.; Wan, Q. The mode I fatigue fracture of fine-grained quartz-diorite under coupled static loading and dynamic disturbance. Theor. Appl. Fract. Mech. 2021, 117, 103140. [Google Scholar] [CrossRef]
- Zhu, Q.; Ma, C.; Li, X.; Li, D. Effect of Filling on Failure Characteristics of Diorite with Double Rectangular Holes Under Coupled Static–Dynamic Loads. Rock Mech. Rock Eng. 2021, 54, 2741–2761. [Google Scholar] [CrossRef]
- Han, Z.; Li, D.; Li, X. Experimental study on the dynamic behavior of sandstone with coplanar elliptical flaws from macro, meso, and micro viewpoints. Theor. Appl. Fract. Mech. 2022, 120, 103400. [Google Scholar] [CrossRef]
- Zhu, Q.; Li, C.; Li, X.; Li, D.; Wang, W.; Chen, J. Fracture mechanism and energy evolution of sandstone with a circular inclusion. Int. J. Rock Mech. Min. Sci. 2022, 155, 105139. [Google Scholar] [CrossRef]
- Zhang, C.; Li, D.; Wang, C.; Ma, J.; Zhou, A.; Xiao, P. Effect of confining pressure on shear fracture behavior and surface morphology of granite by the short core in compression test. Theor. Appl. Fract. Mech. 2022, 121, 103506. [Google Scholar] [CrossRef]
- Luo, P.; Wang, L.; Li, D.; Yang, J.; Lv, X. Deformation and failure mechanism of horizontal soft and hard interlayered rock under uniaxial compression based on digital image correlation method. Eng. Fail. Anal. 2022, 142, 106823. [Google Scholar] [CrossRef]
- Zhou, Y.; Xia, K.; Li, X.; Li, H.; Ma, G.; Zhao, J. Suggested Methods for Determining the Dynamic Strength Parameters and Mode-I Fracture Toughness of Rock Materials. In The ISRM Suggested Methods for Rock Characterization, Testing and Monitoring: 2007–2014; Springer: Berlin/Heidelberg, Germany, 2011; pp. 35–44. [Google Scholar] [CrossRef]
- Kolsky, H. An investigation of the mechanical properties of materials at very high rates of loading. Proc. Phys. Soc. Sect. B 1949, 62, 676. [Google Scholar] [CrossRef]
- Li, D.; Ma, J.; Wan, Q.; Zhu, Q.; Han, Z. Effect of thermal treatment on the fracture toughness and subcritical crack growth of granite in double-torsion test. Eng. Fract. Mech. 2021, 253, 107903. [Google Scholar] [CrossRef]
- Sutton, M.A.; Orteu, J.J.; Schreier, H. Image Correlation for Shape, Motion and Deformation Measurements: Basic Concepts, Theory and Applications; Springer Science & Business Media: Berlin/Heidelberg, Germany, 2009. [Google Scholar] [CrossRef]
- Li, D.; Zhang, C.; Zhu, Q.; Ma, J.; Gao, F. Deformation and fracture behavior of granite by the short core in compression method with 3D digital image correlation. Fatigue Fract. Eng. Mater. Struct. 2022, 45, 425–440. [Google Scholar] [CrossRef]
- Ma, J.; Li, D.; Luo, P.; Zhu, Q.; Zhang, C.; Su, X. Subcritical crack growth and fracture behavior of rocks and long-term strength estimation. Theor. Appl. Fract. Mech. 2022, 122, 103664. [Google Scholar] [CrossRef]


| Specimens No. | D/mm | t/mm | Pfd/kN | /MPa | Mean/MPa |
|---|---|---|---|---|---|
| WS-I-1 | 49.54 | 25.03 | 12.35 | 6.34 | |
| WS-I-2 | 49.73 | 25.05 | 12.82 | 6.55 | 6.35 |
| WS-I-3 | 49.32 | 25.04 | 11.95 | 6.16 | |
| WS-II-1 | 49.12 | 25.03 | 7.36 | 3.81 | |
| WS-II-2 | 49.16 | 25.08 | 8.25 | 4.26 | 3.91 |
| WS-II-3 | 49.56 | 25.04 | 7.13 | 3.66 | |
| WS-III-1 | 49.09 | 25.10 | 20.71 | 10.70 | |
| WS-III-2 | 49.23 | 25.09 | 16.12 | 8.31 | 9.52 |
| WS-III-3 | 49.62 | 25.06 | 18.67 | 9.56 | |
| RS-I-1 | 49.10 | 25.02 | 16.96 | 8.79 | |
| RS-I-2 | 49.34 | 25.11 | 17.83 | 9.16 | 9.88 |
| RS-I-3 | 49.06 | 25.04 | 22.58 | 11.70 | |
| RS-II-1 | 49.09 | 25.03 | 5.77 | 2.99 | |
| RS-II-2 | 49.04 | 25.02 | 7.38 | 3.83 | 4.24 |
| RS-II-3 | 49.02 | 25.03 | 11.39 | 5.91 | |
| RS-III-1 | 49.45 | 24.98 | 22.12 | 11.40 | |
| RS-III-2 | 49.13 | 25.01 | 24.70 | 12.80 | 11.53 |
| RS-III-3 | 49.16 | 25.08 | 20.12 | 10.39 | |
| M-I-1 | 49.14 | 25.06 | 33.46 | 17.30 | |
| M-I-2 | 49.23 | 25.03 | 30.77 | 15.90 | 16.53 |
| M-I-3 | 49.26 | 25.06 | 31.80 | 16.40 | |
| M-II-1 | 49.25 | 25.04 | 11.35 | 5.86 | |
| M-II-2 | 49.10 | 25.02 | 12.41 | 6.43 | 5.29 |
| M-II-3 | 49.15 | 25.11 | 6.94 | 3.58 | |
| M-III-1 | 49.28 | 25.13 | 44.16 | 22.70 | |
| M-III-2 | 49.32 | 24.97 | 28.05 | 14.50 | 18.64 |
| M-III-3 | 49.46 | 25.02 | 36.39 | 18.72 | |
| G-I-1 | 49.41 | 25.06 | 43.18 | 22.20 | |
| G-I-2 | 49.26 | 25.01 | 35.61 | 18.40 | 20.13 |
| G-I-3 | 49.29 | 25.07 | 38.43 | 19.80 | |
| G-II-1 | 49.39 | 25.04 | 23.19 | 11.94 | |
| G-II-2 | 49.43 | 25.13 | 17.09 | 8.76 | 12.02 |
| G-II-3 | 49.47 | 25.09 | 29.95 | 15.36 | |
| G-III-1 | 49.19 | 25.14 | 40.40 | 20.80 | |
| G-III-2 | 49.22 | 25.05 | 45.76 | 23.63 | 22.48 |
| G-III-3 | 49.37 | 25.13 | 44.84 | 23.01 | |
| B-I-1 | 49.45 | 25.11 | 40.57 | 20.80 | |
| B-I-2 | 49.43 | 24.97 | 45.75 | 23.60 | 22.70 |
| B-I-3 | 49.39 | 25.11 | 46.17 | 23.70 | |
| B-II-1 | 49.51 | 25.01 | 18.61 | 9.57 | |
| B-II-2 | 49.44 | 25.06 | 17.94 | 9.22 | 9.22 |
| B-II-3 | 49.36 | 25.11 | 17.27 | 8.87 | |
| B-III-1 | 49.51 | 25.07 | 55.21 | 28.32 | |
| B-III-2 | 49.32 | 25.03 | 44.99 | 23.20 | 25.40 |
| B-III-3 | 49.49 | 25.05 | 48.06 | 24.68 |
| Rock Types | σc (MPa) | E (GPa) | ν |
|---|---|---|---|
| White sandstone | 37.7 | 9.2 | 0.15 |
| Red sandstone | 62.6 | 14.8 | 0.18 |
| Marble | 79.2 | 43.7 | 0.21 |
| Granite | 171.7 | 72.2 | 0.23 |
| Basalt | 158.4 | 61.9 | 0.25 |
| Rock Type | White Sandstone | Red Sandstone | Marble | Granite | Basalt |
|---|---|---|---|---|---|
| Mode-I |  |  |  |  |  |
| Mode-II |  | 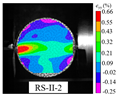 | 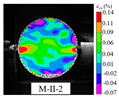 |  | 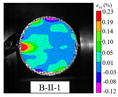 |
| Mode-III | 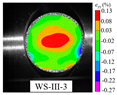 | 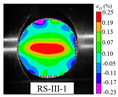 | 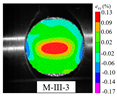 | 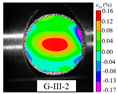 |  |
| Rock Type | White Sandstone | Red Sandstone | Marble | Granite | Basalt |
|---|---|---|---|---|---|
| Mode-I |  |  | 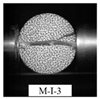 |  |  |
| Mode-II |  |  | 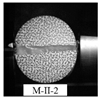 |  | 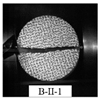 |
| Mode-III |  |  |  |  |  |
Publisher’s Note: MDPI stays neutral with regard to jurisdictional claims in published maps and institutional affiliations. |
© 2022 by the authors. Licensee MDPI, Basel, Switzerland. This article is an open access article distributed under the terms and conditions of the Creative Commons Attribution (CC BY) license (https://creativecommons.org/licenses/by/4.0/).
Share and Cite
Li, D.; Ma, J.; Zhu, Q.; Li, B. Research of Dynamic Tensile Properties of Five Rocks under Three Loading Modes Based on SHPB Device. Materials 2022, 15, 8473. https://doi.org/10.3390/ma15238473
Li D, Ma J, Zhu Q, Li B. Research of Dynamic Tensile Properties of Five Rocks under Three Loading Modes Based on SHPB Device. Materials. 2022; 15(23):8473. https://doi.org/10.3390/ma15238473
Chicago/Turabian StyleLi, Diyuan, Jinyin Ma, Quanqi Zhu, and Bang Li. 2022. "Research of Dynamic Tensile Properties of Five Rocks under Three Loading Modes Based on SHPB Device" Materials 15, no. 23: 8473. https://doi.org/10.3390/ma15238473