
A Review of Key Properties of Thermoelectric Composites of Polymers and Inorganic Materials

Abstract
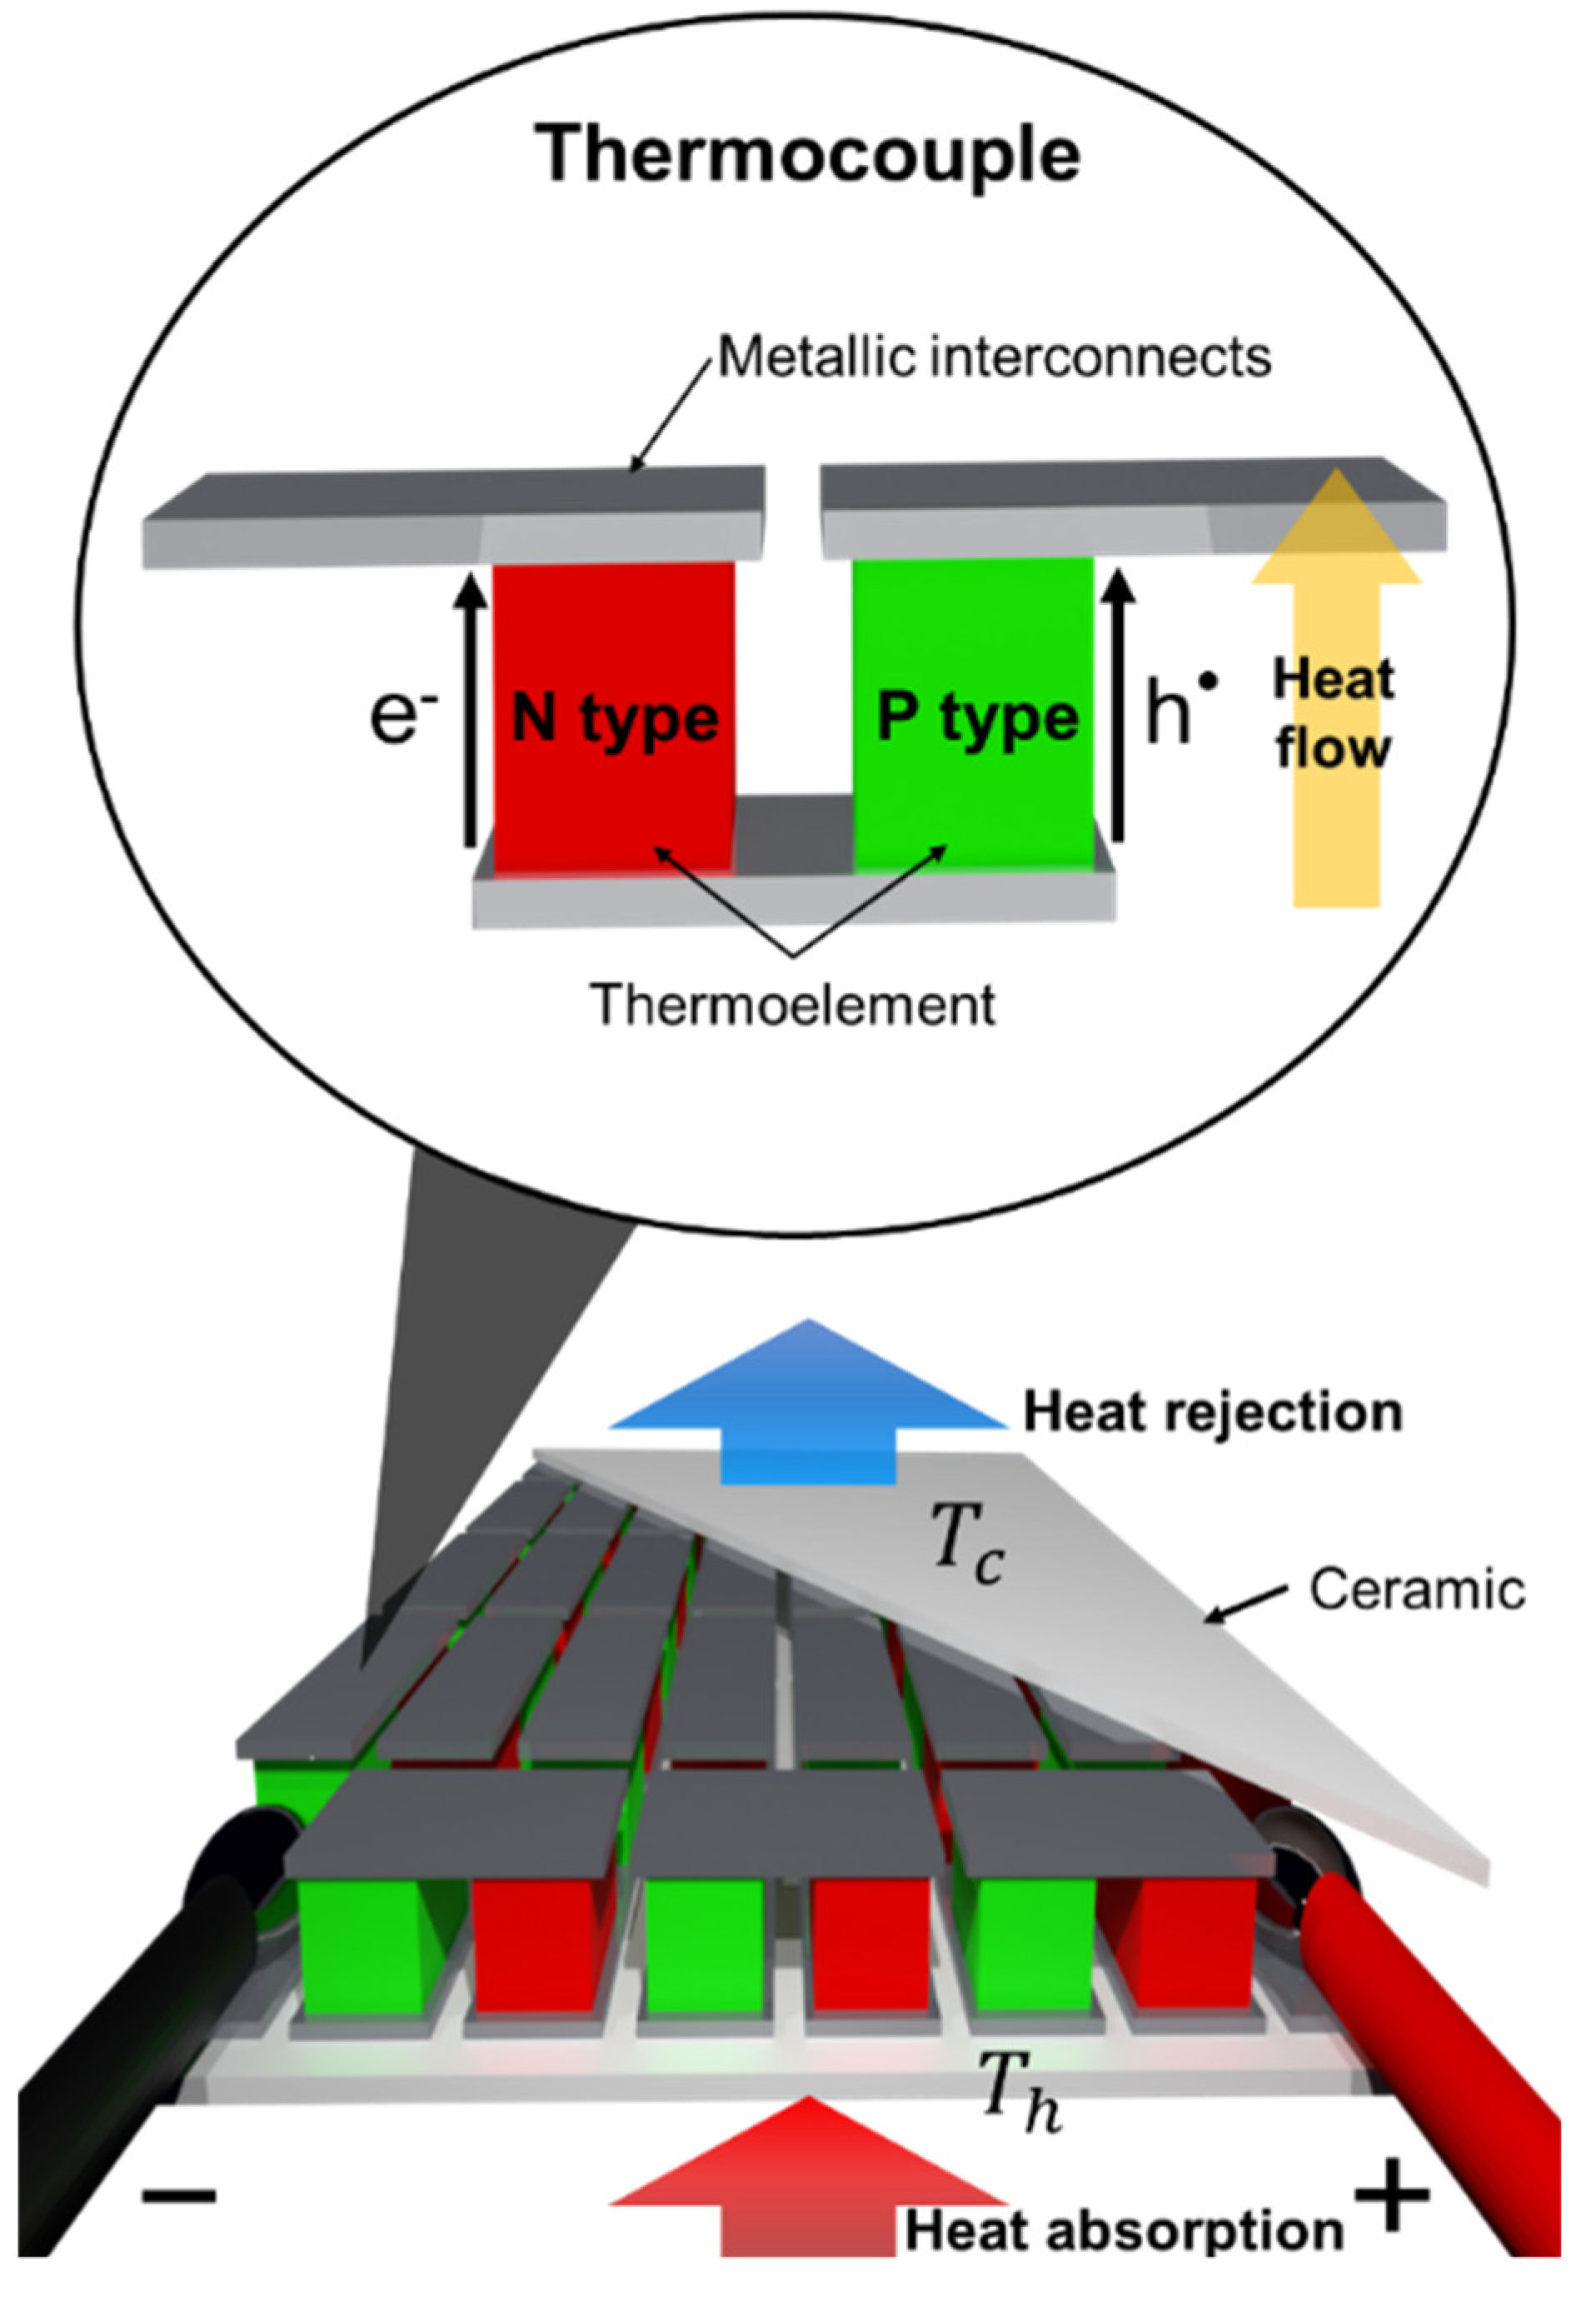
:1. Introduction
2. Inorganic Thermoelectric Materials
2.1. State-of-the-Art Inorganic TE Materials

| Material | T (K) | S (µV K−1) | PF (µW m−1 K−2) | ZTmax | ||
|---|---|---|---|---|---|---|
| p-type conventional inorganic materials | ||||||
| (GeTe)0.95(Sb2Te3)0.05 [41] | 720 | 917 | 217 | ~4318 † | 1.19 | 2.70 |
| SnSe [42] | 923 | ~96 | ~342 | ~1123 † | ~0.35 | 2.60 |
| β-Cu1.94Al0.02Se [43] | 1029 | ~265 | ~240 | ~1526 † | ~0.60 | 2.62 |
| Pb0.98Na0.02Te-8%SrTe [44] | 923 | 323 | 294 | ~2792 † | 0.57 | 2.50 |
| Ge0.86Pb0.1Bi0.04Te [45] | 600 | 365 | 282 | ~2903 † | 0.49 | 2.40 |
| Pb0.92Mg0.08Se0.2Te0.8 [46] | 798 | ~247 | ~300 | ~2223 † | ~0.80 | 2.20 |
| Bi0.52Sb1.48Te3 [47] | 310 | ~643 | ~230 | ~3352 | ~1.35 | 1.56 |
| Bi0.88Ca0.06Pb0.07CuSeO [48] | 873 | ~163 | ~228 | ~862 | 0.50 | 1.50 |
| Bi0.3Sb1.7Te3 [49] | 378 | ~859 † | ~205 | ~3610 | ~1.10 | ~1.27 |
| n-type conventional inorganic materials | ||||||
| SnSe [50] | 773 | ~39 | ~−476 | ~900 | ~0.24 | 2.80 |
| PbTe-4%InSb [51] | 773 | 484 | −205 | ~2034 † | 0.25 | 1.83 |
| Mg3.175Mn0.025 Sb1.5 Bi0.49Te0.01 [52] | 700 | ~230 | ~−298 | ~2042 † | 0.55 | 1.78 |
| Ba0.08La0.05Yb0.08Co4Sb12 [53] | 850 | 1344 | −198 | ~5269 † | 0.40 | 1.70 |
| Pb0.93Sb0.05S0.5Se0.5 [54] | 900 | 421 | −188 | ~1488 † | 0.80 | 1.65 |
| Sn0.97Re0.03Se0.93Cl0.02 [55] | 798 | ~32 | ~−430 | ~578 | ~0.32 | 1.50 |
| Bi1.8Sb0.2Te2.7Se0.3+15%Te [56] | 425 | 819 | −198 | ~3211 † | 0.38 | 1.40 |
| Bi2.0Te2.7Se0.3 [57] | 300 | 270 | −200 | ~1080 † | 0.22 | 1.47 |
| Ba8Ga15.8 Cu0.033Sn30.17 [58] | 550 | 187.2 | −307 | ~1764 † | 0.70 | 1.38 |
| (Hf0.5Zr0.5)0.7Ti0.3NiSn0.998Sb0.002 [59] | 873 | ~928 | ~190 | ~3740 | ~3.10 | 0.92 |
| p-type oxide inorganic materials | ||||||
| NaxCoO2−δ [24] | 800 | 1923 | 200 | 7690 | 5.10 | 1.20 |
| Bi0.94Pb0.06CuSeO [60] | 823 | 135 | 221 | ~659 † | 0.60 | 1.14 |
| Bi2Sr3Co2Oy [61] | 973 | - | 300 | - | 2.00 | 1.10 |
| Ca2.87Ag0.05Lu0.16Co4O9+δ [62] | 1118 | - | ~232 | - | ~1.40 | ~0.60 |
| Ca2.97Sr0.03Co4O9 [63] | 1073 | ~154 | 270 | 1200 | 4.40 | 0.29 |
| n-type oxide inorganic materials | ||||||
| Zn0.96Al0.02Ga0.02O [23] | 1247 | ~570 | ~−250 | ~2309 | ~4.82 | 0.65 |
| Ca0.97Bi0.03MnCu0.04O3−δ [64] | 1073 | 120.7 | ~−214 | ~553 † | 1.50 | 0.44 |
| In1.88V0.12O3 [65] | 973 | ~386 | ~−141 | ~777 | ~1.78 | 0.42 |
| La0.08Sr0.92TiO3 [25] | 1045 | ~210 | ~−232 | ~1130 † | ~3.05 | 0.37 |
| TiO1.76 [66] | 973 | 350 | ~−148 | ~767 † | 2.10 | 0.35 |
| Ba0.1Eu0.9TiO3−δ [39] | 1123 | ~63 | −300 | ~567 † | 2.70 | 0.24 |
| Ca0.9Dy0.1MnO3 [26] | 1000 | ~150 | ~−155 | ~359 | ~1.85 | 0.20 |
| Sn0.99Sb0.01O2 [67] | 1073 | 183 | −159 | 460 | 7.94 | 0.06 |
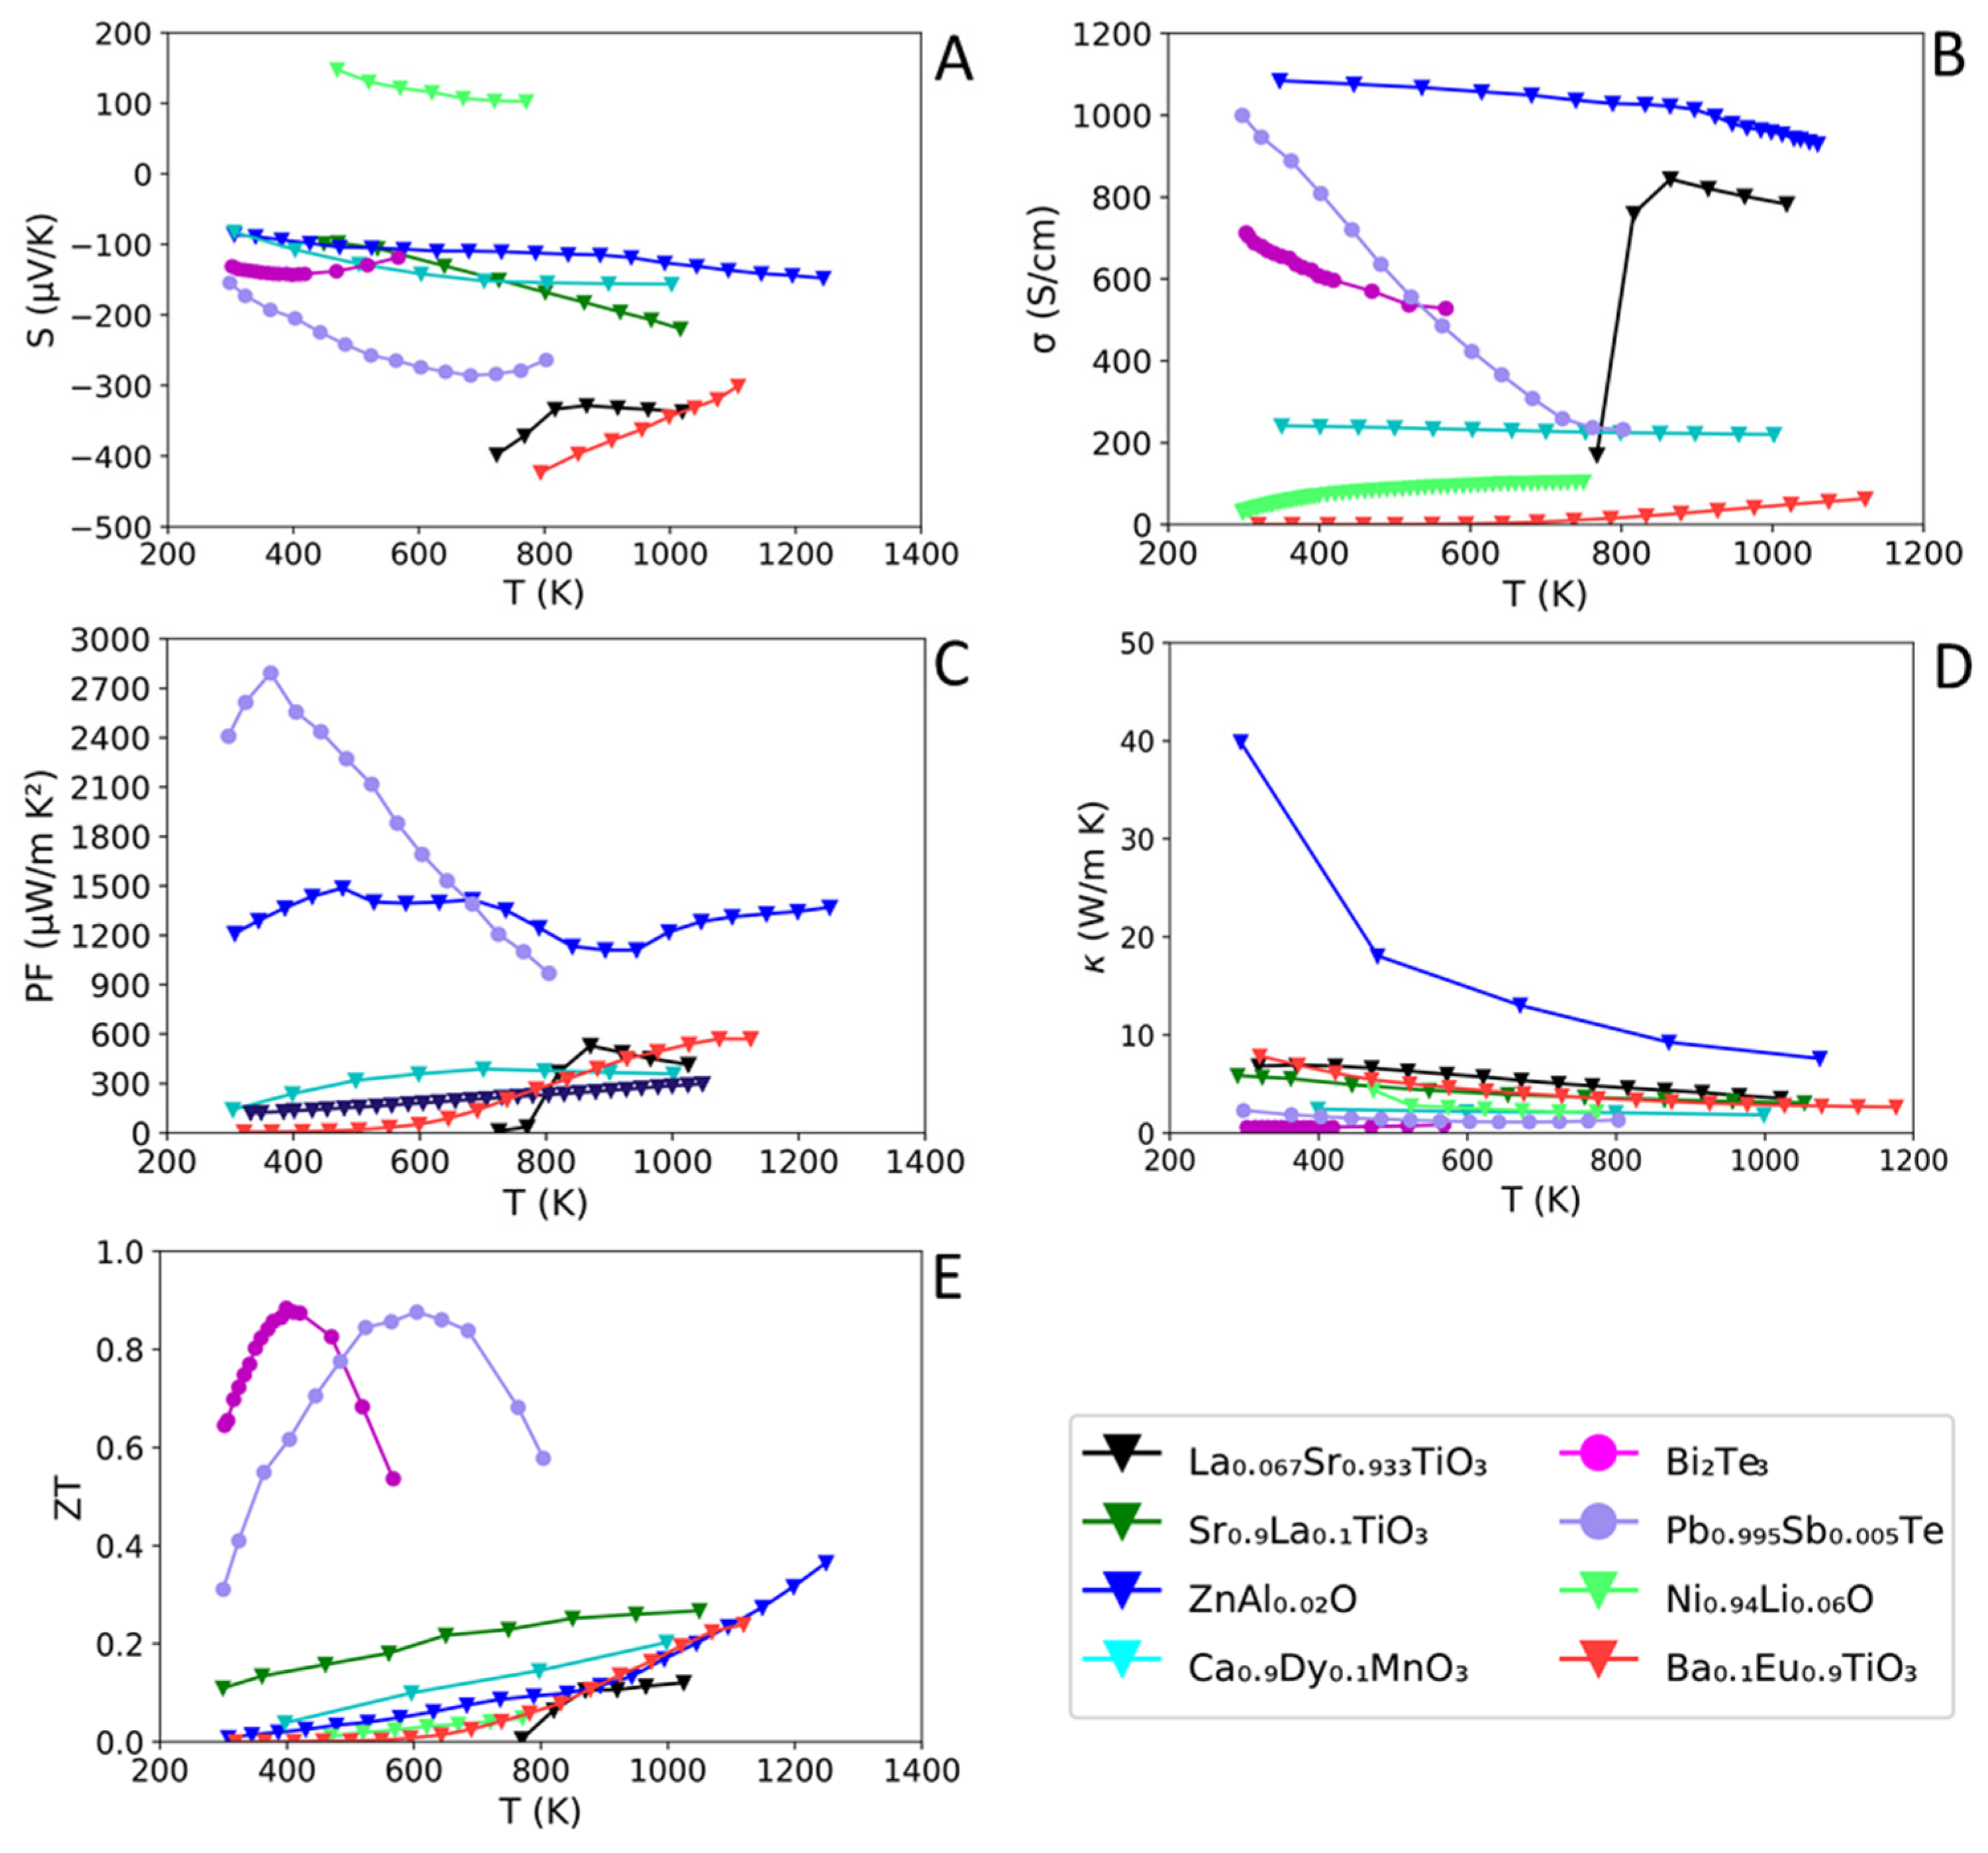
2.2. Inorganic TE Materials Used in Inorganic/Polymer Composites
| Material | T (K) | S (µV K−1) | PF (µW m−1 K−2) | ZTmax | ||
|---|---|---|---|---|---|---|
| n-type conventional inorganic materials | ||||||
| Pb0.995Sb0.005Te [74] | 600 | ~210 † | ~−280 | ~1692 | ~1.15 | ~0.87 |
| Pb0.995Sb0.005Te [74] | 300 | 1000 | ~−157 | ~2410 | ~2.31 | ~0.32 |
| Bi2Te3 [75] | 400 | ~608 | ~−143 | ~−1249 † | ~0.59 | 0.88 |
| Bi2Te3 [76] | 325 | ~483 | ~−141 | ~960 | ~1.29 | ~0.25 |
| n-type oxide inorganic materials | ||||||
| La0.1Sr0.9TiO3 [77] | 1050 | ~80 (950 K) * | ~−289 | ~668 † | ~3.10 | ~0.27 |
| La0.067Sr0.933TiO3 [31] | 1023 | ~35 † | ~−340 | ~416 | ~3.55 | ~0.12 |
| Ba0.1Eu0.9TiO3–δ [39] | 1123 | 63 | −300 | ~570 | ~2.70 | ~0.24 |
| Zn0.998Al0.02O [23] | 1247 | ~630 | ~−150 | ~1370 | ~7.60 (1073 K) * | ~0.37 |
| p-type oxide inorganic materials | ||||||
| Ca2.93Sr0.07Co4O9 [78] | 1047 | ~62 | ~219 | ~298 | - | - |
| Ni0.94Li0.06O [79] | 770 | ~104 | ~103 | ~110 † | ~2.19 | ~0.05 |
2.3. Inorganic/Carbon TE Composites
| Carbon Composite | T (K) | S (µV K−1) | PF (µW m−1 K−2) | ZTmax | ||
|---|---|---|---|---|---|---|
| n-type inorganic/carbon composites | ||||||
| G (0.5 wt. %)/SrTi0.85Nb0.15O3 [98] | 1047 | ~1193 | ~−187.00 | ~4237 | ~3.13 | 1.42 |
| G (1.0 wt. %)/La0.07Sr0.93Ti0.93Nb0.07O3 [99] | 1023 | ~572 | ~−193 | ~2147 | ~3.14 | ~0.68 |
| Gr (1.5 wt. %)/Bi2Te3 [100] | 495 | ~734 | ~−124 | ~1130 † | ~1.04 | ~0.55 |
| Gr (0.6 wt. %)/La0.067Sr0.9TiO3 [31] | 315 | ~1780 | ~−117 | ~2500 | ~1.80 | 0.42 |
| Gr (3.0 wt. %)/PbTe [101] | 300 | ~234 | ~−200 | ~936 | ~0.93 | ~0.30 |
| SWCNT (0.5 wt. %) (0.7–1.4 nm, 0.5–2 µm)/Bi2Te3 [102] | 300 | ~200 | −231.2 | ~1069 | 1.20 | ~0.27 |
| Gr (1.0 wt. %)/Sr0.8La0.067Ti0.8Nb0.2O3-δ [32] | 1000 | ~238 | ~−173 | - | ~2.8 | 0.25 |
| CNT (10 wt. %)/TiO2 [103] | 300 | 0.71 | −552.8 | 21.5 | 2.43 | 3.04 × 10⁻³ |
| p-type inorganic/carbon composites | ||||||
| CNT (0.05 wt. %)/PbTe [104] | 325 | ~123 | ~308 | ~1163 | ~0.88 | ~0.42 |
| Graphene/Cement/Fe2O3 [105] | 343 | ~8 | 107 | 9.5 | ~0.66 | 5 × 10⁻³ |
| Graphene/Cement/ZnO [105] | 343 | ~14 | 141 | 28 | ~1.02 | 1.01 × 10⁻² |
| Graphene/Cement/MnO2 [105] | 338 | ~6 | 99.5 | 5.5 | ~0.95 | 2 × 10⁻³ |
3. Polymer Thermoelectric Materials
3.1. State-of-the-Art Polymer TE Materials
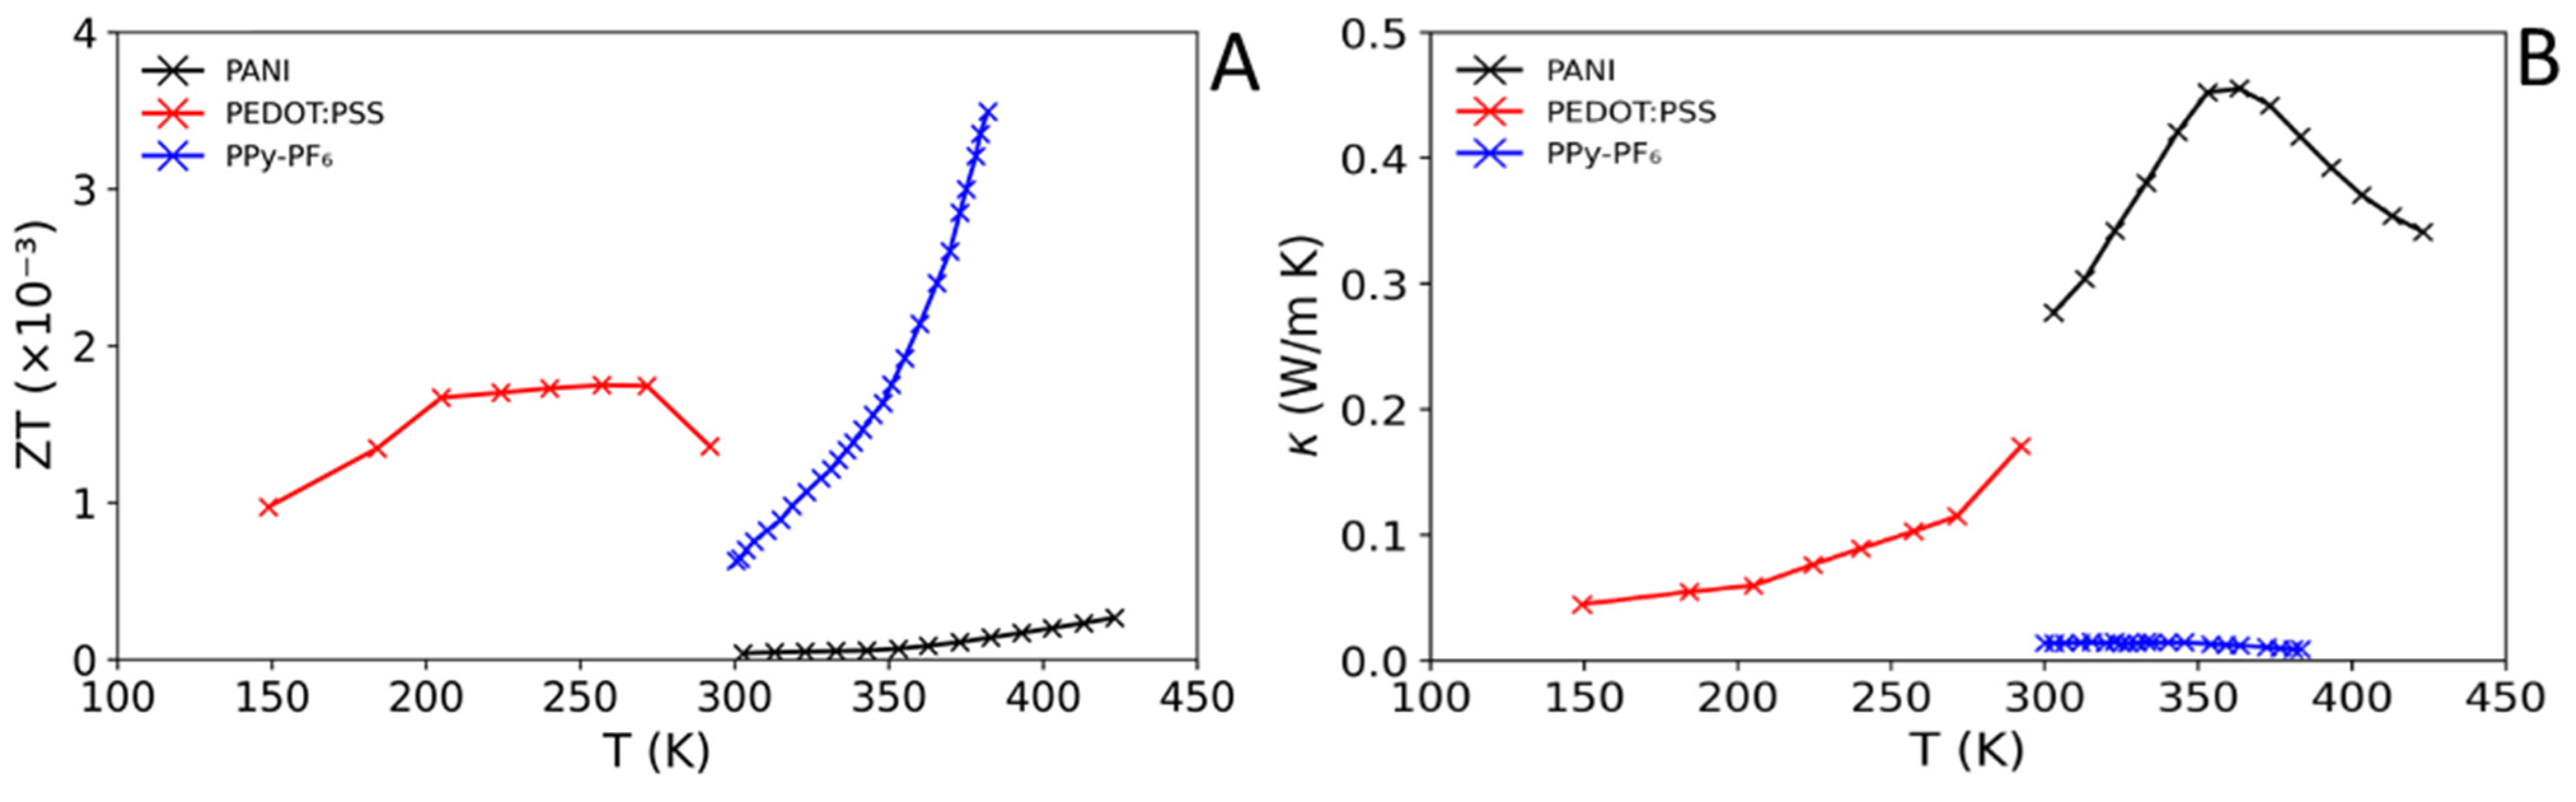
3.2. Polymer TE Materials Used in Inorganic/Polymer Composites
| Polymer | T (K) | S (µV K−1) | PF (µW m−1 K−2) | ZTmax | Polymer Class | ||
|---|---|---|---|---|---|---|---|
| PANI [129] | 423 | ~1.39 | ~40 | ~0.22 † | ~0.34 | 2.67 × 10⁻⁴ | N |
| PEDOT:PSS [130] | 270 | ~52 | ~12 | ~0.75 † | ~0.12 | 1.75 × 10⁻³ | PTh |
| PEDOT:PSS [131] | 298 | 1786 | 28.1 | 141 | - | - | PTh |
| PPy-PF6 [132] | 380 | 2.4 | 18.5 | 0.08 | 0.009 | 3.38 × 10⁻³ | NAr |
| PPy-Tos [132] | 380 | 20.7 | 14.9 | 0.46 | 0.18 | 0.97 × 10⁻³ | NAr |
| PPy [132] | 380 | 11.6 | 16.5 | 0.32 | 0.12 | 1.01 × 10⁻³ | |
| PPy-HCl [132] | 380 | 10.6 | 11.4 | 0.14 | 0.02 | 2.66 × 10⁻³ | NAr |
| P3HT/Li + TBP [133] | 333 | ~0.66 | 169 | 1.87 | - | - | PTh |
3.3. Polymer/Carbon TE Composites
| Composite | T (K) | S (µV K−1) | PF (µW m−1 K−2) | ZT | Polymer Class | ||
|---|---|---|---|---|---|---|---|
| p-type polymer/carbon composites | |||||||
| PVAc/CQDs-C60 (15:5 ratio) [139] | 300 | ~500 | ~65 | 210 | ~0.46 | 0.16 | - |
| PANI (80 wt. %)/4D-Gr [140] | 298 | ~394 | ~46 | ~82 | - | - | N |
| PANI (80 wt. %)/GO [141] | 298 | ~1500 | ~59 | ~521 | ~0.39 | ~0.40 | N |
| P3HT (92 wt. %)/SWCNT [142] | 298 | ~755 | ~51 | ~46 | ~0.13 | - | PTh |
| PEDOT-Tos-PPP (65 wt. %)/SWCNT [143] | 298 | 650 | 24.1 | 37.8 | ~0.4 | - | PTh |
| PANI (58 wt. %)/SWCNT [144] | 298 | 125 | 40 | 20 | ~1.44 | - | N |
| PVAc (98 wt. %)/CQD [145] | 298 | 30.3 | 71 | 15.2 | ~0.88 | 5 × 10⁻³ | - |
| PEDOT:PSS (50 wt. %)/GTNC [146] | 300 | ~890 | ~10 | ~8 | - | - | PTh |
| PANI (50 wt. %)/rGO [147] | 298 | ~18 | 32.64 | 2 | ~0.13 | 4.6 × 10⁻³ | N |
| PEDOT:PSS (85 wt. %/GQDs [148] | 298 | 71.2 | 14.6 | ~1.7 | - | PTh | |
| PVAc (60 wt. %)/SWCNT [149] | 300 | ~900 | ~40 | ~1.44 | ~0.25 | - | - |
| PVAc (5 wt. %)/Gr [150] | 300 | ~29 | ~21 | ~1.24 | - | - | - |
| P3HT (70 wt. %)/Gr [151] | 298 | ~2 | ~36 | ~0.8 | - | - | PTh |
| PEDOT:PSS (85 wt. %)/rGO [148] | 298 | ~64 | ~11 | ~0.74 | - | - | PTh |
| PEDOT:PSS (85 wt. %)/GO [148] | 298 | ~59 | ~7 | ~0.3 | - | - | PTh |
| PEDOT:PSS (97 wt. %)/rGO [152] | 300 | ~637 | ~27 | ~46 | - | - | PTh |
| PEDOT:PSS (40 wt. %)/DWCNT/TCPP [153] | 298 | ~960 | 70 | 500 | 0.12 | - | PTh |
| PTh (98.5 wt. %)/Gr [154] | 298 | 1.8 × 10⁻³ | - | - | ~0.79 | - | PTh |
| PANI/Gr/PANI/DWNT [155] | 298 | 1080 | 130 | 1825 | - | - | N |
| PANI/Gr-PEDOT:PSS/PANI/DWNT/PEDOT:PSS [156] | 298 | 1900 | 120 | 2710 | - | - | - |
| n-type polymer/carbon composites | |||||||
| PVAc (20 wt. %)/GTNC [146] | 300 | ~260 | −42 | 47 | 2.9 | 4.8 × 10⁻³ | - |

4. Inorganic/Polymer Composites
4.1. Conventional/Polymer Composites
4.2. Oxide/Polymer Composites

5. Conclusions
Author Contributions
Funding
Institutional Review Board Statement
Informed Consent Statement
Data Availability Statement
Conflicts of Interest
References
- UK DECC. Updated Energy and Emissions Projections 2013. Energy White Pap. 2013, 947, 1–51. [Google Scholar]
- UK BEIS. Energy Trends UK, July to September. 2020. Available online: https://www.gov.uk/government/statistics/energy-consumption-in-the-uk-2020 (accessed on 1 July 2022).
- Eurostat. Electricity Generation Statistics—First Results. 2019. Available online: https://ec.europa.eu/eurostat/statistics-explained/index.php?title=Electricity_and_heat_statistics (accessed on 1 July 2022).
- US Energy Information Administration (EIA). Country Analysis Executive Summary: China. 2020; pp. 1–18. Available online: https://www.eia.gov/international/analysis/country/CHN (accessed on 1 July 2022).
- US Energy Information Administration. Monthly Energy Review. January 2021. Available online: https://www.eia.gov/totalenergy/data/monthly/archive/00352001.pdf (accessed on 1 July 2022).
- BCS, Inc. Waste Heat Recovery: Technology Opportunities in the US Industry. 2008. Available online: https://www1.eere.energy.gov/manufacturing/intensiveprocesses/pdfs/waste_heat_recovery.pdf (accessed on 1 July 2022).
- Anatychuk, L.I.; Rozver, Y.Y.; Velichuk, D.D. Thermoelectric Generator for a Stationary Diesel Plant. J. Electron. Mater. 2011, 40, 1206–1208. [Google Scholar] [CrossRef]
- Orr, B.; Akbarzadeh, A. Prospects of Waste Heat Recovery and Power Generation Using Thermoelectric Generators. Energy Procedia 2017, 110, 250–255. [Google Scholar] [CrossRef]
- Jaziri, N.; Boughamoura, A.; Müller, J.; Mezghani, B.; Tounsi, F.; Ismail, M. A Comprehensive Review of Thermoelectric Generators: Technologies and Common Applications. Energy Rep. 2019, 6, 264–287. [Google Scholar] [CrossRef]
- Leonov, V. Simulation of Maximum Power in the Wearable Thermoelectric Generator with a Small Thermopile. Microsyst. Technol. 2011, 17, 495–504. [Google Scholar] [CrossRef]
- Gusev, V.V.; Pustovalov, A.A.; Rybkin, N.N.; Anatychuk, L.I.; Demchuk, B.N.; Ludchak, I.Y. Milliwatt-Power Radioisotope Thermoelectric Generator (RTG) Based on Plutonium-238. J. Electron. Mater. 2011, 40, 807–811. [Google Scholar] [CrossRef]
- Hamid Elsheikh, M.; Shnawah, D.A.; Sabri, M.F.M.; Said, S.B.M.; Haji Hassan, M.; Ali Bashir, M.B.; Mohamad, M. A Review on Thermoelectric Renewable Energy: Principle Parameters That Affect Their Performance. Renew. Sustain. Energy Rev. 2014, 30, 337–355. [Google Scholar] [CrossRef]
- Tritt, T.M.; Subramanian, M.A. Thermoelectric Materials, Phenomena, and Applications: A Bird’s Eye View. MRS Bull. 2019, 31, 188–198. [Google Scholar] [CrossRef] [Green Version]
- Riffat, S.B.; Ma, X. Thermoelectrics: A Review of Present and Potential Applications. Appl. Therm. Eng. 2003, 23, 913–935. [Google Scholar] [CrossRef]
- Snyder, G.J.; Toberer, E.S. Complex Thermoelectric Materials. Nat. Mater. 2008, 7, 104–114. [Google Scholar] [CrossRef] [Green Version]
- Jin, Z.H. Energy Efficiency of Thermoelectric Materials: A Three-Dimensional Study. J. Appl. Phys. 2019, 126, 085108. [Google Scholar] [CrossRef]
- Vaqueiro, P.; Powell, A.V. Recent Developments in Nanostructured Materials for High-Performance Thermoelectrics. J. Mater. Chem. 2010, 20, 9577–9584. [Google Scholar] [CrossRef] [Green Version]
- Lalonde, A.D.; Pei, Y.; Wang, H.; Snyder, G.J. Lead Telluride Alloy Thermoelectrics. Mater. Today 2011, 14, 526–532. [Google Scholar] [CrossRef]
- Chivers, T.; Laitinen, R.S. Tellurium: A Maverick among the Chalcogens. Chem. Soc. Rev. 2015, 44, 1725–1739. [Google Scholar] [CrossRef] [PubMed]
- Feng, Y.; Jiang, X.; Ghafari, E.; Kucukgok, B.; Zhang, C.; Ferguson, I.; Lu, N. Metal Oxides for Thermoelectric Power Generation and Beyond. Adv. Compos. Hybrid Mater. 2018, 1, 114–126. [Google Scholar] [CrossRef]
- Fergus, J.W. Oxide Materials for High Temperature Thermoelectric Energy Conversion. J. Eur. Ceram. Soc. 2012, 32, 525–540. [Google Scholar] [CrossRef]
- Prasad, R.; Bhame, S.D. Review on Texturization Effects in Thermoelectric Oxides. Mater. Renew. Sustain. Energy 2020, 9, 3. [Google Scholar] [CrossRef] [Green Version]
- Ohtaki, M.; Araki, K.; Yamamoto, K. High Thermoelectric Performance of Dually Doped ZnO Ceramics. J. Electron. Mater. 2009, 38, 1234–1238. [Google Scholar] [CrossRef]
- Fujita, K.; Mochida, T.; Nakamura, K. High-Temperature Thermoelectric Properties of NaxCoO2-δ Single Crystals. Jpn. J. Appl. Phys. 2001, 40, 4644–4647. [Google Scholar] [CrossRef]
- Kikuchi, A.; Okinaka, N.; Akiyama, T. A Large Thermoelectric Figure of Merit of La-Doped SrTiO3 Prepared by Combustion Synthesis with Post-Spark Plasma Sintering. Scr. Mater. 2010, 63, 407–410. [Google Scholar] [CrossRef] [Green Version]
- Wang, Y.; Sui, Y.; Fan, H.; Wang, X.; Su, Y.; Su, W.; Liu, X. High Temperature Thermoelectric Response of Electron-Doped CaMnO. Chem. Mater. 2009, 21, 4653–4660. [Google Scholar] [CrossRef]
- Srivastava, D.; Norman, C.; Azough, F.; Schäfer, M.C.; Guilmeau, E.; Freer, R. Improving the Thermoelectric Properties of SrTiO3-Based Ceramics with Metallic Inclusions. J. Alloys Compd. 2018, 731, 723–730. [Google Scholar] [CrossRef]
- Korotcenkov, G.; Brinzari, V.; Ham, M.H. In2O3-Based Thermoelectric Materials: The State of the Art and the Role of Surface State in the Improvement of the Efficiency of Thermoelectric Conversion. Crystals 2018, 8, 14. [Google Scholar] [CrossRef] [Green Version]
- Orr, B.; Akbarzadeh, A.; Mochizuki, M.; Singh, R. A Review of Car Waste Heat Recovery Systems Utilising Thermoelectric Generators and Heat Pipes. Appl. Therm. Eng. 2016, 101, 490–495. [Google Scholar] [CrossRef]
- Mutka, H.; Koza, M.M.; Johnson, M.R.; Hiroi, Z.; Yamaura, J.I.; Nagao, Y. Generalized Density-of-States and Anharmonicity of the Low-Energy Phonon Bands from Coherent Inelastic Neutron Scattering Response in the Pyrochlore Osmates a Os2O6 (A = K, Rb, Cs). Phys. Rev. B—Condens. Matter Mater. Phys. 2008, 78, 104307. [Google Scholar] [CrossRef]
- Lin, Y.; Norman, C.; Srivastava, D.; Azough, F.; Wang, L.; Robbins, M.; Simpson, K.; Freer, R.; Kinloch, I.A. Thermoelectric Power Generation from Lanthanum Strontium Titanium Oxide at Room Temperature through the Addition of Graphene. ACS Appl. Mater. Interfaces 2015, 7, 15898–15908. [Google Scholar] [CrossRef]
- Srivastava, D.; Norman, C.; Azough, F.; Ekren, D.; Chen, K.; Reece, M.J.; Kinloch, I.A.; Freer, R. Anisotropy and Enhancement of Thermoelectric Performance of Sr0.8La0.067Ti0.8Nb0.2O3-δ Ceramics by Graphene Additions. J. Mater. Chem. A 2019, 7, 24602–24613. [Google Scholar] [CrossRef] [Green Version]
- Papapetrou, M.; Kosmadakis, G.; Cipollina, A.; La Commare, U.; Micale, G. Industrial Waste Heat: Estimation of the Technically Available Resource in the EU per Industrial Sector, Temperature Level and Country. Appl. Therm. Eng. 2018, 138, 207–216. [Google Scholar] [CrossRef]
- Dolyniuk, J.A.; Owens-Baird, B.; Wang, J.; Zaikina, J.V.; Kovnir, K. Clathrate Thermoelectrics. Mater. Sci. Eng. R Rep. 2016, 108, 1–46. [Google Scholar] [CrossRef] [Green Version]
- Liu, K.F.; Xia, S.Q. Recent Progresses on Thermoelectric Zintl Phases: Structures, Materials and Optimization. J. Solid State Chem. 2019, 270, 252–264. [Google Scholar] [CrossRef]
- Pourkiaei, S.M.; Ahmadi, M.H.; Sadeghzadeh, M.; Moosavi, S.; Pourfayaz, F.; Chen, L.; Pour Yazdi, M.A.; Kumar, R. Thermoelectric Cooler and Thermoelectric Generator Devices: A Review of Present and Potential Applications, Modeling and Materials. Energy 2019, 186, 115849. [Google Scholar] [CrossRef]
- Wei, J.; Yang, L.; Ma, Z.; Song, P.; Zhang, M.; Ma, J.; Yang, F.; Wang, X. Review of Current High-ZT Thermoelectric Materials. J. Mater. Sci. 2020, 55, 12642–12704. [Google Scholar] [CrossRef]
- Koshibae, W.; Tsutsui, K.; Maekawa, S. Thermopower in Cobalt Oxides. Phys. Rev. B—Condens. Matter Mater. Phys. 2000, 62, 6869–6872. [Google Scholar] [CrossRef]
- Xiao, X.; Widenmeyer, M.; Xie, W.; Zou, T.; Yoon, S.; Scavini, M.; Checchia, S.; Zhong, Z.; Hansmann, P.; Kilper, S.; et al. Tailoring the Structure and Thermoelectric Properties of BaTiO3: Via Eu2+ Substitution. Phys. Chem. Chem. Phys. 2017, 19, 13469–13480. [Google Scholar] [CrossRef] [PubMed]
- Sagarna, L.; Rushchanskii, K.Z.; Maegli, A.; Yoon, S.; Populoh, S.; Shkabko, A.; Pokrant, S.; Ležaić, M.; Waser, R.; Weidenkaff, A. Structure and Thermoelectric Properties of EuTi(O,N)3±δ. J. Appl. Phys. 2013, 114, 033701. [Google Scholar] [CrossRef] [Green Version]
- Tsai, Y.F.; Wei, P.C.; Chang, L.; Wang, K.K.; Yang, C.C.; Lai, Y.C.; Hsing, C.R.; Wei, C.M.; He, J.; Snyder, G.J.; et al. Compositional Fluctuations Locked by Athermal Transformation Yielding High Thermoelectric Performance in GeTe. Adv. Mater. 2021, 33, 2005612. [Google Scholar] [CrossRef]
- Zhao, L.D.; Lo, S.H.; Zhang, Y.; Sun, H.; Tan, G.; Uher, C.; Wolverton, C.; Dravid, V.P.; Kanatzidis, M.G. Ultralow Thermal Conductivity and High Thermoelectric Figure of Merit in SnSe Crystals. Nature 2014, 508, 373–377. [Google Scholar] [CrossRef]
- Zhong, B.; Zhang, Y.; Li, W.; Chen, Z.; Cui, J.; Xie, Y.; Hao, Q.; He, Q. High Superionic Conduction Arising from Aligned Large Lamellae and Large Figure of Merit in Bulk Cu1.94Al0.02Se. Appl. Phys. Lett. 2014, 105, 123902. [Google Scholar] [CrossRef]
- Tan, G.; Fengyuan, S.; Hoa, S.; Zhao, L.-D.; Chi, H.; Zhang, X.; Uher, C.; Wolverton, C.; Kanatzidis, V.P.; Dravid, M.G. Non-Equilibrium Processing Leads to Record High Thermoelectric Figure of Merit in PbTe–SrTe. Nat. Commun. 2016, 7, 12167. [Google Scholar] [CrossRef]
- Li, J.; Zhang, X.; Chen, Z.; Lin, S.; Li, W.; Shen, J.; Witting, I.T.; Faghaninia, A.; Chen, Y.; Jain, A.; et al. Low-Symmetry Rhombohedral GeTe Thermoelectrics. Joule 2018, 2, 976–987. [Google Scholar] [CrossRef]
- Fu, T.; Yue, X.; Wu, H.; Fu, C.; Zhu, T.; Liu, X.; Hu, L.; Ying, P.; He, J.; Zhao, X. Enhanced Thermoelectric Performance of PbTe Bulk Materials with Figure of Merit ZT >2 by Multi-Functional Alloying. J. Mater. 2016, 2, 141–149. [Google Scholar] [CrossRef]
- Xie, W.; Tang, X.; Yan, Y.; Zhang, Q.; Tritt, T.M. Unique Nanostructures and Enhanced Thermoelectric Performance of Melt-Spun BiSbTe Alloys. Appl. Phys. Lett. 2009, 94, 102111. [Google Scholar] [CrossRef]
- Liu, Y.; Zhao, L.D.; Zhu, Y.; Liu, Y.; Li, F.; Yu, M.; Liu, D.B.; Xu, W.; Lin, Y.H.; Nan, C.W. Synergistically Optimizing Electrical and Thermal Transport Properties of BiCuSeO via a Dual-Doping Approach. Adv. Energy Mater. 2016, 6, 1502423. [Google Scholar] [CrossRef]
- Hu, L.P.; Zhu, T.J.; Wang, Y.G.; Xie, H.H.; Xu, Z.J.; Zhao, X.B. Shifting up the Optimum Figure of Merit of p-Type Bismuth Telluride-Based Thermoelectric Materials for Power Generation by Suppressing Intrinsic Conduction. NPG Asia Mater. 2014, 6, e88. [Google Scholar] [CrossRef] [Green Version]
- Chang, C.; Wu, M.; He, D.; Pei, Y.; Wu, C.F.; Wu, X.; Yu, H.; Zhu, F.; Wang, K.; Chen, Y.; et al. 3D Charge and 2D Phonon Transports Leading to High Out-of-Plane ZT in n-Type SnSe Crystals. Science 2018, 360, 778–783. [Google Scholar] [CrossRef] [Green Version]
- Zhang, J.; Wu, D.; He, D.; Feng, D.; Yin, M.; Qin, X.; He, J. Extraordinary Thermoelectric Performance Realized in n-Type PbTe through Multiphase Nanostructure Engineering. Adv. Mater. 2017, 29, 1703148. [Google Scholar] [CrossRef]
- Chen, X.; Wu, H.; Cui, J.; Xiao, Y.; Zhang, Y.; He, J.; Chen, Y.; Cao, J.; Cai, W.; Pennycook, S.J.; et al. Extraordinary Thermoelectric Performance in n-Type Manganese Doped Mg3Sb2 Zintl: High Band Degeneracy, Tuned Carrier Scattering Mechanism and Hierarchical Microstructure. Nano Energy 2018, 52, 246–255. [Google Scholar] [CrossRef]
- Shi, X.; Yang, J.; Salvador, J.R.; Chi, M.; Cho, J.Y.; Wang, H.; Bai, S.; Yang, J.; Zhang, W.; Chen, L. Multiple-Filled Skutterudites: High Thermoelectric Figure of Merit through Separately Optimizing Electrical and Thermal Transports. J. Am. Chem. Soc. 2011, 133, 7837–7846. [Google Scholar] [CrossRef]
- Jiang, B.; Liu, X.; Wang, Q.; Cui, J.; Jia, B.; Zhu, Y.; Feng, J.; Qiu, Y.; Gu, M.; Ge, Z.; et al. Realizing High-Efficiency Power Generation in Low-Cost PbS-Based Thermoelectric Materials. Energy Environ. Sci. 2020, 13, 579–591. [Google Scholar] [CrossRef]
- Ge, Z.H.; Qiu, Y.; Chen, Y.X.; Chong, X.; Feng, J.; Liu, Z.K.; He, J. Multipoint Defect Synergy Realizing the Excellent Thermoelectric Performance of n-Type Polycrystalline SnSe via Re Doping. Adv. Funct. Mater. 2019, 29, 1902893. [Google Scholar] [CrossRef]
- Zhu, B.; Liu, X.; Wang, Q.; Qiu, Y.; Shu, Z.; Guo, Z.; Tong, Y.; Cui, J.; Gu, M.; He, J. Realizing Record High Performance in n-Type Bi2Te3-Based Thermoelectric Materials. Energy Environ. Sci. 2020, 13, 2106–2114. [Google Scholar] [CrossRef]
- Kato, K.; Hatasako, Y.; Uchino, M.; Nakata, Y.; Suzuki, Y.; Hayakawa, T.; Adachi, C.; Miyazaki, K. Flexible Porous Bismuth Telluride Thin Films with Enhanced Figure of Merit Using Micro-Phase Separation of Block Copolymer. Adv. Mater. Interfaces 2014, 1, 1300015. [Google Scholar] [CrossRef]
- Saiga, Y.; Du, B.; Deng, S.K.; Kajisa, K.; Takabatake, T. Thermoelectric Properties of Type-VIII Clathrate Ba8Ga16Sn30 Doped with Cu. J. Alloys Compd. 2012, 537, 303–307. [Google Scholar] [CrossRef]
- Van Du, N.; Rahman, J.U.; Meang, E.J.; Lim, C.H.; Shin, W.H.; Seo, W.S.; Huy, P.T.; Kim, M.H.; Lee, S. Synthesis and Thermoelectric Properties of Ti-Substituted (Hf0.5Zr0.5)1-XTixNiSn0.998Sb0.002 Half-Heusler Compounds. J. Alloys Compd. 2019, 773, 1141–1145. [Google Scholar] [CrossRef]
- Le Lan, J.; Liu, Y.C.; Zhan, B.; Lin, Y.H.; Zhang, B.; Yuan, X.; Zhang, W.; Xu, W.; Nan, C.W. Enhanced Thermoelectric Properties of Pb-Doped BiCuSeO Ceramics. Adv. Mater. 2013, 25, 5086–5090. [Google Scholar] [CrossRef]
- Funahashi, R.; Shikano, M. Bi2Sr2Co2Oy Whiskers with High Thermoelectric Figure of Merit. Appl. Phys. Lett. 2002, 81, 1459–1461. [Google Scholar] [CrossRef]
- Van Nong, N.; Pryds, N.; Linderoth, S.; Ohtaki, M. Enhancement of the Thermoelectric Performance of p-Type Layered Oxide Ca3Co4O9+δ through Heavy Doping and Metallic Nanoinclusions. Adv. Mater. 2011, 23, 2484–2490. [Google Scholar] [CrossRef] [PubMed]
- Torres, M.A.; Costa, F.M.; Flahaut, D.; Touati, K.; Rasekh, S.; Ferreira, N.M.; Allouche, J.; Depriester, M.; Madre, M.A.; Kovalevsky, A.V.; et al. Significant Enhancement of the Thermoelectric Performance in Ca3Co4O9 Thermoelectric Materials through Combined Strontium Substitution and Hot-Pressing Process. J. Eur. Ceram. Soc. 2019, 39, 1186–1192. [Google Scholar] [CrossRef] [Green Version]
- Liu, K.K.; Liu, Z.Y.; Zhang, F.P.; Zhang, J.X.; Yang, X.Y.; Zhang, J.W.; Shi, J.L.; Ren, G.; He, T.W.; Duan, J.J. Improved Thermoelectric Performance in Pr and Sr Co-Doped CaMnO3 Materials. J. Alloys Compd. 2019, 808, 151476. [Google Scholar] [CrossRef]
- Ahmad, A.; Hussain, M.; Zhou, Z.; Liu, R.; Lin, Y.H.; Nan, C.W. Thermoelectric Performance Enhancement of Vanadium Doped n-Type In2O3 Ceramics via Carrier Engineering and Phonon Suppression. ACS Appl. Energy Mater. 2020, 3, 1552–1558. [Google Scholar] [CrossRef]
- Liu, H.; Ma, H.; Wang, C.; Wang, F.; Liu, B.; Chen, J.; Ji, G.; Zhang, Y.; Jia, X. Enhanced, Thermoelectric Properties of Nonstoichiometric TiO1.76 with Excellent Mechanical Properties Induced by Optimizing Processing Parameters. Ceram. Int. 2018, 44, 19859–19865. [Google Scholar] [CrossRef]
- Rubenis, K.; Populoh, S.; Thiel, P.; Yoon, S.; Müller, U.; Locs, J. Thermoelectric Properties of Dense Sb-Doped SnO2 ceramics. J. Alloys Compd. 2017, 692, 515–521. [Google Scholar] [CrossRef]
- Wu, J.; Cao, J.; Han, W.Q.; Janotti, A.; Kim, H.C. Functional Metal Oxide Nanostructures; Springer: New York, UK, USA, 2012; Volume 149. [Google Scholar] [CrossRef]
- Dutta, M.; Sarkar, D.; Biswas, K. Intrinsically Ultralow Thermal Conductive Inorganic Solids for High Thermoelectric Performance. Chem. Commun. 2021, 57, 4751–4767. [Google Scholar] [CrossRef] [PubMed]
- Karppinen, M.; Fjellvåg, H.; Konno, T.; Morita, Y.; Motohashi, T.; Yamauchi, H. Evidence for Oxygen Vacancies in Misfit-Layered Calcium Cobalt Oxide, [CoCa2O3]qCoO2. Chem. Mater. 2004, 16, 2790–2793. [Google Scholar] [CrossRef]
- Assadi, M.H.N. Theoretical and Experimental Surveys of Doped Thermoelectric NaxCoO2 BT—Surfaces and Interfaces of Metal Oxide Thin Films, Multilayers, Nanoparticles and Nano-Composites. In Memory of Prof. Dr. Hanns-Ulrich Habermeier; Roca, A.G., Mele, P., Kijima-Aoki, H., Fantechi, E., Vejpravova, J.K., Kalbac, M., Kaneko, S., Endo, T., Eds.; Springer International Publishing: Cham, Switzerland, 2021; pp. 265–279. [Google Scholar] [CrossRef]
- Baran, J.D.; Kepaptsoglou, D.; Molinari, M.; Kulwongwit, N.; Azough, F.; Freer, R.; Ramasse, Q.M.; Parker, S.C. Role of Structure and Defect Chemistry in High-Performance Thermoelectric Bismuth Strontium Cobalt Oxides. Chem. Mater. 2016, 28, 7470–7478. [Google Scholar] [CrossRef] [Green Version]
- Baran, J.D.; Molinari, M.; Kulwongwit, N.; Azough, F.; Freer, R.; Kepaptsoglou, D.; Ramasse, Q.M.; Parker, S.C. Tuning Thermoelectric Properties of Misfit Layered Cobaltites by Chemically Induced Strain. J. Phys. Chem. C 2015, 119, 21818–21827. [Google Scholar] [CrossRef]
- Sun, H.; Yu, F.; Zhao, P.; Wang, B.; Cai, B.; Zhang, L.; Yu, D.; Tian, Y.; Xu, B. Thermoelectric Performance of Single Elemental Doped n-Type PbTe Regulated by Carrier Concentration. J. Alloys Compd. 2019, 787, 180–185. [Google Scholar] [CrossRef]
- Yang, L.; Chen, Z.G.; Hong, M.; Han, G.; Zou, J. Enhanced Thermoelectric Performance of Nanostructured Bi2Te3 through Significant Phonon Scattering. ACS Appl. Mater. Interfaces 2015, 7, 23694–23699. [Google Scholar] [CrossRef]
- Kumar, S.; Chaudhary, D.; Khare, N. Enhanced Thermoelectric Figure of Merit in Bi2Te3-CNT-PEDOT Nanocomposite by Introducing Conducting Interfaces in Bi2Te3 Nanostructures. APL Mater. 2019, 7, 081123. [Google Scholar] [CrossRef]
- Muta, H.; Kurosaki, K.; Yamanaka, S. Thermoelectric Properties of Rare Earth Doped SrTiO3. J. Alloys Compd. 2003, 350, 292–295. [Google Scholar] [CrossRef]
- Constantinescu, G.; Rasekh, S.; Torres, M.A.; Diez, J.C.; Madre, M.A.; Sotelo, A. Effect of Sr Substitution for Ca on the Ca3Co4O9 Thermoelectric Properties. J. Alloys Compd. 2013, 577, 511–515. [Google Scholar] [CrossRef] [Green Version]
- Liu, S.; Wang, J.; Jia, J.; Hu, X.; Liu, S. Synthesis and Thermoelectric Performance of Li-Doped NiO Ceramics. Ceram. Int. 2012, 38, 5023–5026. [Google Scholar] [CrossRef]
- Hébert, S.; Berthebaud, D.; Daou, R.; Bréard, Y.; Pelloquin, D.; Guilmeau, E.; Gascoin, F.; Lebedev, O.; Maignan, A. Searching for New Thermoelectric Materials: Some Examples among Oxides, Sulfides and Selenides. J. Phys. Condens. Matter 2016, 28, 013001. [Google Scholar] [CrossRef] [PubMed]
- Maznev, A.A.; Wright, O.B. Demystifying Umklapp vs Normal Scattering in Lattice Thermal Conductivity. Am. J. Phys. 2014, 82, 1062–1066. [Google Scholar] [CrossRef]
- Rahim, W.; Skelton, J.M.; Scanlon, D.O. α-Bi2Sn2O7 :A Potential Room Temperature n-Type Oxide Thermoelectric. J. Mater. Chem. A 2020, 8, 16405–16420. [Google Scholar] [CrossRef]
- Wang, J.; Mu, X.; Sun, M. The Thermal, Electrical and Thermoelectric Properties of Graphene Nanomaterials. Nanomaterials 2019, 9, 218. [Google Scholar] [CrossRef] [Green Version]
- Yun, J.-S.; Choi, S.; Im, S.H. Advances in Carbon-Based Thermoelectric Materials for High-Performance, Flexible Thermoelectric Devices. Carbon Energy 2021, 3, 667–708. [Google Scholar] [CrossRef]
- Okhay, O.; Tkach, A. Impact of Graphene or Reduced Graphene Oxide on Performance of Thermoelectric Composites. C 2021, 7, 37. [Google Scholar] [CrossRef]
- El-Makaty, F.M.; Ahmed, H.K.; Youssef, K.M. Review: The Effect of Different Nanofiller Materials on the Thermoelectric Behavior of Bismuth Telluride. Mater. Des. 2021, 209, 109974. [Google Scholar] [CrossRef]
- Alsalama, M.M.; Hamoudi, H.; Abdala, A.; Ghouri, Z.K.; Youssef, K.M. Enhancement of Thermoelectric Properties of Layered Chalcogenide Materials. Rev. Adv. Mater. Sci. 2020, 59, 371–378. [Google Scholar] [CrossRef]
- Balandin, A.A. Thermal Properties of Graphene and Nanostructured Carbon Materials. Nat. Mater. 2011, 10, 569–581. [Google Scholar] [CrossRef] [PubMed] [Green Version]
- Sang, M.; Shin, J.; Kim, K.; Yu, K.J. Electronic and Thermal Properties of Graphene and Recent Advances in Graphene Based Electronics Applications. Nanomaterials 2019, 9, 374. [Google Scholar] [CrossRef] [PubMed] [Green Version]
- Dresselhaus, M.S.; Dresselhaus, G.; Charlier, J.C.; Hernández, E. Electronic, Thermal and Mechanical Properties of Carbon Nanotubes. Philos. Trans. R. Soc. A Math. Phys. Eng. Sci. 2004, 362, 2065–2098. [Google Scholar] [CrossRef]
- Zhang, W.; Zhu, Z.; Wang, F.; Wang, T.; Sun, L.; Wang, Z. Chirality Dependence of the Thermal Conductivity of Carbon Nanotubes. Nanotechnology 2004, 15, 936–939. [Google Scholar] [CrossRef] [Green Version]
- Marconnet, A.M.; Panzer, M.A.; Goodson, K.E. Thermal Conduction Phenomena in Carbon Nanotubes and Related Nanostructured Materials. Rev. Mod. Phys. 2013, 85, 1295–1326. [Google Scholar] [CrossRef] [Green Version]
- Tlili, I.; Alkanhal, T.A.; Barzinjy, A.A.; Dara, R.N.; Shafee, A.; Li, Z. Investigation of Thermal Characteristics of Carbon Nanotubes: Measurement and Dependence. J. Mol. Liq. 2019, 294, 111564. [Google Scholar] [CrossRef]
- Kundalwal, S.I.; Suresh Kumar, R.; Ray, M.C. Effective Thermal Conductivities of a Novel Fuzzy Carbon Fiber Heat Exchanger Containing Wavy Carbon Nanotubes. Int. J. Heat Mass Transf. 2014, 72, 440–451. [Google Scholar] [CrossRef]
- Lin, Y.; Dylla, M.T.; Kuo, J.J.; Male, J.P.; Kinloch, I.A.; Freer, R.; Snyder, G.J. Graphene/Strontium Titanate: Approaching Single Crystal–like Charge Transport in Polycrystalline Oxide Perovskite Nanocomposites through Grain Boundary Engineering. Adv. Funct. Mater. 2020, 30, 1910079. [Google Scholar] [CrossRef] [Green Version]
- Rahman, J.U.; Van Du, N.; Nam, W.H.; Shin, W.H.; Lee, K.H.; Seo, W.S.; Kim, M.H.; Lee, S. Grain Boundary Interfaces Controlled by Reduced Graphene Oxide in Nonstoichiometric SrTiO3-δ Thermoelectrics. Sci. Rep. 2019, 9, 8624. [Google Scholar] [CrossRef]
- Muller, D.A.; Nakagawa, N.; Ohtomo, A.; Grazul, J.L.; Hwang, H.Y. Atomic-Scale Imaging of Nanoengineered Oxygen Vacancy Profiles in SrTiO3. Nature 2004, 430, 657–661. [Google Scholar] [CrossRef]
- Acharya, M.; Jana, S.S.; Ranjan, M.; Maiti, T. High Performance (ZT>1) n-Type Oxide Thermoelectric Composites from Earth Abundant Materials. Nano Energy 2021, 84, 105905. [Google Scholar] [CrossRef]
- Jana, S.S.; Maiti, T. Enhanced Thermoelectric Performance in Oxide Composites of La and Nb Codoped SrTiO3 by Using Graphite as the Electron Mobility Booster. ACS Appl. Mater. Interfaces 2022, 14, 14174–14181. [Google Scholar] [CrossRef] [PubMed]
- Ahmad, K.; Wan, C.; Al-Eshaikh, M.A.; Kadachi, A.N. Enhanced Thermoelectric Performance of Bi2Te3 Based Graphene Nanocomposites. Appl. Surf. Sci. 2019, 474, 2–8. [Google Scholar] [CrossRef]
- Dong, J.; Liu, W.; Li, H.; Su, X.; Tang, X.; Uher, C. In Situ Synthesis and Thermoelectric Properties of PbTe-Graphene Nanocomposites by Utilizing a Facile and Novel Wet Chemical Method. J. Mater. Chem. A 2013, 1, 12503–12511. [Google Scholar] [CrossRef]
- Zhang, Y.; Wang, X.L.; Yeoh, W.K.; Zeng, R.K.; Zhang, C. Electrical and Thermoelectric Properties of Single-Wall Carbon Nanotube Doped Bi2Te3. Appl. Phys. Lett. 2012, 101, 3–7. [Google Scholar] [CrossRef] [Green Version]
- Lai, Y.C.; Tsai, H.J.; Hung, C.I.; Fujishiro, H.; Naito, T.; Hsu, W.K. Carbon Nanotubes Enhanced Seebeck Coefficient and Power Factor of Rutile TiO2. Phys. Chem. Chem. Phys. 2015, 17, 8120–8124. [Google Scholar] [CrossRef] [PubMed]
- Khasimsaheb, B.; Singh, N.K.; Bathula, S.; Gahtori, B.; Haranath, D.; Neeleshwar, S. The Effect of Carbon Nanotubes (CNT) on Thermoelectric Properties of Lead Telluride (PbTe) Nanocubes. Curr. Appl. Phys. 2017, 17, 306–313. [Google Scholar] [CrossRef]
- Ghosh, S.; Harish, S.; Ohtaki, M.; Saha, B.B. Thermoelectric Figure of Merit Enhancement in Cement Composites with Graphene and Transition Metal Oxides. Mater. Today Energy 2020, 18, 100492. [Google Scholar] [CrossRef]
- Xu, X.; Zhou, J.; Chen, J. Thermal Transport in Conductive Polymer–Based Materials. Adv. Funct. Mater. 2020, 30, 1904704. [Google Scholar] [CrossRef]
- Goel, M.; Thelakkat, M. Polymer Thermoelectrics: Opportunities and Challenges. Macromolecules 2020, 53, 3632–3642. [Google Scholar] [CrossRef]
- Lu, Y.; Wang, J.Y.; Pei, J. Strategies to Enhance the Conductivity of n-Type Polymer Thermoelectric Materials. Chem. Mater. 2019, 31, 6412–6423. [Google Scholar] [CrossRef]
- Kim, G.H.; Shao, L.; Zhang, K.; Pipe, K.P. Engineered Doping of Organic Semiconductors for Enhanced Thermoelectric Efficiency. Nat. Mater. 2013, 12, 719–723. [Google Scholar] [CrossRef] [PubMed]
- Prunet, G.; Pawula, F.; Fleury, G.; Cloutet, E.; Robinson, A.J.; Hadziioannou, G.; Pakdel, A. A Review on Conductive Polymers and Their Hybrids for Flexible and Wearable Thermoelectric Applications. Mater. Today Phys. 2021, 18, 100402. [Google Scholar] [CrossRef]
- Gregory, S.A.; Menon, A.K.; Ye, S.; Seferos, D.S.; Reynolds, J.R.; Yee, S.K. Effect of Heteroatom and Doping on the Thermoelectric Properties of Poly(3-Alkylchalcogenophenes). Adv. Energy Mater. 2018, 8, 1802419. [Google Scholar] [CrossRef] [Green Version]
- Kaiser, A.B. Systematic Conductivity Behavior in Conducting Polymers: Effects of Heterogeneous Disorder. Adv. Mater. 2001, 13, 927–941. [Google Scholar] [CrossRef]
- Lee, S.; Kim, S.; Pathak, A.; Tripathi, A.; Qiao, T.; Lee, Y.; Lee, H.; Woo, H.Y. Recent Progress in Organic Thermoelectric Materials and Devices. Macromol. Res. 2020, 28, 531–552. [Google Scholar] [CrossRef]
- Lindorf, M.; Mazzio, K.A.; Pflaum, J.; Nielsch, K.; Brütting, W.; Albrecht, M. Organic-Based Thermoelectrics. J. Mater. Chem. A 2020, 8, 7495–7507. [Google Scholar] [CrossRef]
- Yao, C.J.; Zhang, H.L.; Zhang, Q. Recent Progress in Thermoelectric Materials Based on Conjugated Polymers. Polymers 2019, 11, 107. [Google Scholar] [CrossRef] [Green Version]
- Fan, Z.; Du, D.; Guan, X.; Ouyang, J. Polymer Films with Ultrahigh Thermoelectric Properties Arising from Significant Seebeck Coefficient Enhancement by Ion Accumulation on Surface. Nano Energy 2018, 51, 481–488. [Google Scholar] [CrossRef]
- Park, T.; Park, C.; Kim, B.; Shin, H.; Kim, E. Flexible PEDOT Electrodes with Large Thermoelectric Power Factors to Generate Electricity by the Touch of Fingertips. Energy Environ. Sci. 2013, 6, 788–792. [Google Scholar] [CrossRef]
- Qu, S.; Yao, Q.; Wang, L.; Chen, Z.; Xu, K.; Zeng, H.; Shi, W.; Zhang, T.; Uher, C.; Chen, L. Highly Anisotropic P3HT Films with Enhanced Thermoelectric Performance via Organic Small Molecule Epitaxy. NPG Asia Mater. 2016, 8, e292. [Google Scholar] [CrossRef]
- Yao, Q.; Wang, Q.; Wang, L.; Wang, Y.; Sun, J.; Zeng, H.; Jin, Z.; Huang, X.; Chen, L. The Synergic Regulation of Conductivity and Seebeck Coefficient in Pure Polyaniline by Chemically Changing the Ordered Degree of Molecular Chains. J. Mater. Chem. A 2014, 2, 2634–2640. [Google Scholar] [CrossRef]
- Maity, S.; Rakshit, S.; Das, S.; Chatterjee, K. Enhanced Thermoelectric Performance of Template Based Nanostructured Polyaniline. AIP Conf. Proc. 2017, 1832, 2–5. [Google Scholar] [CrossRef]
- Patel, S.N.; Glaudell, A.M.; Kiefer, D.; Chabinyc, M.L. Increasing the Thermoelectric Power Factor of a Semiconducting Polymer by Doping from the Vapor Phase. ACS Macro Lett. 2016, 5, 268–272. [Google Scholar] [CrossRef] [PubMed] [Green Version]
- Shi, K.; Zhang, F.; Di, C.A.; Yan, T.W.; Zou, Y.; Zhou, X.; Zhu, D.; Wang, J.Y.; Pei, J. Toward High Performance n-Type Thermoelectric Materials by Rational Modification of BDPPV Backbones. J. Am. Chem. Soc. 2015, 137, 6979–6982. [Google Scholar] [CrossRef] [PubMed]
- Yan, X.; Xiong, M.; Li, J.T.; Zhang, S.; Ahmad, Z.; Lu, Y.; Wang, Z.Y.; Yao, Z.F.; Wang, J.Y.; Gu, X.; et al. Pyrazine-Flanked Diketopyrrolopyrrole (DPP): A New Polymer Building Block for High-Performance n-Type Organic Thermoelectrics. J. Am. Chem. Soc. 2019, 141, 20215–20221. [Google Scholar] [CrossRef] [PubMed]
- Lu, Y.; Di Yu, Z.; Liu, Y.; Ding, Y.F.; Yang, C.Y.; Yao, Z.F.; Wang, Z.Y.; You, H.Y.; Cheng, X.F.; Tang, B.; et al. The Critical Role of Dopant Cations in Electrical Conductivity and Thermoelectric Performance of N-Doped Polymers. J. Am. Chem. Soc. 2020, 142, 15340–15348. [Google Scholar] [CrossRef] [PubMed]
- Nezakati, T.; Seifalian, A.; Tan, A.; Seifalian, A.M. Conductive Polymers: Opportunities and Challenges in Biomedical Applications. Chem. Rev. 2018, 118, 6766–6843. [Google Scholar] [CrossRef]
- Choy, C.L. Thermal Conductivity of Polymers. Polymer 1977, 18, 984–1004. [Google Scholar] [CrossRef]
- Nandihalli, N.; Liu, C.J.; Mori, T. Polymer Based Thermoelectric Nanocomposite Materials and Devices: Fabrication and Characteristics. Nano Energy 2020, 78, 105186. [Google Scholar] [CrossRef]
- Liu, Z.; Chen, G. Advancing Flexible Thermoelectric Devices with Polymer Composites. Adv. Mater. Technol. 2020, 5, 2000049. [Google Scholar] [CrossRef]
- Li, J.; Tang, X.; Li, H.; Yan, Y.; Zhang, Q. Synthesis and Thermoelectric Properties of Hydrochloric Acid-Doped Polyaniline. Synth. Met. 2010, 160, 1153–1158. [Google Scholar] [CrossRef]
- Jiang, F.X.; Xu, J.K.; Lu, B.Y.; Xie, Y.; Huang, R.J.; Li, L.F. Thermoelectric Performance of Poly(3,4-Ethylenedioxythiophene): Poly(Styrenesulfonate). Chinese Phys. Lett. 2008, 25, 2202–2205. [Google Scholar] [CrossRef]
- Xu, S.; Hong, M.; Shi, X.L.; Wang, Y.; Ge, L.; Bai, Y.; Wang, L.; Dargusch, M.; Zou, J.; Chen, Z.G. High-Performance PEDOT:PSS Flexible Thermoelectric Materials and Their Devices by Triple Post-Treatments. Chem. Mater. 2019, 31, 5238–5244. [Google Scholar] [CrossRef]
- Misra, S.; Bharti, M.; Singh, A.; Debnath, A.K.; Aswal, D.K.; Hayakawa, Y. Nanostructured Polypyrrole: Enhancement in Thermoelectric Figure of Merit through Suppression of Thermal Conductivity. Mater. Res. Express 2017, 4, 085007. [Google Scholar] [CrossRef]
- Mardi, S.; Pea, M.; Notargiacomo, A.; Nia, N.Y.; Di Carlo, A.; Reale, A. The Molecular weight Dependence of Thermoelectric Properties of Poly (3-Hexylthiophene). Materials 2020, 13, 1404. [Google Scholar] [CrossRef] [Green Version]
- Soleimani, Z.; Zoras, S.; Ceranic, B.; Shahzad, S.; Cui, Y. A Review on Recent Developments of Thermoelectric Materials for Room-Temperature Applications. Sustain. Energy Technol. Assessments 2020, 37, 100604. [Google Scholar] [CrossRef]
- Zhang, Y.; Zhang, Q.; Chen, G. Carbon and Carbon Composites for Thermoelectric Applications. Carbon Energy 2020, 2, 408–436. [Google Scholar] [CrossRef]
- Blackburn, J.L.; Ferguson, A.J.; Cho, C.; Grunlan, J.C. Carbon-Nanotube-Based Thermoelectric Materials and Devices. Adv. Mater. 2018, 30, 1704386. [Google Scholar] [CrossRef]
- McGrail, B.T.; Sehirlioglu, A.; Pentzer, E. Polymer Composites for Thermoelectric Applications. Angew. Chem.—Int. Ed. 2015, 54, 1710–1723. [Google Scholar] [CrossRef]
- Yao, H.; Fan, Z.; Cheng, H.; Guan, X.; Wang, C.; Sun, K.; Ouyang, J. Recent Development of Thermoelectric Polymers and Composites. Macromol. Rapid Commun. 2018, 39, 1700727. [Google Scholar] [CrossRef] [PubMed]
- Ahmed Gamal, E.-S. Novel Hybrid Nanocomposite Based on Poly(Vinyl Alcohol)/ Carbon Quantum Dots/Fullerene (PVA/CQDs/C60) for Thermoelectric Power Applications. Compos. Part B Eng. 2019, 174, 106993. [Google Scholar] [CrossRef]
- Hsieh, Y.Y.; Zhang, Y.; Zhang, L.; Fang, Y.; Kanakaraaj, S.N.; Bahk, J.H.; Shanov, V. High Thermoelectric Power-Factor Composites Based on Flexible Three-Dimensional Graphene and Polyaniline. Nanoscale 2019, 11, 6552–6560. [Google Scholar] [CrossRef] [PubMed]
- Shalini, V.; Navaneethan, M.; Harish, S.; Archana, J.; Ponnusamy, S.; Ikeda, H.; Hayakawa, Y. Design and Fabrication of PANI/GO Nanocomposite for Enhanced Room-Temperature Thermoelectric Application. Appl. Surf. Sci. 2019, 493, 1350–1360. [Google Scholar] [CrossRef]
- Bounioux, C.; Díaz-Chao, P.; Campoy-Quiles, M.; Martín-González, M.S.; Goñi, A.R.; Yerushalmi-Rozen, R.; Müller, C. Thermoelectric Composites of Poly(3-Hexylthiophene) and Carbon Nanotubes with a Large Power Factor. Energy Environ. Sci. 2013, 6, 918–925. [Google Scholar] [CrossRef]
- Wang, J.; Cai, K.; Yin, J.; Shen, S. Thermoelectric Properties of the PEDOT/SWCNT Composite Films Prepared by a Vapor Phase Polymerization. Synth. Met. 2017, 224, 27–32. [Google Scholar] [CrossRef]
- Wu, R.; Yuan, H.; Liu, C.; Lan, J.L.; Yang, X.; Lin, Y.H. Flexible PANI/SWCNT Thermoelectric Films with Ultrahigh Electrical Conductivity. RSC Adv. 2018, 8, 26011–26019. [Google Scholar] [CrossRef] [Green Version]
- El-Shamy, A.G. New Free-Standing and Flexible PVA/Carbon Quantum Dots (CQDs) Nanocomposite Films with Promising Power Factor and Thermoelectric Power Applications. Mater. Sci. Semicond. Process. 2019, 100, 245–254. [Google Scholar] [CrossRef]
- Dey, A.; Hadavale, S.; Khan, M.A.S.; More, P.; Khanna, P.K.; Sikder, A.K.; Chattopadhyay, S. Polymer Based Graphene/Titanium Dioxide Nanocomposite (GTNC): An Emerging and Efficient Thermoelectric Material. Dalt. Trans. 2015, 44, 19248–19255. [Google Scholar] [CrossRef]
- Mitra, M.; Kulsi, C.; Chatterjee, K.; Kargupta, K.; Ganguly, S.; Banerjee, D.; Goswami, S. Reduced Graphene Oxide-Polyaniline Composites—Synthesis, Characterization and Optimization for Thermoelectric Applications. RSC Adv. 2015, 5, 31039–31048. [Google Scholar] [CrossRef]
- Du, F.P.; Cao, N.N.; Zhang, Y.F.; Fu, P.; Wu, Y.G.; Lin, Z.D.; Shi, R.; Amini, A.; Cheng, C. PEDOT:PSS/Graphene Quantum Dots Films with Enhanced Thermoelectric Properties via Strong Interfacial Interaction and Phase Separation. Sci. Rep. 2018, 8, 6441. [Google Scholar] [CrossRef] [PubMed] [Green Version]
- Yu, C.; Choi, K.; Yin, L.; Grunlan, J.C. Correction to Light-Weight Flexible Carbon Nanotube Based Organic Composites with Large Thermoelectric Power Factors. ACS Nano 2013, 7, 9506. [Google Scholar] [CrossRef]
- Dey, A.; Panja, S.; Sikder, A.K.; Chattopadhyay, S. Multi-Phase Semicrystalline Microstructures Drive Exciton Dissociation in Neat Plastic Semiconductors. RSC Adv. 2015, 5, 10358–10364. [Google Scholar] [CrossRef]
- Du, Y.; Cai, K.F.; Shen, S.Z.; Casey, P.S. Preparation and Characterization of Graphene Nanosheets/Poly(3- Hexylthiophene) Thermoelectric Composite Materials. Synth. Met. 2012, 162, 2102–2106. [Google Scholar] [CrossRef]
- Yoo, D.; Kim, J.; Kim, J.H. Direct Synthesis of Highly Conductive Poly(3,4-Ethylenedioxythiophene):Poly(4-Styrenesulfonate) (PEDOT:PSS)/Graphene Composites and Their Applications in Energy Harvesting Systems. Nano Res. 2014, 7, 717–730. [Google Scholar] [CrossRef]
- Moriarty, G.P.; Briggs, K.; Stevens, B.; Yu, C.; Grunlan, J.C. Fully Organic Nanocomposites with High Thermoelectric Power Factors by Using a Dual-Stabilizer Preparation. Energy Technol. 2013, 1, 265–272. [Google Scholar] [CrossRef]
- Shah, R.; Kausar, A.; Muhammad, B. Exploration of Polythiophene/Graphene, Poly(Methyl Methacrylate)/Graphene and Polythiophene-Co- Poly(Methyl Methacrylate)/Graphene Nanocomposite Obtained via in-Situ Technique. J. Plast. Film Sheeting 2015, 31, 144–157. [Google Scholar] [CrossRef]
- Cho, C.; Stevens, B.; Hsu, J.H.; Bureau, R.; Hagen, D.A.; Regev, O.; Yu, C.; Grunlan, J.C. Completely Organic Multilayer Thin Film with Thermoelectric Power Factor Rivaling Inorganic Tellurides. Adv. Mater. 2015, 27, 2996–3001. [Google Scholar] [CrossRef]
- Cho, C.; Wallace, K.L.; Tzeng, P.; Hsu, J.H.; Yu, C.; Grunlan, J.C. Outstanding Low Temperature Thermoelectric Power Factor from Completely Organic Thin Films Enabled by Multidimensional Conjugated Nanomaterials. Adv. Energy Mater. 2016, 6, 1–8. [Google Scholar] [CrossRef]
- Liu, F.S.; Zheng, J.X.; Huang, M.J.; He, L.P.; Ao, W.Q.; Pan, F.; Li, J.Q. Enhanced Thermoelectric Performance of Single-Walled Carbon Nanotubes/Polyaniline Hybrid Nanocomposites. ACS Nano 2010, 4, 2445–2551. [Google Scholar] [CrossRef]
- Mehendru, P.C.; Pathak, N.L.; Jain, K.; Mehendru, P. Electrical Conduction in Pure and Iodine-doped Polyvinyl Acetate Thick Films. Phys. Status Solidi 1977, 42, 403–407. [Google Scholar] [CrossRef]
- Ahmed, R.M. Electrical Conductivity and Dielectric Relaxation Study of Polyvinyl Acetate/Poly Methyl Methacrylate Blends. Int. J. Mod. Phys. B 2012, 26, 1250159-1. [Google Scholar] [CrossRef]
- Wang, J.; Mao, Q. Methodology Based on the PVT Behavior of Polymer for Injection Molding. Adv. Polym. Technol. 2012, 32, 474–485. [Google Scholar] [CrossRef]
- Koumoto, K.; Wang, Y.; Zhang, R.; Kosuga, A.; Funahashi, R. Oxide Thermoelectric Materials: A Nanostructuring Approach. Annu. Rev. Mater. Res. 2010, 40, 363–394. [Google Scholar] [CrossRef]
- Yeandel, S.R.; Molinari, M.; Parker, S.C. The Impact of Tilt Grain Boundaries on the Thermal Transport in Perovskite SrTiO3 Layered Nanostructures. A Computational Study. Nanoscale 2018, 10, 15010–15022. [Google Scholar] [CrossRef] [PubMed] [Green Version]
- Lim, K.H.; Wong, K.W.; Cadavid, D.; Liu, Y.; Zhang, Y.; Cabot, A.; Ng, K.M. Mechanistic Study of Energy Dependent Scattering and Hole-Phonon Interaction at Hybrid Polymer Composite Interfaces for Optimized Thermoelectric Performance. Compos. Part B Eng. 2019, 164, 54–60. [Google Scholar] [CrossRef]
- Du, Y.; Xu, J.; Paul, B.; Eklund, P. Flexible Thermoelectric Materials and Devices. Appl. Mater. Today 2018, 12, 366–388. [Google Scholar] [CrossRef]
- Xi, L.; Yang, J.; Wu, L.; Yang, J.; Zhang, W. Band Engineering and Rational Design of High-Performance Thermoelectric Materials by First-Principles. J. Mater. 2016, 2, 114–130. [Google Scholar] [CrossRef] [Green Version]
- Snyder, G.J.; Snyder, A.H. Figure of Merit ZT of a Thermoelectric Device Defined from Materials Properties. Energy Environ. Sci. 2017, 10, 2280–2283. [Google Scholar] [CrossRef]
- Yang, J.; Xi, L.; Qiu, W.; Wu, L.; Shi, X.; Chen, L.; Yang, J.; Zhang, W.; Uher, C.; Singh, D.J. On the Tuning of Electrical and Thermal Transport in Thermoelectrics: An Integrated Theory-Experiment Perspective. Npj Comput. Mater. 2016, 2, 15015. [Google Scholar] [CrossRef] [Green Version]
- Sanad, M.F.; Shalan, A.E.; Abdellatif, S.O.; Serea, E.S.A.; Adly, M.S.; Ahsan, M.A. Thermoelectric Energy Harvesters: A Review of Recent Developments in Materials and Devices for Different Potential Applications. Top. Curr. Chem. 2020, 378, 1–43. [Google Scholar] [CrossRef] [PubMed]
- Li, J.; Huckleby, A.B.; Zhang, M. Polymer-Based Thermoelectric Materials: A Review of Power Factor Improving Strategies. J. Mater. 2022, 8, 204–220. [Google Scholar] [CrossRef]
- Ju, H.; Kim, J. Chemically Exfoliated SnSe Nanosheets and Their SnSe/Poly(3,4-Ethylenedioxythiophene):Poly(Styrenesulfonate) Composite Films for Polymer Based Thermoelectric Applications. ACS Nano 2016, 10, 5730–5739. [Google Scholar] [CrossRef]
- Kato, K.; Hagino, H.; Miyazaki, K. Fabrication of Bismuth Telluride Thermoelectric Films Containing Conductive Polymers Using a Printing Method. J. Electron. Mater. 2013, 42, 1313–1318. [Google Scholar] [CrossRef]
- Mitra, M.; Kulsi, C.; Kargupta, K.; Ganguly, S.; Banerjee, D. Composite of Polyaniline-Bismuth Selenide with Enhanced Thermoelectric Performance. J. Appl. Polym. Sci. 2018, 135, 46887. [Google Scholar] [CrossRef]
- Wang, Y.; Zhang, S.M.; Deng, Y. Flexible Low-Grade Energy Utilization Devices Based on High-Performance Thermoelectric Polyaniline/Tellurium Nanorod Hybrid Films. J. Mater. Chem. A 2016, 4, 3554–3559. [Google Scholar] [CrossRef]
- Song, H.; Cai, K. Preparation and Properties of PEDOT:PSS/Te Nanorod Composite Films for Flexible Thermoelectric Power Generator. Energy 2017, 125, 519–525. [Google Scholar] [CrossRef]
- Chatterjee, K.; Mitra, M.; Kargupta, K.; Ganguly, S.; Banerjee, D. Synthesis, Characterization and Enhanced Thermoelectric Performance of Structurally Ordered Cable-like Novel Polyaniline-Bismuth Telluride Nanocomposite. Nanotechnology 2013, 24, 215703. [Google Scholar] [CrossRef]
- Wang, Y.Y.; Cai, K.F.; Yin, J.L.; An, B.J.; Du, Y.; Yao, X. In Situ Fabrication and Thermoelectric Properties of PbTe—Polyaniline Composite Nanostructures. J. Nanopart. Res. 2011, 13, 533–539. [Google Scholar] [CrossRef]
- Zhang, B.; Sun, J.; Katz, H.E.; Fang, F.; Opila, R.L. Promising Thermoelectric Properties of Commercial PEDOT:PSS Materials and Their Bi2Te3 Powder Composites. ACS Appl. Mater. Interfaces 2010, 2, 3170–3178. [Google Scholar] [CrossRef]
- Tse, J.; Aziz, A.; Flitcroft, J.M.; Skelton, J.M.; Gillie, L.J.; Parker, S.C.; Cooke, D.J.; Molinari, M. Unraveling the Impact of Graphene Addition to Thermoelectric SrTiO3 and La-Doped SrTiO3 Materials: A Density Functional Theory Study. ACS Appl. Mater. Interfaces 2021, 13, 41303–41314. [Google Scholar] [CrossRef] [PubMed]
- Baran, J.D.; Eames, C.; Takahashi, K.; Molinari, M.; Islam, M.S.; Parker, S.C. Structural, Electronic, and Transport Properties of Hybrid SrTiO3-Graphene and Carbon Nanoribbon Interfaces. Chem. Mater. 2017, 29, 7364–7370. [Google Scholar] [CrossRef] [Green Version]
- Yang, Y.; Deng, H.; Fu, Q. Recent Progress on PEDOT:PSS Based Polymer Blends and Composites for Flexible Electronics and Thermoelectric Devices. Mater. Chem. Front. 2020, 4, 3130–3152. [Google Scholar] [CrossRef]
- Du, Y.; Shen, S.Z.; Cai, K.; Casey, P.S. Research Progress on Polymer-Inorganic Thermoelectric Nanocomposite Materials. Prog. Polym. Sci. 2012, 37, 820–841. [Google Scholar] [CrossRef]
- Bach-Toledo, L.; Hryniewicz, B.M.; Marchesi, L.F.; Dall’Antonia, L.H.; Vidotti, M.; Wolfart, F. Conducting Polymers and Composites Nanowires for Energy Devices: A Brief Review. Mater. Sci. Energy Technol. 2020, 3, 78–90. [Google Scholar] [CrossRef]
- Shi, Y.; Peng, L.; Ding, Y.; Zhao, Y.; Yu, G. Nanostructured Conductive Polymers for Advanced Energy Storage. Chem. Soc. Rev. 2015, 44, 6684–6696. [Google Scholar] [CrossRef] [PubMed] [Green Version]
- Gao, W.; Zhu, Y.; Wang, Y.; Yuan, G.; Liu, J.M. A Review of Flexible Perovskite Oxide Ferroelectric Films and Their Application. J. Mater. 2020, 6, 1–16. [Google Scholar] [CrossRef]
- Ameen, S.; Shaheer, M.; Song, M.; Shik, H. Metal Oxide Nanomaterials, Conducting Polymers and Their Nanocomposites for Solar Energy. In Solar Cells-Research and Application Perspectives; Intecn: London, UK, 2013. [Google Scholar] [CrossRef] [Green Version]
- Zamiri, G.; Haseeb, A.S.M.A. Recent Trends and Developments in Graphene/Conducting Polymer Nanocomposites Chemiresistive Sensors. Materials 2020, 13, 3311. [Google Scholar] [CrossRef]
- Yang, C.; Wei, H.; Guan, L.; Guo, J.; Wang, Y.; Yan, X.; Zhang, X.; Wei, S.; Guo, Z. Polymer Nanocomposites for Energy Storage, Energy Saving, and Anticorrosion. J. Mater. Chem. A 2015, 3, 14929–14941. [Google Scholar] [CrossRef]
- Anno, H.; Yamaguchi, K.; Nakabayashi, T.; Kurokawa, H.; Akagi, F.; Hojo, M.; Toshima, N. Thermoelectric Properties of Conducting Polyaniline/BaTiO3 Nanoparticle Composite Films. IOP Conf. Ser. Mater. Sci. Eng. 2011, 18, 7–11. [Google Scholar] [CrossRef]
- Ramakrishnan, R.; Devaki, S.J.; Aashish, A.; Thomas, S.; Varma, M.R.; Kpp, N. Nanostructured Semiconducting PEDOT-TiO2/ZnO Hybrid Composites for Nanodevice Applications. J. Phys. Chem. C 2016, 120, 4199–4210. [Google Scholar] [CrossRef]
- Mitra, M.; Kargupta, K.; Ganguly, S.; Goswami, S.; Banerjee, D. Facile Synthesis and Thermoelectric Properties of Aluminum Doped Zinc Oxide/Polyaniline (AZO/PANI) Hybrid. Synth. Met. 2017, 228, 25–31. [Google Scholar] [CrossRef]
- Sarkar, K.; Debnath, A.; Deb, K.; Bera, A.; Saha, B. Effect of NiO Incorporation in Charge Transport of Polyaniline: Improved Polymer Based Thermoelectric Generator. Energy 2019, 177, 203–210. [Google Scholar] [CrossRef]
- Lu, H.; Song, H.; Shi, H.; Jiang, Q.; Zhang, L.; Liu, C.; Xu, J. Preparation of Poly(3,4-Ethylenedioxythiophene)-Poly(Styrenesulfonate)/ Fe3O4 Nanocomposite Film and Its Thermoelectric Performance. J. Compos. Mater. 2014, 48, 2793–2801. [Google Scholar] [CrossRef]
- Dey, A.; Maity, A.; Shafeeuulla Khan, M.A.; Sikder, A.K.; Chattopadhyay, S. PVAc/PEDOT:PSS/Graphene-Iron Oxide Nanocomposite (GINC): An Efficient Thermoelectric Material. RSC Adv. 2016, 6, 22453–22460. [Google Scholar] [CrossRef]
- Wolf, M.; Menekse, K.; Mundstock, A.; Hinterding, R.; Nietschke, F.; Oeckler, O.; Feldhoff, A. Low Thermal Conductivity in Thermoelectric Oxide-Based Multiphase Composites. J. Electron. Mater. 2019, 48, 7551–7561. [Google Scholar] [CrossRef]
- Debnath, A.; Deb, K.; Bhowmik, K.L.; Saha, B. Reduced Hopping Barrier Potential in NiO Nanoparticle-Incorporated, Polypyrrole-Coated Graphene with Enhanced Thermoelectric Properties. ACS Appl. Energy Mater. 2020, 3, 7772–7781. [Google Scholar] [CrossRef]
- Wu, Z.; Xie, H. Thermoelectric Performance of Polyparaphenylene/Li0.5Ni0.5Fe2O4 Nanocomposites. Energy Mater. Mater. Sci. Eng. Energy Syst. 2014, 9, 120–124. [Google Scholar] [CrossRef]
- Park, D.; Ju, H.; Kim, J. Effect of SrTiO3 Nanoparticles in Conductive Polymer on the Thermoelectric Performance for Efficient Thermoelectrics. Polymers 2020, 12, 777. [Google Scholar] [CrossRef] [Green Version]
- Choi, W.K.; Kim, B.J.; Kim, E.S.; Chi, S.H.; Park, S.J. Oxidation Behavior of IG and NBG Nuclear Graphites. Nucl. Eng. Des. 2011, 241, 82–87. [Google Scholar] [CrossRef]
- Nolas, G.S.; Sharp, J.; Goldsmid, H.J. The Phonon—Glass Electron-Crystal Approach to Thermoelectric Materials Research. In Thermoelectrics; Springer: Berlin/Heidelberg, Germany, 2001; pp. 177–207. [Google Scholar] [CrossRef]
- Nozariasbmarz, A.; Poudel, B.; Li, W.; Kang, H.B.; Zhu, H.; Priya, S. Bismuth Telluride Thermoelectrics with 8% Module Efficiency for Waste Heat Recovery Application. iScience 2020, 23, 101340. [Google Scholar] [CrossRef] [PubMed]
- Wang, H.; Yang, J.; Long, S.; Wang, X.; Yang, Z.; Li, G. Studies on the Thermal Degradation of Poly (Phenylene Sulfide Sulfone). Polym. Degrad. Stab. 2004, 83, 229–235. [Google Scholar] [CrossRef]
- Chen, H.; Sun, H.; Zheng, M.; Jia, Q.; Dang, W. Characterization and Thermo-Stability of Alkylated Polyparaphenylene. Polym. Bull. 2006, 56, 221–227. [Google Scholar] [CrossRef]
- Mohammad, F.; Calvert, P.D.; Billingham, N.C. Thermal Stability of Electrochemically Prepared Polythiophene and Polypyrrole. Bull. Mater. Sci. 1995, 18, 255–261. [Google Scholar] [CrossRef]
- Huang, J.; Miller, P.F.; De Mello, J.C.; De Mello, A.J.; Bradley, D.D.C. Influence of Thermal Treatment on the Conductivity and Morphology of PEDOT/PSS Films. Synth. Met. 2003, 139, 569–572. [Google Scholar] [CrossRef]
- Gozet, T.; Hacaloglu, J. Direct Pyrolysis Mass Spectrometry Analysis of Fresh and Aged PF6--Doped Polythiophenes. Polym. Int. 2004, 53, 2162–2168. [Google Scholar] [CrossRef]
- Kulkarni, V.G.; Campbell, L.D.; Mathew, W.R. Thermal Stability of Polyaniline. Synth. Met. 1989, 30, 321–325. [Google Scholar] [CrossRef]
- Syed Abthagir, P.; Saraswathi, R. Thermal Stability of Polypyrrole Prepared from a Ternary Eutectic Melt. Mater. Chem. Phys. 2005, 92, 21–26. [Google Scholar] [CrossRef]
- Vugule, G.; Bitenieks, J.; Zicans, J.; Merijs-Meri, R.; Ivanova, T.; Erts, D.; Buks, K. Characterization of Thermoelectric and Thermogravimetric Properties of Conductive PEDOT:PSS Films Blended with SWCNTs and PVA. IOP Conf. Ser. Mater. Sci. Eng. 2019, 503, 4–8. [Google Scholar] [CrossRef]
- Neoh, K.G.; Kang, E.T.; Tan, K.L. Thermal Degradation of Leucoemeraldine, Emeraldine Base and Their Complexes. Thermochim. Acta 1990, 171, 279–291. [Google Scholar] [CrossRef]
- Kiebooms, R.; Aleshin, A.; Hutchison, K.; Wudl, F.; Heeger, A. Doped Poly(3,4-Ethylenedioxythiophene) Films: Thermal, Electromagnetical and Morphological Analysis. Synth. Met. 1999, 101, 436–437. [Google Scholar] [CrossRef]
- Ahirwar, D.; Vishwakarma, K. Morphological Characterization and Synthesis of Polthiophene Doped PVA Film. Int. J. Recent Trends Eng. Res. 2016, 2, 480–487. [Google Scholar]
- Bayerl, D.; Kioupakis, E. Theoretical Limits of Thermoelectric Figure of Merit in n-Type TiO2 Polymorphs. Phys. Rev. B—Condens. Matter Mater. Phys. 2015, 91, 165104. [Google Scholar] [CrossRef] [Green Version]
- Lihua, Z.; Tosho, T.; Okinaka, N.; Akiyama, T. Thermoelectric Properties of Combustion-Synthesized Lanthanum-Doped Strontium Titanate. Mater. Trans. 2007, 48, 1079–1083. [Google Scholar] [CrossRef] [Green Version]
- Ohta, H.; Sugiura, K.; Koumoto, K. ChemInform Abstract: Recent Progress in Oxide Thermoelectric Materials: p-Type Ca3Co4O9 and n-Type SrTiO3−. ChemInform 2008, 39, 8429–8436. [Google Scholar] [CrossRef]
- Zavjalov, A.; Tikhonov, S.; Kosyanov, D. TiO2-SrTiO3 Biphase Nanoceramics as Advanced Thermoelectric Materials. Materials 2019, 12, 2895. [Google Scholar] [CrossRef] [PubMed] [Green Version]
- Nag, A.; Shubha, V. Oxide Thermoelectric Materials: A Structure-Property Relationship. J. Electron. Mater. 2014, 43, 962–977. [Google Scholar] [CrossRef] [Green Version]
- Chepkoech, M.; Joubert, D.P.; Amolo, G.O. First Principles Calculations of the Thermoelectric Properties of α-MnO2 and β-MnO2. Eur. Phys. J. B 2018, 91, 301. [Google Scholar] [CrossRef]
| Polymer | T (K) | S (µV K−1) | PF (µW m−1 K−2) | ZTmax | Polymer Class | ||
|---|---|---|---|---|---|---|---|
| p-type polymers | |||||||
| PEDOT:PSS/EMIM-DCA [116] | 300 | 1600 | 65 | 754 | 0.30 | 0.75 | PTh |
| PEDOT:PSS [109] | 300 | ~880 | ~70 | ~460 | 0.52 | ~0.30 | PTh |
| PP-PEDOT:Tos [117] | 300 | ~930 | ~117 | 1270 | - | - | PTh |
| P3HT [118] | 365 | 320 | ~55 | 46 † | 0.23 | ~0.10 | PTh |
| PANI [119,120] | 300 | 220 | ~20 | ~11 | - | 6.1 × 10⁻³ | N |
| PBTTT/FTS [121] | 300 | 1000 | 33 | 110 | - | - | PTh |
| n-type polymers | |||||||
| FBDPPV [122] | 300 | ~6 | −198 | 25.5 | - | - | - |
| ClBDPPV [122] | 300 | ~4 | −220 | 16.5 | - | - | - |
| P(PzDPP-CT2) [123] | 300 | ~4 | ~−378 | 57.3 | - | - | - |
| UFBDPPV/TAM [124] | 300 | 22.5 | −198 | 80 | - | - | - |
| Composite | T (K) | S (µV K−1) | PF (µW m−1 K−2) | (W m−1 K−1) | ZT | Polymer Class | |
|---|---|---|---|---|---|---|---|
| PEDOT/CNT/Bi2Te3 [76] | 325 | ~915 | ~123 | ~1393 | ~0.96 | ~0.49 | PTh |
| PEDOT:PSS (80 wt. %)/SnSe nanosheet [170] | 300 | ~320 | ~110 | ~400 | ~0.36 | 0.32 | PTh |
| PEDOT:PSS/PAA/Bi0.4Te3Sb1.695 (95 wt. %) [171] | 300 | 380 | 79 | ~240 | 0.36 | 0.20 | PTh |
| PANI (70 wt. %)/Bi2Se3 [172] | 410 | 30.4 | 188.2 | 107.67 | 0.25 | 0.18 | N |
| PANI (30 wt. %)/Te nanorods [173] | 298 | 102 | 102 | 105 | 0.21 | 0.16 | N |
| PEDOT:PSS (20 wt. %)/Te nanorods [174] | 298 | ~680 | 27.5 | 51.4 | ~0.16 | ~0.10 † | PTh |
| PANI (70 wt. %)/Bi2Te3 [175] | 300 | ~12 | ~36 | ~1.6 | ~0.11 | ~4.3 × 10⁻³ | N |
| PANI/PbTe [176] | 298 | 1.77 | 69 | 0.713 | - | - | N |
| PEDOT:PSS( 5% DMSO)/Bi2Te3 [177] | 298 | 945 | 22.2 | 47 | - | - | PTh |
| Composite | T (K) | S (µV K−1) | PF (µW m−1 K−2) | ZT | Polymer Class | ||
|---|---|---|---|---|---|---|---|
| p-type oxide/polymer composites | |||||||
| PANI/BaTiO3 [188] | 365 | ~270 | ~39 | ~41 † | - | - | N |
| PEDOT/TiO2-ZnO [189] | 383 | ~71 | 19.3 | 2.61 | 0.13 | 7.5 × 10⁻³ | PTh |
| PANI (84 wt. %)/AlZnO [190] | 298 | ~25 | ~54 | ~6.4 | 0.62 | 3.5 × 10⁻³ | N |
| PANI (99.25 wt. %)/NiO [191] | 383 | ~0.14 | 331 | 1.25 | - | - | N |
| PEDOT:PSS (75 wt. %)/Fe3O4 [192] | 300 | ~218 | ~16 | ~5.5 | - | - | PTh |
| PEDOT:PSS (5 wt. %)/GINC [193] | 300 | ~800 | 25.4 | 51.93 | 0.90 | 17 × 10−3 | PTh |
| Matrimid (10 wt. %)/Ca3Co4O9 [194] | 373 | ~0.2 | ~127 | ~0.32 † | ~1.16 | ~1.04 × 10⁻⁴ † | - |
| Matrimid (10 wt. %)/C (5 wt. %)/Ca3Co4O9 [194] | 523 | ~1 | ~178 | ~3.17 † | ~0.49 | ~3.38 × 10⁻³ † | - |
| NiO/PPy/Gr [195] | 373 | 1.15 | 495 | 28.22 | - | - | NAr |
| n-type oxide/polymer composites | |||||||
| PPP (0.95 wt. %)/Li0.5Ni0.5Fe2O4 [196] | 820 | ~0.88 (800 K) | ~−228 | - | ~1.86 (800 K) | 0.11 | - |
| PANI (80 wt. %)/SrTiO3 [197] | 300 | ~49 | ~−100 | ~49.6 | - | - | N |
Publisher’s Note: MDPI stays neutral with regard to jurisdictional claims in published maps and institutional affiliations. |
© 2022 by the authors. Licensee MDPI, Basel, Switzerland. This article is an open access article distributed under the terms and conditions of the Creative Commons Attribution (CC BY) license (https://creativecommons.org/licenses/by/4.0/).
Share and Cite
Wood, N.D.; Gillie, L.J.; Cooke, D.J.; Molinari, M. A Review of Key Properties of Thermoelectric Composites of Polymers and Inorganic Materials. Materials 2022, 15, 8672. https://doi.org/10.3390/ma15238672
Wood ND, Gillie LJ, Cooke DJ, Molinari M. A Review of Key Properties of Thermoelectric Composites of Polymers and Inorganic Materials. Materials. 2022; 15(23):8672. https://doi.org/10.3390/ma15238672
Chicago/Turabian StyleWood, Nathan D., Lisa J. Gillie, David J. Cooke, and Marco Molinari. 2022. "A Review of Key Properties of Thermoelectric Composites of Polymers and Inorganic Materials" Materials 15, no. 23: 8672. https://doi.org/10.3390/ma15238672