
Preparation of CeO2/UiO-66-NH2 Heterojunction and Study on a Photocatalytic Degradation Mechanism

Abstract
:1. Introduction
2. Materials and Experimental Procedures
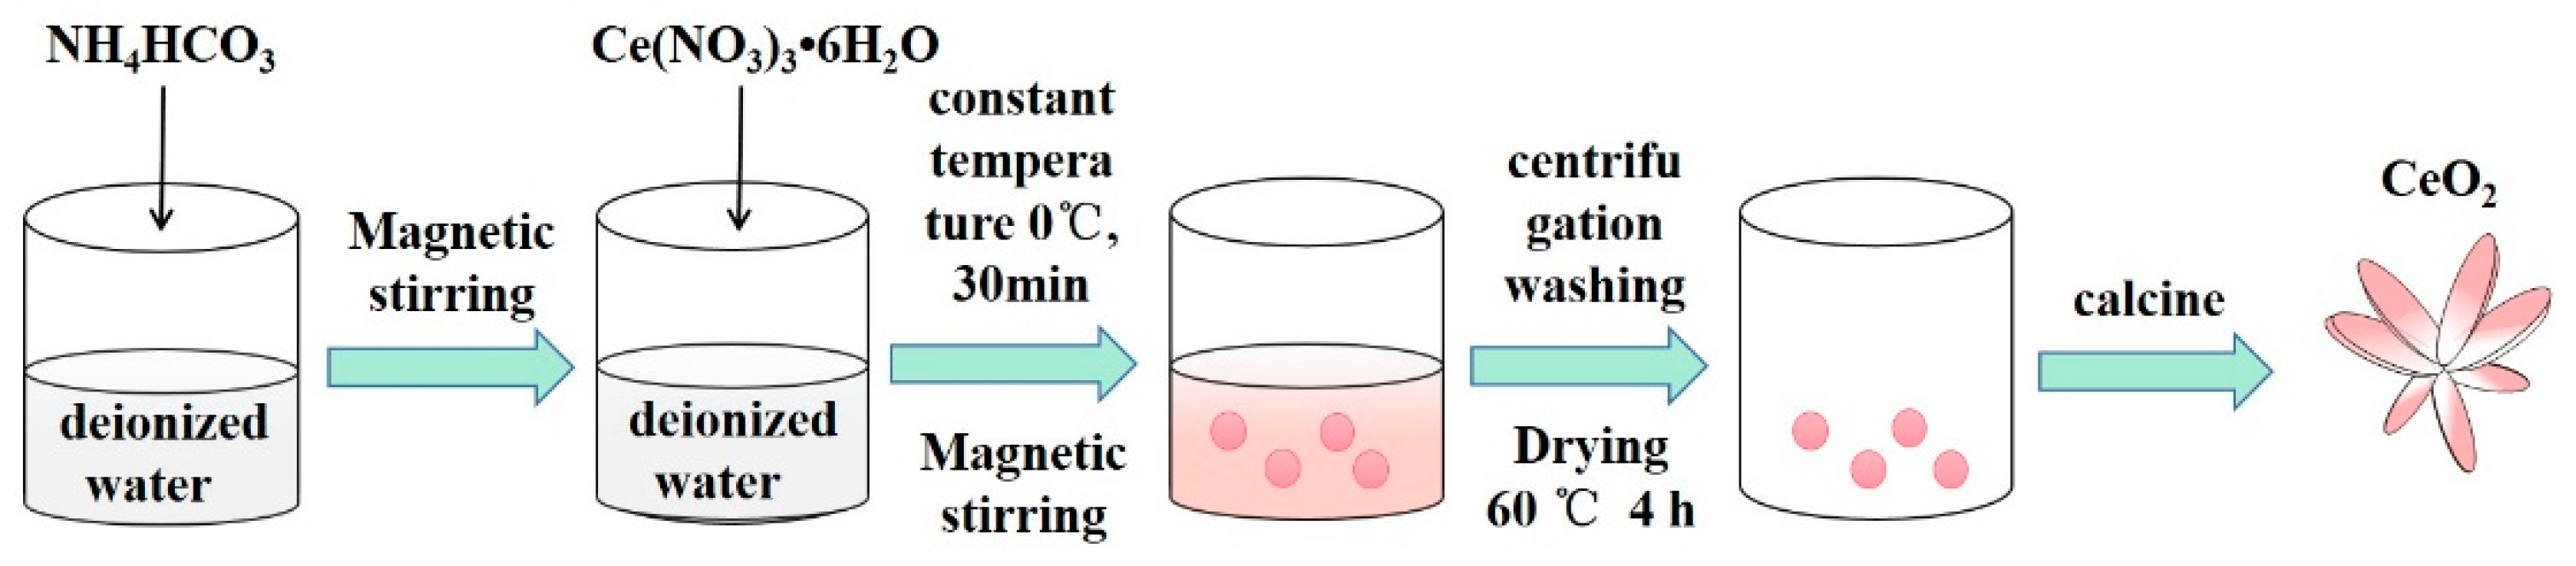
2.1. Preparation of CeO2 Nanosheets
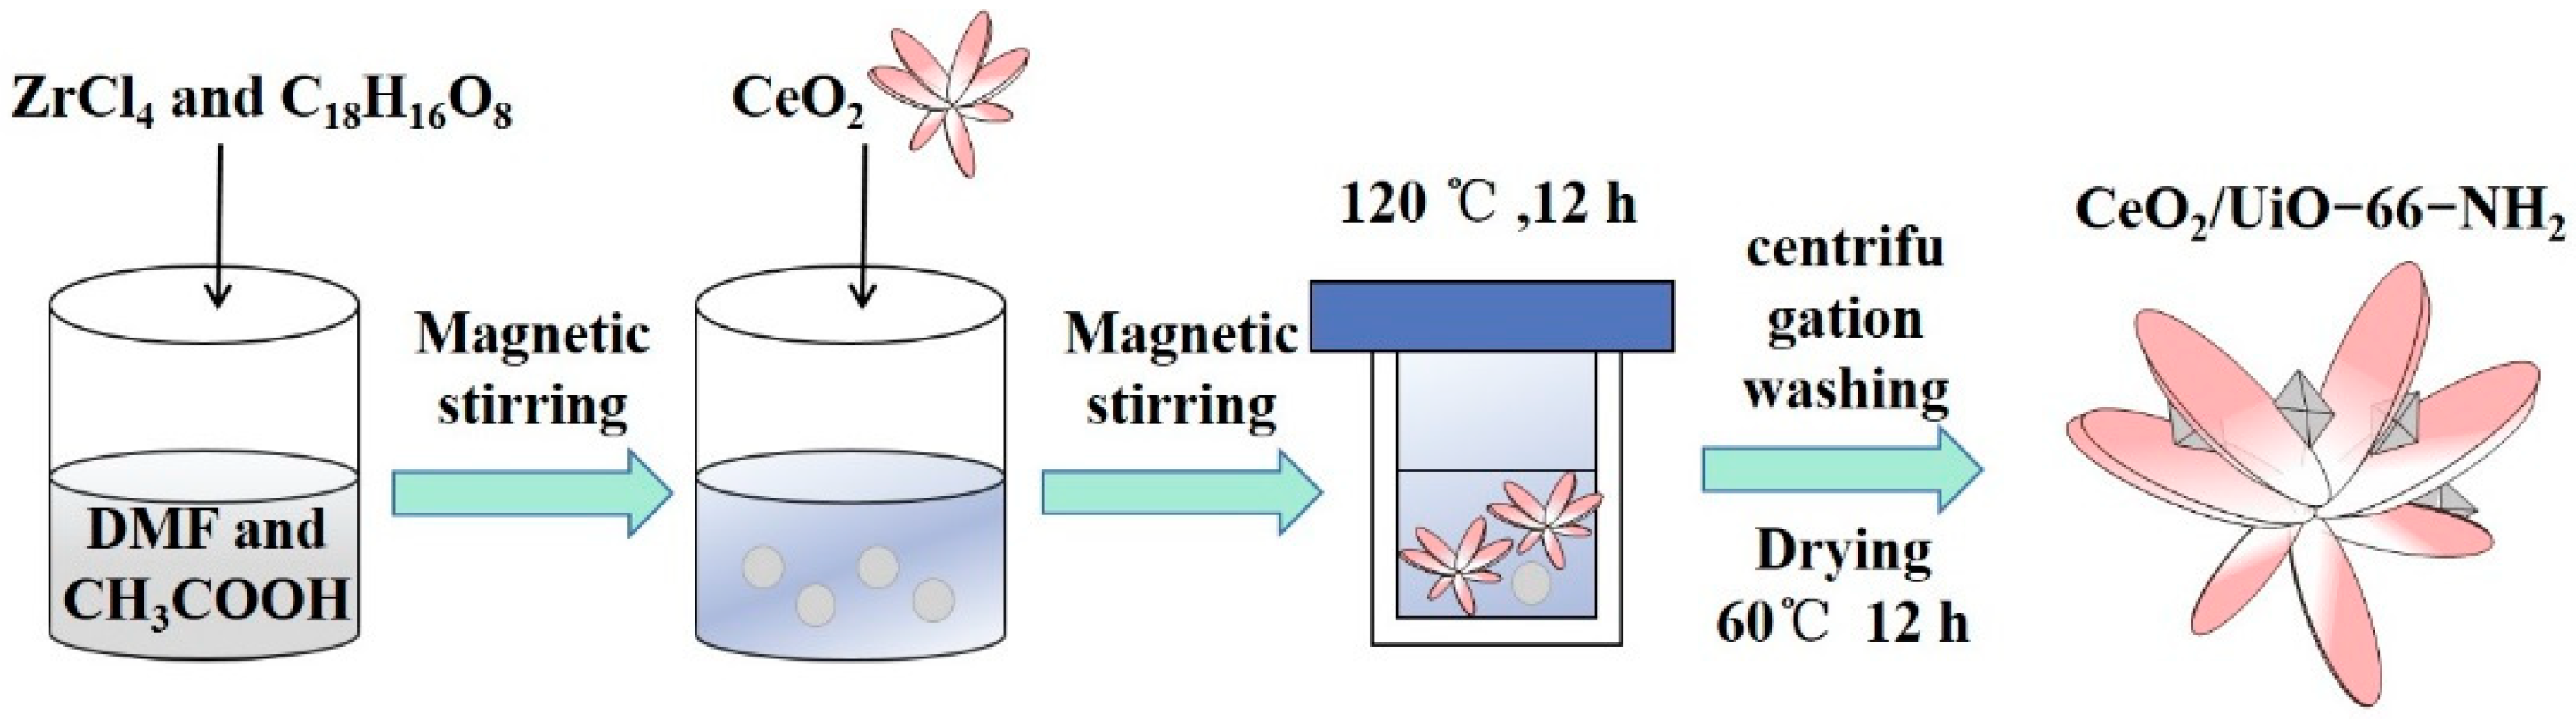
2.2. Preparation of Ce/UN Composites
2.3. Properties Characterization
2.4. Photocatalytic Performance Test
2.5. Electrochemical Measurement
3. Results and Discussion
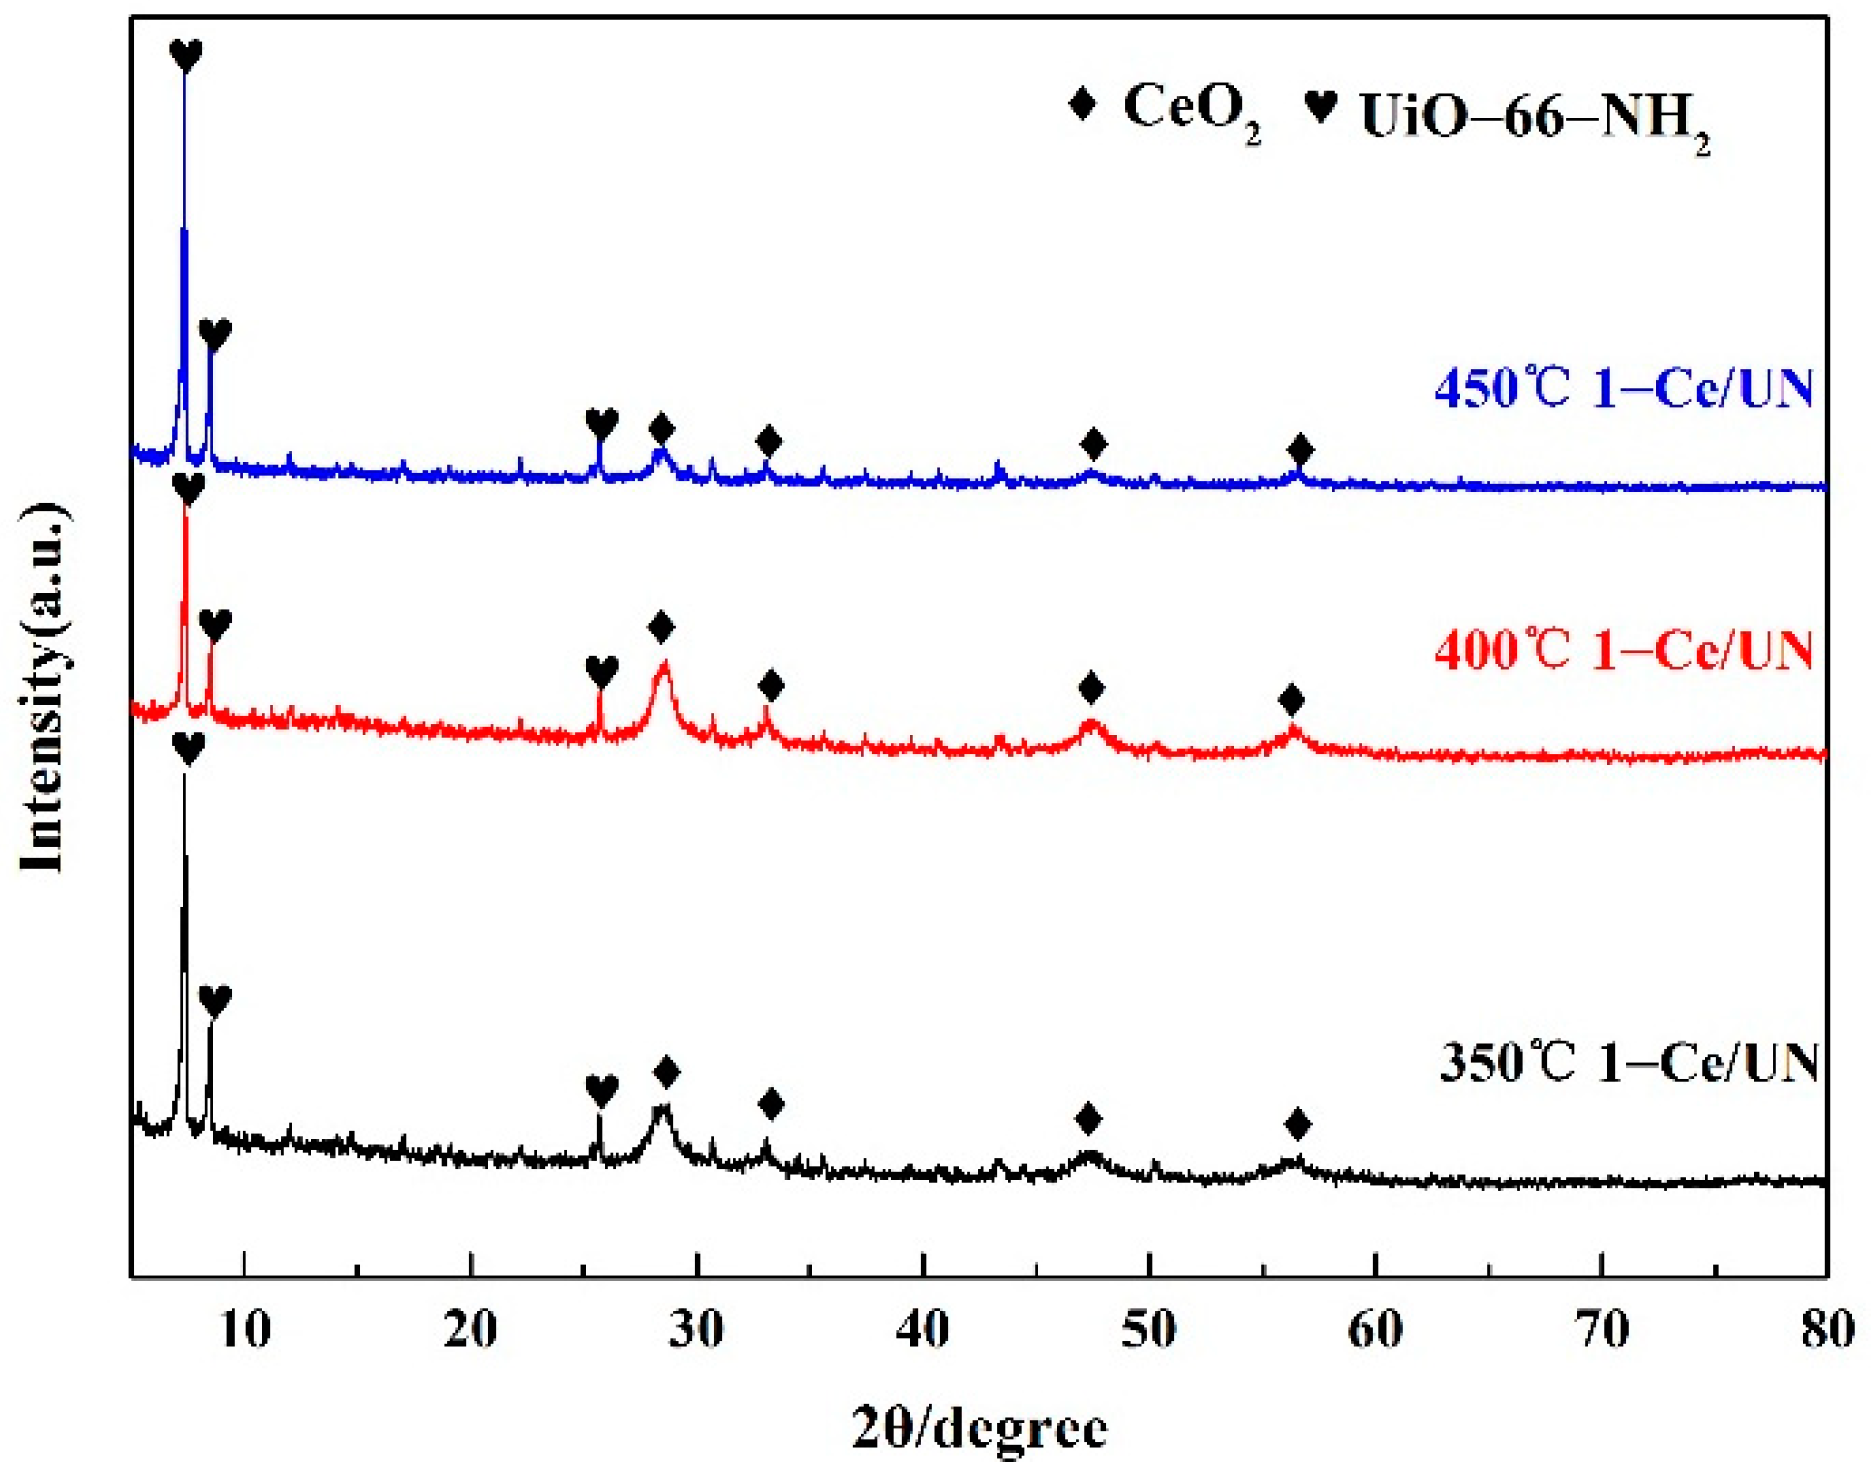
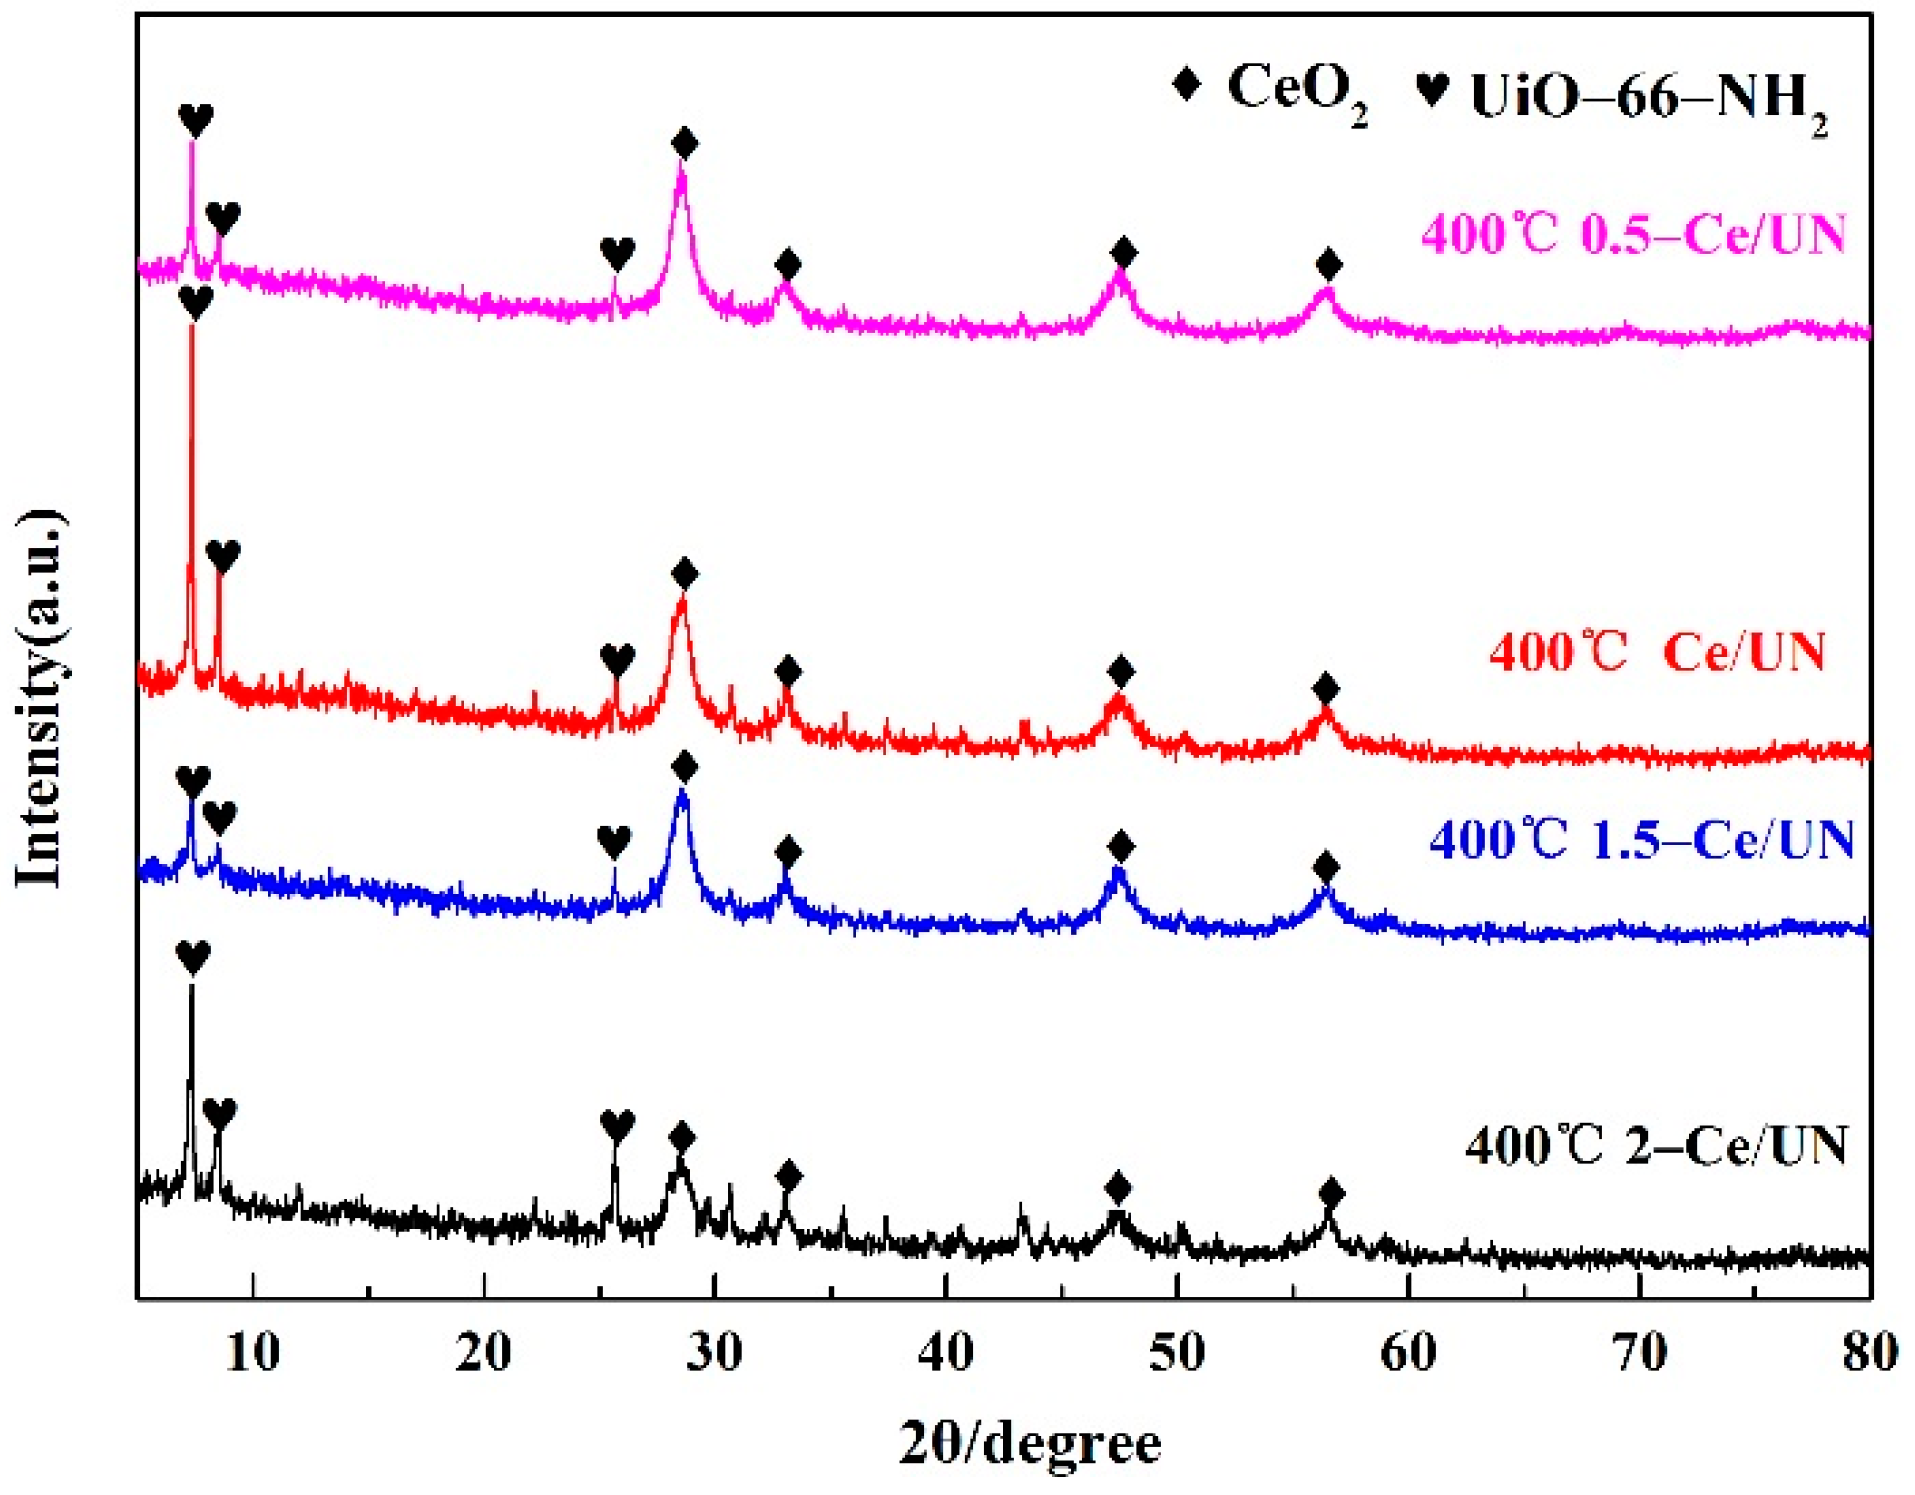
3.1. XRD Analysis
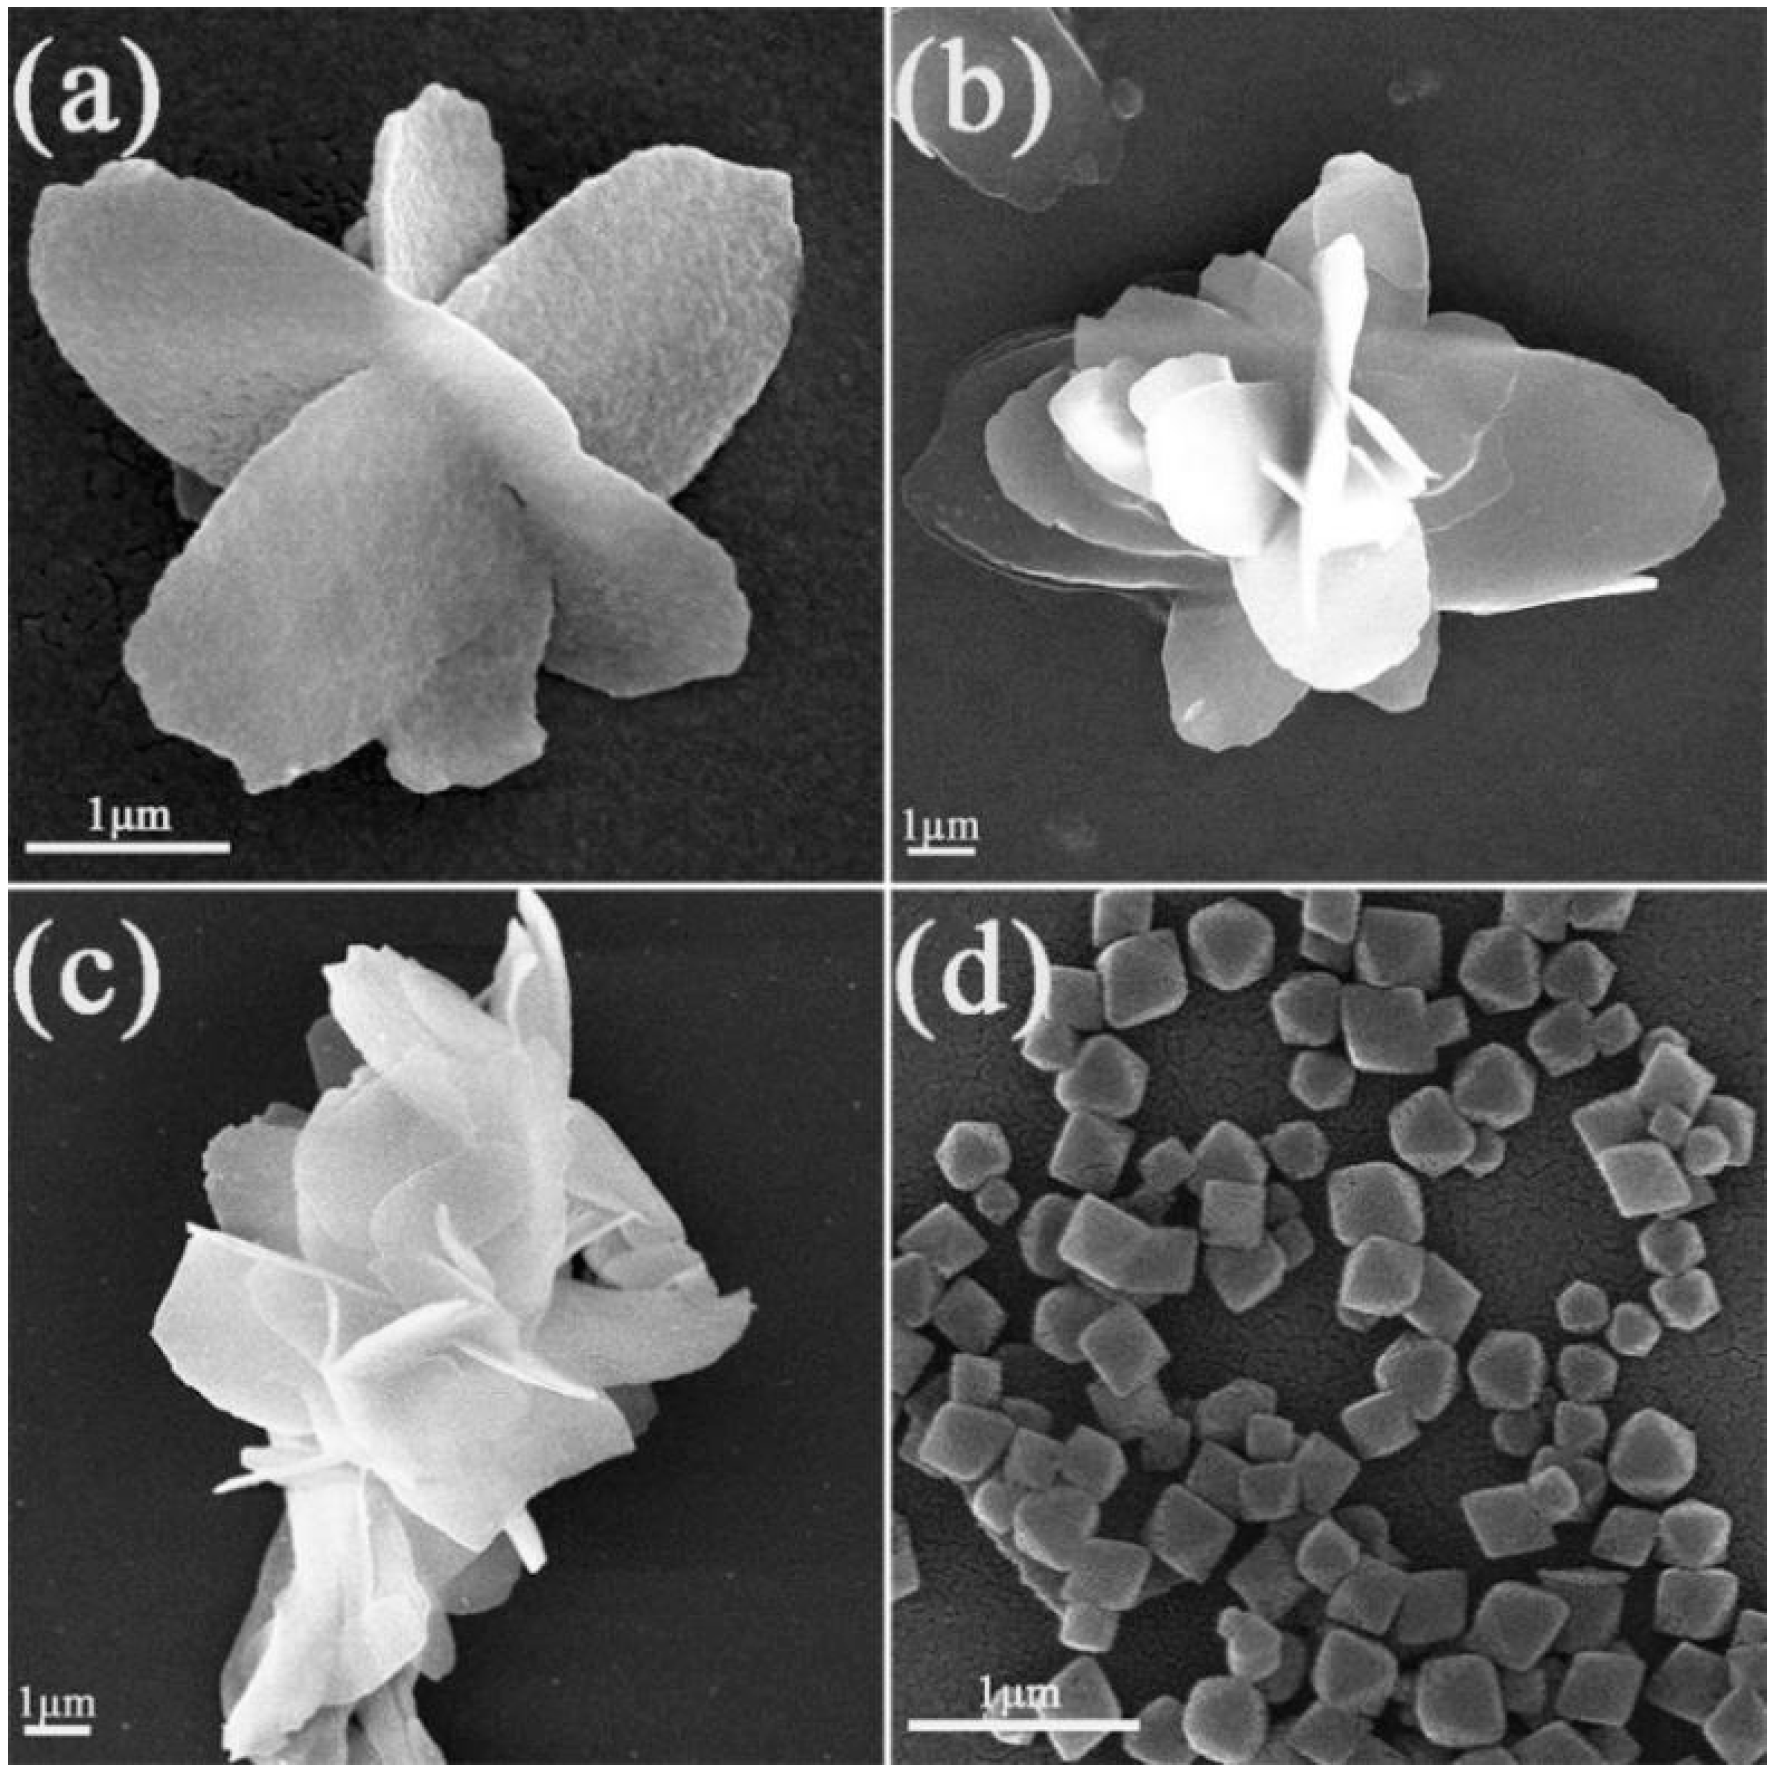
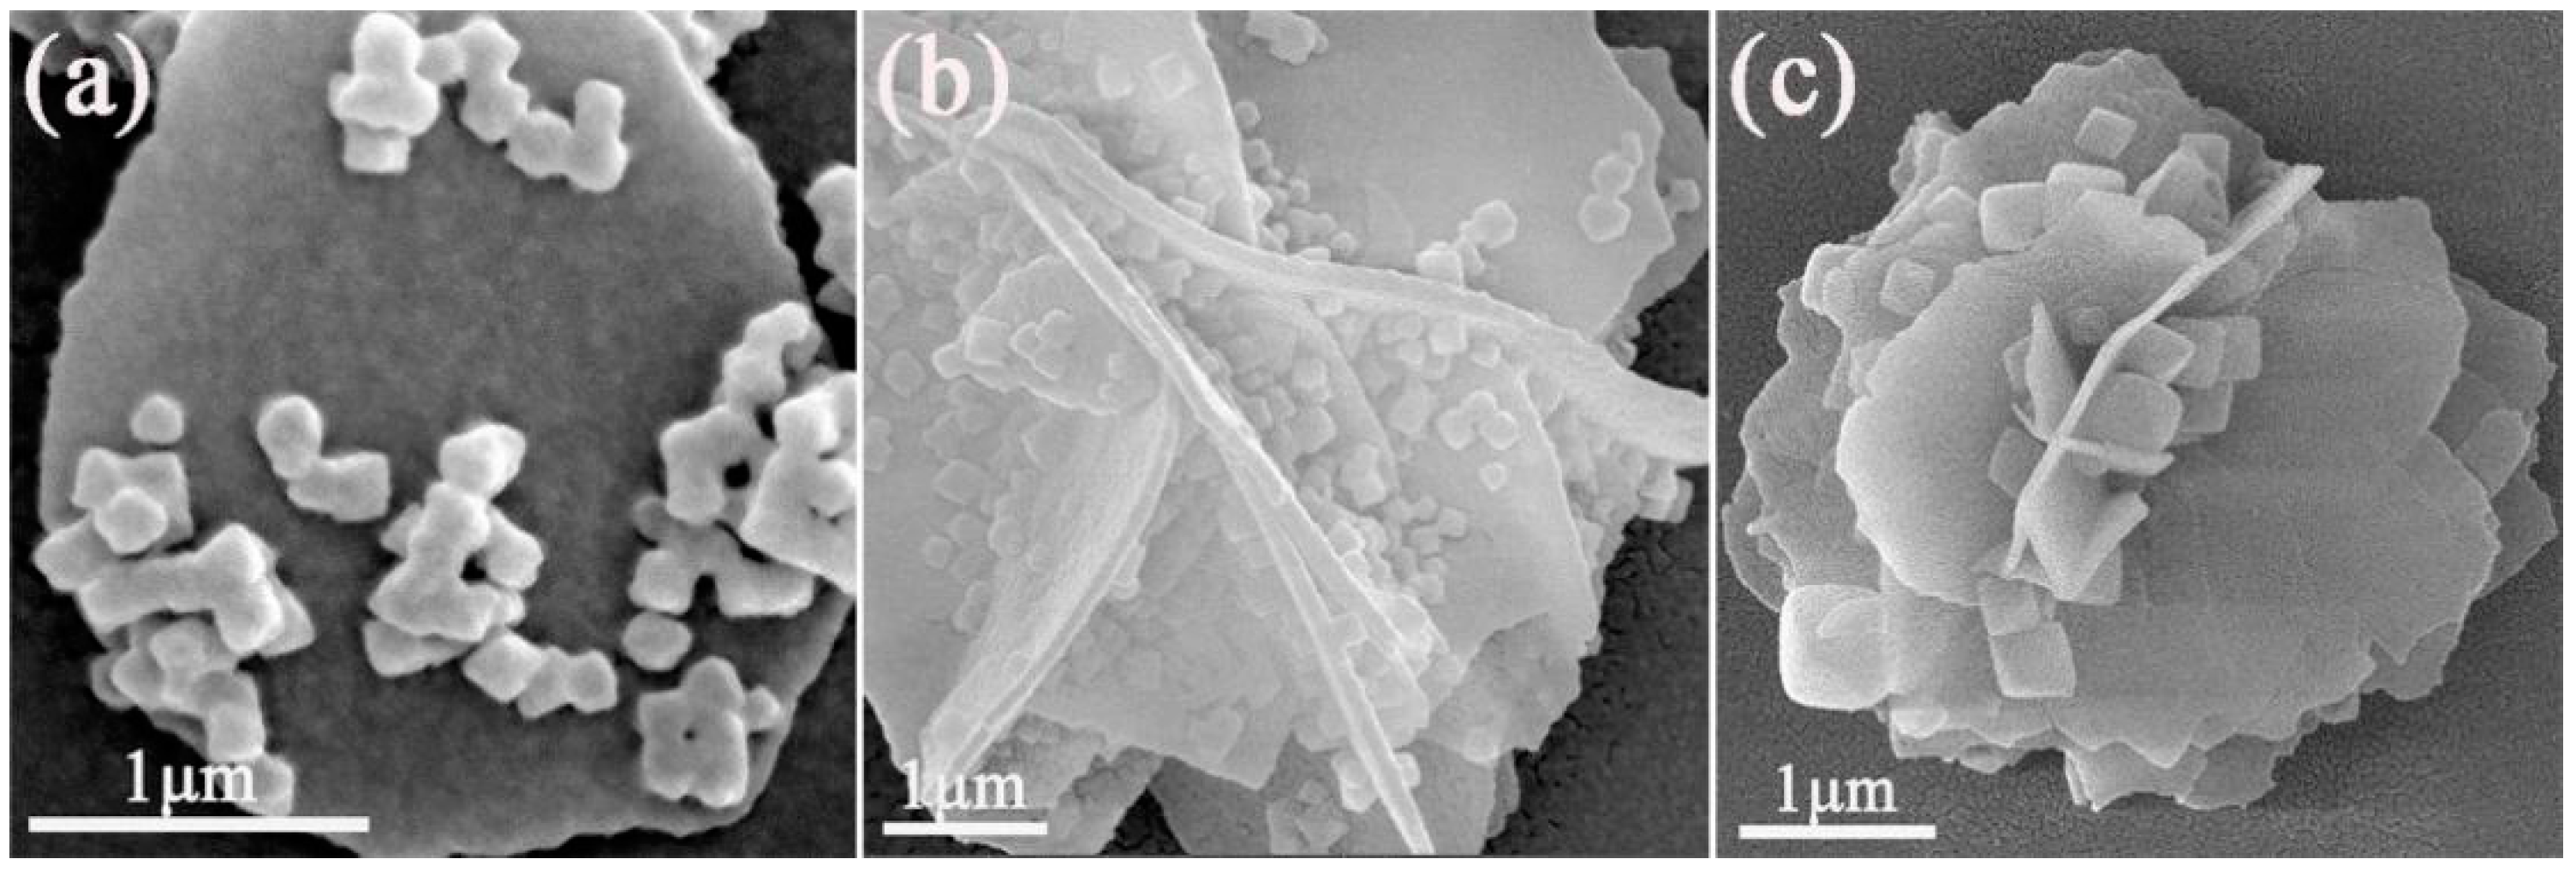
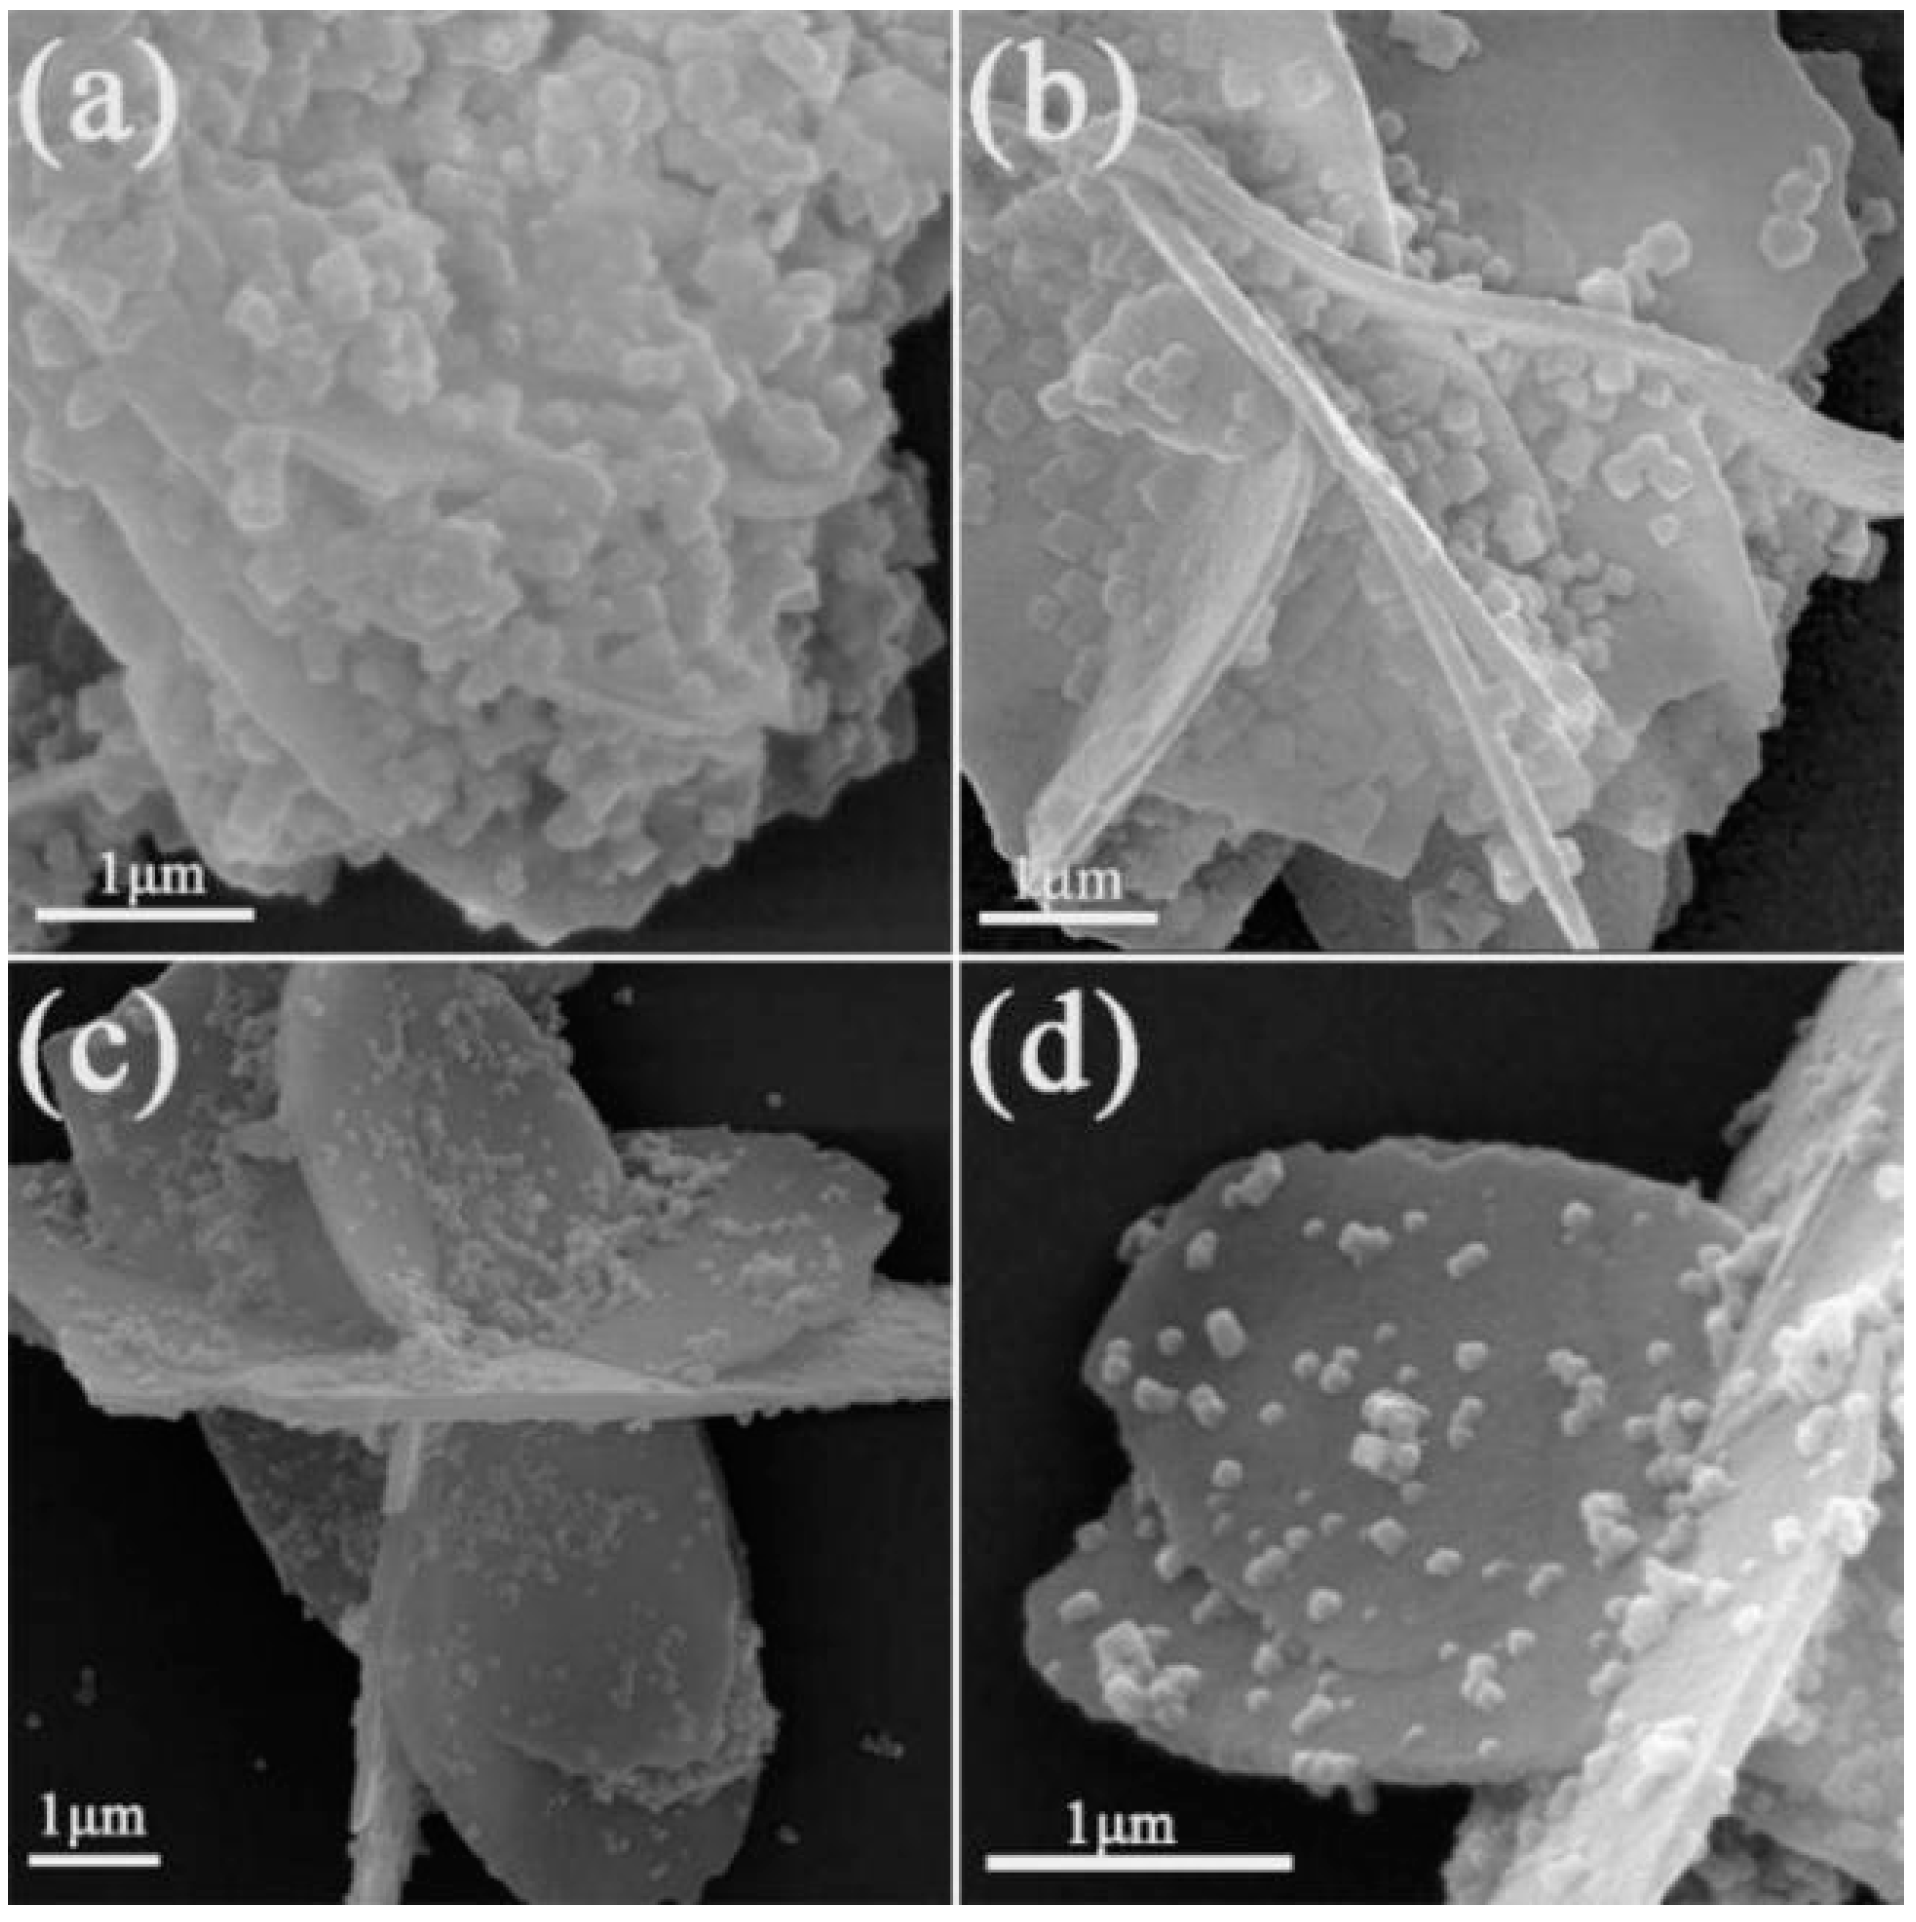
3.2. SEM Analysis
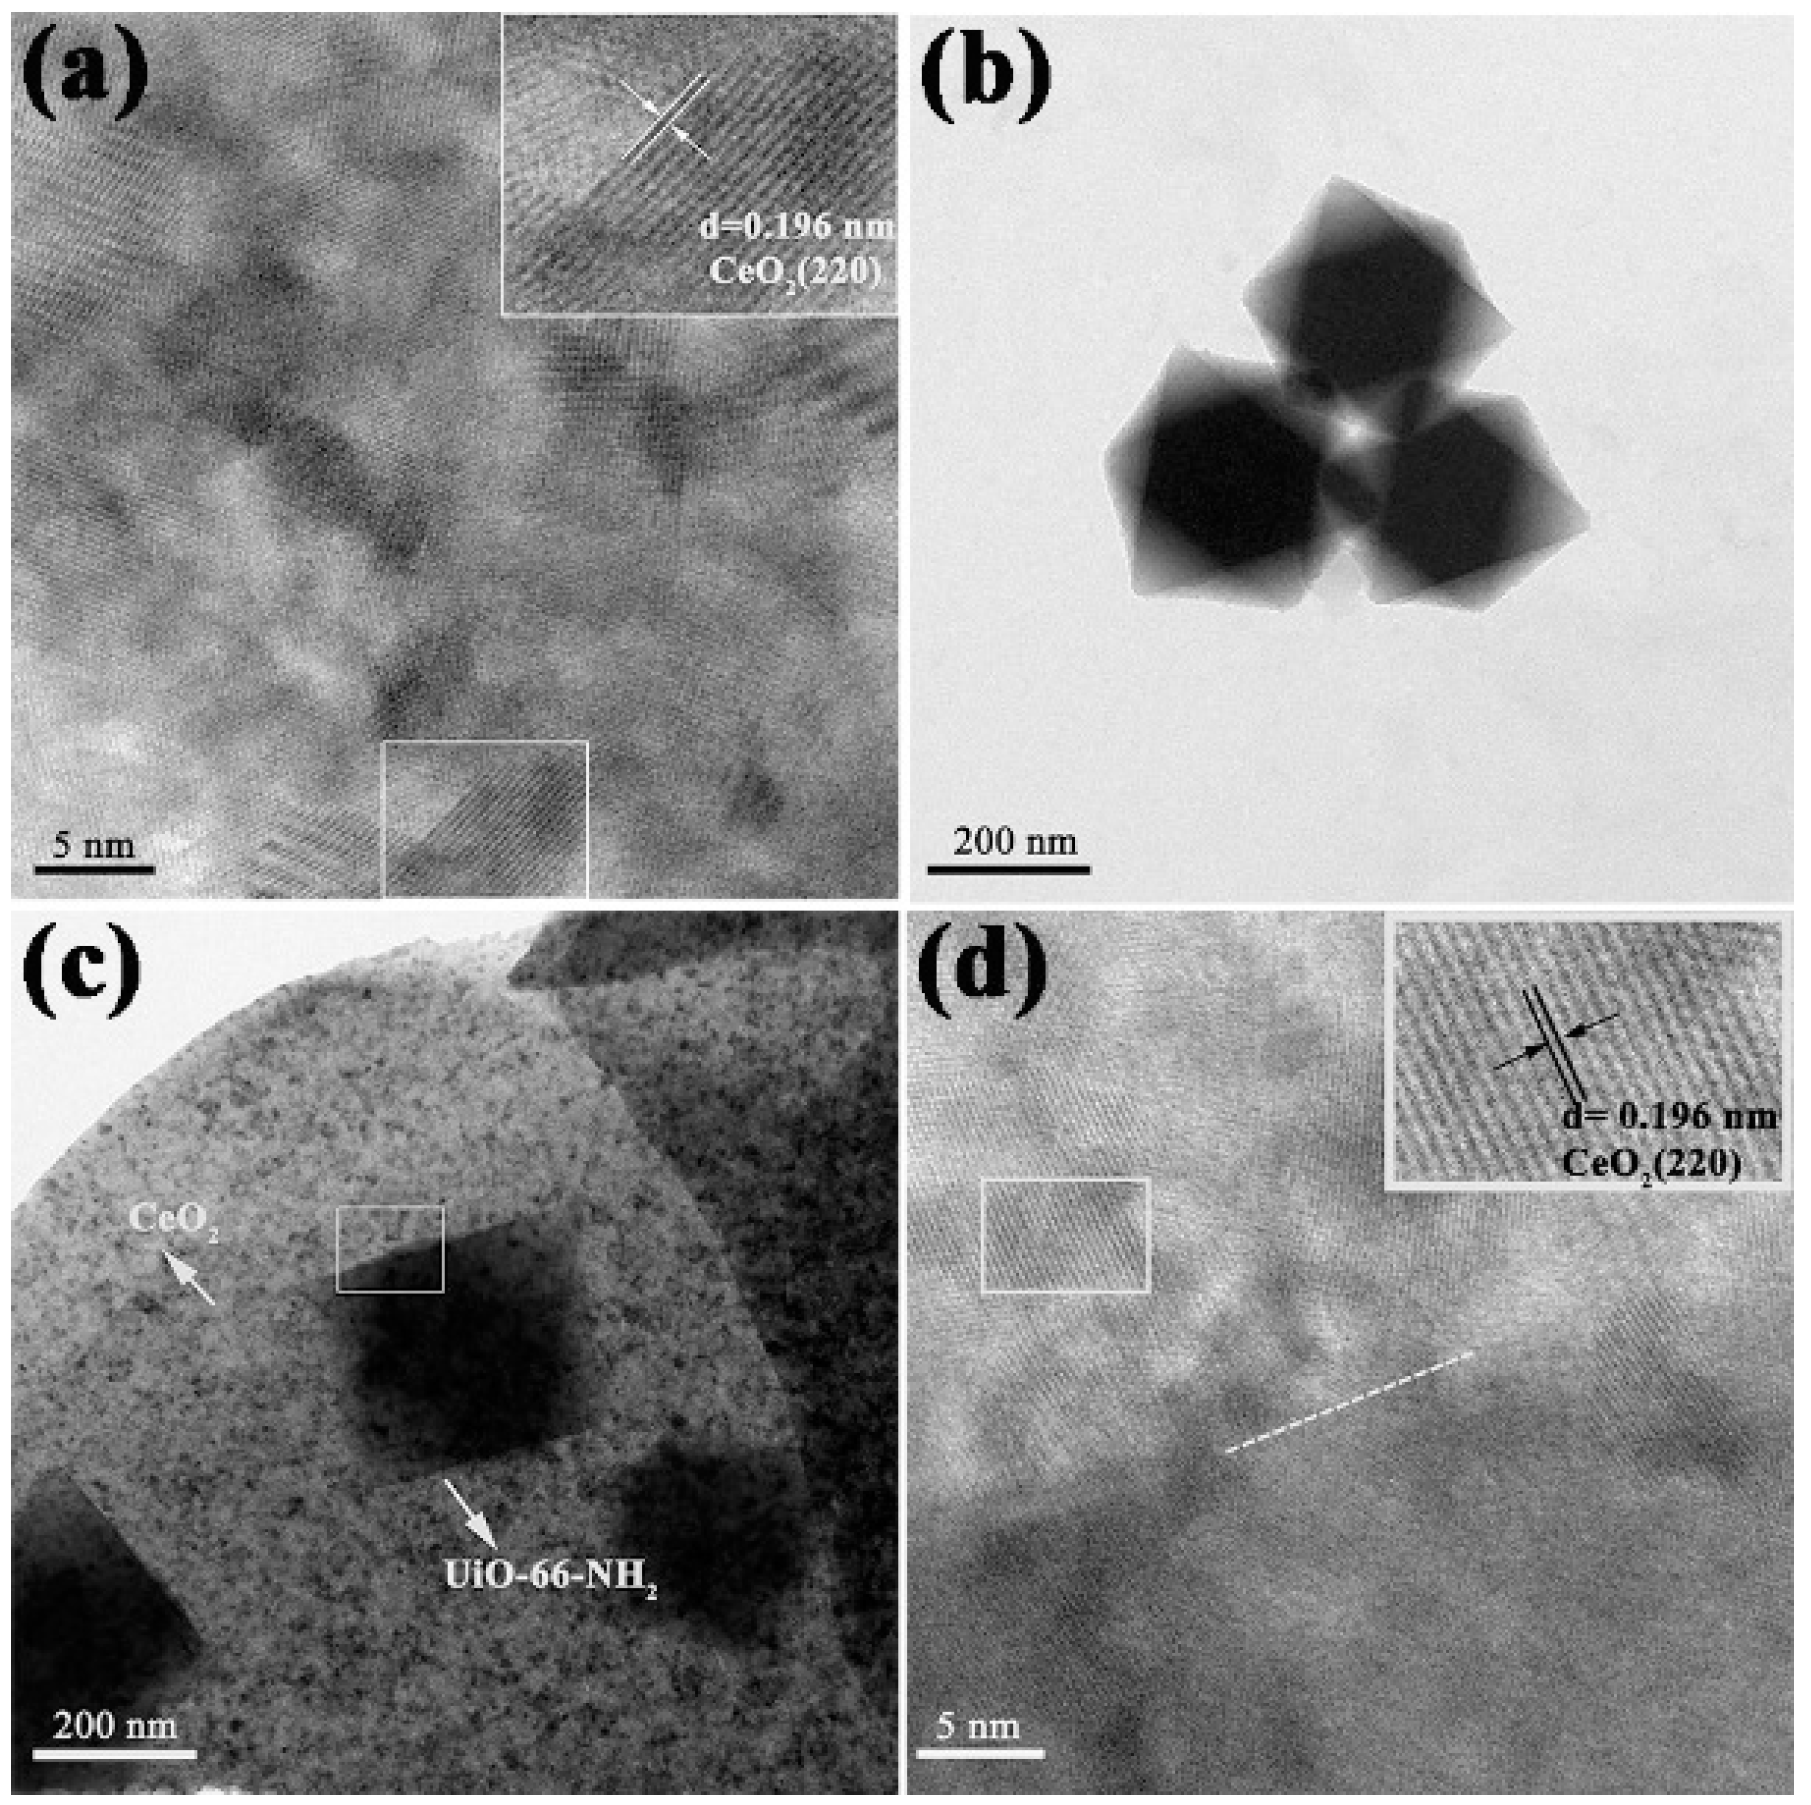
3.3. TEM Analysis
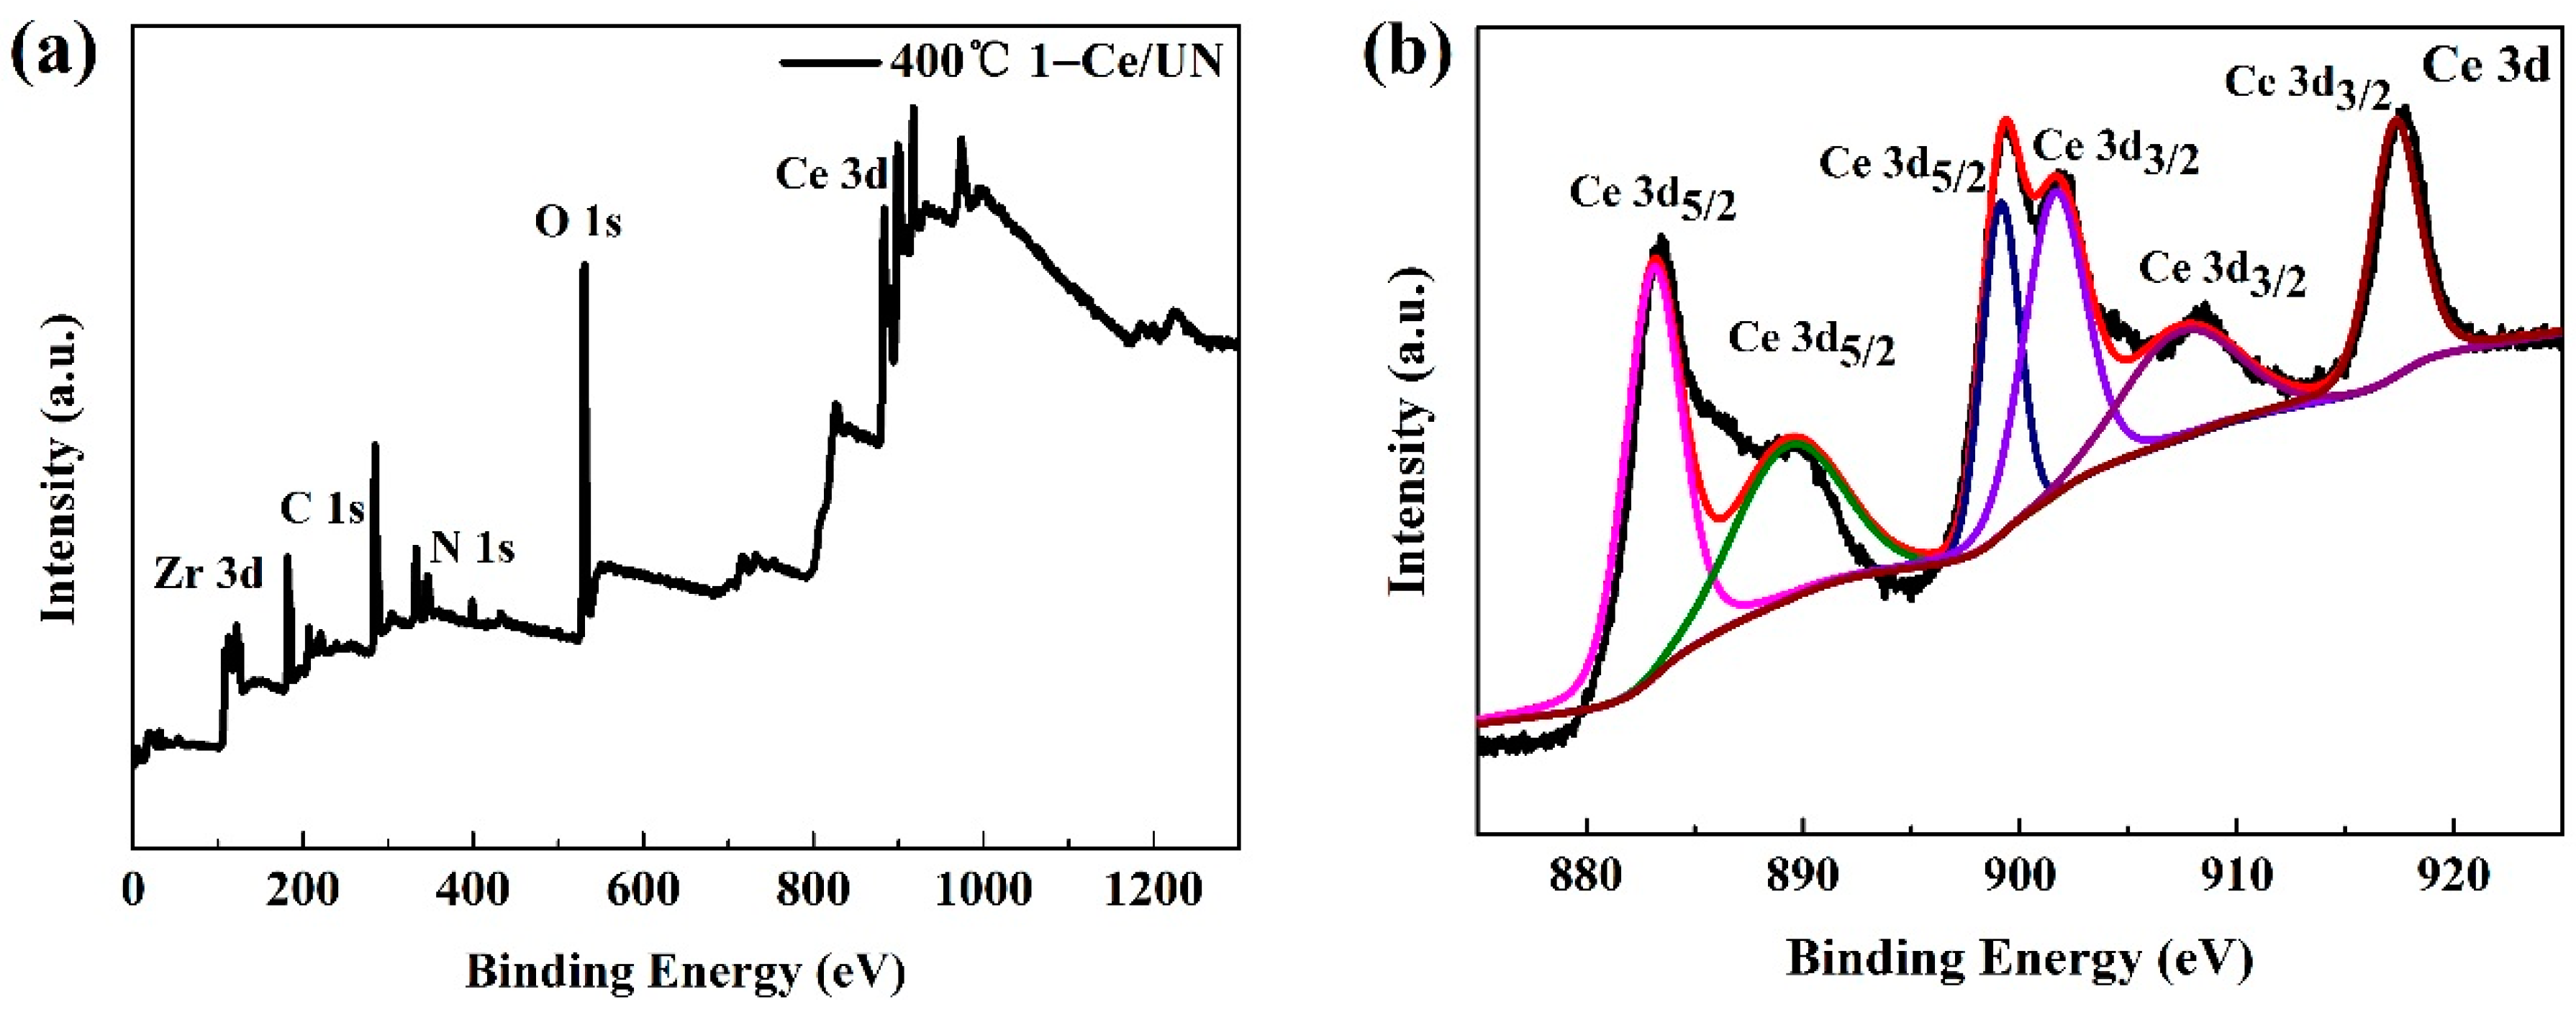
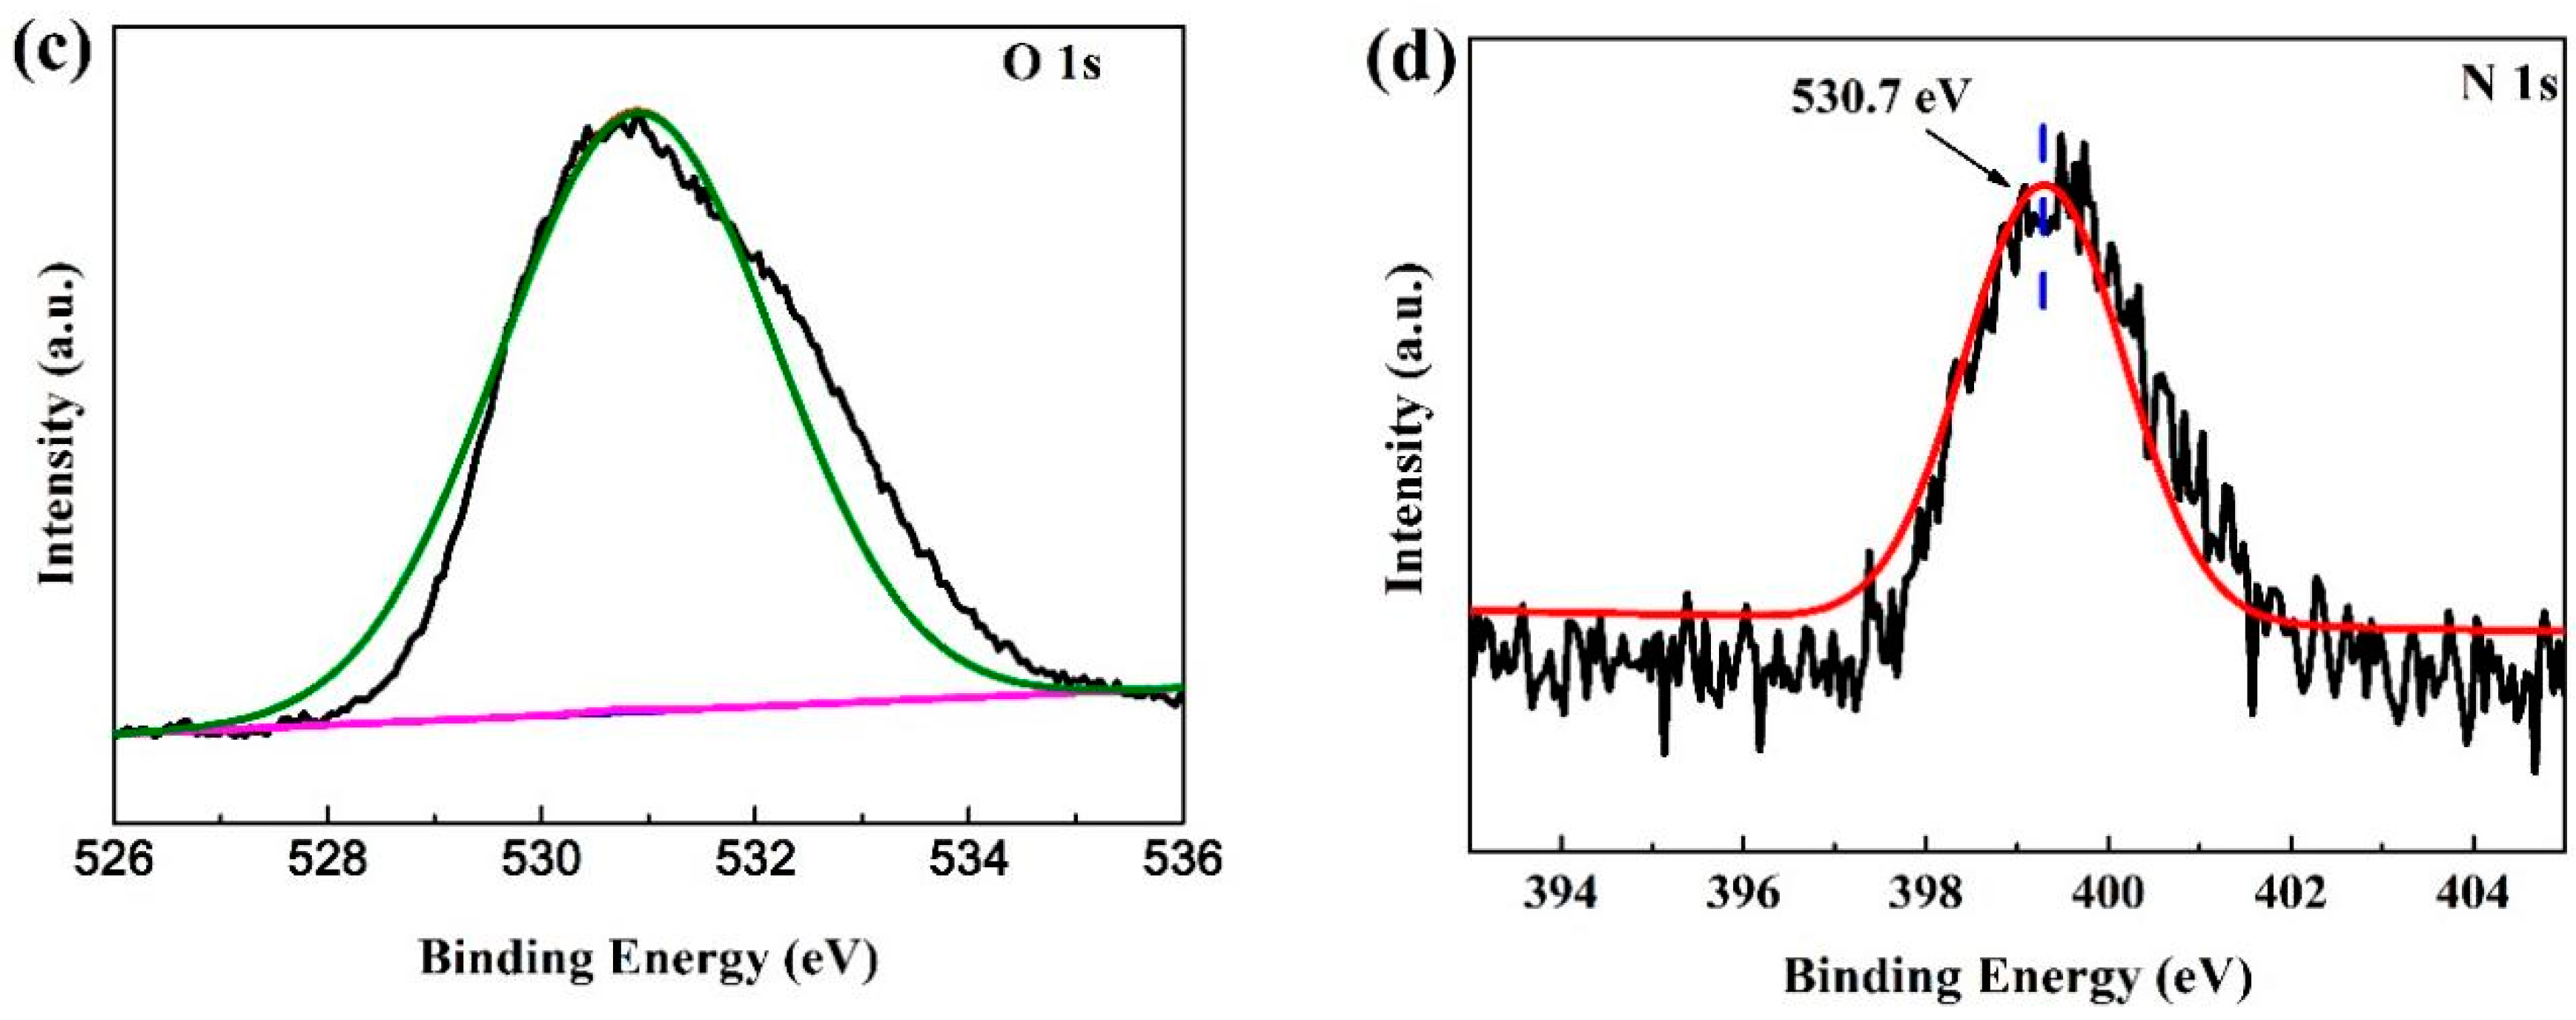
3.4. XPS Analysis
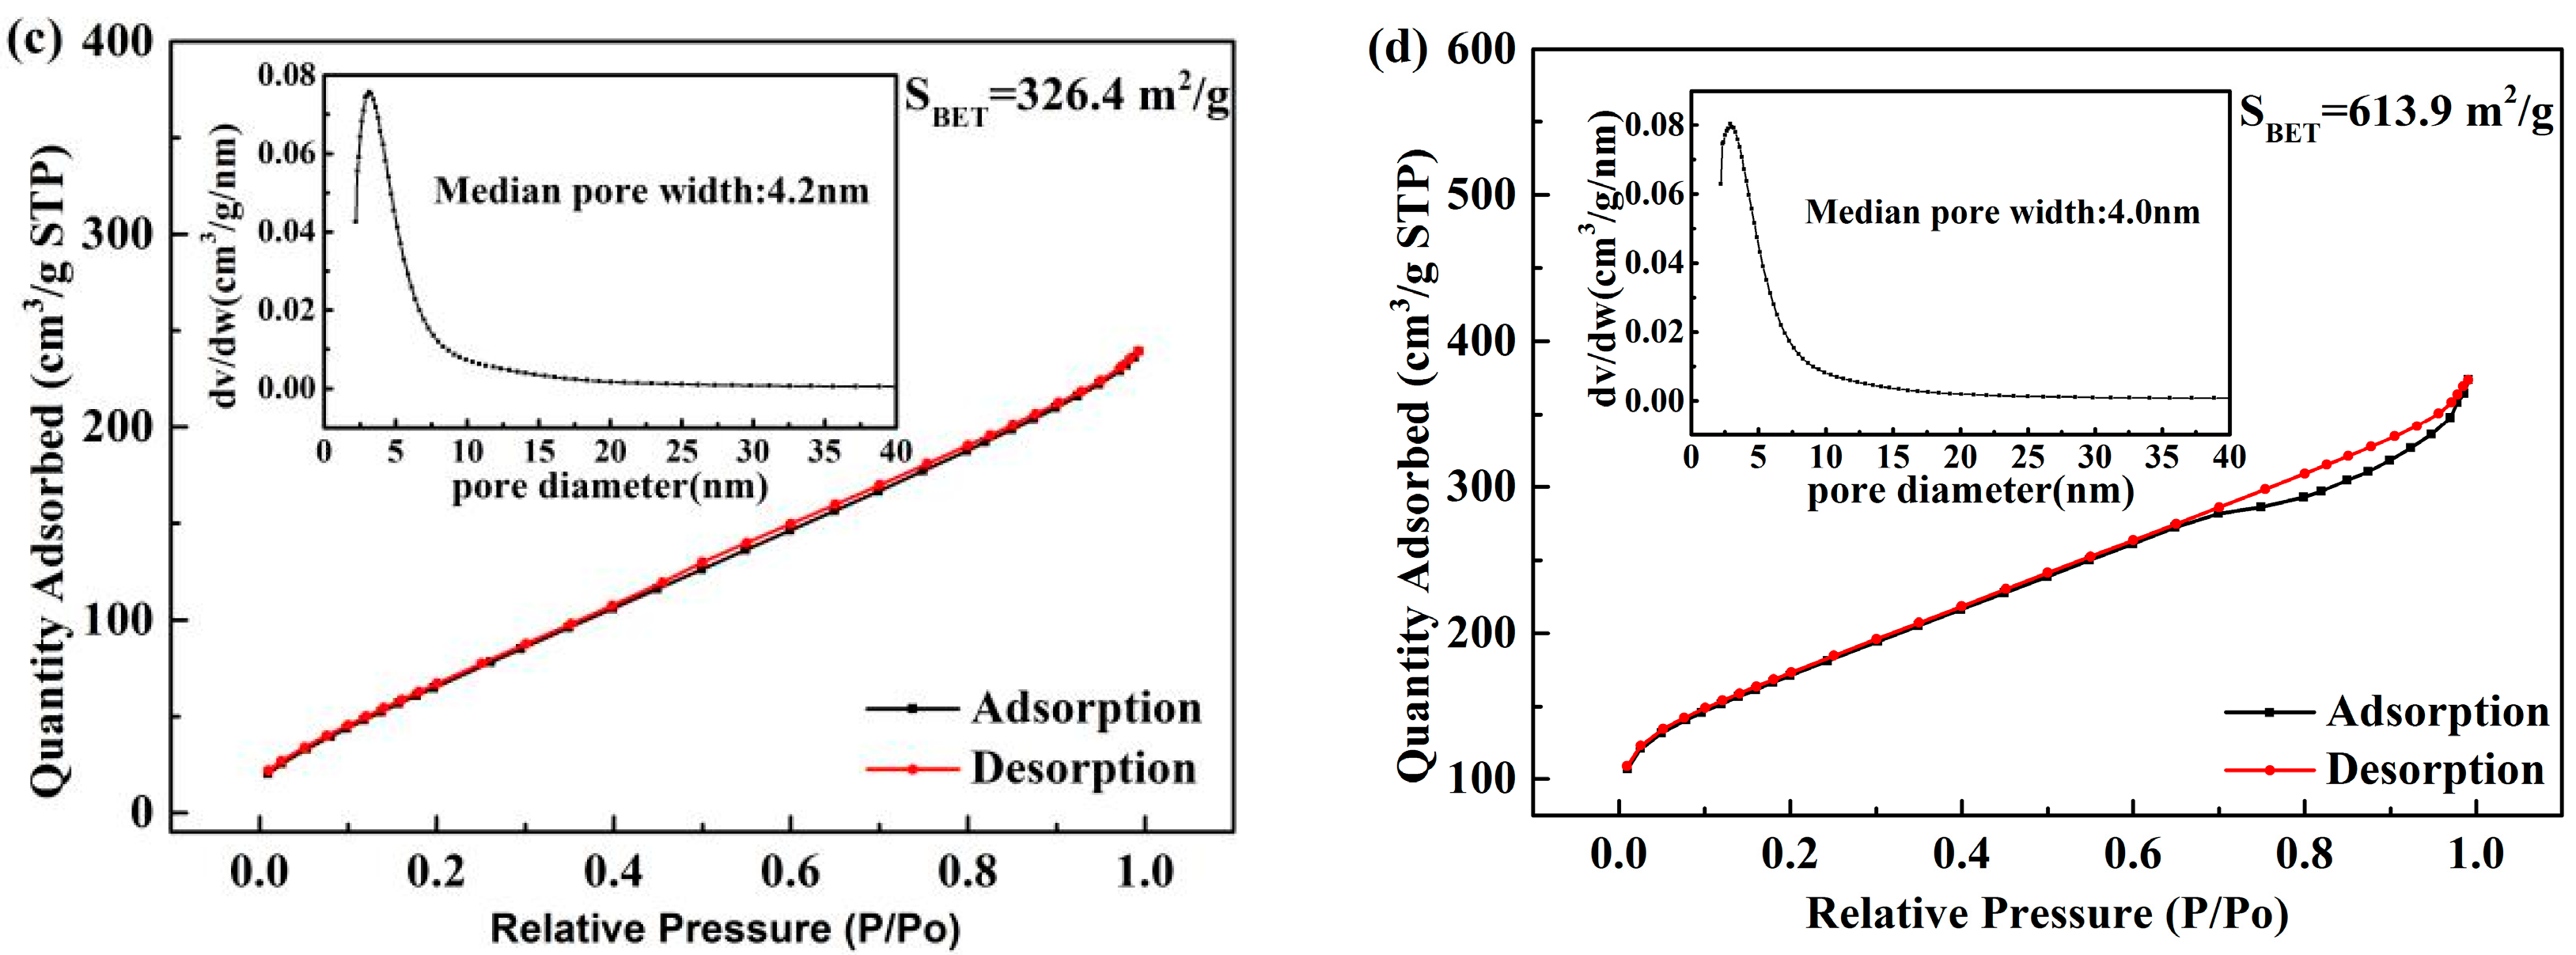
3.5. BET Analysis
3.6. Optical Properties
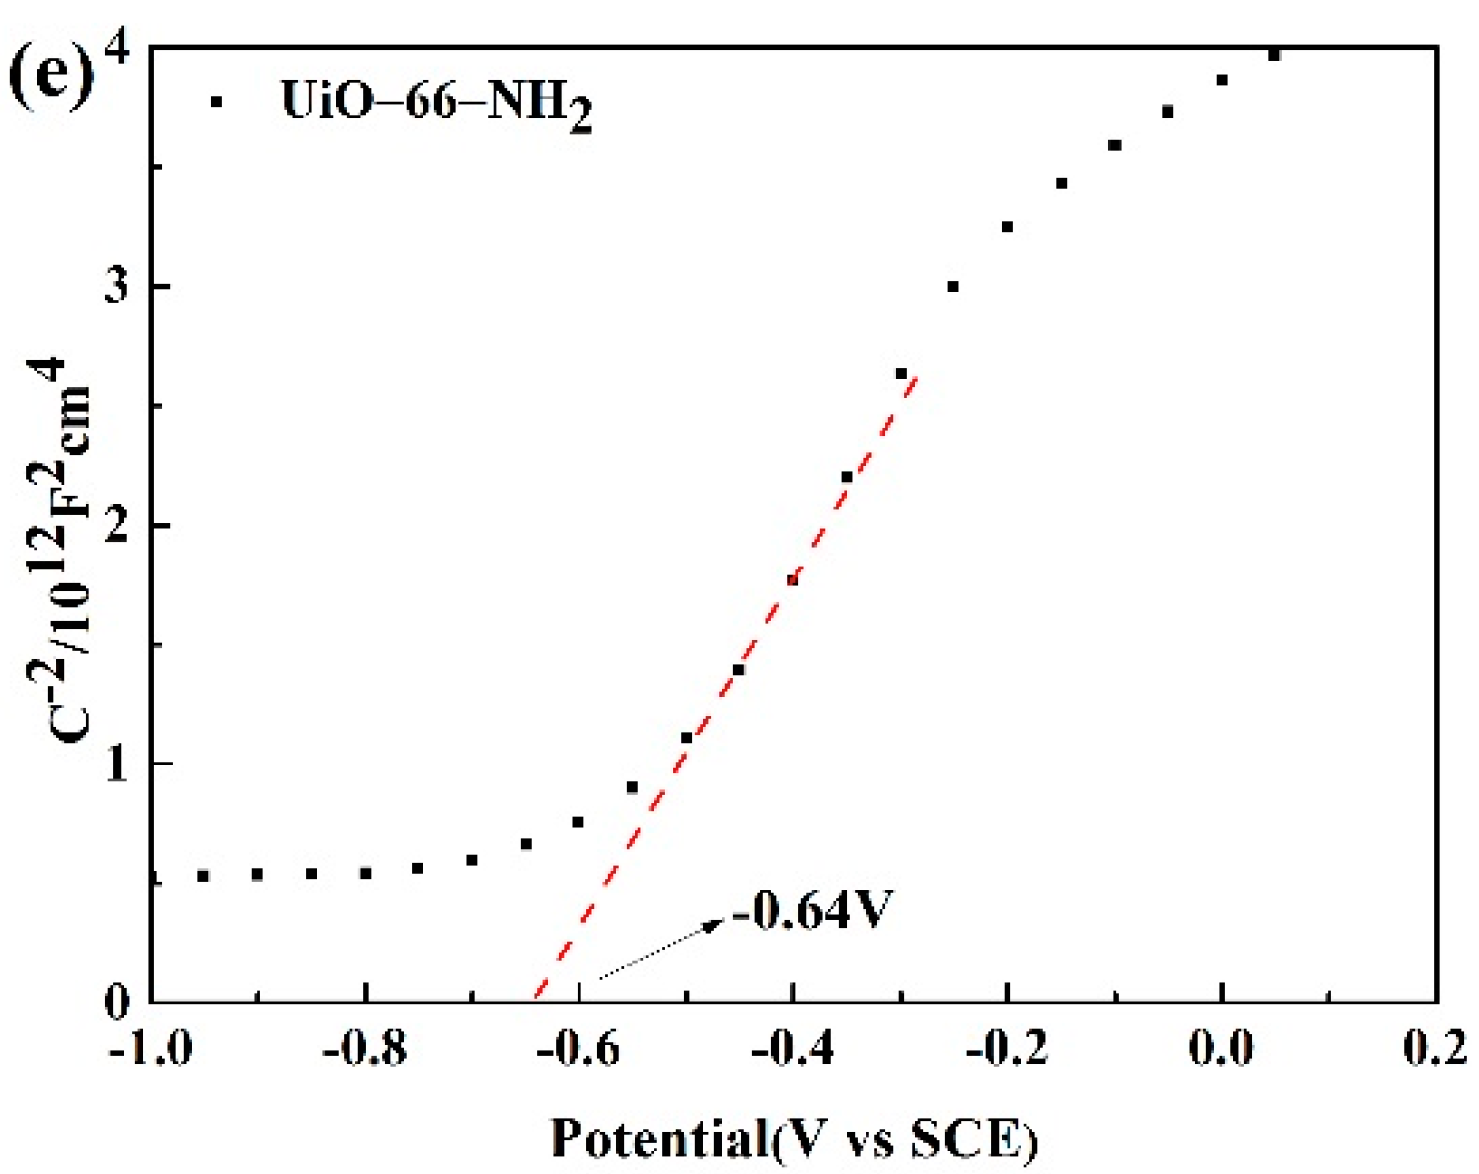
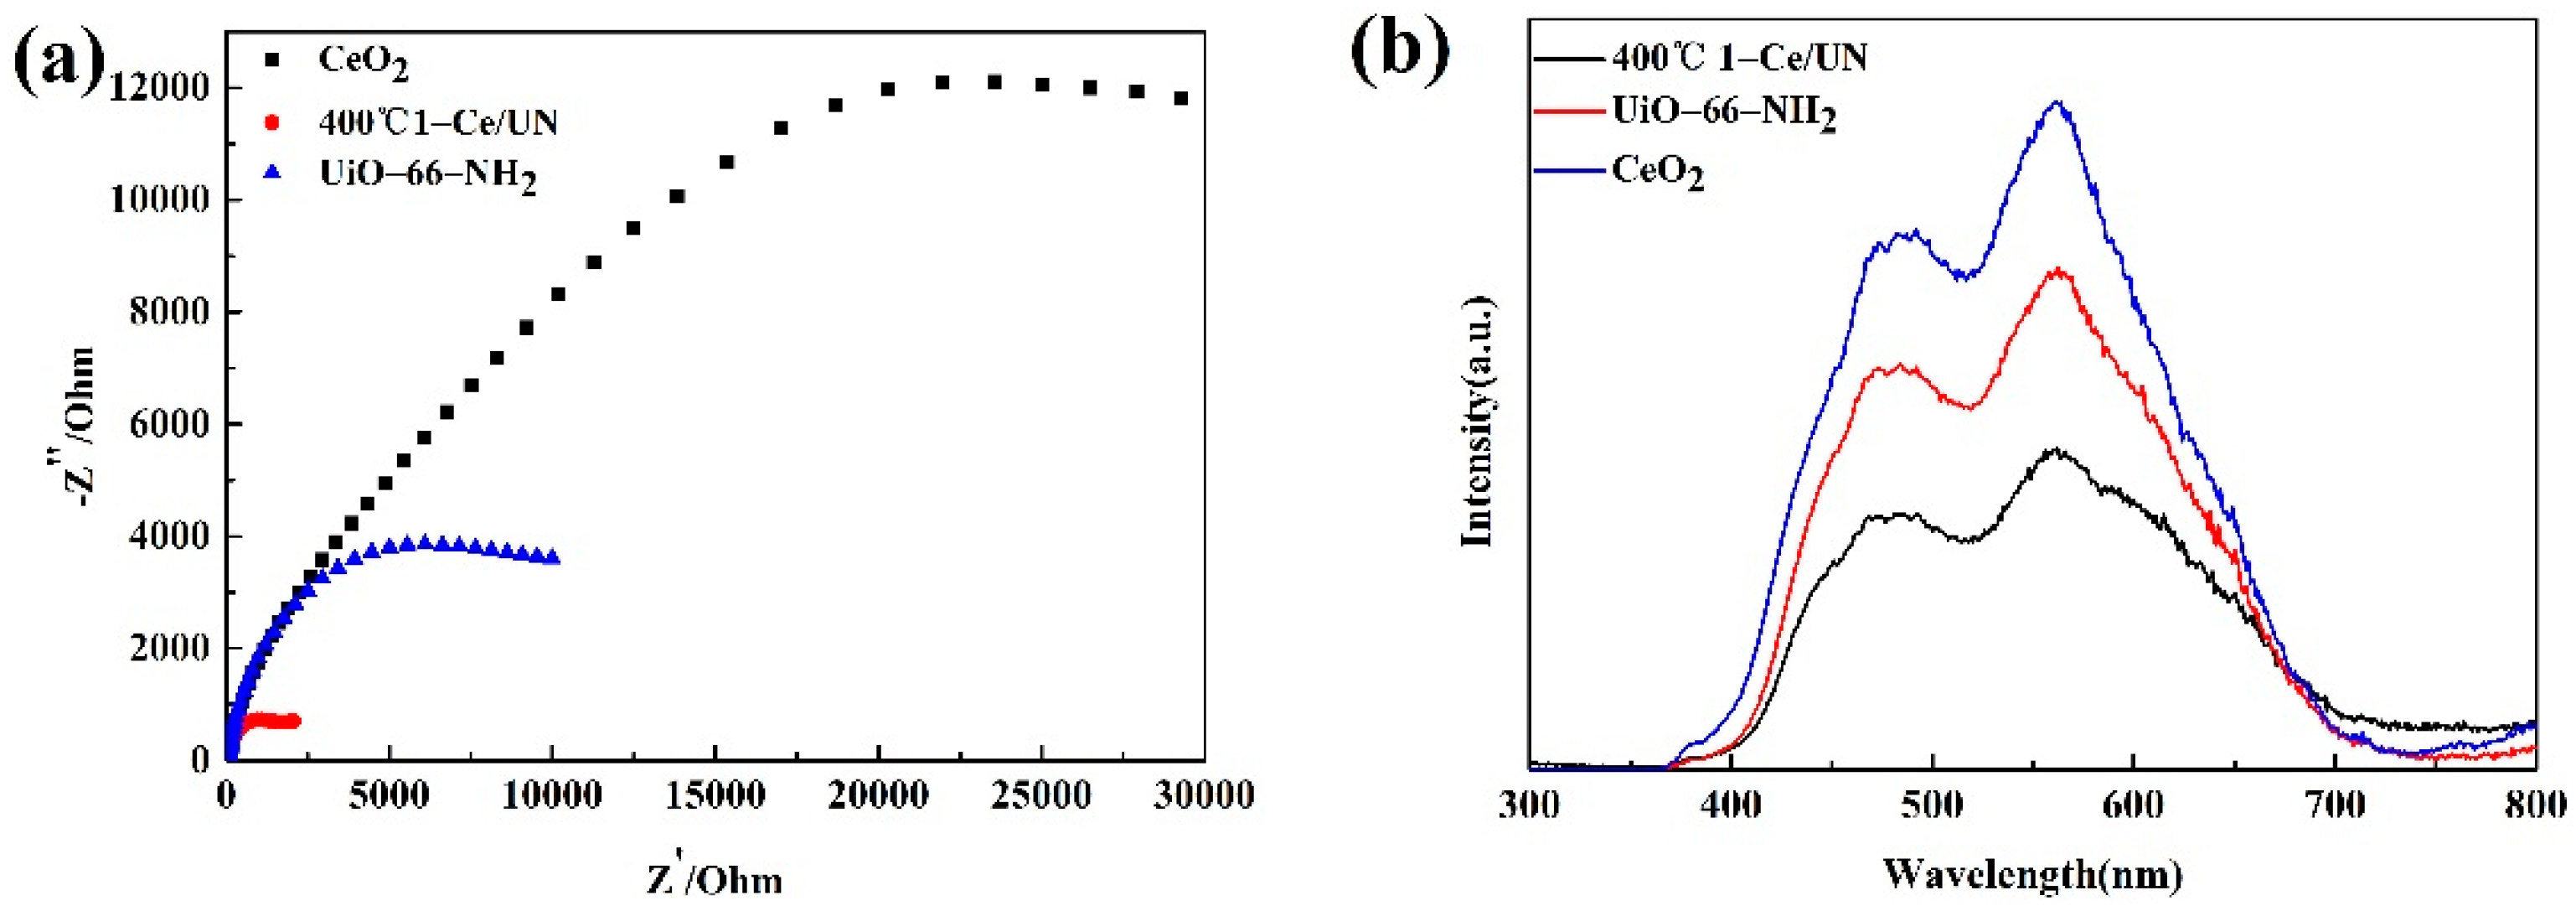
3.7. Properties about Electrochemistry and the PL Emission Spectra
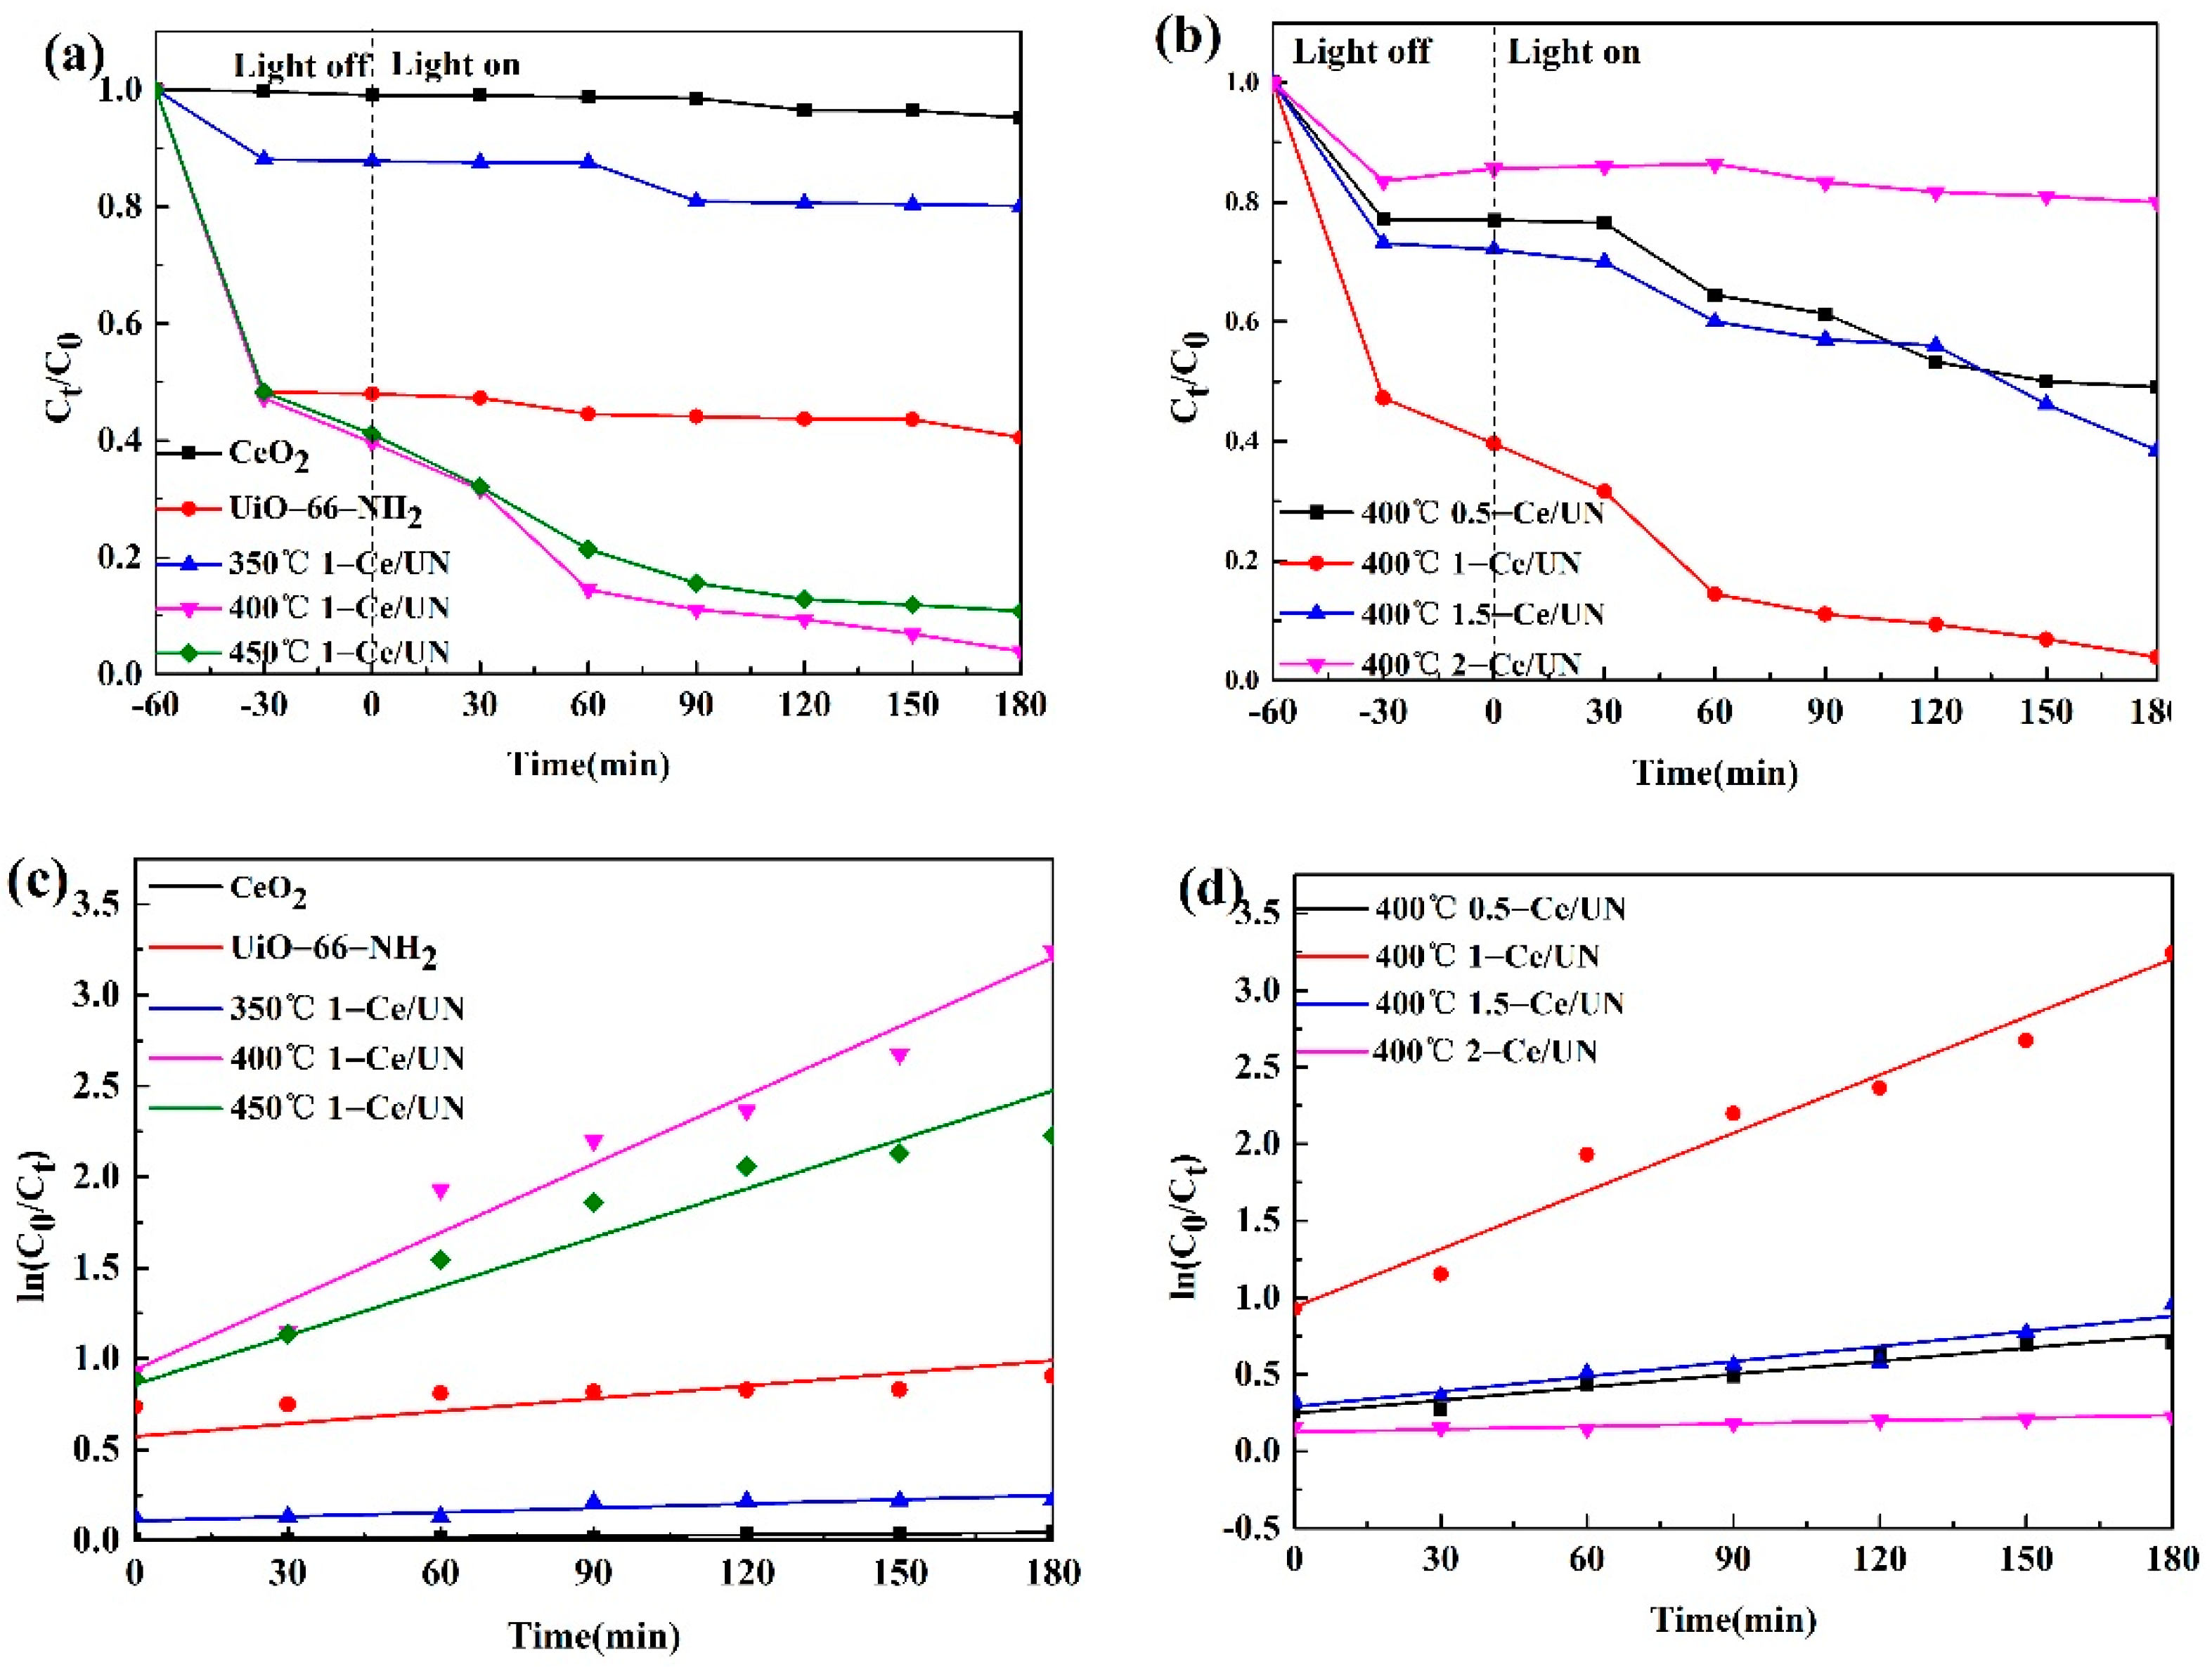
3.8. Photocatalytic Degradation Performance
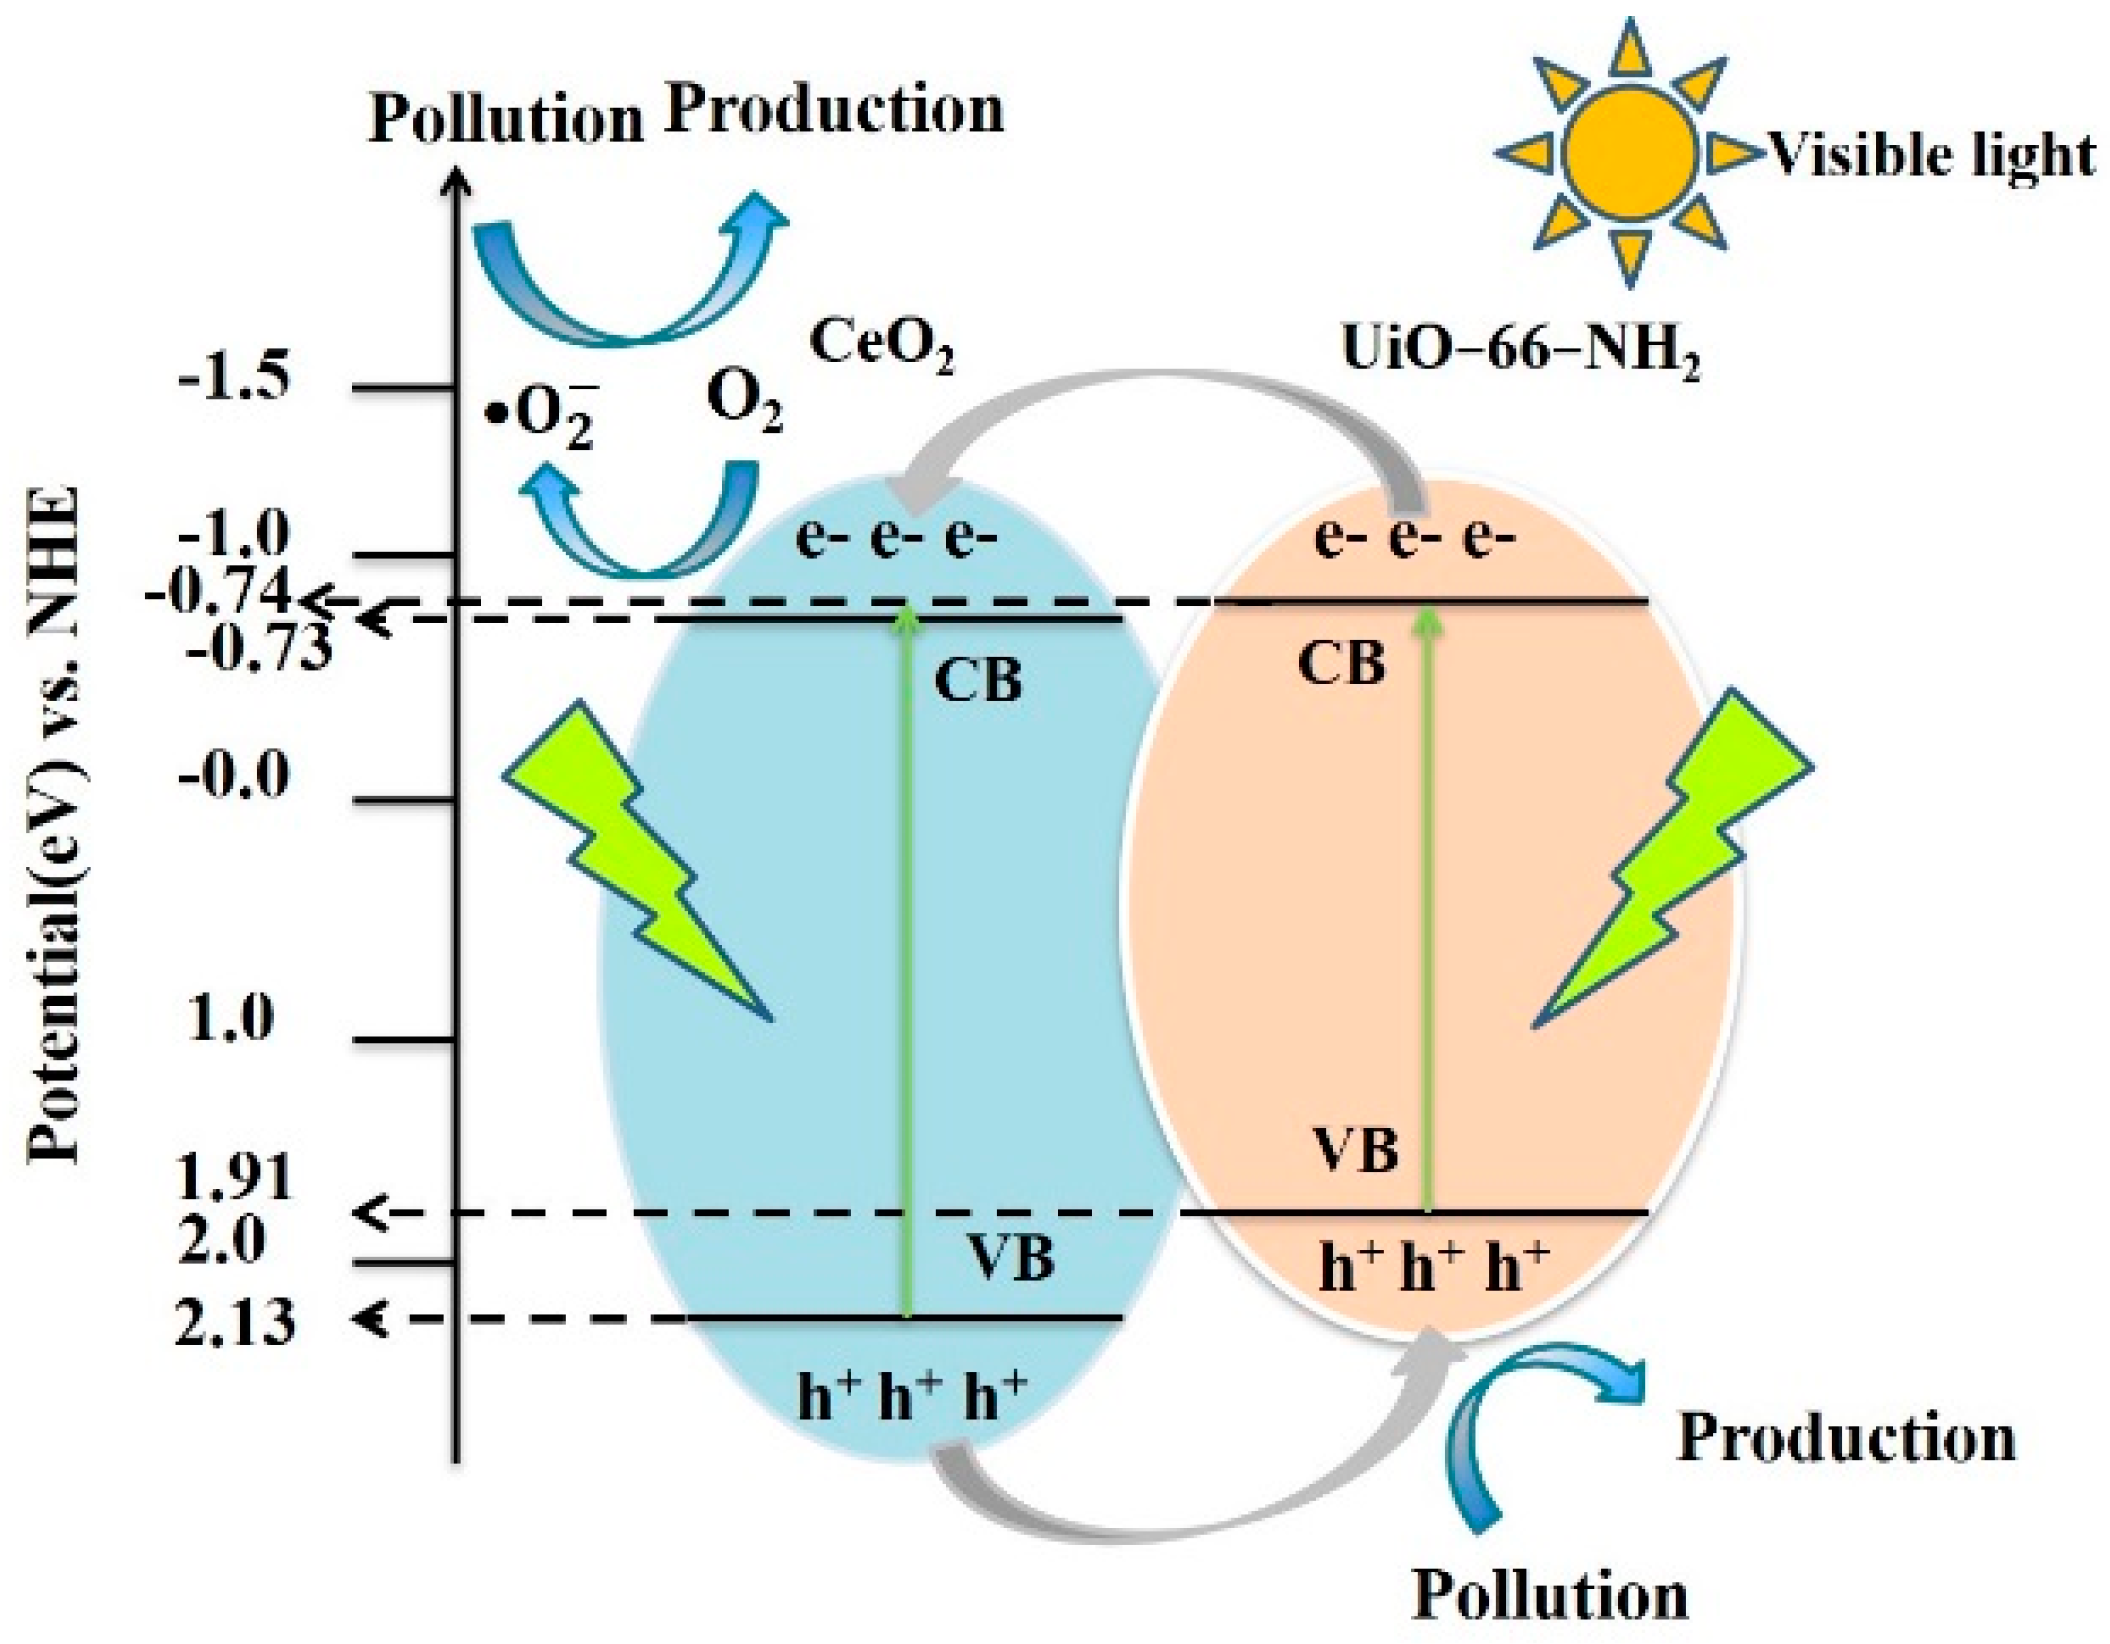
3.9. Photocatalytic Mechanism
4. Conclusions
Author Contributions
Funding
Institutional Review Board Statement
Informed Consent Statement
Data Availability Statement
Acknowledgments
Conflicts of Interest
References
- Ajmal, A.; Majeed, I.; Malik, R.N.; Idriss, H.; Nadeem, M.A. Principles and mechanisms of photocatalytic dye degradation on TiO2 based photocatalysts: A comparative overview. RSC Adv. 2014, 4, 37003–37026. [Google Scholar] [CrossRef]
- Gu, S.; Chen, Y.; Yuan, X.; Wang, H.; Chen, X.; Liu, Y.; Jiang, Q.; Wu, Z.; Zeng, G. Facile synthesis of CeO2 nanoparticle sensitized CdS nanorod photocatalyst with improved visible-light photocatalytic degradation of rhodamine B. RSC Adv. 2015, 5, 79556–79564. [Google Scholar] [CrossRef]
- Zheng, Y.; Liu, Y.; Guo, X.; Chen, Z.; Zhang, W.; Wang, Y.; Tang, X.; Zhang, Y.; Zhao, Y. Sulfur-doped g-C3N4/rGO porous nanosheets for highly efficient photocatalytic degradation of refractory contaminants. J. Mater. Sci. Technol. 2020, 41, 117–126. [Google Scholar] [CrossRef]
- Wen, X.-J.; Niu, C.-G.; Zhang, L.; Liang, C.; Guo, H.; Zeng, G.-M. Photocatalytic degradation of ciprofloxacin by a novel Z-scheme CeO2–Ag/AgBr photocatalyst: Influencing factors, possible degradation pathways, and mechanism insight. J. Catal. 2018, 358, 141–154. [Google Scholar] [CrossRef]
- Wang, H.; Liao, B.; Lu, T.; Ai, Y.; Liu, G. Enhanced visible-light photocatalytic degradation of tetracycline by a novel hollow BiOCl@CeO2 heterostructured microspheres: Structural characterization and reaction mechanism. J. Hazard. Mater. 2020, 385, 121552. [Google Scholar] [CrossRef]
- Hu, S.; Zhou, F.; Wang, L.; Zhang, J. Preparation of Cu2O/CeO2 heterojunction photocatalyst for the degradation of Acid Orange 7 under visible light irradiation. Catal. Commun. 2011, 12, 794–797. [Google Scholar] [CrossRef]
- Ma, R.; Zhang, S.; Wen, T.; Gu, P.; Li, L.; Zhao, G.; Niu, F.; Huang, Q.; Tang, Z.; Wang, X. A critical review on visible-light-response CeO2-based photocatalysts with enhanced photooxidation of organic pollutants. Catal. Today 2019, 335, 20–30. [Google Scholar] [CrossRef]
- He, J.; Zhou, L.; Liu, J.; Ling, Z.; Yang, L.; Zou, L.; Xiang, J.; Dong, S.; Yang, X. Modulation of surface structure and catalytic properties of cerium oxide nanoparticles by thermal and microwave synthesis techniques. Appl. Surf. Sci. 2017, 402, 469–477. [Google Scholar] [CrossRef]
- Mansingh, S.; Padhi, D.K.; Parida, K.M. Enhanced visible light harnessing and oxygen vacancy promoted N, S co-doped CeO2 nanoparticle: A challenging photocatalyst for Cr(vi) reduction. Catal. Sci. Technol. 2017, 7, 2772–2781. [Google Scholar] [CrossRef]
- Xie, S.L.; Wang, Z.L.; Cheng, F.L.; Zhang, P.; Mai, W.J.; Tong, Y.X. Ceria and ceria-based nanostructured materials for photoenergy applications. Nano Energy 2017, 34, 313–337. [Google Scholar] [CrossRef]
- Wu, B.; Shan, C.; Zhang, X.; Zhao, H.Y.; Ma, S.M.; Shi, Y.X.; Yang, J.; Bai, H.C.; Liu, Q. CeO2/Co3O4 porous nanosheet prepared using rose petal as biotemplate for photo-catalytic degradation of organic contaminants. Appl. Surf. Sci. 2021, 543, 148677. [Google Scholar] [CrossRef]
- Shen, C.-H.; Wen, X.-J.; Fei, Z.-H.; Liu, Z.-T.; Mu, Q.-M. Visible-light-driven activation of peroxymonosulfate for accelerating ciprofloxacin degradation using CeO2/Co3O4 p-n heterojunction photocatalysts. Chem. Eng. J. 2020, 391, 123612. [Google Scholar] [CrossRef]
- Pu, Y.; Luo, Y.; Wei, X.; Sun, J.; Li, L.; Zou, W.; Dong, L. Synergistic effects of Cu2O-decorated CeO2 on photocatalytic CO2 reduction: Surface Lewis acid/base and oxygen defect. Appl. Catal. B Environ. 2019, 254, 580–586. [Google Scholar] [CrossRef]
- Chae, B.W.; Amna, T.; Hassan, M.S.; Al-Deyab, S.S.; Khil, M.-S. CeO2-Cu2O composite nanofibers: Synthesis, characterization photocatalytic and electrochemical application. Adv. Powder Technol. 2017, 28, 230–235. [Google Scholar] [CrossRef]
- You, D.; Pan, B.; Jiang, F.; Zhou, Y.; Su, W. CdS nanoparticles/CeO2 nanorods composite with high-efficiency visible-light-driven photocatalytic activity. Appl. Surf. Sci. 2016, 363, 154–160. [Google Scholar] [CrossRef]
- Lu, X.-H.; Xie, S.-L.; Zhai, T.; Zhao, Y.-F.; Zhang, P.; Zhang, Y.-L.; Tong, Y.-X. Monodisperse CeO2/CdS heterostructured spheres: One-pot synthesis and enhanced photocatalytic hydrogen activity. RSC Adv. 2011, 1, 1207–1210. [Google Scholar] [CrossRef]
- Zhang, P.; Liu, Y.; Tian, B.; Luo, Y.; Zhang, J. Synthesis of core-shell structured CdS@CeO2 and CdS@TiO2 composites and comparison of their photocatalytic activities for the selective oxidation of benzyl alcohol to benzaldehyde. Catal. Today 2017, 281, 181–188. [Google Scholar] [CrossRef]
- Yaghi, O.M.; O’Keeffe, M.; Ockwig, N.W.; Chae, H.K.; Eddaoudi, M.; Kim, J. Reticular synthesis and the design of new materials. Nature 2003, 423, 705–714. [Google Scholar] [CrossRef]
- Hasegawa, S.; Horike, S.; Matsuda, R.; Furukawa, S.; Mochizuki, K.; Kinoshita, Y.; Kitagawa, S. Three-Dimensional Porous Coordination Polymer Functionalized with Amide Groups Based on Tridentate Ligand: Selective Sorption and Catalysis. J. Am. Chem. Soc. 2007, 129, 2607–2614. [Google Scholar] [CrossRef]
- Eddaoudi, M.; Kim, J.; Rosi, N.; Vodak, D.; Wachter, J.; O’Keeffe, M.; Yaghi, O.M. Systematic Design of Pore Size and Functionality in Isoreticular MOFs and Their Application in Methane Storage. Science 2002, 295, 469–472. [Google Scholar] [CrossRef] [Green Version]
- Bibi, R.; Shen, Q.; Wei, L.F.; Hao, D.; Li, N.; Zhou, J. Hybrid BiOBr/UiO-66-NH2 composite with enhanced visible-light driven photocatalytic activity toward RhB dye degradation. RSC Adv. 2018, 8, 2048–2058. [Google Scholar] [CrossRef] [Green Version]
- Sha, Z.; Wu, J. Enhanced visible-light photocatalytic performance of BiOBr/UiO-66(Zr) composite for dye degradation with the assistance of UiO-66. RSC Adv. 2015, 5, 39592–39600. [Google Scholar] [CrossRef]
- Xu, X.-Y.; Chu, C.; Fu, H.; Du, X.-D.; Wang, P.; Zheng, W.; Wang, C.-C. Light-responsive UiO-66-NH2/Ag3PO4 MOF-nanoparticle composites for the capture and release of sulfamethoxazole. Chem. Eng. J. 2018, 350, 436–444. [Google Scholar] [CrossRef]
- Liang, Q.; Cui, S.; Liu, C.; Xu, S.; Yao, C.; Li, Z. Construction of CdS@UIO-66-NH2 core-shell nanorods for enhanced photocatalytic activity with excellent photostability. J. Colloid Interface Sci. 2018, 524, 379–387. [Google Scholar] [CrossRef]
- Wang, L.; Zheng, P.; Zhou, X.; Xu, M.; Liu, X. Facile fabrication of CdS/UiO-66-NH2 heterojunction photocatalysts for efficient and stable photodegradation of pollution. J. Photochem. Photobiol. A Chem. 2019, 376, 80–87. [Google Scholar] [CrossRef]
- Shen, L.; Liang, S.; Wu, W.; Liang, R.; Wu, L. CdS-decorated UiO–66(NH2) nanocomposites fabricated by a facile photodeposition process: An efficient and stable visible-light-driven photocatalyst for selective oxidation of alcohols. J. Mater. Chem. A 2013, 1, 11473–11482. [Google Scholar] [CrossRef]
- Jiang, D.; Fang, G.; Tong, Y.; Wu, X.; Wang, Y.; Hong, D.; Leng, W.; Liang, Z.; Tu, P.; Liu, L.; et al. Multifunctional Pd@UiO-66 Catalysts for Continuous Catalytic Upgrading of Ethanol to n-Butanol. ACS Catal. 2018, 8, 11973–11978. [Google Scholar] [CrossRef]
- Ai, L.; Su, J.; Wang, M.; Jiang, J. Bamboo-Structured Nitrogen-Doped Carbon Nanotube Coencapsulating Cobalt and Molybdenum Carbide Nanoparticles: An Efficient Bifunctional Electrocatalyst for Overall Water Splitting. ACS Sustain. Chem. Eng. 2018, 6, 9912–9920. [Google Scholar] [CrossRef]
- Katz, M.J.; Brown, Z.J.; Colón, Y.J.; Siu, P.W.; Scheidt, K.A.; Snurr, R.Q.; Hupp, J.T.; Farha, O.k. A facile synthesis of UiO-66, UiO-67 and their derivatives. Chem. Commun. 2013, 49, 9449–9451. [Google Scholar] [CrossRef]
- Cavka, J.H.; Jakobsen, S.; Olsbye, U.; Guillou, N.; Lamberti, C.; Bordiga, S.; Lillerud, K.P. A New Zirconium Inorganic Building Brick Forming Metal Organic Frameworks with Exceptional Stability. J. Am. Chem. Soc. 2008, 130, 13850–13851. [Google Scholar] [CrossRef]
- Tian, N.; Huang, H.; Liu, C.; Dong, F.; Zhang, T.; Du, X.; Yu, S.; Zhang, Y. In situ co-pyrolysis fabrication of CeO2/g-C3N4 n–n type heterojunction for synchronously promoting photo-induced oxidation and reduction properties. J. Mater. Chem. A 2015, 3, 17120–17129. [Google Scholar] [CrossRef]
- Wen, X.-J.; Niu, C.-G.; Zhang, L.; Liang, C.; Zeng, G.-M. A novel Ag2O/CeO2 heterojunction photocatalysts for photocatalytic degradation of enrofloxacin: Possible degradation pathways, mineralization activity and an in depth mechanism insight. Appl. Catal. B Environ. 2018, 221, 701–714. [Google Scholar] [CrossRef]
- Zhang, X.; Zhang, N.; Gan, C.; Liu, Y.; Chen, L.; Zhang, C.; Fang, Y. Synthesis of In2S3/UiO-66 hybrid with enhanced photocatalytic activity towards methyl orange and tetracycline hydrochloride degradation under visible-light irradiation. Mater. Sci. Semicond. Process. 2019, 91, 212–221. [Google Scholar] [CrossRef]
- Zhu, G.; Feng, S.; Chao, J.; Zheng, W.; Shao, C. One-pot synthesis of C-dots modified TiO2 nanosheets/UiO-66-NH2 with improved photocatalytic activity under visible light. Ceram. Int. 2019, 46, 2530–2537. [Google Scholar] [CrossRef]
- Lee, D.T.; Zhao, J.; Oldham, C.J.; Peterson, G.W.; Parsons, G.N. UiO-66-NH2 Metal–Organic Framework (MOF) Nucleation on TiO2, ZnO, and Al2O3 Atomic Layer Deposition-Treated Polymer Fibers: Role of Metal Oxide on MOF Growth and Catalytic Hydrolysis of Chemical Warfare Agent Simulants. ACS Appl. Mater. Interfaces 2017, 9, 44847–44855. [Google Scholar] [CrossRef] [Green Version]
- Saravanakumar, K.; Ramjan, M.M.; Suresh, P.; Muthuraj, V. Fabrication of highly efficient visible light driven Ag/CeO2 photocatalyst for degradation of organic pollutants. J. Alloy. Compd. 2016, 664, 149–160. [Google Scholar] [CrossRef]
- Pan, Y.; Yuan, X.; Jiang, L.; Wang, H.; Yu, H.; Zhang, J. Stable self-assembly AgI/UiO-66(NH2) heterojunction as efficient visible-light responsive photocatalyst for tetracycline degradation and mechanism insight. Chem. Eng. J. 2020, 384, 123310. [Google Scholar] [CrossRef]
- Bariki, R.; Majhi, D.; Das, K.; Behera, A.; Mishra, B. Facile synthesis and photocatalytic efficacy of UiO-66/CdIn2S4 nanocomposites with flowerlike 3D-microspheres towards aqueous phase decontamination of triclosan and H2 evolution. Appl. Catal. B Environ. 2020, 270, 118882. [Google Scholar] [CrossRef]
- Zhang, L.; Hu, C.; Ji, H. p-AgI anchored on {001} facets of n-Bi2O2CO3 sheets with enhanced photocatalytic activity and stability. Appl. Catal. B Environ. 2017, 205, 34–41. [Google Scholar] [CrossRef]
- Cho, H.D.; Yoon, I.T.; Chung, K.B.; Kim, D.Y.; Kang, T.W.; Yuldashev, S. Low-temperature photoluminescence of WO3 nanoparticles. J. Lumin. 2018, 195, 344–347. [Google Scholar] [CrossRef]
- Wu, X.; Yuan, G.; Zeng, L.; Jiang, H.; Zhong, Y.; Xie, H.; Wang, X.; Chen, H. Wang, Highly efficient photocatalytic activity and mechanism of Yb3+/Tm3+ codoped In2S3 from ultraviolet to near infrared light towards chromium (VI) reduction and rhodamine B oxydative degradation. Appl. Catal. B Environ. 2018, 225, 8–21. [Google Scholar] [CrossRef]
- Zhang, J.; Qiao, S.Z.; Qi, L.; Yu, J. Fabrication of NiS modified CdS nanorod p–n junction photocatalysts with enhanced visible-light photocatalytic H2-production activity. Phys. Chem. Chem. Phys. 2013, 15, 12088–12094. [Google Scholar] [CrossRef] [PubMed] [Green Version]
- Wen, J.; Li, X.; Li, H.; Ma, S.; He, K.; Xu, Y.; Fang, Y.; Liu, W.; Gao, Q. Enhanced visible-light H2 evolution of g-C3N4 photocatalysts via the synergetic effect of amorphous NiS and cheap metal-free carbon black nanoparticles as co-catalysts. Appl. Surf. Sci. 2015, 358, 204–212. [Google Scholar] [CrossRef]
- Deng, Y.; Tang, L.; Zeng, G.; Feng, C.; Dong, H.; Wang, J.; Feng, H.; Liu, Y.; Zhou, Y.; Pang, Y. Plasmonic resonance excited dual Z-scheme BiVO4/Ag/Cu2O nanocomposite: Synthesis and mechanism for enhanced photocatalytic performance in recalcitrant antibiotic degradation. Environ. Sci. Nano 2017, 4, 1494–1511. [Google Scholar] [CrossRef]


| Position | Composition (wt. %) | Possible Phases | |||
|---|---|---|---|---|---|
| Ce | O | Zr | N | ||
| a | 76.2 | 24.5 | 3.23 | 0.91 | CeO2, UiO-66-NH2 |
Publisher’s Note: MDPI stays neutral with regard to jurisdictional claims in published maps and institutional affiliations. |
© 2022 by the authors. Licensee MDPI, Basel, Switzerland. This article is an open access article distributed under the terms and conditions of the Creative Commons Attribution (CC BY) license (https://creativecommons.org/licenses/by/4.0/).
Share and Cite
Liu, Z.; Zhuang, Y.; Dong, L.; Mu, H.; Tian, S.; Wang, L.; Huang, A. Preparation of CeO2/UiO-66-NH2 Heterojunction and Study on a Photocatalytic Degradation Mechanism. Materials 2022, 15, 2564. https://doi.org/10.3390/ma15072564
Liu Z, Zhuang Y, Dong L, Mu H, Tian S, Wang L, Huang A. Preparation of CeO2/UiO-66-NH2 Heterojunction and Study on a Photocatalytic Degradation Mechanism. Materials. 2022; 15(7):2564. https://doi.org/10.3390/ma15072564
Chicago/Turabian StyleLiu, Ziwei, Yanli Zhuang, Limin Dong, Hongxu Mu, Shuo Tian, Leiming Wang, and Aoxiang Huang. 2022. "Preparation of CeO2/UiO-66-NH2 Heterojunction and Study on a Photocatalytic Degradation Mechanism" Materials 15, no. 7: 2564. https://doi.org/10.3390/ma15072564