
Development and Experimental Assessment of Friction-Type Shear Connectors for FRP Bridge Girders with Composite Concrete Decks

Abstract
:1. Introduction
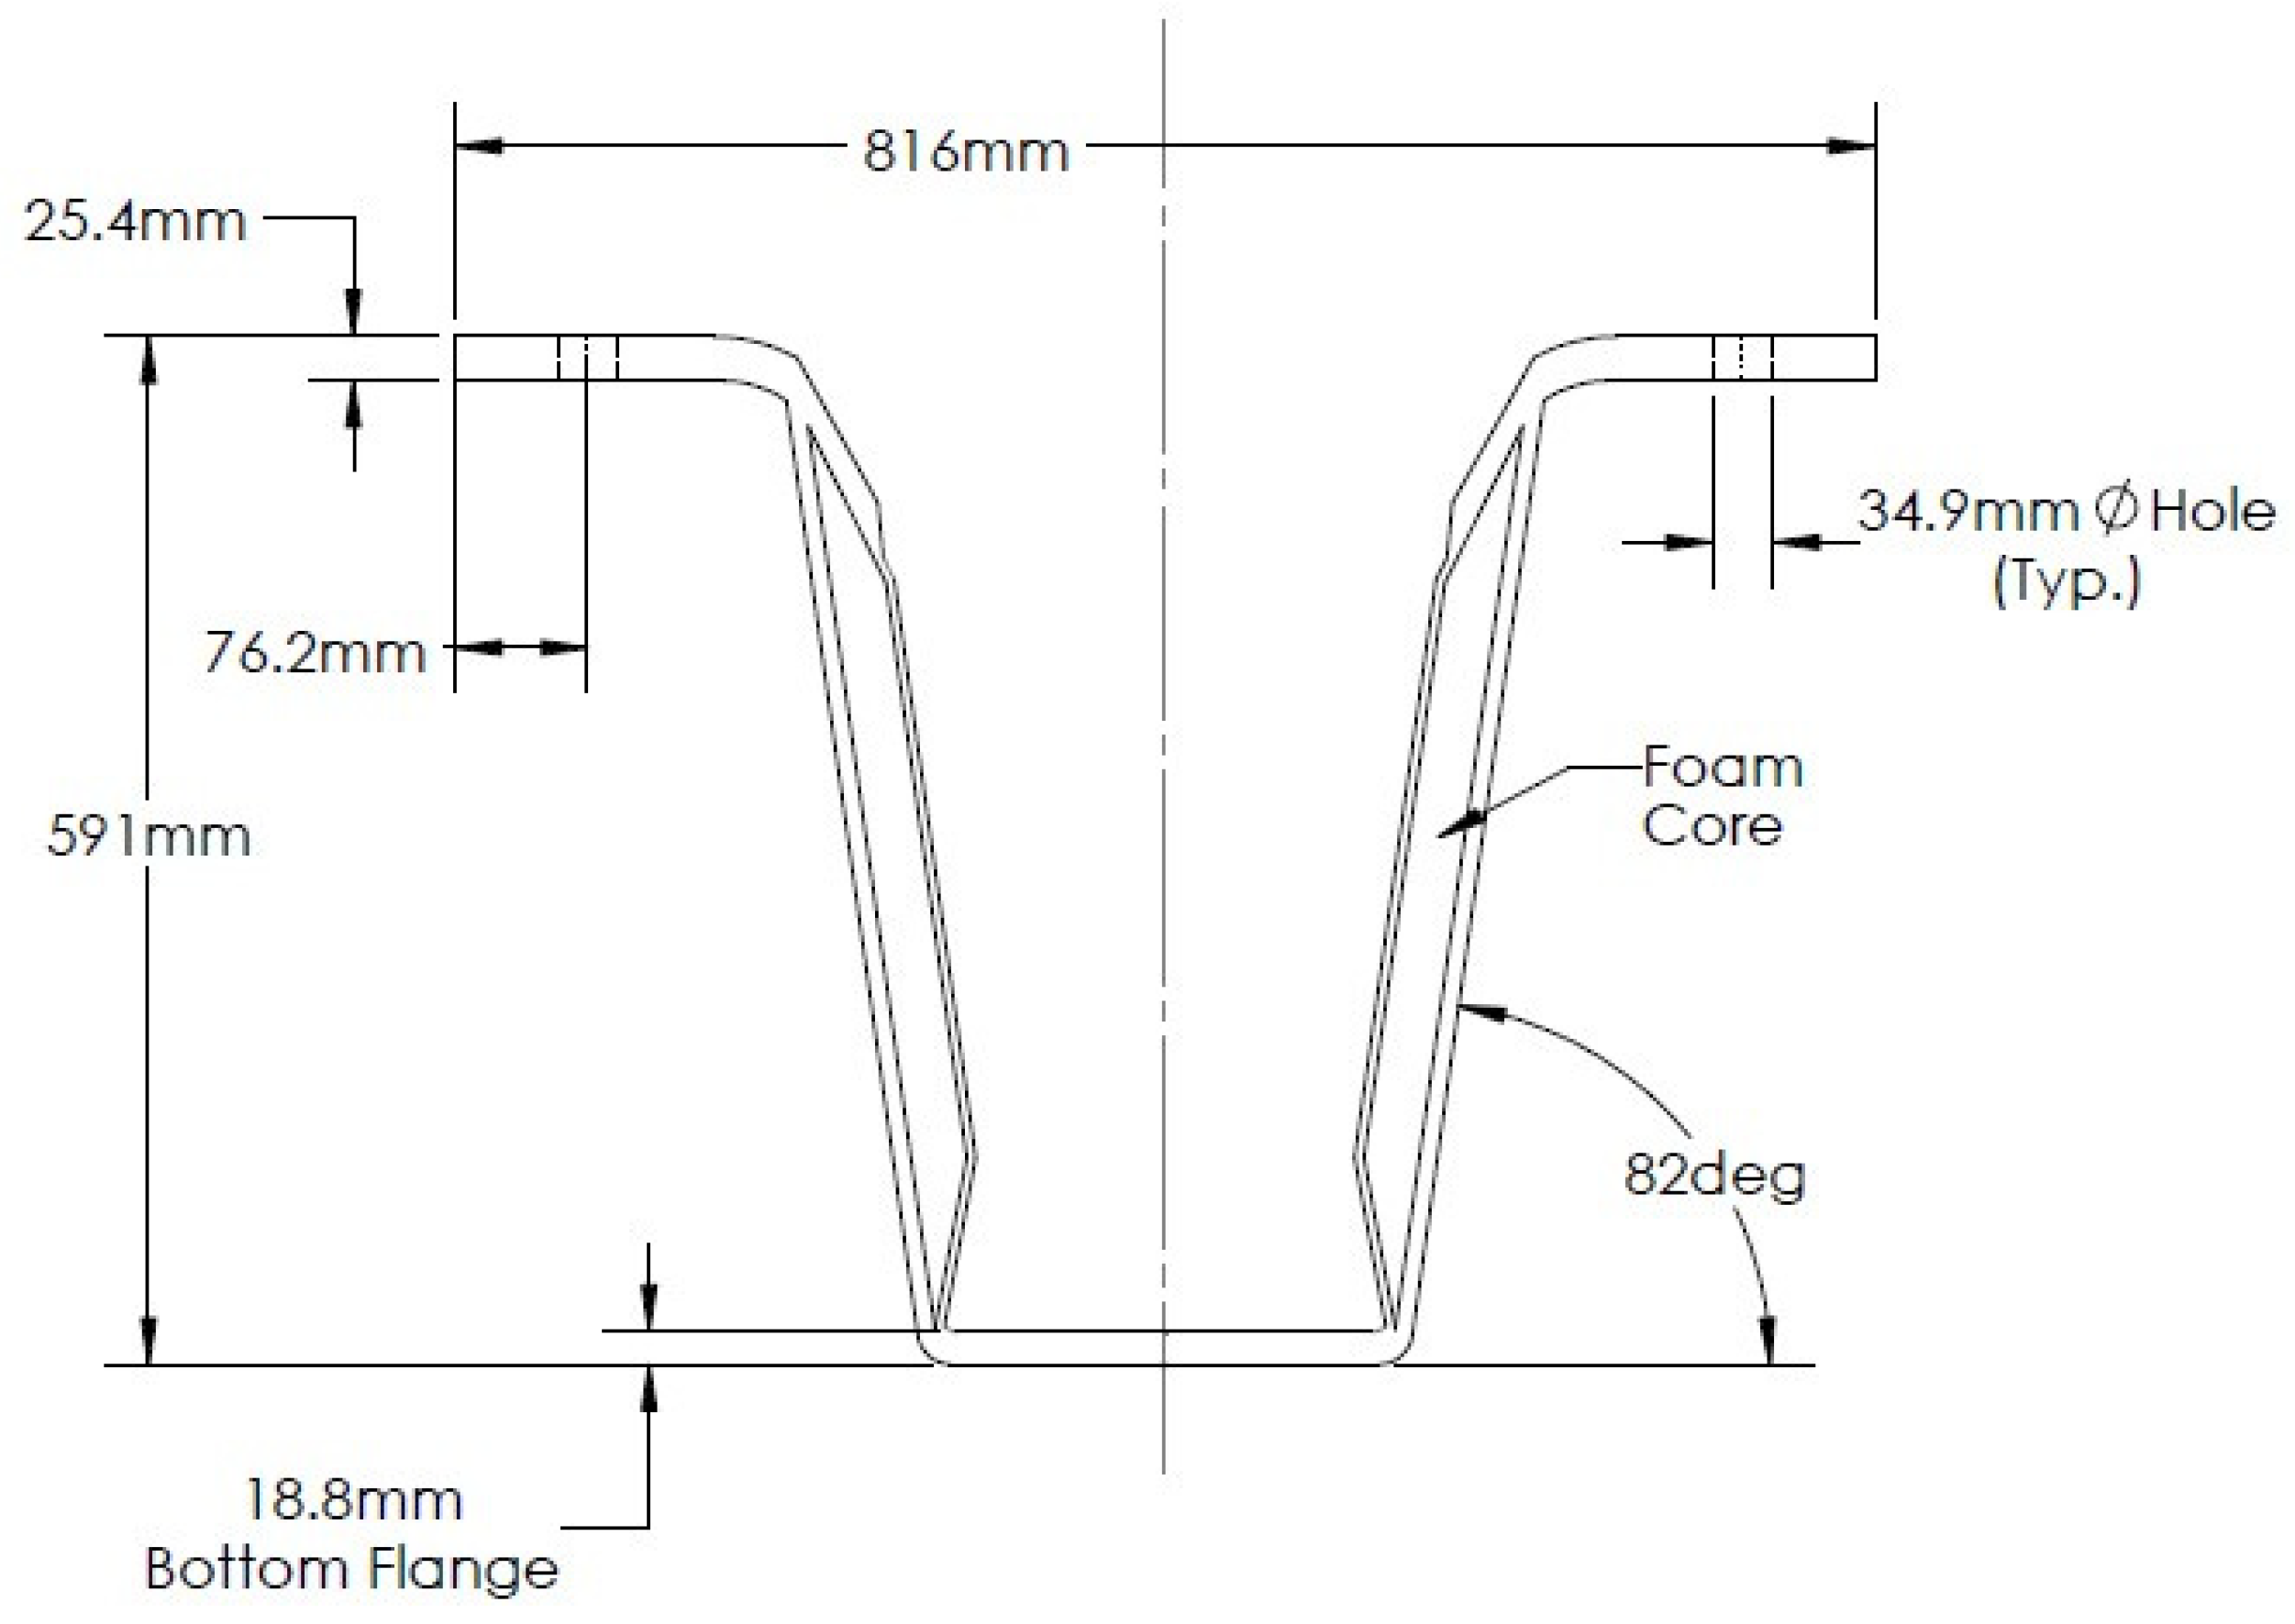
2. Description of Model FRP Girder
3. Friction-Type Shear Connector and Connector Shear Test Protocol
3.1. Rationale for and Development of Shear Connector
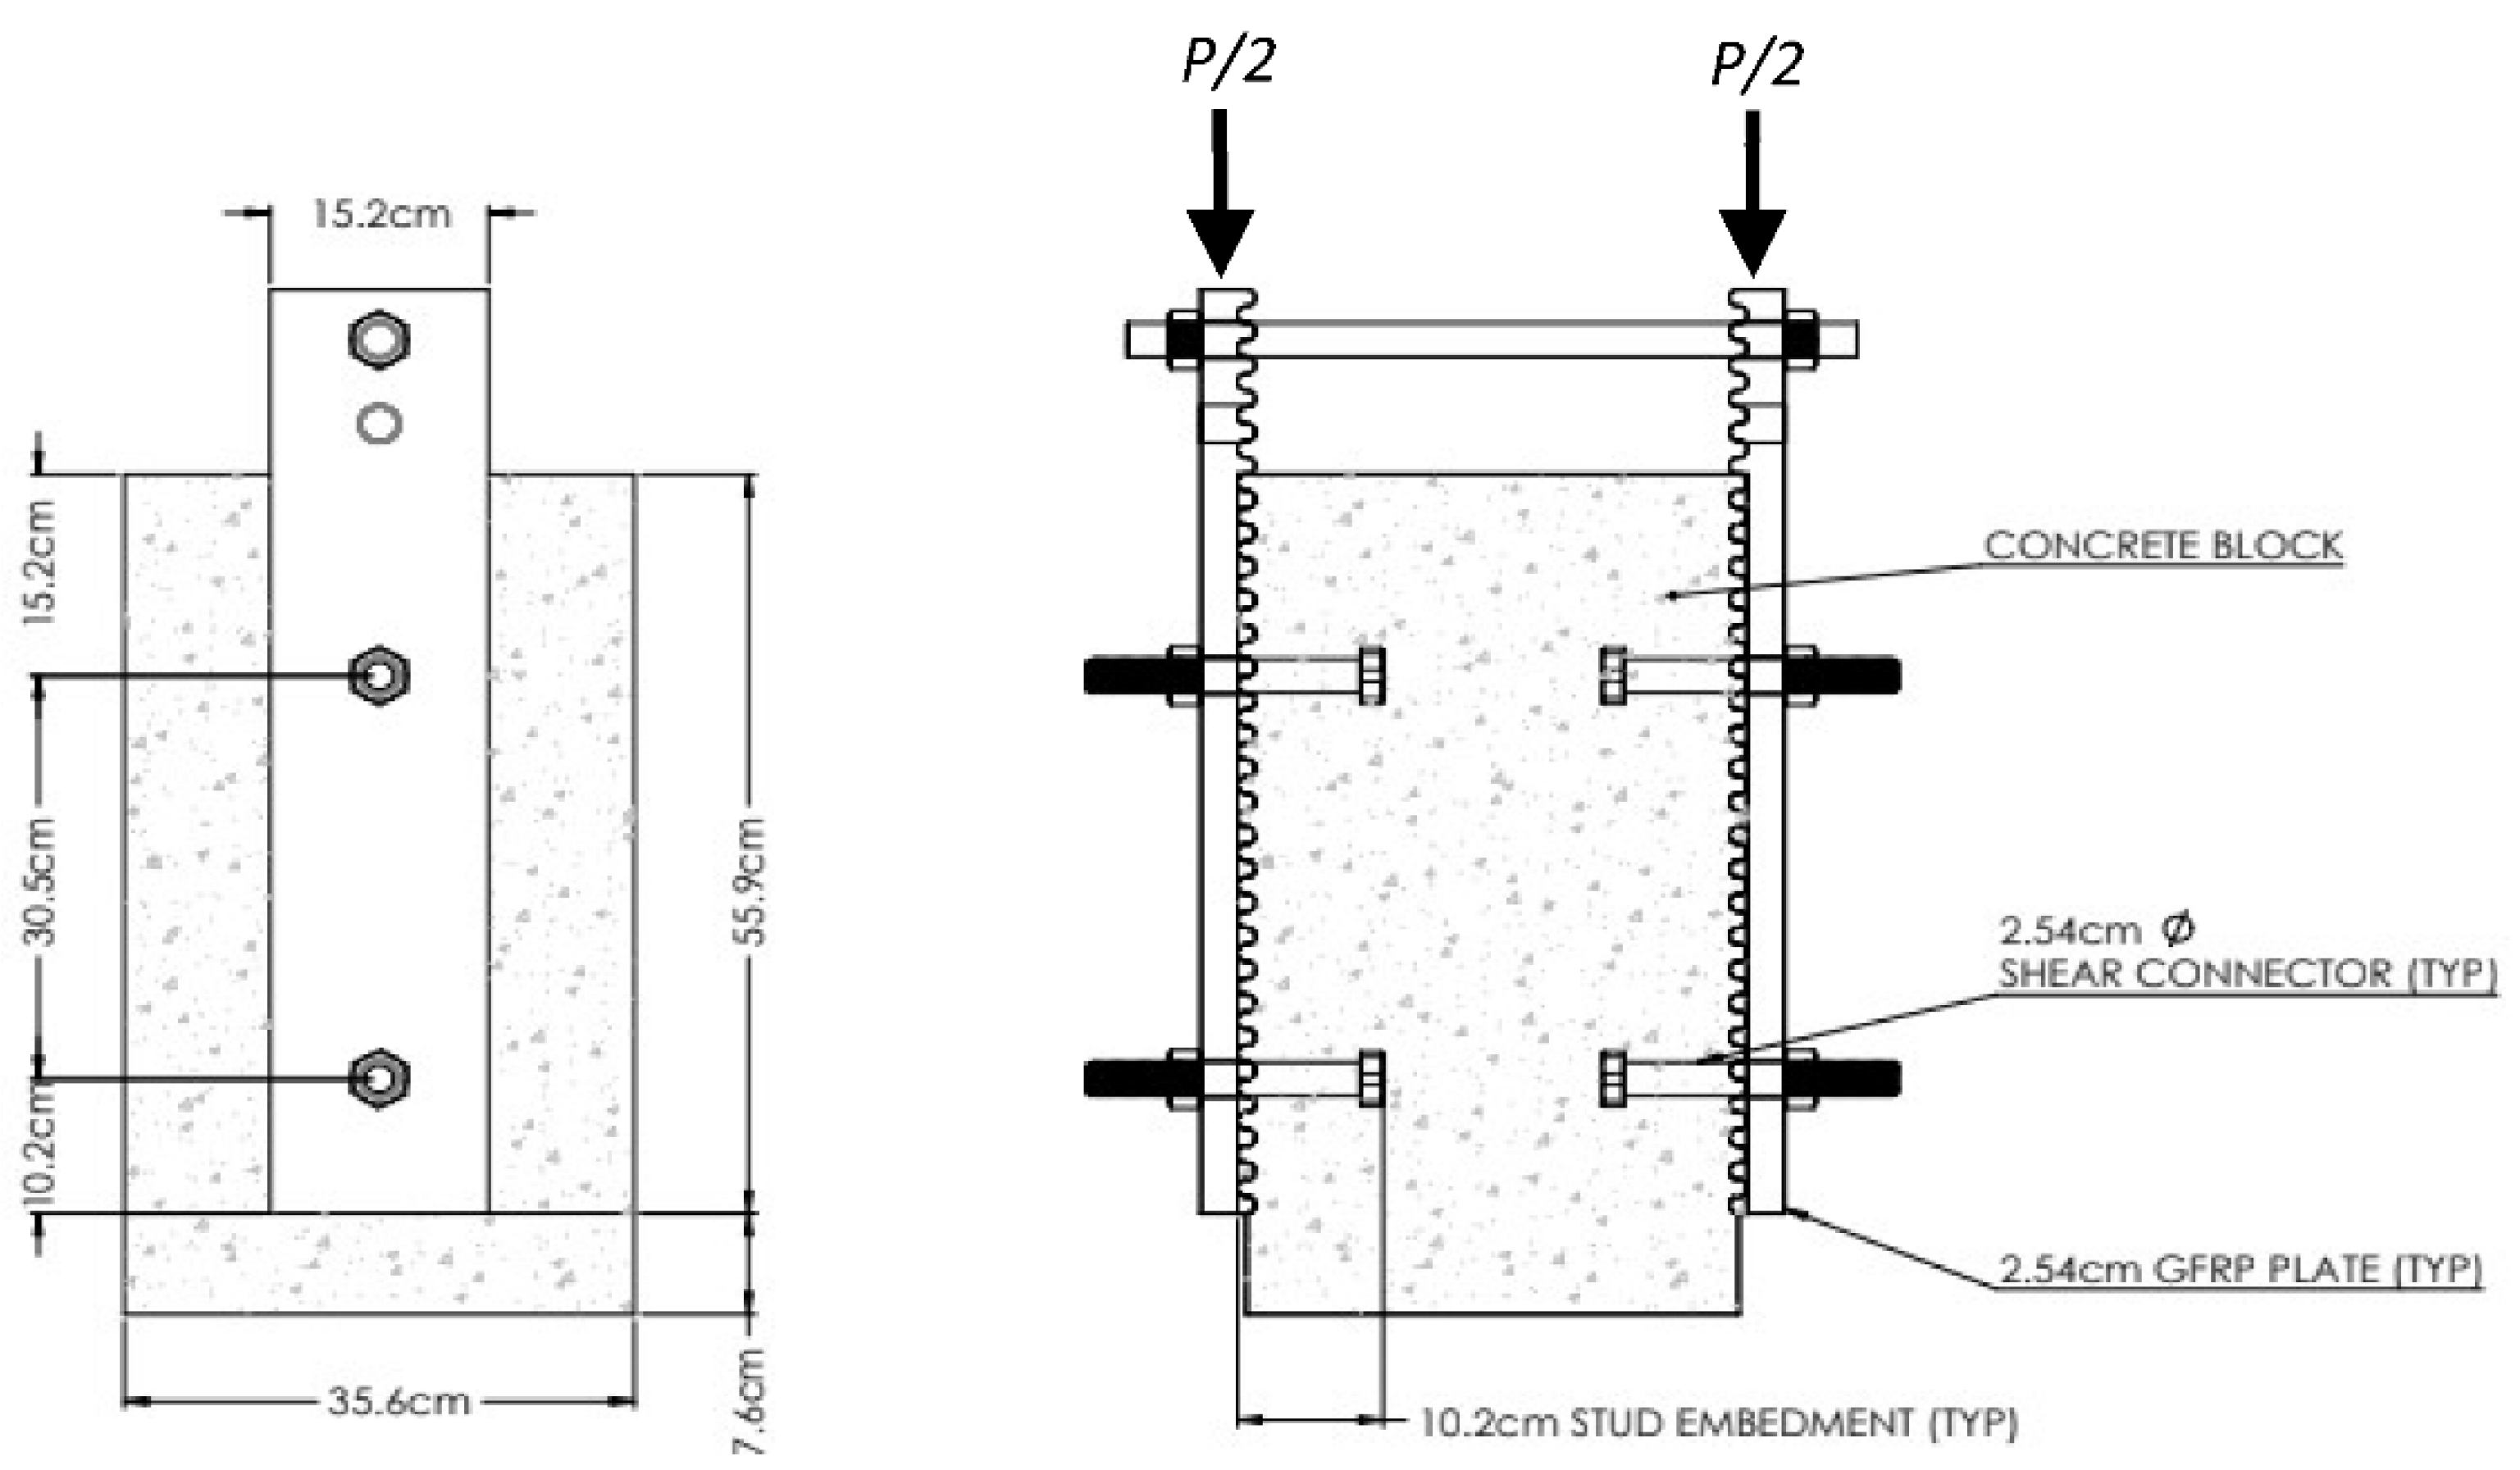
3.2. Connector Shear Test Protocol
4. Connector Test Results
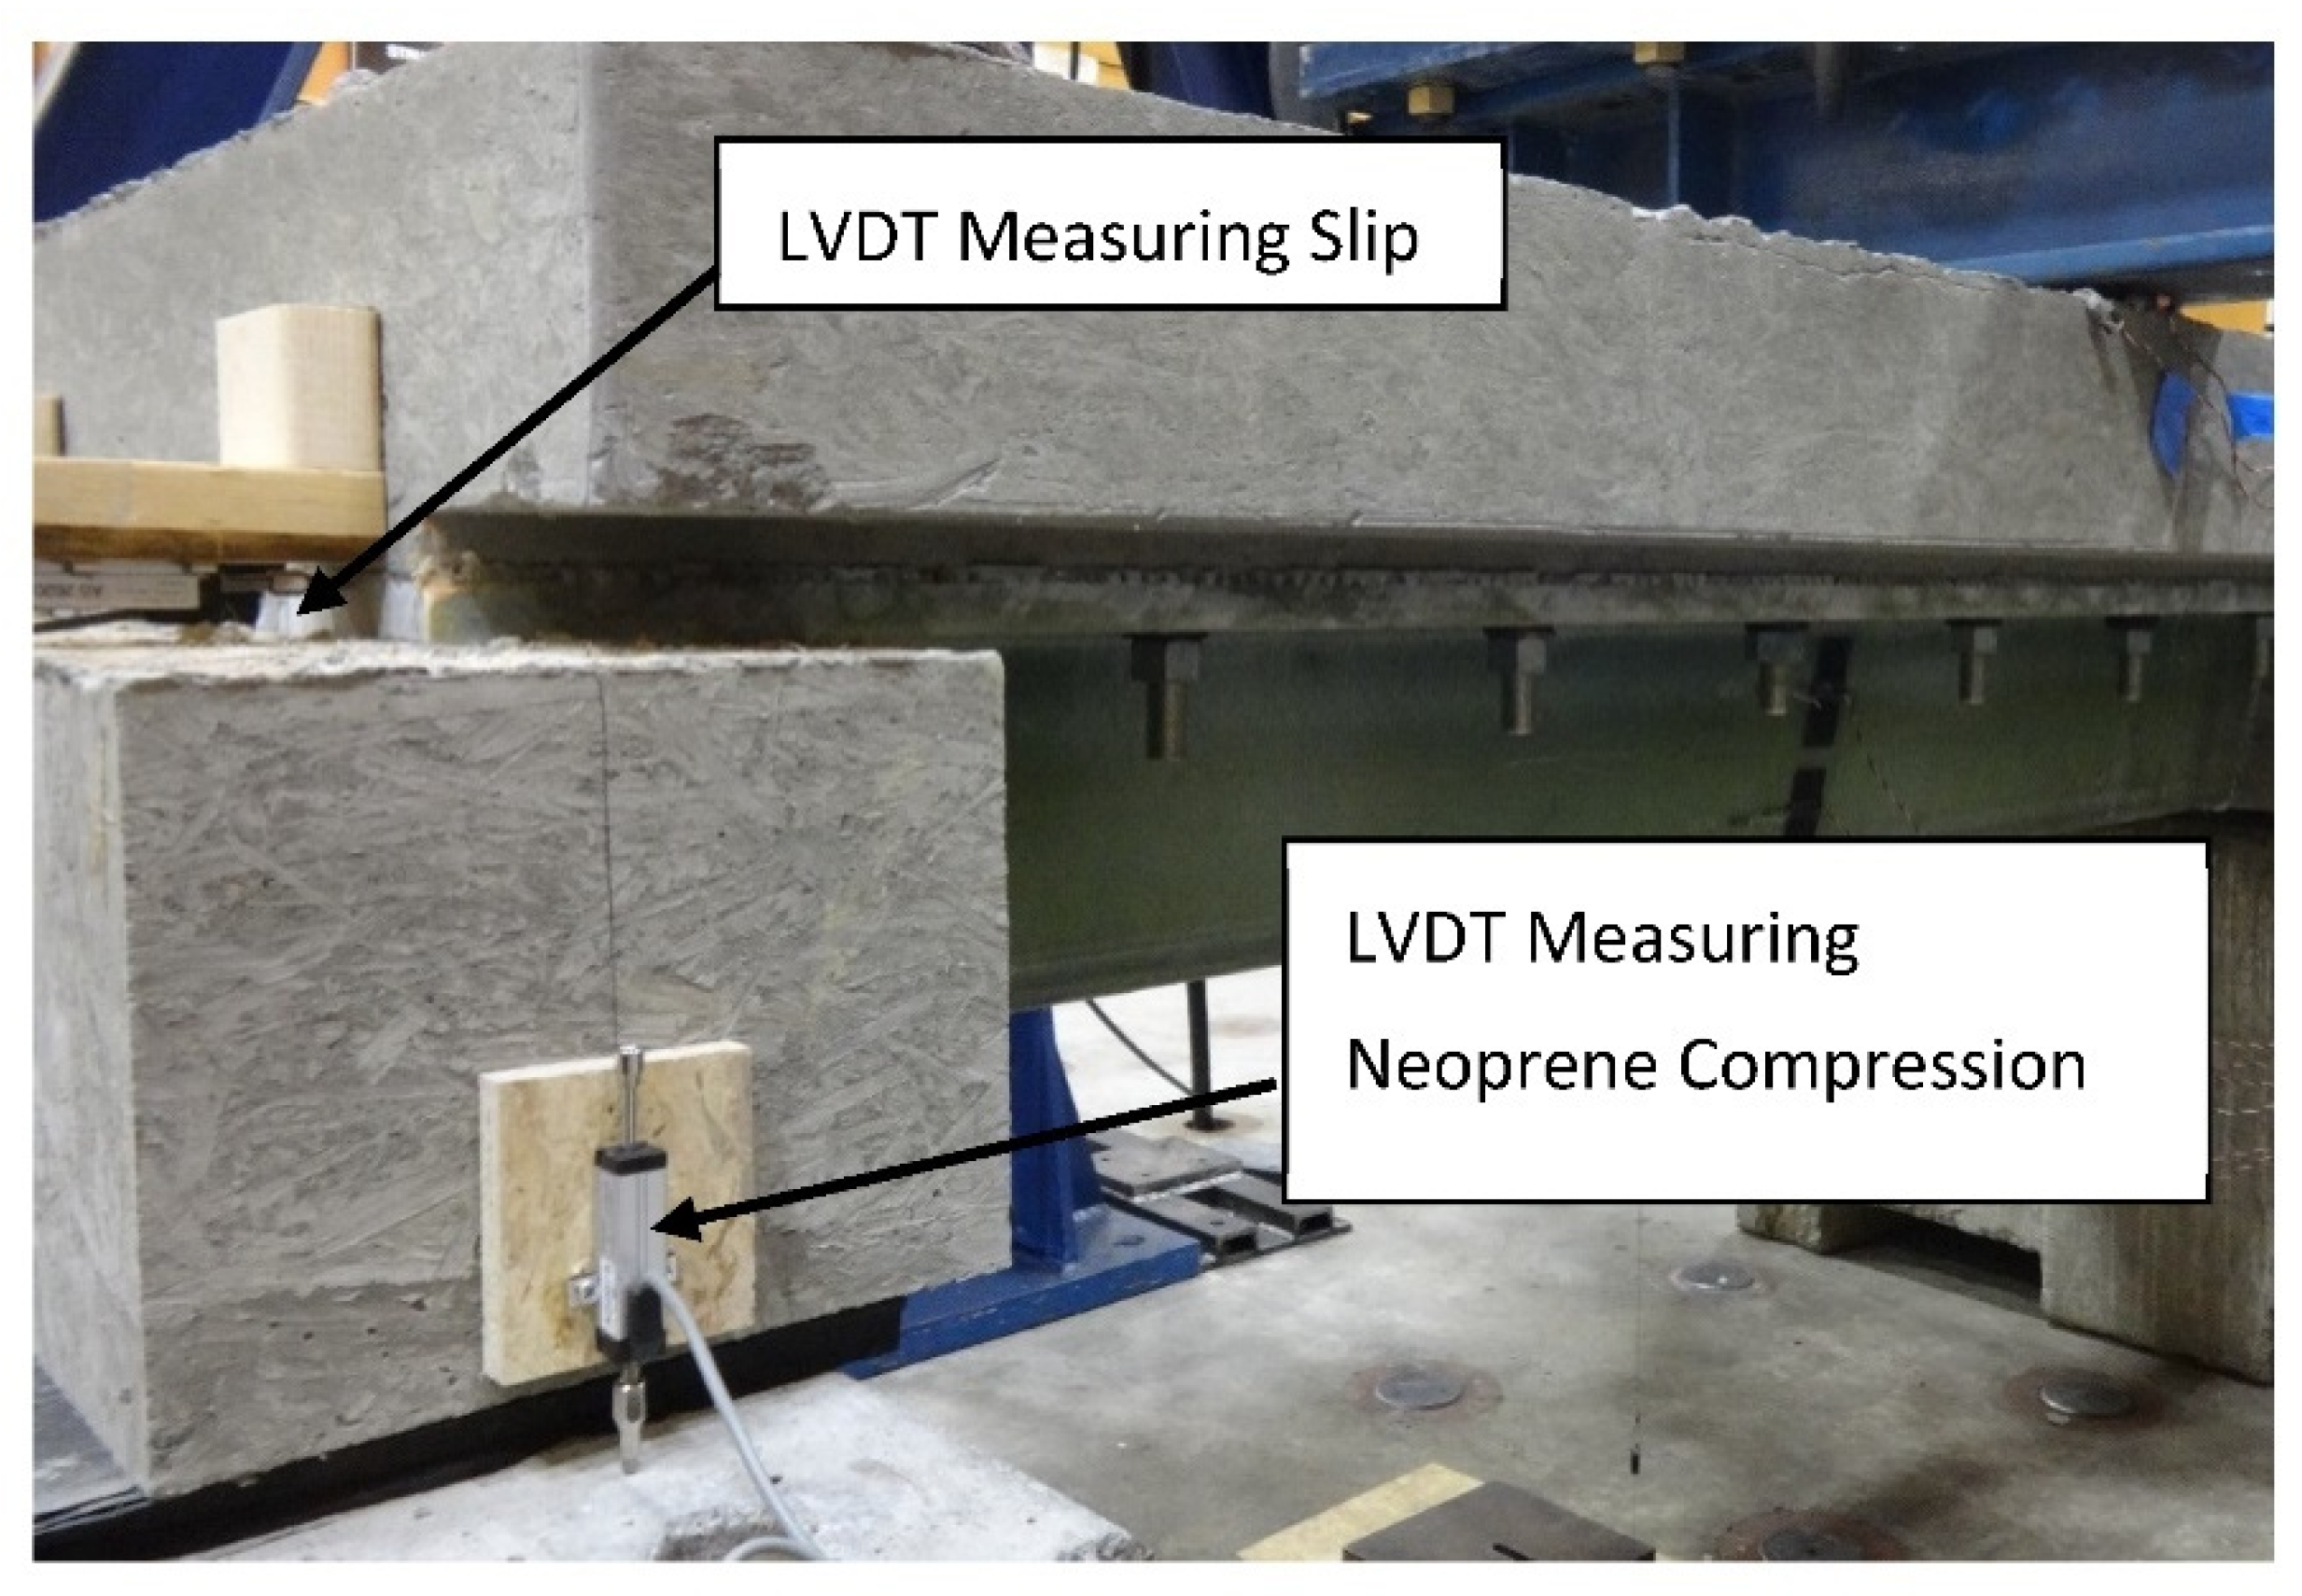
5. Short Beam Test Specimens and Test Protocol
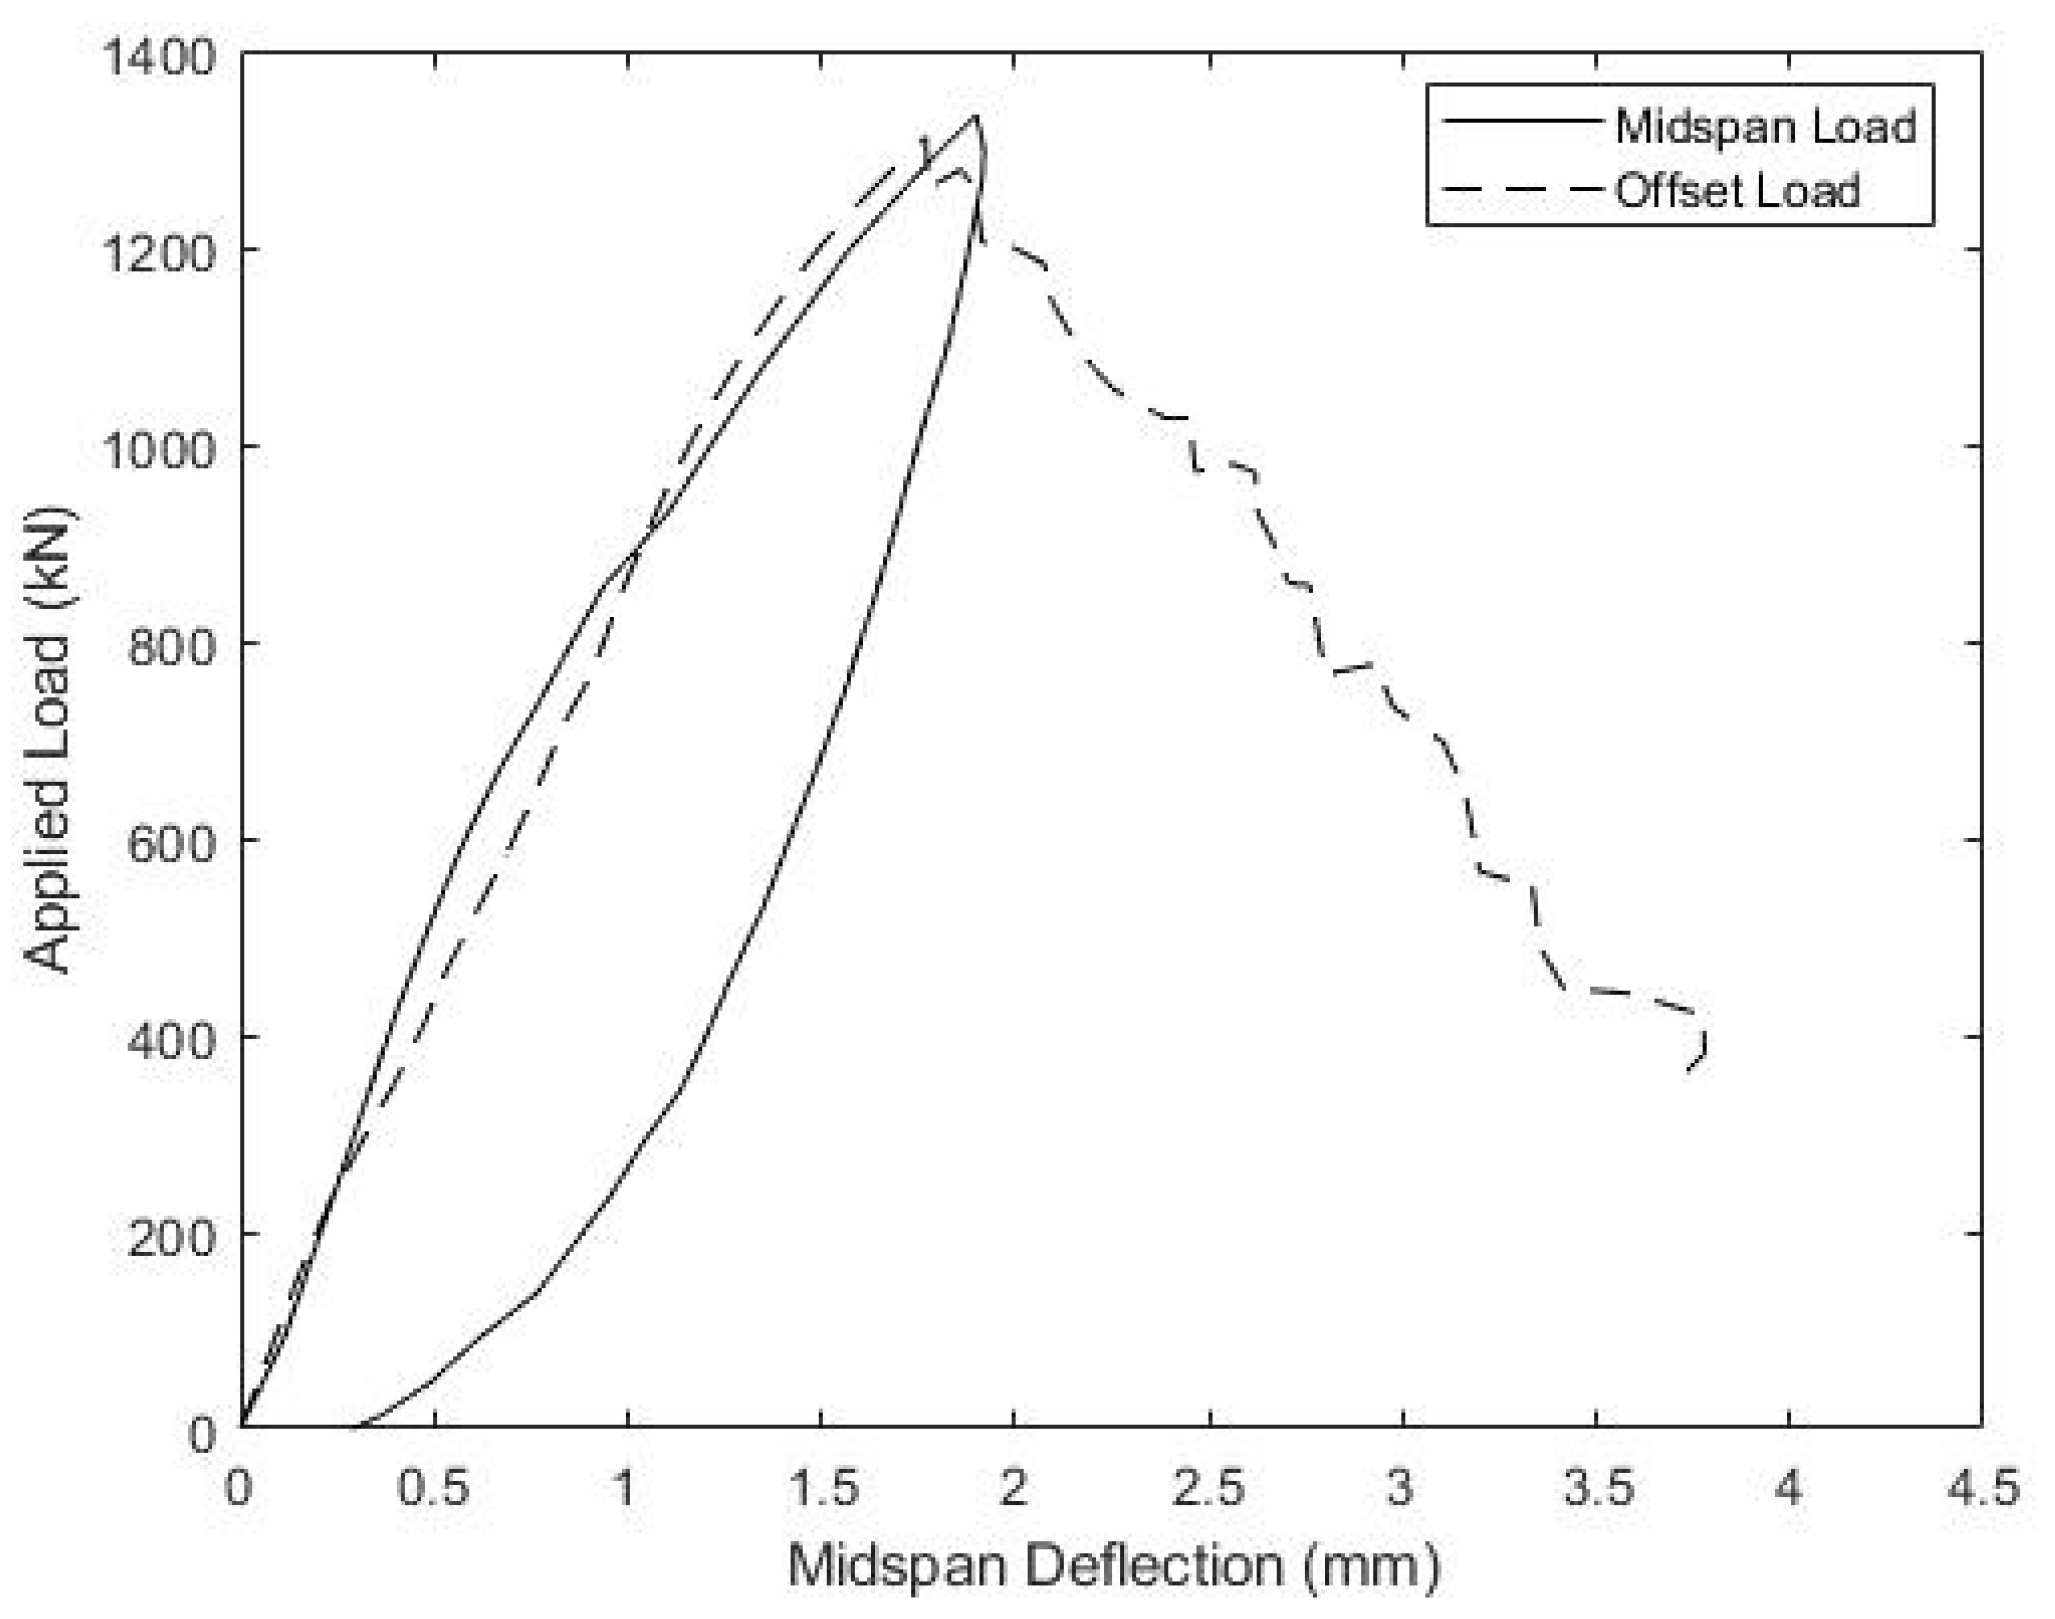
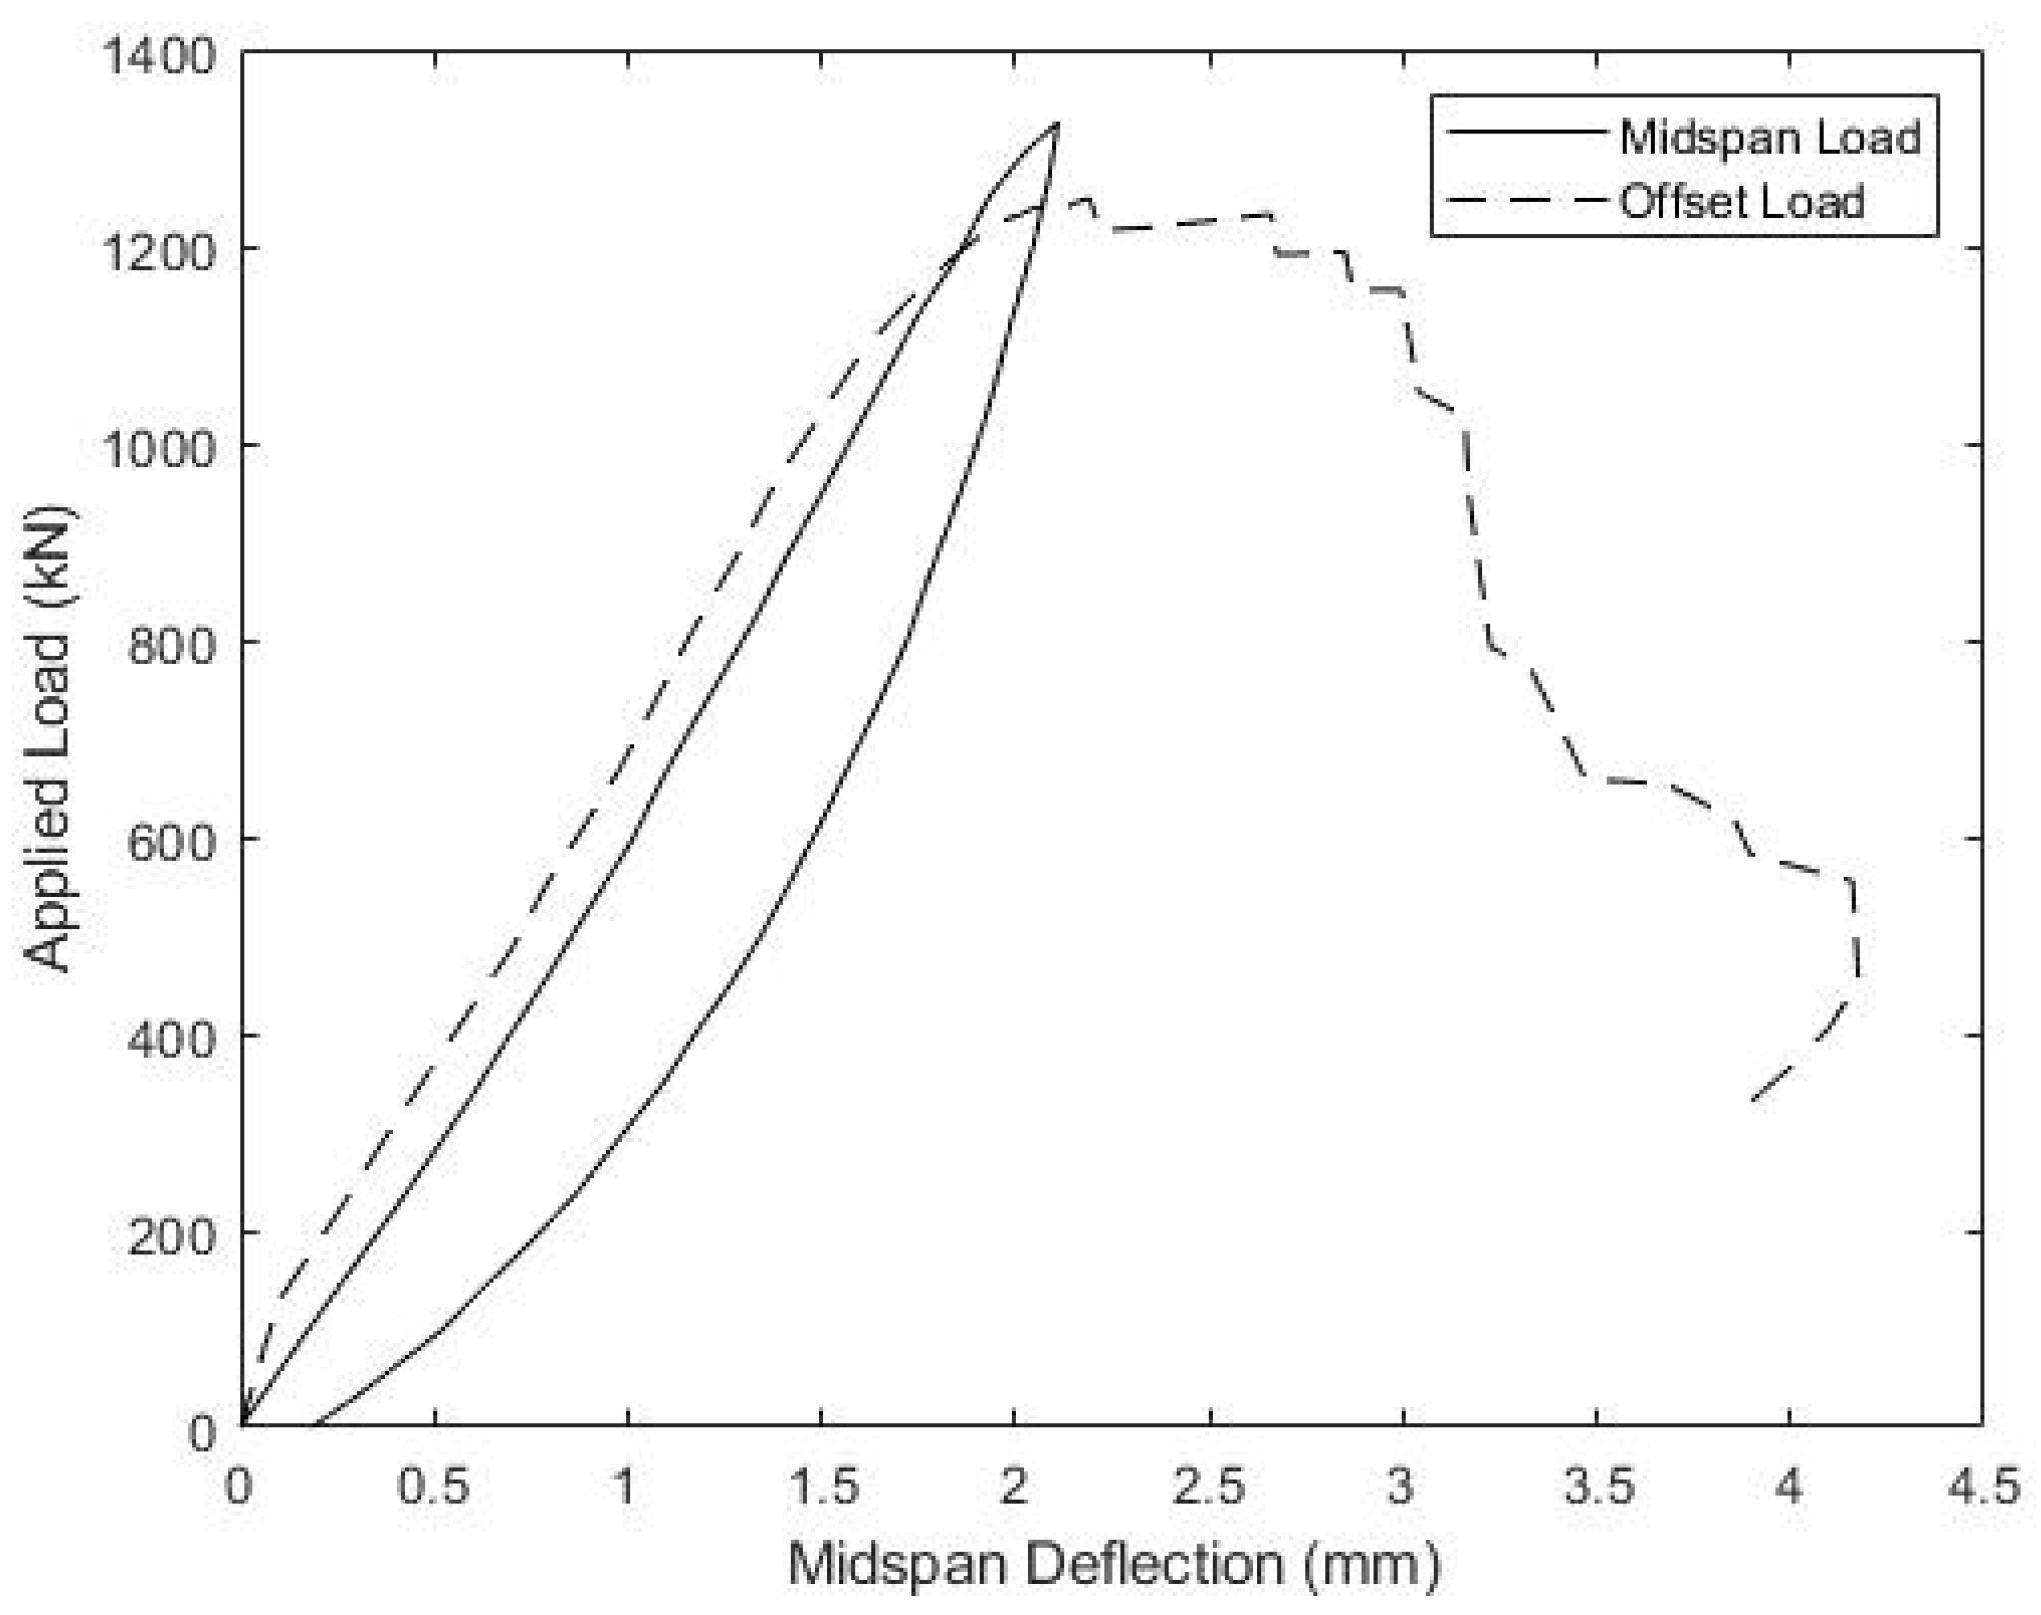
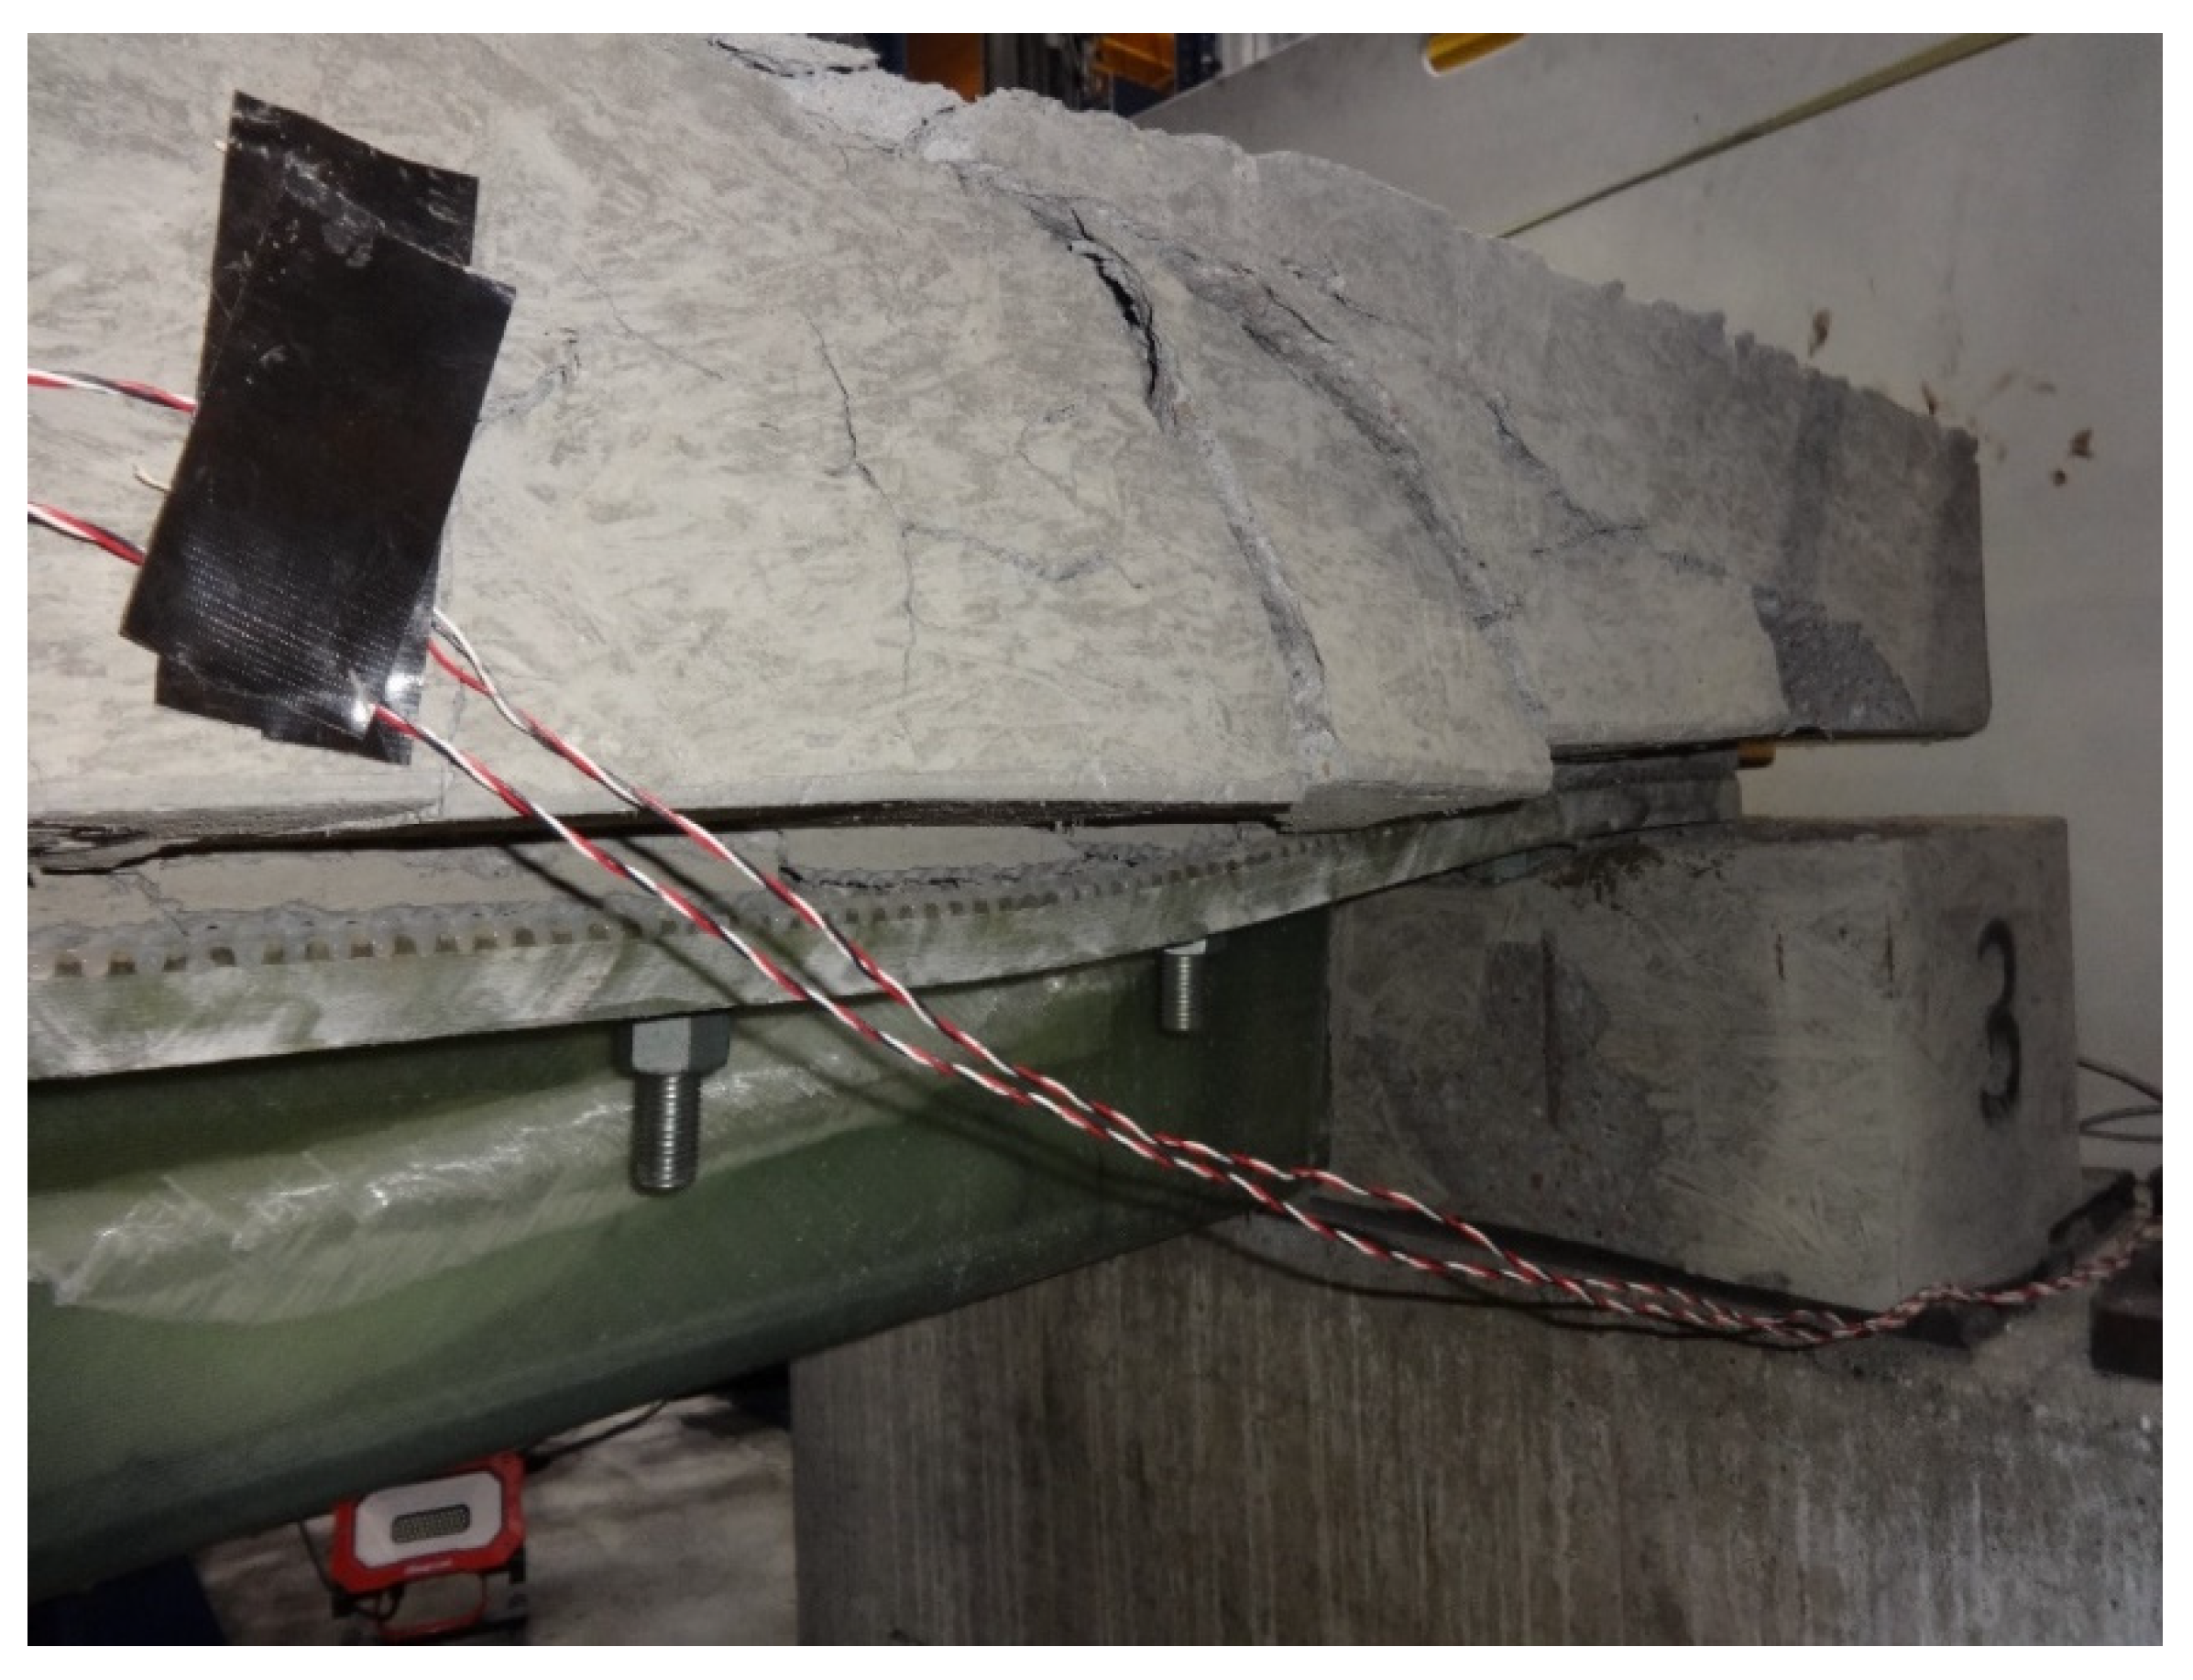
6. Beam Test Results
7. Assessment of Stainless Steel Connectors
7.1. Specimen Details and Loading Protocol
7.2. Stainless Steel Connector Test Results
8. Summary and Conclusions
- The results indicate that concrete strength has a significant impact on connection capacity, although the number and variety of tests performed here is not sufficient to develop a relationship between concrete strength and connection capacity. Additional testing that captures a range of typical concrete strengths would be valuable.
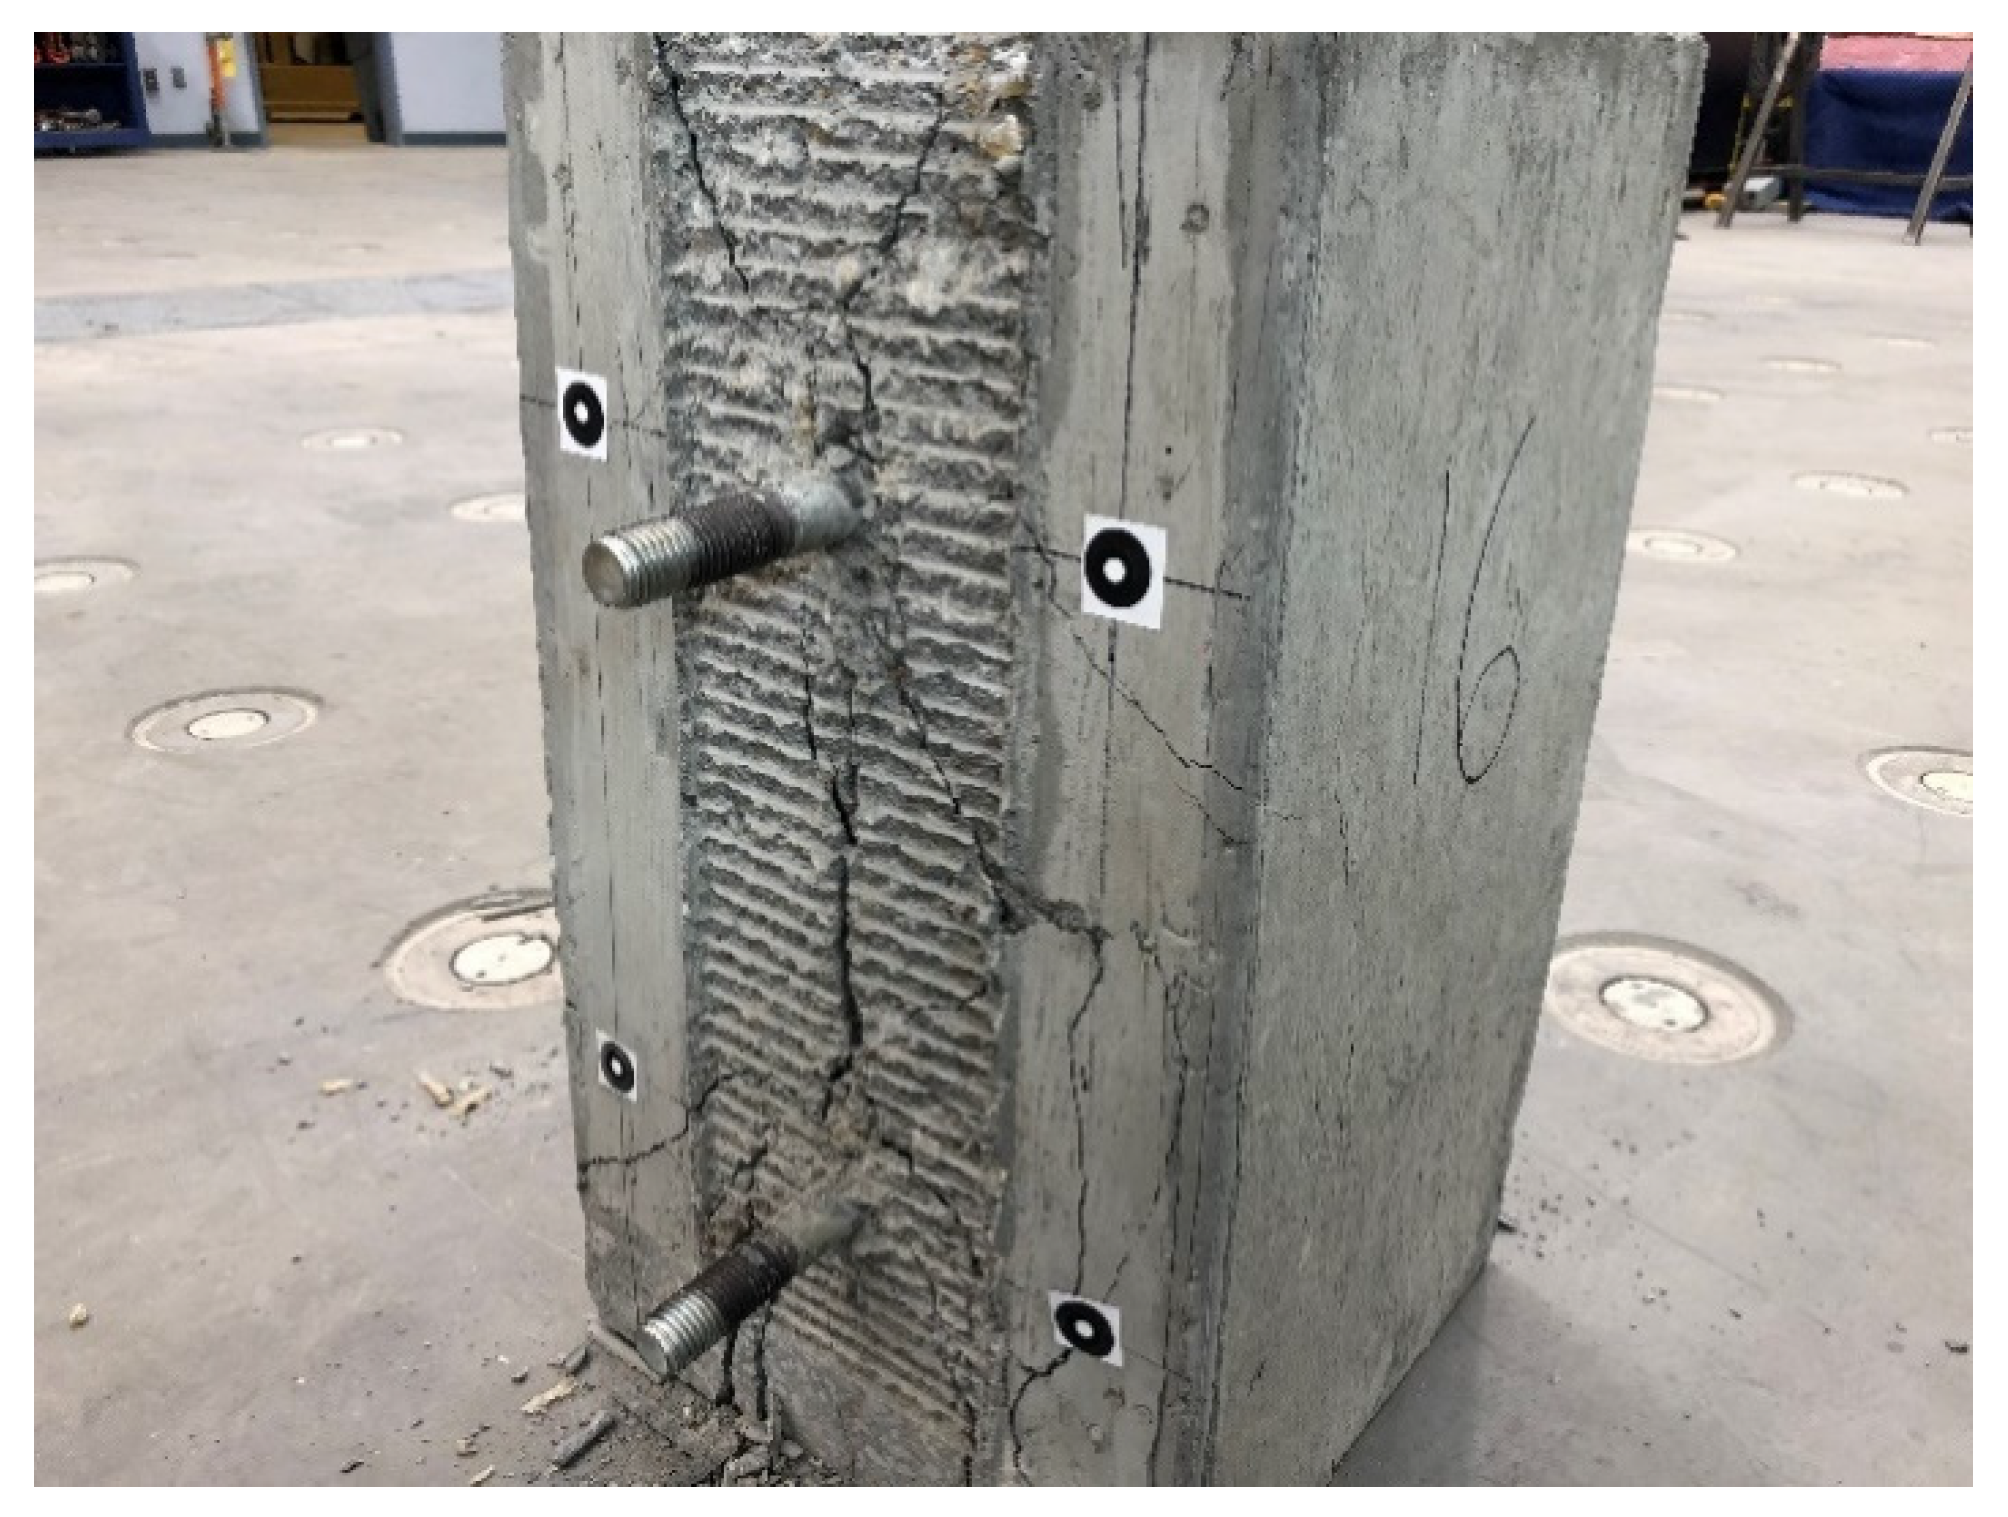
- While the connectors exhibited both pre- and post-fatigue strength in excess of that predicted by AASHTO provisions, connection capacity was governed by concrete ridge shear failure, which is not explicitly addressed in the AASHTO provisions. Given this observation and the mechanical interlocking nature of the connection, it is possible that alternative fasteners, such as lower-grade stainless steel or even FRP bars, could give adequate performance. This should be assessed in future studies.
9. Patents
Author Contributions
Funding
Institutional Review Board Statement
Informed Consent Statement
Data Availability Statement
Conflicts of Interest
References
- AASHTO. AASHTO LRFD Bridge Design Guide Specifications for GFRP-Reinforced Concrete; AASHTO: Washington, DC, USA, 2018. [Google Scholar]
- American Concrete Institute. ACI 440.1R-15: Guide for the Design and Construction of Structural Concrete Reinforced with Fiber-Reinforced Polymer (FRP) Bars; American Concrete Institute: Farmington Hills, MI, USA, 2015. [Google Scholar]
- AASHTO. Guide Specification for Design of Bonded FRP Systems for Repair and Strengthening of Concrete Bridge Elements; AASHTO: Washington, DC, USA, 2012. [Google Scholar]
- American Concrete Institute. ACI PRC-440.2-17: Guide for the Design and Construction of Externally Bonded FRP Systems for Strengthening Concrete Structures; American Concrete Institute: Farmington Hills, MI, USA, 2017. [Google Scholar]
- Karbhari, V.M. Materials considerations in FRP rehabilitation of concrete structures. J. Mater. Civ. Eng. 2001, 13, 90–97. [Google Scholar] [CrossRef]
- Toutanji, H.; Balaguru, P. Durability characteristics of concrete columns wrapped with FRP tow sheets. J. Mater. Civ. Eng. 1998, 10, 52–57. [Google Scholar] [CrossRef]
- Yaqub, M.; Bailey, C.G. Repair of fire damaged circular reinforced concrete columns with FRP composites. Constr. Build. Mater. 2011, 25, 359–730. [Google Scholar] [CrossRef]
- Mohammed, A.A.; Manalo, A.C.; Maranan, G.B.; Zhuge, Y.; Vijay, P.V.; Pettigrew, J. Behavior of damaged concrete columns repaired with novel FRP jacket. J. Compos. Constr. 2019, 23, 4019013. [Google Scholar] [CrossRef]
- Dagher, H.J.; Bannon, D.J.; Davids, W.G.; Lopez-Anido, R.A.; Nagy, E.; Goslin, K. Bending behavior of concrete-filled tubular FRP arches for bridge structures. Constr. Build. Mater. 2012, 37, 432–439. [Google Scholar] [CrossRef]
- Walton, H.J.; Davids, W.G.; Landon, M.E.; Clapp, J.D. Simulation of buried arch bridge response to backfilling and live loading. J. Bridge Eng. 2016, 21, 4016052. [Google Scholar] [CrossRef]
- Advanced Infrastructure Technologies. Projects. 2021. Available online: https://www.bridges.aitcomposites.com/projects (accessed on 1 March 2022).
- AASHTO. LRFD Guide Specifications for Design of Concrete-Filled FRP Tubes for Flexural and Axial Members; AASHTO: Washington, DC, USA, 2012. [Google Scholar]
- Gutiérrez, E.; Primi, S.; Mieres, J.M.; Calvo, I. Structural testing of a vehicular carbon fiber bridge: Quasi-static and short-term behavior. J. Bridge Eng. 2008, 13, 271–281. [Google Scholar] [CrossRef]
- Mieres, J.; Calvo, I.; Pineda, L.; Botello, F.; Gomez, M.; Primi, S.; Bonilla, J. First bridge constructed of carbon fibre reinforced polymers in Spain. In Proceedings of the FRPRCS-8, Patras, Greece, 16–18 July 2007; pp. 596–597. [Google Scholar]
- Ziehl, P.H.; Engelhardt, M.D.; Fowler, T.J.; Ulloa, F.V.; Medlock, R.D.; Schell, E. Design and field evaluation of hybrid FRP/reinforced concrete superstructure system. J. Bridge Eng. 2009, 14, 309–318. [Google Scholar] [CrossRef]
- Siwowski, T.; Rajchel, M.; Kaleta, D.; Własak, L. The first Polish road bridge made of FRP composites. Struct. Eng. Int. 2017, 27, 308–314. [Google Scholar] [CrossRef]
- Siwowski, T.; Rajchel, M. Structural performance of a hybrid FRP composite—Lightweight concrete bridge girder. Compos. Part B 2019, 174, 107055. [Google Scholar] [CrossRef]
- Davids, W.G.; Diba, A.; Dagher, H.J.; Guzzi, D.; Schanck, A.P. Development, assessment and implementation of a novel FRP composite girder bridge. Constr. Build. Mater. 2021, submitted.
- Davids, W.G.; Schanck, A.P. Field load testing and analysis of a new FRP composite tub girder bridge with a concrete deck. In Proceedings of the 11th Annual Conference on Bridge Maintenance, Safety and Management, Barcelona, Spain, 11–15 July 2022. peer-reviewed paper accepted for publication. [Google Scholar]
- Guzzi, D. Shear Connectors for Hybrid Composite FRP-Concrete Bridge Girders. Master’s Thesis, University of Maine, Orono, ME, USA, 2019. [Google Scholar]
- AASHTO. AASHTO LRFD Bridge Design Specifications; AASHTO: Washington, DC, USA, 2016. [Google Scholar]
- Majeed, H.S.; Davids, W.G.; Walton, H.J. Efficient second-order nonlinear finite-element simulation of concrete-filled FRP tubular arches. Structures 2021, 34, 3738–3749. [Google Scholar] [CrossRef]
- ACI. ACI Code 318-19: Building Code Requirements for Buildings and Commentary; American Concrete Institute: Farmington Hills, MI, USA, 2019. [Google Scholar]
- Di, J.; Zou, Y.; Zhou, X.; Qin, F.; Peng, X. Push-out test of large perfobond connectors in steel-concrete joints of hybrid bridges. J. Constr. Steel Res. 2018, 150, 415–429. [Google Scholar] [CrossRef]
- Liu, Y.; Wang, S.; Xin, H.; Liu, Y. Evaluation on out-of-plane shear stiffness and ultimate capacity of perfobond connector. J. Constr. Steel Res. 2020, 167, 105850. [Google Scholar] [CrossRef]
- Yang, F.; Liu, Y.; Jiang, Z.; Xin, H. Shear performance of a novel demoungure steel-concrete bolted connector under static push-out tests. Eng. Struct. 2018, 160, 133–146. [Google Scholar] [CrossRef]
- Zhan, Y.; Duan, M.; Zhang, L.; Liu, C.; Li, Z.; Zhao, R. Study on the shear performance of adhesive shear connectors in push-out tests. Structures 2021, 32, 2103–2117. [Google Scholar] [CrossRef]
- Slutter, R.G.; Fisher, J.W. Fatigue Strength of Shear Connectors; Lehigh University Press: Lehigh, PA, USA, 1966. [Google Scholar]


| Component | Infused Thickness (mm) | Longitudinal Modulus E (GPa) | Ultimate Compressive Stress Fc (MPa) | Ultimate Shear Stress τ (MPa) | Ultimate Tensile Stress Ft (MPa) |
|---|---|---|---|---|---|
| Top Flange | 25.4 | 27.1 | 375 | NA | NA |
| Web | 4.9 | 15.4 | NA | 68.9 | 205 |
| Bottom Flange | 18.8 | 77.5 | NA | NA | 765 |
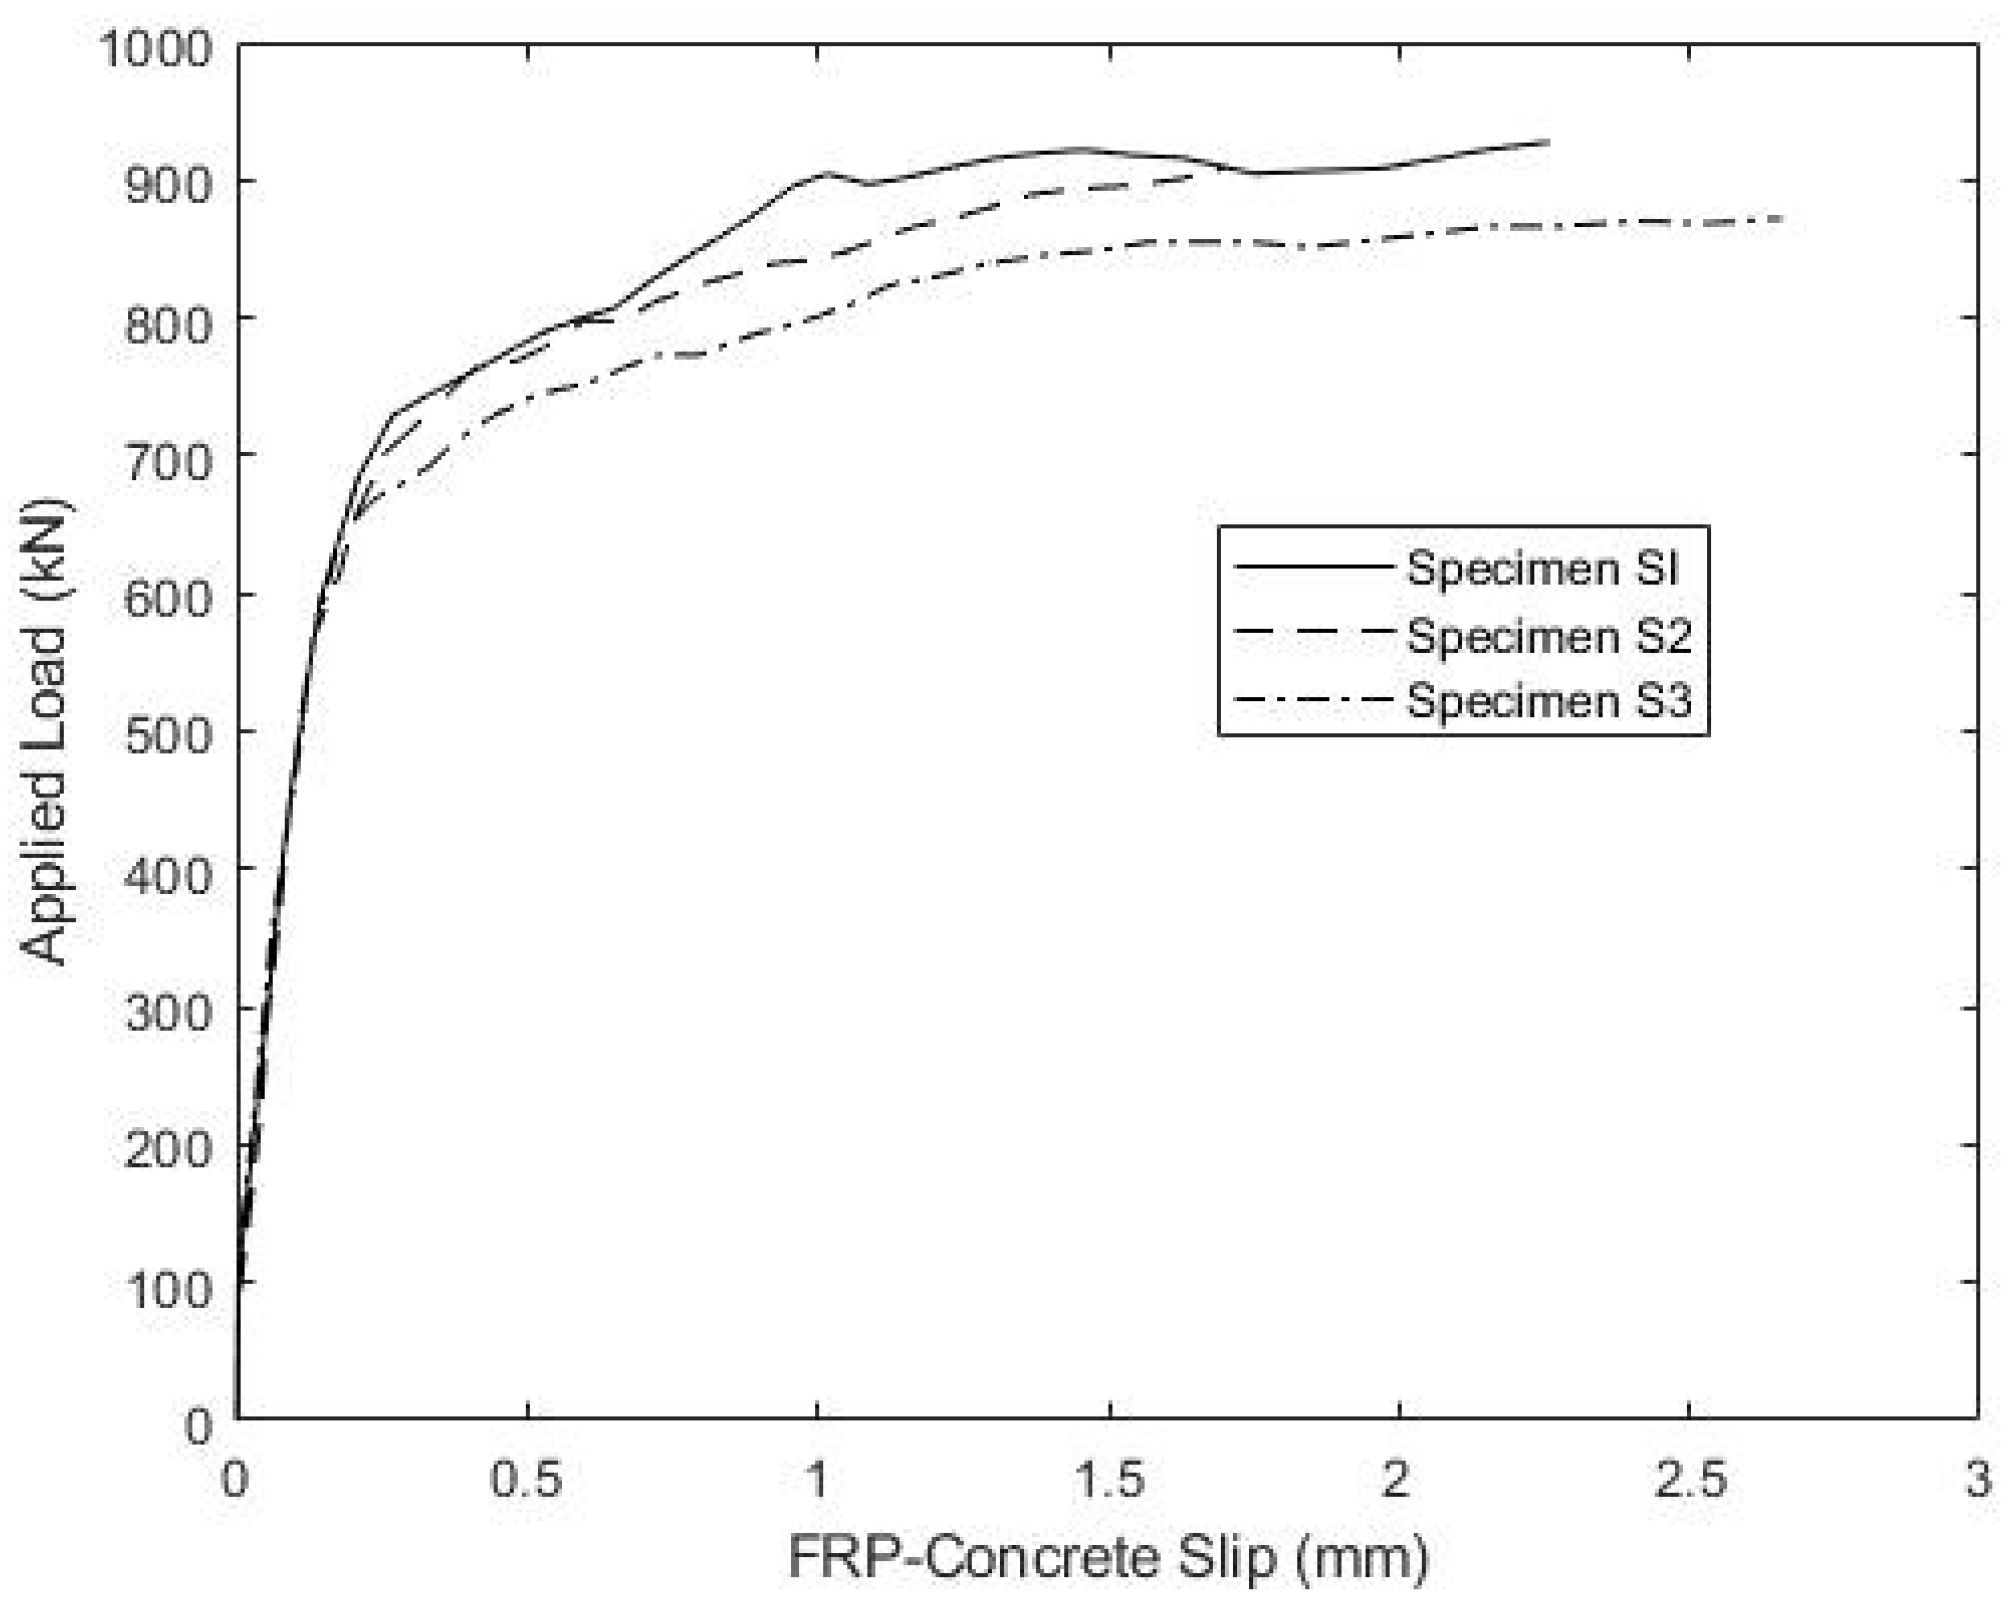
| Specimen Number | Fatigued | Failure Load (kN) | |||||
|---|---|---|---|---|---|---|---|
| S1 | 84.8 | Yes | 44.8 | 212 | 927 | 0.829 | 90.0 |
| S2 | 84.8 | Yes | 44.8 | 212 | 915 | 0.818 | 88.8 |
| S3 | 84.8 | No | NA | NA | 872 | 0.780 | 84.7 |
| S4 | 51.1 | No | NA | NA | 698 | 0.624 | 87.3 |
| Overall Dimensions | Depth | 27.9 cm |
| Out-to-Out Flange Width | 65.4 cm | |
| Length | 2.44 m | |
| Top Flange | Thickness | 2.54 cm |
| Width | 15.2 cm | |
| Web | Depth | 22.9 cm |
| Thickness (excluding foam core) | 2.54 cm | |
| Angle (from vertical) | 9.9 deg | |
| Bottom Flange | Thickness | 2.54 cm |
| Width | 16.5 cm |
| Specimen Number | Fatigued | Failure Load (kN) | |||||
|---|---|---|---|---|---|---|---|
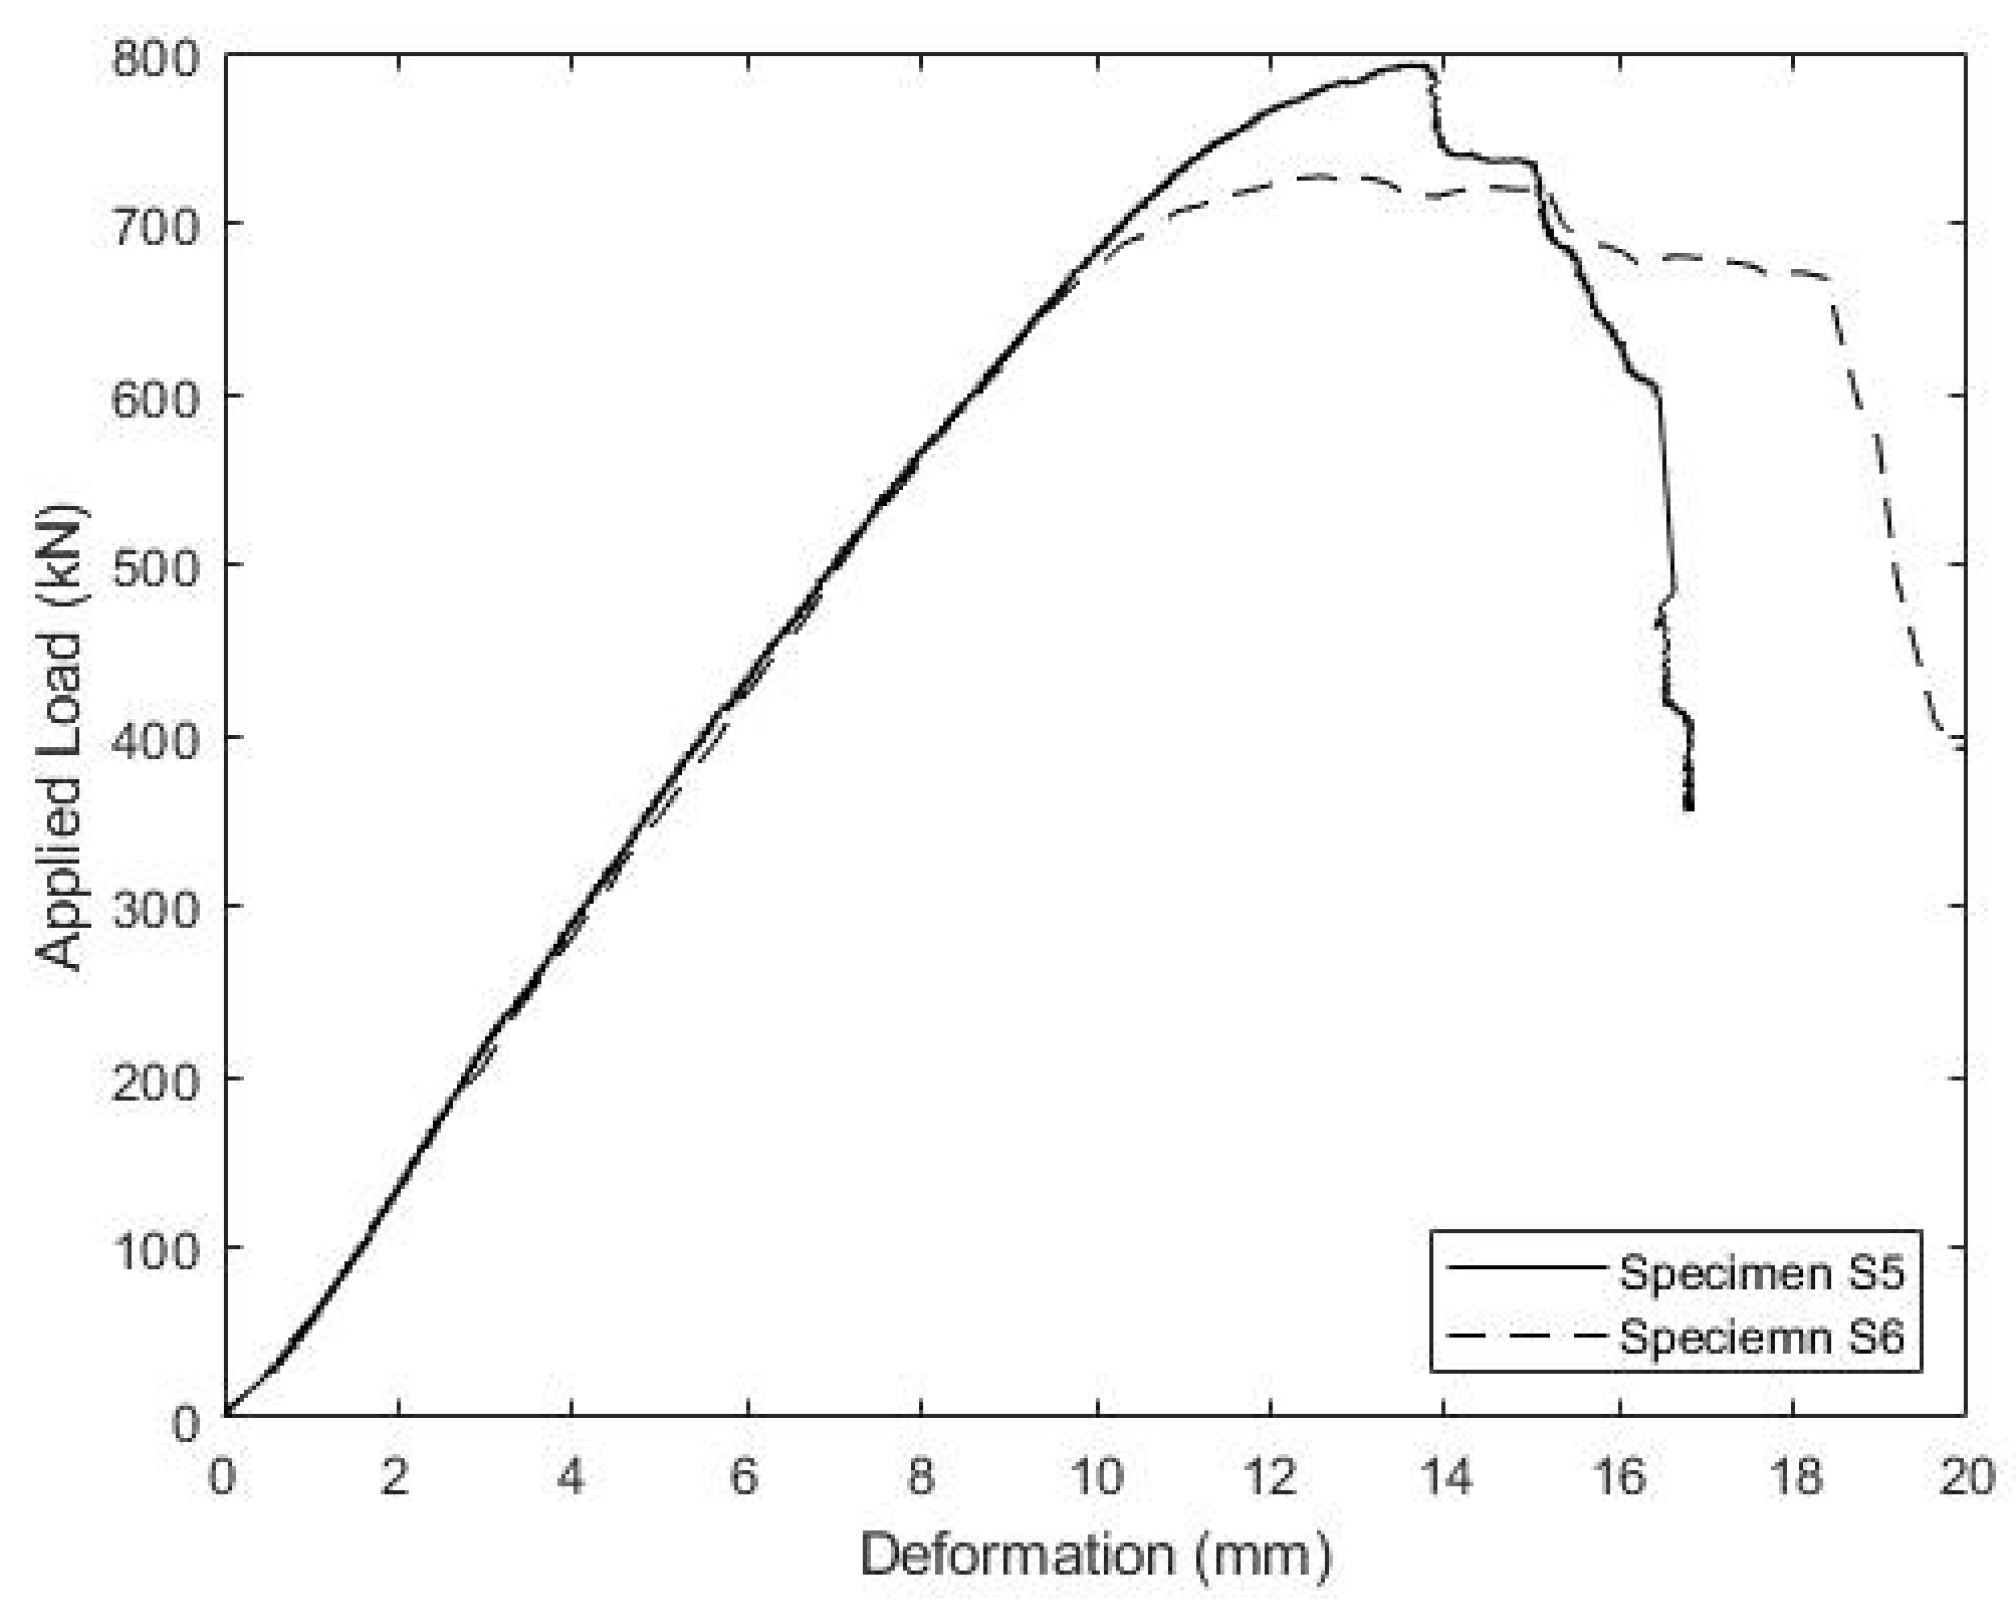
| S5 | 74.5 | Yes | 129 | 316 | 792 | 0.708 | 82.0 |
| S6 | 74.5 | Yes | 129 | 316 | 729 | 0.652 | 75.5 |
Publisher’s Note: MDPI stays neutral with regard to jurisdictional claims in published maps and institutional affiliations. |
© 2022 by the authors. Licensee MDPI, Basel, Switzerland. This article is an open access article distributed under the terms and conditions of the Creative Commons Attribution (CC BY) license (https://creativecommons.org/licenses/by/4.0/).
Share and Cite
Davids, W.G.; Guzzi, D.; Schanck, A.P. Development and Experimental Assessment of Friction-Type Shear Connectors for FRP Bridge Girders with Composite Concrete Decks. Materials 2022, 15, 3014. https://doi.org/10.3390/ma15093014
Davids WG, Guzzi D, Schanck AP. Development and Experimental Assessment of Friction-Type Shear Connectors for FRP Bridge Girders with Composite Concrete Decks. Materials. 2022; 15(9):3014. https://doi.org/10.3390/ma15093014
Chicago/Turabian StyleDavids, William G., Dante Guzzi, and Andrew P. Schanck. 2022. "Development and Experimental Assessment of Friction-Type Shear Connectors for FRP Bridge Girders with Composite Concrete Decks" Materials 15, no. 9: 3014. https://doi.org/10.3390/ma15093014