Article

Investigating the Corrosive Influence of Chloride Ions on Slag Recovery Machine Shells in Power Plants

1
Xi’an TPRI Water Management & Environment Protection Co., Ltd., Xi’an 710054, China
2
School of Materials Science and Engineering, Hebei University of Technology, Tianjin 300130, China
3
Key Lab for New Type of Functional Materials in Hebei Province, Tianjin 300130, China
*
Author to whom correspondence should be addressed.
These authors contributed equally to this work.
Materials 2023, 16(15), 5270; https://doi.org/10.3390/ma16155270
Submission received: 9 July 2023 / Revised: 23 July 2023 / Accepted: 24 July 2023 / Published: 27 July 2023

Abstract

:
An effective strategy for achieving cost-effective and environmentally friendly desulfurization wastewater in coal-fired power plants involves the incorporation of desulfurization wastewater into the slag water system. The objective of this study was to analyze the corrosion behavior of Q235-A slag-picker shell material upon the introduction of FGD wastewater into the slag water system. The dynamic weight loss method, electrochemical testing method and microscopic phase characterization were employed to investigate the impact of varying chloride ion concentrations (ranging from 1000 mg/L to 30,000 mg/L) of flue gas desulfurization wastewater (FGD wastewater) on the corrosion of Q235-A slag-picker shell material. The test results indicate that as the concentration of chloride ions increases, the corrosion rate increases from 1.1487 mm/a to 1.5590 mm/a when the concentration is less than 10,000 mg/L. However, when the concentration exceeds 10,000 mg/L, the corrosion rate decreases from 1.559 mm/a to 1.0393 mm/a. The corrosion rate is above 1 mm/a at all concentrations. As the Cl concentration, the quality of the corrosion product film initially increases and then decreases. The primary components of the corrosion product are α- FeOOH, γ-FeOOH, β-FeOOH, Fe3O4 and γ-Fe2O3.

1. Introduction

Desulfurization wastewater generated by coal-fired power plants poses significant challenges for treatment due to its complex composition, diverse pollutant types, and intricate remediation process. It represents the final stage of wastewater produced in power plants and requires specialized treatment approaches [1,2,3]. Currently, the treatment of desulfurization wastewater primarily involves two approaches: zero discharge treatment and standard discharge treatment. The zero discharge treatment integrates pretreatment softening, thick membrane water, and evaporation crystallization or flue evaporation technologies to eliminate desulfurization wastewater. Some power plants have adopted this process, which meets the treatment standards. However, this approach suffers from drawbacks such as a lengthy process route, substantial investment, and high-operational expenses. Utilizing desulfurization wastewater as make-up water for slag cooling, thereby enabling in-plant reuse of wastewater, offers several benefits, including cost-effectiveness, minimal investment and operational expenses, uncomplicated equipment requirements, and excellent adaptability. In contrast, the slag possesses the ability to absorb and eliminate suspended particles, certain heavy metals, and inorganic ions found in the wastewater. Additionally, when subjected to high temperatures, the slag can undergo partial evaporation, thereby reducing the volume of FGD wastewater introduced into the system.
Therefore, incorporating desulfurization wastewater into the slag water system as make-up water has emerged as a viable approach to mitigate the discharge of desulfurization wastewater, attracting growing interest in recent times [4,5,6]. The systematic treatment of power plant wastewater by introducing desulfurization wastewater into the slag water system has the advantages of treating waste with waste, low investment cost, and a simpler process modification [7,8,9,10,11]. Zhang et al. [12]. conducted a comprehensive analysis of three different FGD wastewater treatment technologies, examining their respective characteristics, treatment effectiveness, process parameter boundaries, potential impacts, and operational costs based on real-world engineering cases. Furthermore, they suggested that a comprehensive evaluation of the slag water system should be conducted after studying the integration of FGD wastewater into the system. Chen Biao et al. [13] studied the discharge of flue gas desulfurization wastewater from power plants into the slag water treatment system. The results showed that alkaline slag water could neutralize the desulfurization wastewater and cause the deposition of heavy metals and fluoride. Similarly, Yijin Zou [14] systematically examined the slag machine’s effect on the slag water system’s operation after introducing desulfurization wastewater into the slag water system. The results showed that the desulfurization wastewater introduced into the slag water system through the slag bin has a smaller impact on the overall system water quality. It is relatively small, mainly because all the operating parameters of the slag water system are within the range of stable operation. The discharge of the bottom discharge sludge of the high-efficiency thickener into the gypsum buffer tank will not affect the quality of gypsum. In contrast, the leaching toxicity of slag and gypsum meets the standard and the reuse is unaffected. However, the clogging and equipment corrosion of the slag water system piping, etc., by Cl in the desulfurization wastewater, requires further study, and its corrosion risk is not yet known.
The precise prediction of corrosion rate and understanding of corrosion mechanisms play a crucial role in selecting suitable equipment materials for protection. Underestimating the corrosion rate can result in catastrophic failures, environmental risks, and significant economic losses [15,16,17]. Therefore, studying the evolution and corrosion mechanisms of Q235-A steel in the sludge water system after the introduction of FGD wastewater can serve as a foundation for extending equipment lifespan and ensuring its integrity. The prediction of service life can provide a basis to ensure the safety of industrial production. The electrochemical behavior of Q235-A steel in a variety of corrosive media has been widely studied [18,19,20], such as Feng Wengui et al. [21], who analyzed the corrosion pattern and corrosion mechanism of Q235 carbon steel sheet in the cooling water of hydropower plant; and Lin Xiaofeng et al. [22] who studied the effect of temperature, pH, and conductivity on the corrosion of different components of the slag water system. However, the morphological evolution of the surface of Q235-A steel has rarely been monitored and analyzed, especially the lack of systematic research on the corrosion mechanism of Q235-A steel in the new environment.
Since the most significant change in the new environment after the addition of desulfurization wastewater to slag water is the Cl concentration, another important factor is because the Cl concentration in the water varies depending on the actual operation of the power plant. This means that the same fluid transfer equipment will work in locations with very different chloride concentrations. Industries, especially power plants, increasingly use recycled water to cope with scarcity constraints and sustainability needs [23,24,25,26,27,28]. The continuous water evaporation during the slag water cycle leads to changes in Cl concentrations; these recycled waters often have a higher salt content than when they were first used. Thus, it is clear [29,30,31,32,33] that understanding the effect of Cl concentration on the corrosion performance of engineering materials is worthy of in-depth studying.
In this paper, the corrosion rate of carbon steel surface under different concentrations of corrosion was determined by the corrosion hanging method with six different Cl concentration water samples; the microscopic morphology of corrosion product film and product composition were characterized by the surface analysis technique, and the change law of electrochemical corrosion parameters of carbon steel in cooling water was analyzed with the help of electrochemical measurement technique. Cl ions’ corrosion effect on the slag-fishing machine’s shell and its corrosion law was systematically studied.

2. Experimental

2.1. Material and Sample Preparation

Q235-A was chosen as the material for the experiments with the following compositions: C ≤ 0.17%, Mn ≤ 0.14%, Si ≤ 0.35%, S ≤ 0.035%, P ≤ 0.035%, and the balance of Fe. 10 mm × 2 mm specimens for electrochemical experiments, and 20 mm × 20 mm × 2 mm specimens for observation of corrosion morphology. All samples were washed in anhydrous ethanol, 10% NaOH solution and 20% HCl solution and distilled water in order to remove oil and rust from the surface, and dried in a drying oven for two hours. The specimens used to measure the weight loss were punched with a Φ ≤ 5 mm hole.
The actual water samples from power plants are complex in composition, containing elements such as Mg, P, S, Cl, Ca, etc. The ion concentration in the water samples is constantly changing with the operation of the equipment, which cannot be measured quantitatively, so this experiment will use the power plant to retrieve disposable water samples for the experimental original water samples whose chloride ion concentration is 5879.057753 mg/L, and by adding NaOH to adjust the pH of the water samples to 9 and adding NaCl. The water samples were adjusted to different concentrations, i.e., six different Cl concentrations of desulfurization wastewater solutions configured as 1000 mg/L, 3000 mg/L, 5000 mg/L, 10,000 mg/L, 20,000 mg/L, 30,000 mg/L. These concentrations, 1000 mg/L, 3000 mg/L, 5000 mg/L, 10,000 mg/L, 20,000 mg/L, 30,000 mg/L, were noted as L0.1, L0.3, L0.5, L1, L2, L3 for convenience. Table 1 shows the original water quality. The experimental water samples were varied on this basis for pH and Cl concentration.

2.2. Characterization Methods

2.2.1. Hanging Piece Experiment

Fifteen groups of 50 mm × 25 mm × 5 mm specimens were weighed with an accuracy of 0.01 g. The numbers were recorded; nine groups of specimens were set up with three parallel specimens, each at 20,000 mg/L, 80 rpm, and 60 °C, respectively, for observing the change in weight loss rate over time. A daily data collection process was executed for a period of 9 days. Specimens from six groups were weighed and labeled L0.1, L0.3, L0.5, L1, L2, and L3, with three parallel specimens set for each group. After immersing the specimens in the solution, the corrosion duration was recorded starting after the solution temperature was raised to 60 °C. The extracted samples undergo water rinsing to eliminate specific corrosion contaminants. The residue adhered to the surface was subjected to ultrasonic cleaning for 25 min by employing 1000 mL of hydrochloric acid at 36% concentration (HCl, ρ = 1.19 g/mL), 20 g of antimony trioxide (Sb2O3), and 50 g of stannous chloride (SnCl2). The samples were then dried, weighed, and placed in a desiccator. A blank experiment was conducted for each set of experiments. The corrosion rate was calculated by Equation (1):
R = M 1 M 2 M 3 × 8.76 S T D × 10 7
In the above equation: R—is the corrosion rate, mm/a; M1—is the mass of the specimen before the experiment, g; M2—is the mass of the specimen after the experiment, g; M3—is the mass difference between the blank specimen before and after pickling, g; S—is the total area of the specimen, cm2; T—is the test time, h; D—is the density of the material, kg/m3.

2.2.2. Q235-A Surface Corrosion Analysis

A JSM-6510A scanning electron microscope (SEM) was used to observe the microscopic morphology and cross-sectional morphology of the corrosion product film; the elemental distribution of the corrosion product film was determined by an JED-2300 energy spectrometer (EDS); the corrosion product on the surface of the sample was analyzed by using a Smartlab 9 KW X-ray diffractometer (XRD): the power is 4 KW, the speed is 10°/min, and the test range is 10° to 90° under the parameters of the overall test of the sample to analyze its corrosion product phase composition.

2.2.3. Electrochemical Testing

The electrochemical properties of the specimens were tested using the conventional three-electrode system, as shown in Figure 1. The experiment can obtain two kinds of data, impedance and polarization curve. Analyzing its impedance spectrum can determine its corrosion tendency and resistance size, and analyzing the polarization curve can derive the size of corrosion current density during the polarization process to analyze the corrosion process. The specimen has corrosion products as the working electrode, saturated glycury electrode (SCE) as the reference electrode, platinum electrode as the auxiliary electrode, a working electrode size of 10 mm × 10 mm × 2 mm, and an exposed working area of 1 cm2. EIS measurement under the OCP, low frequency 0.01 HZ, high frequency 100,000 HZ, amplitude 0.005; EIS test under each concentration. In order to analyze their corrosion product film changes, three experiments were conducted for 0 d, 3 d and 5 d, respectively; the results were fitted by Zsimpwin 3.60 software. All electrochemical experiments were conducted at 60 °C, and each experiment was repeated three times to ensure accurate results.

3. Results and Discussion

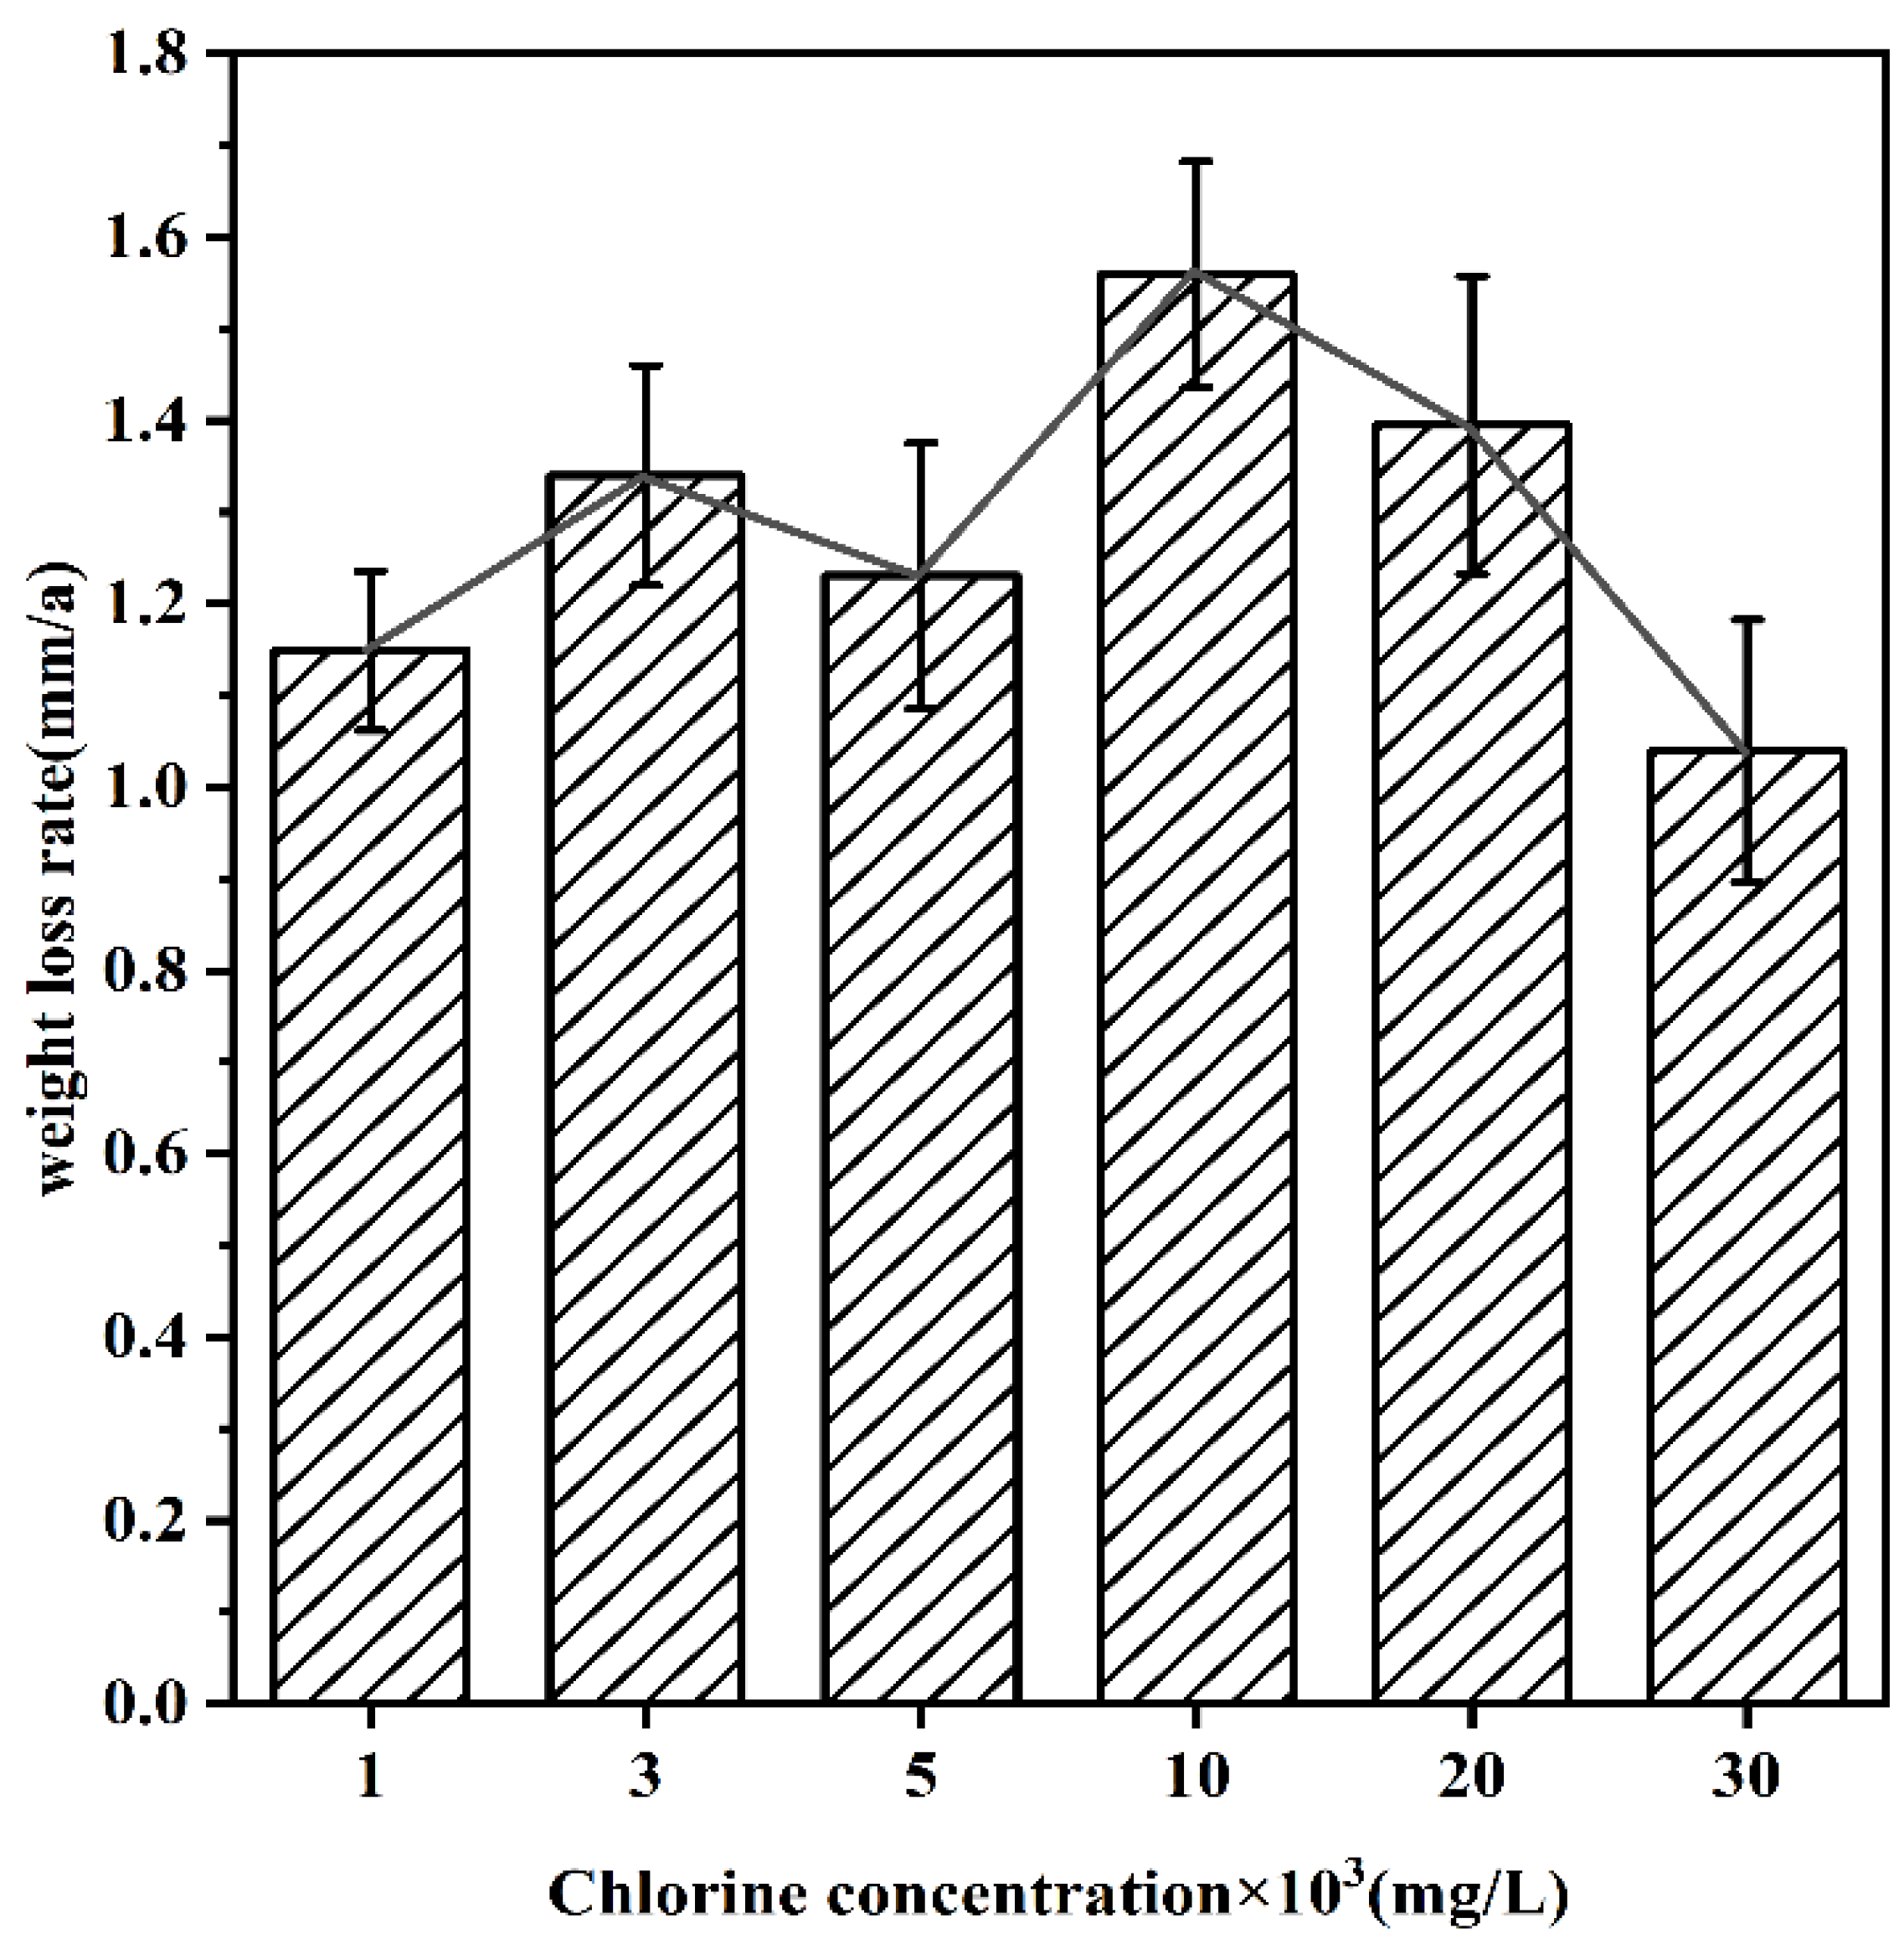
3.1. Hanging Experimental Analysis

It can be seen from Figure 2 that the Q235 steel in 20,000 mg/L solution corrosion rate gradually decreases with the extension of time. The corrosion rate achieves a state of gradual stability after approximately 5 days, ultimately stabilizing at a rate of 1.265 mm per annum. The accumulation of corrosion products on the surface of the sample impedes the continuation of corrosion over time. As time progresses, the production of corrosion products by the sample increases, gradually improving its structural integrity. This suggests that the corrosion products offer a degree of protection and stabilize the corrosion rate at a specific level [34]. The properties of the material and the concentration of chloride ions in the solution together determine the thickness of the corrosion product film. Therefore, when comparing the effect of chloride ion concentration on corrosion, the time should be fixed at 5 days.
Figure 3 shows the weight loss rate of the samples in different concentrations of desulfurization wastewater. It can be found that the weight loss rate tends to increase with the increase of Cl concentration, reaching a peak at L1 and then decreasing with the increase of concentration, which is because the O content in the solution decreases with the increase of Cl concentration, making the weight loss rate decrease. It is noteworthy that the weight loss rate at L0.5 is lower than that at L0.3, probably due to the increase in Cl concentration and the adhesion of a water film on it. In addition, the water film hinders the occurrence of corrosion, resulting in a slight decrease in the weight loss rate.

3.2. Q235-A Surface Morphology Analysis

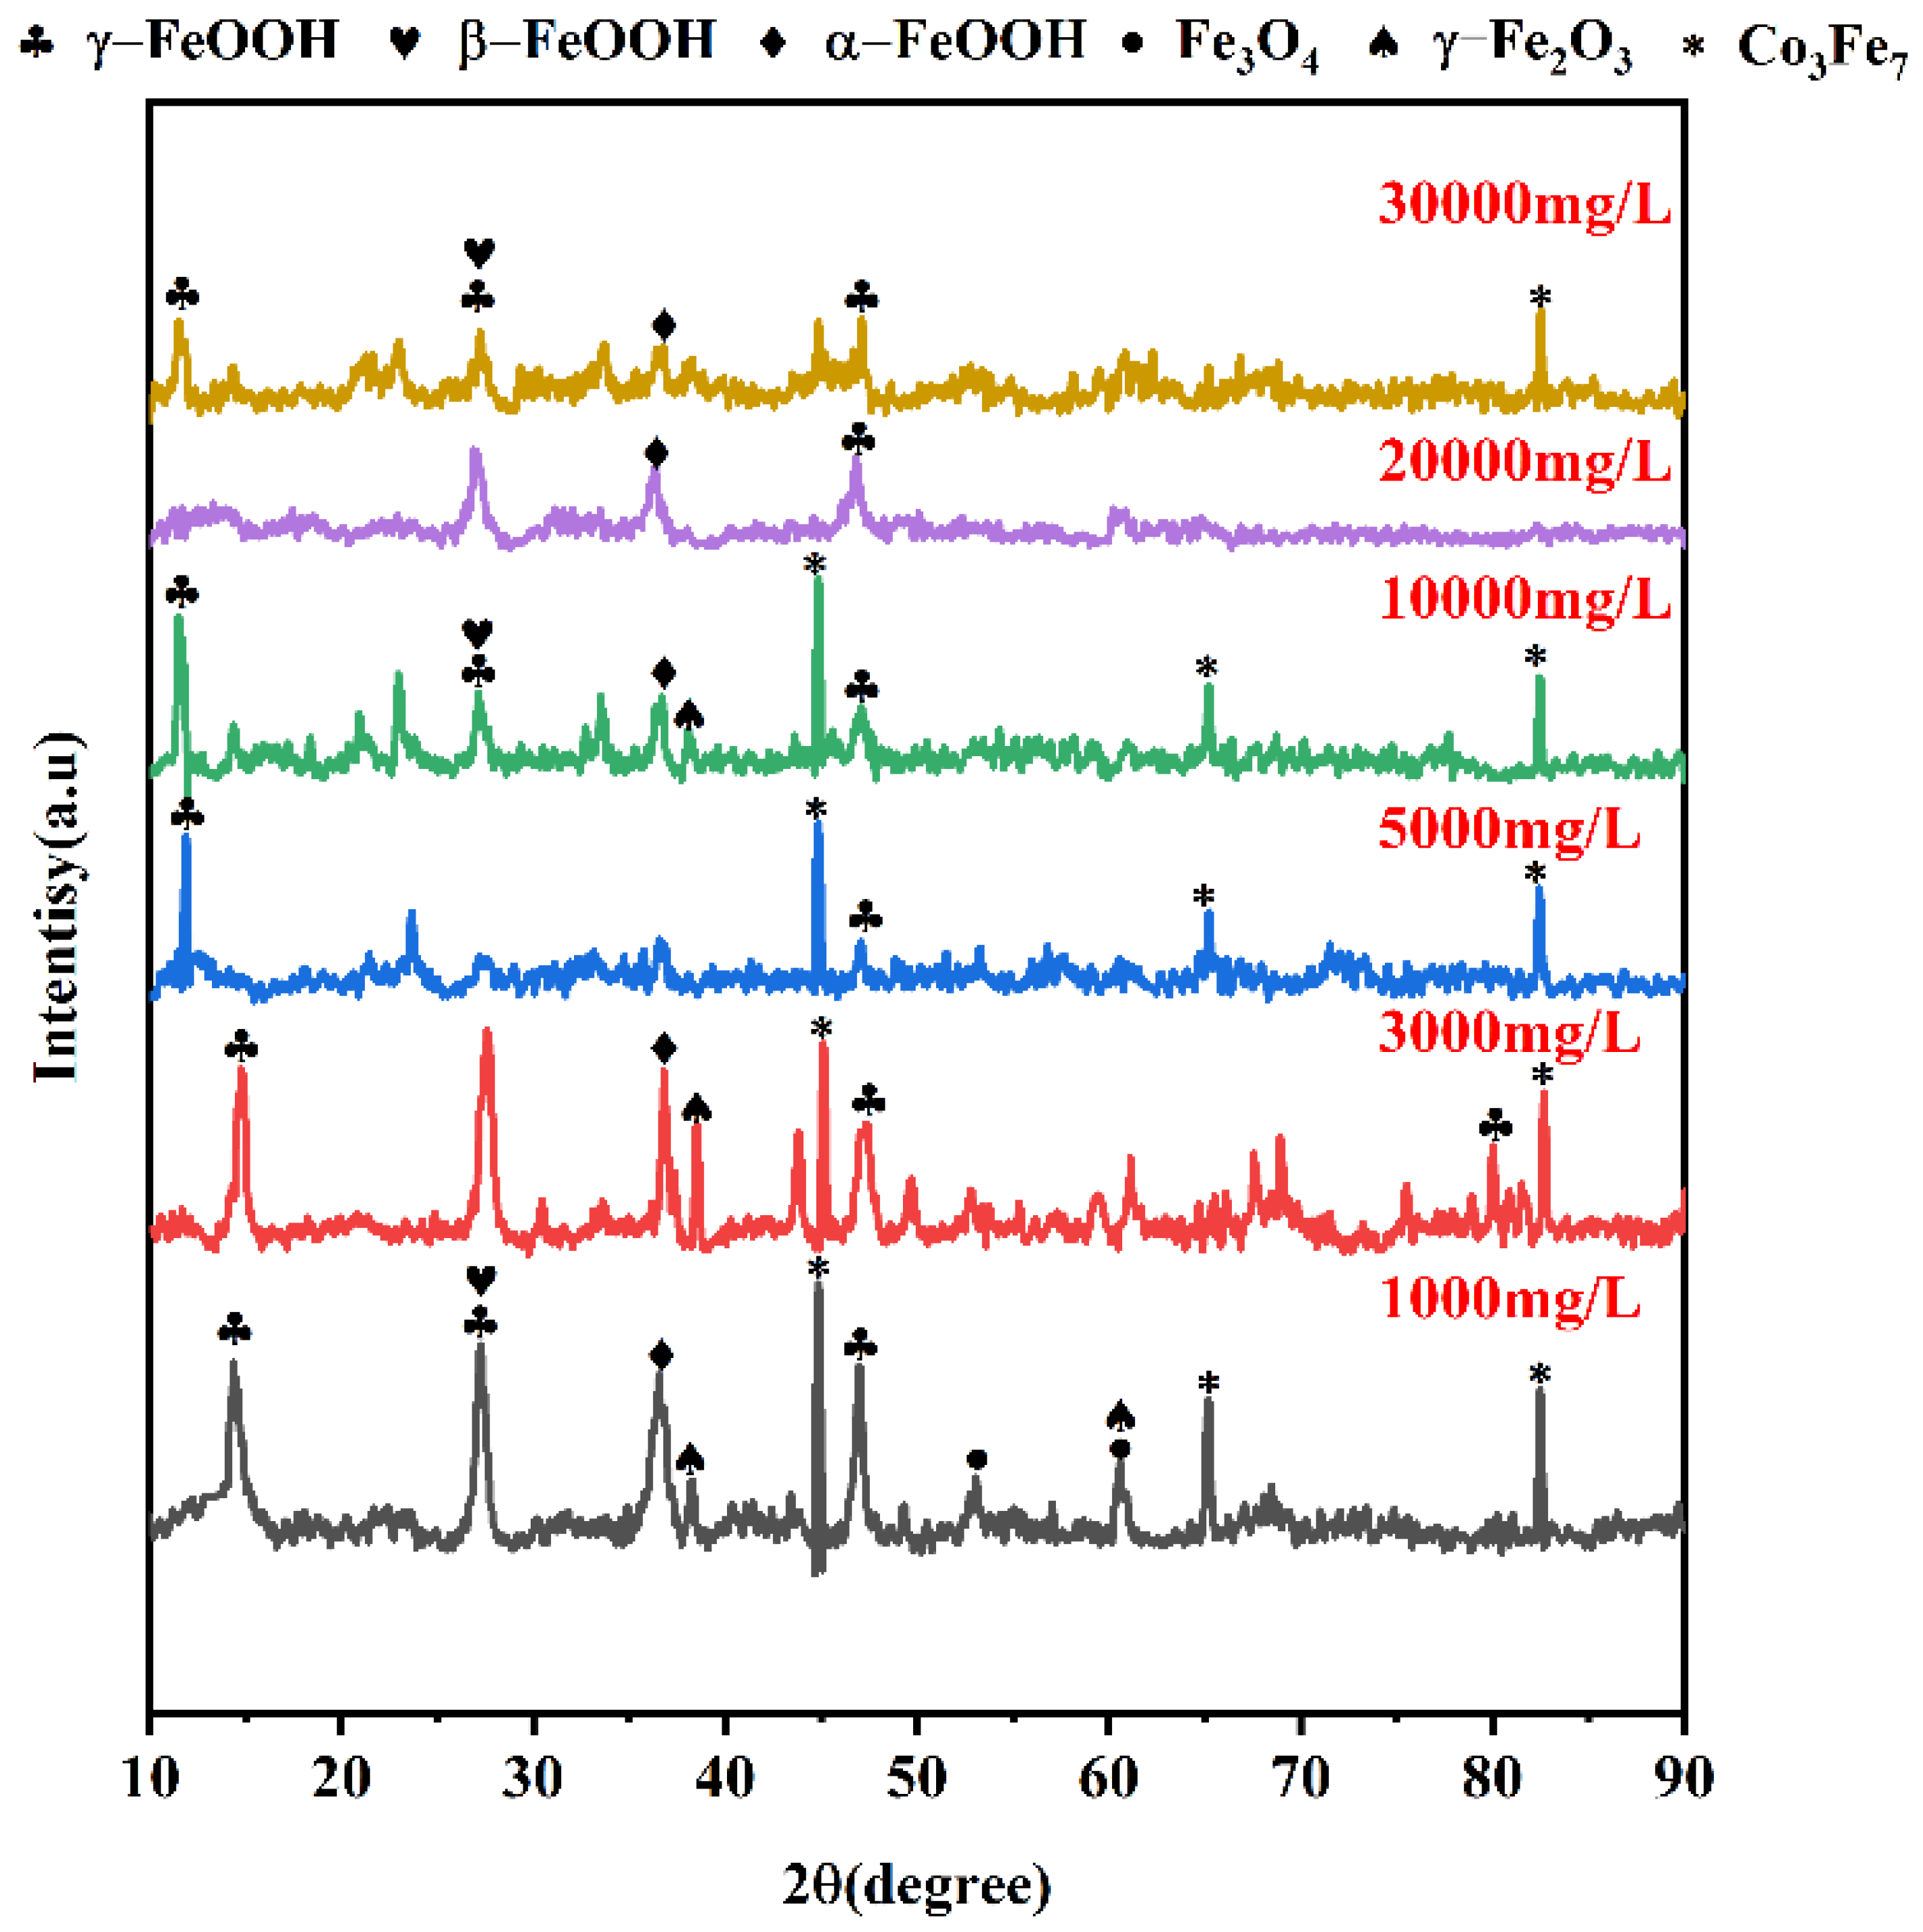
3.2.1. Composition of Corrosion-Producing Films

To study the composition of corrosive products of Q235-A steel, the phase composition of the corrosion products was determined by X-ray diffraction after 5 days of corrosion in L0.1–L3 solution. As shown in Figure 4, the phase composition of the corrosion products of Q235-A in L0.1–L3 solution is the same, mainly composed of α-FeOOH, γ-FeOOH, β-FeOOH, Fe3O4 and γ-Fe2O3, which are similar to the corrosion products commonly found in the wet and salty marine atmospheric environment. A part of Co3Fe4 appears as the electron beam penetrates the sample to reach the Fe matrix. The Co3Fe4 phase gradually decreases with increasing Cl concentration, proving that the corrosion layer becomes more dense and complete. In addition, as the Cl concentration increases, the intensity of the α-FeOOH peak decreases, and the γ-FeOOH peak increase is indicative of Cl inhibiting the generation of α-FeOOH.

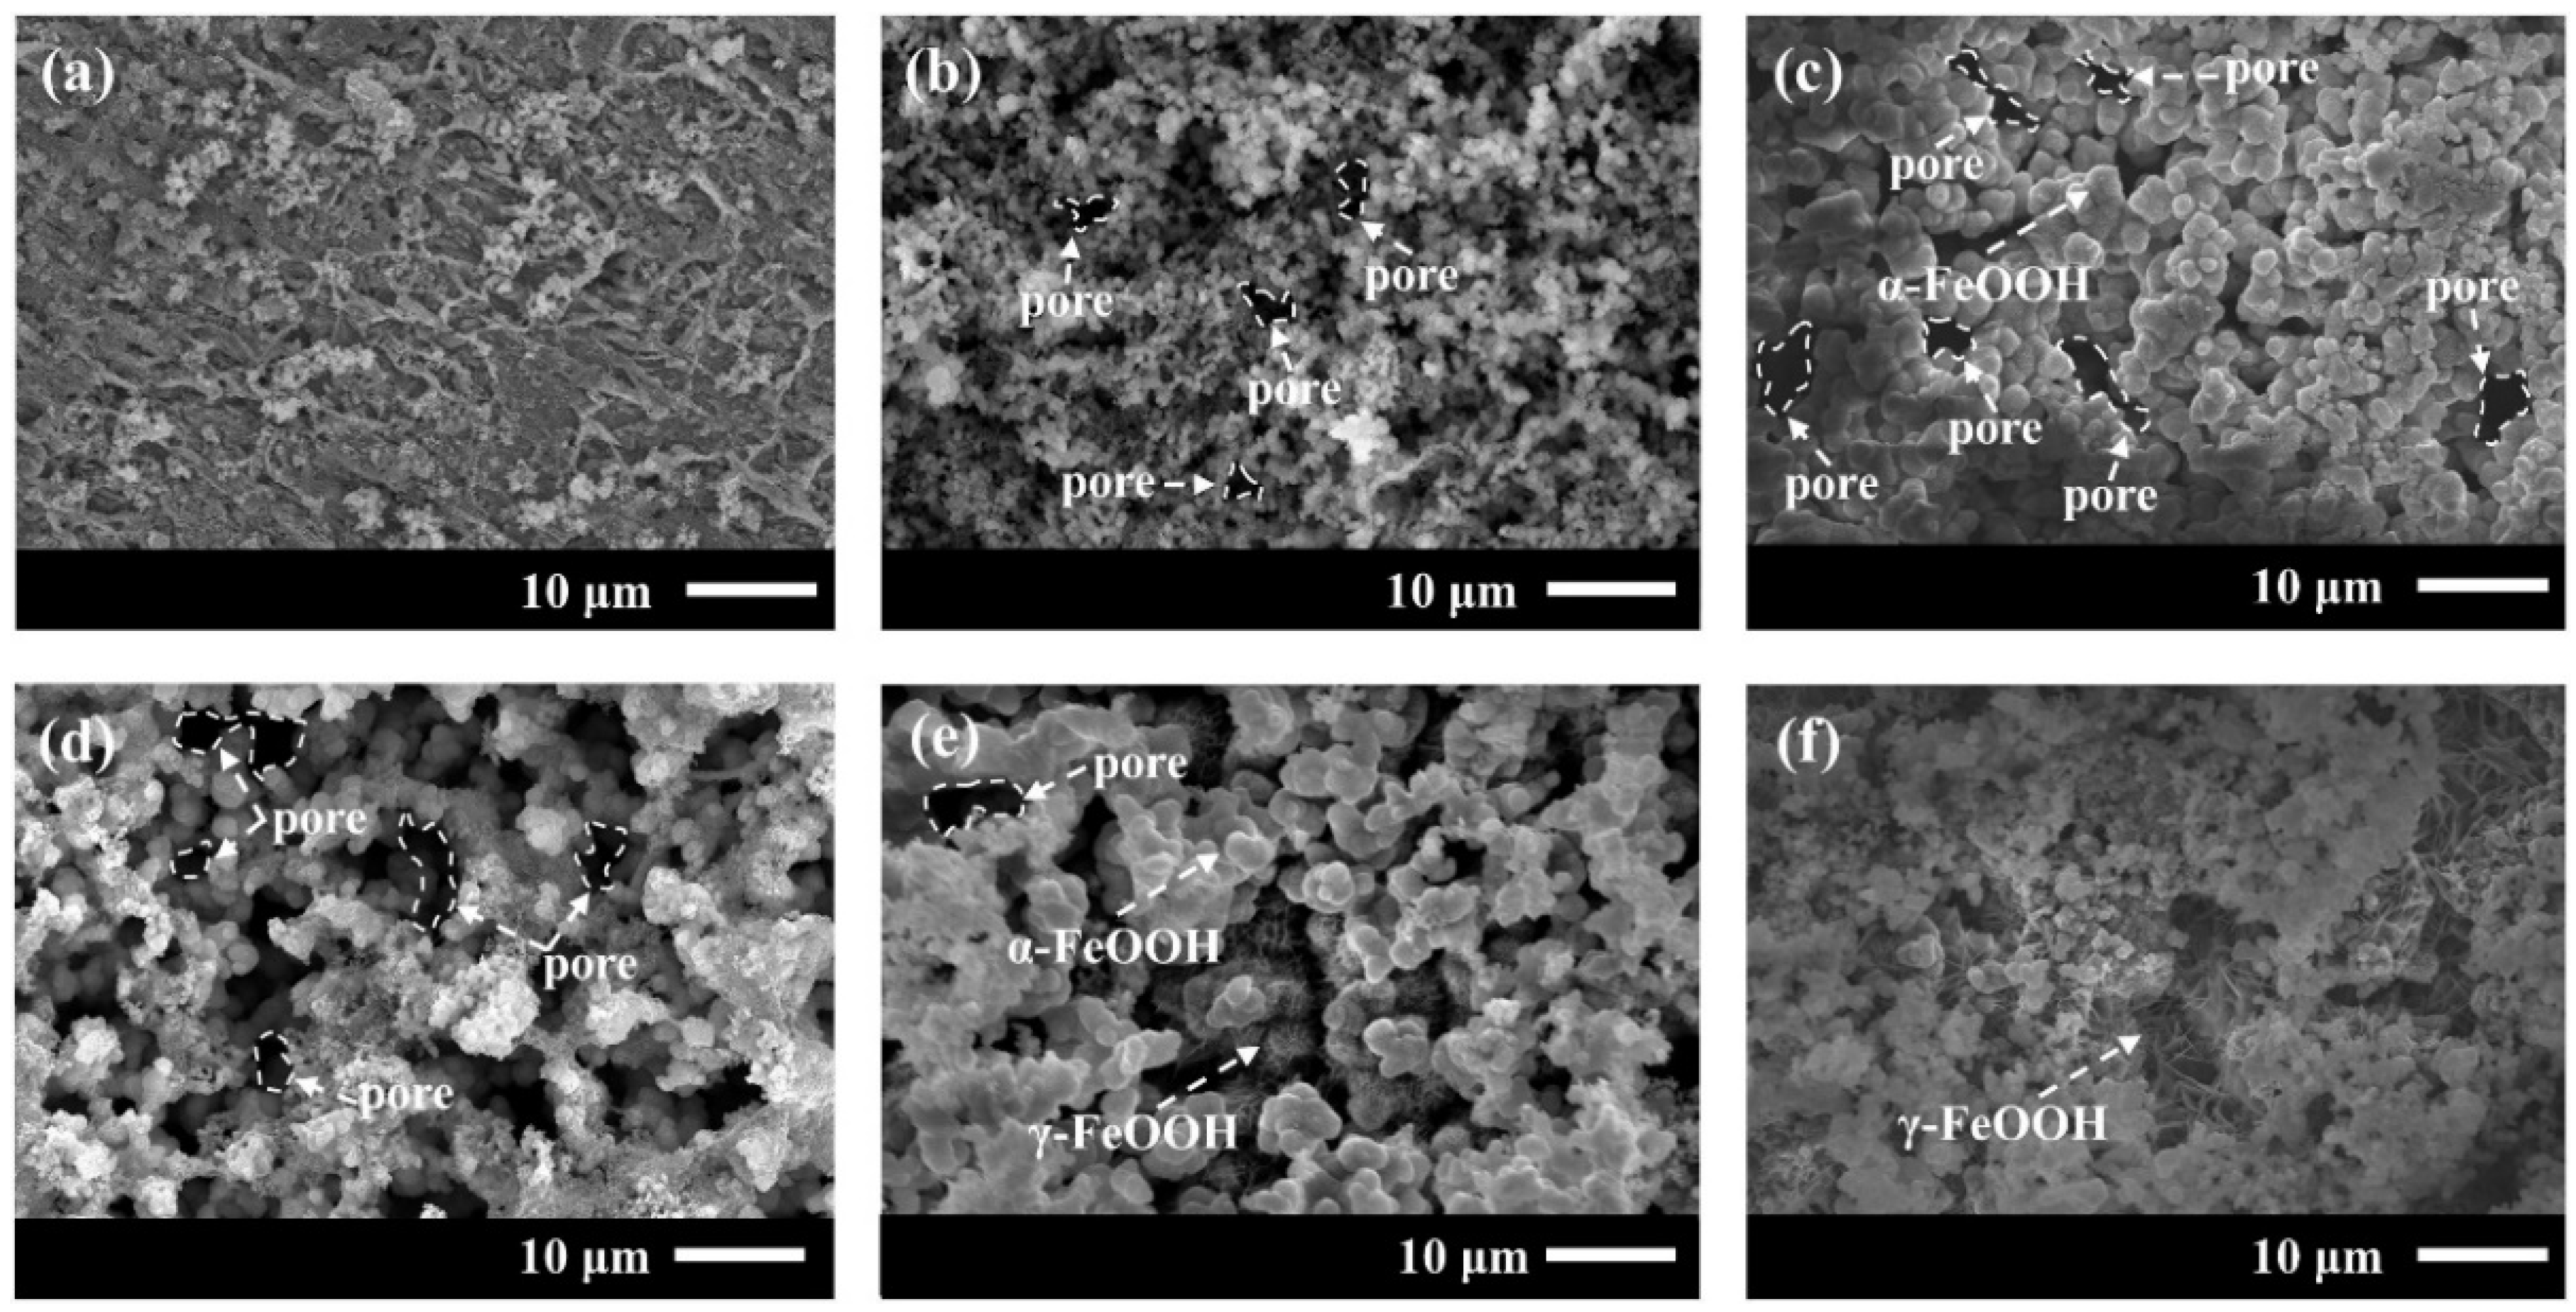
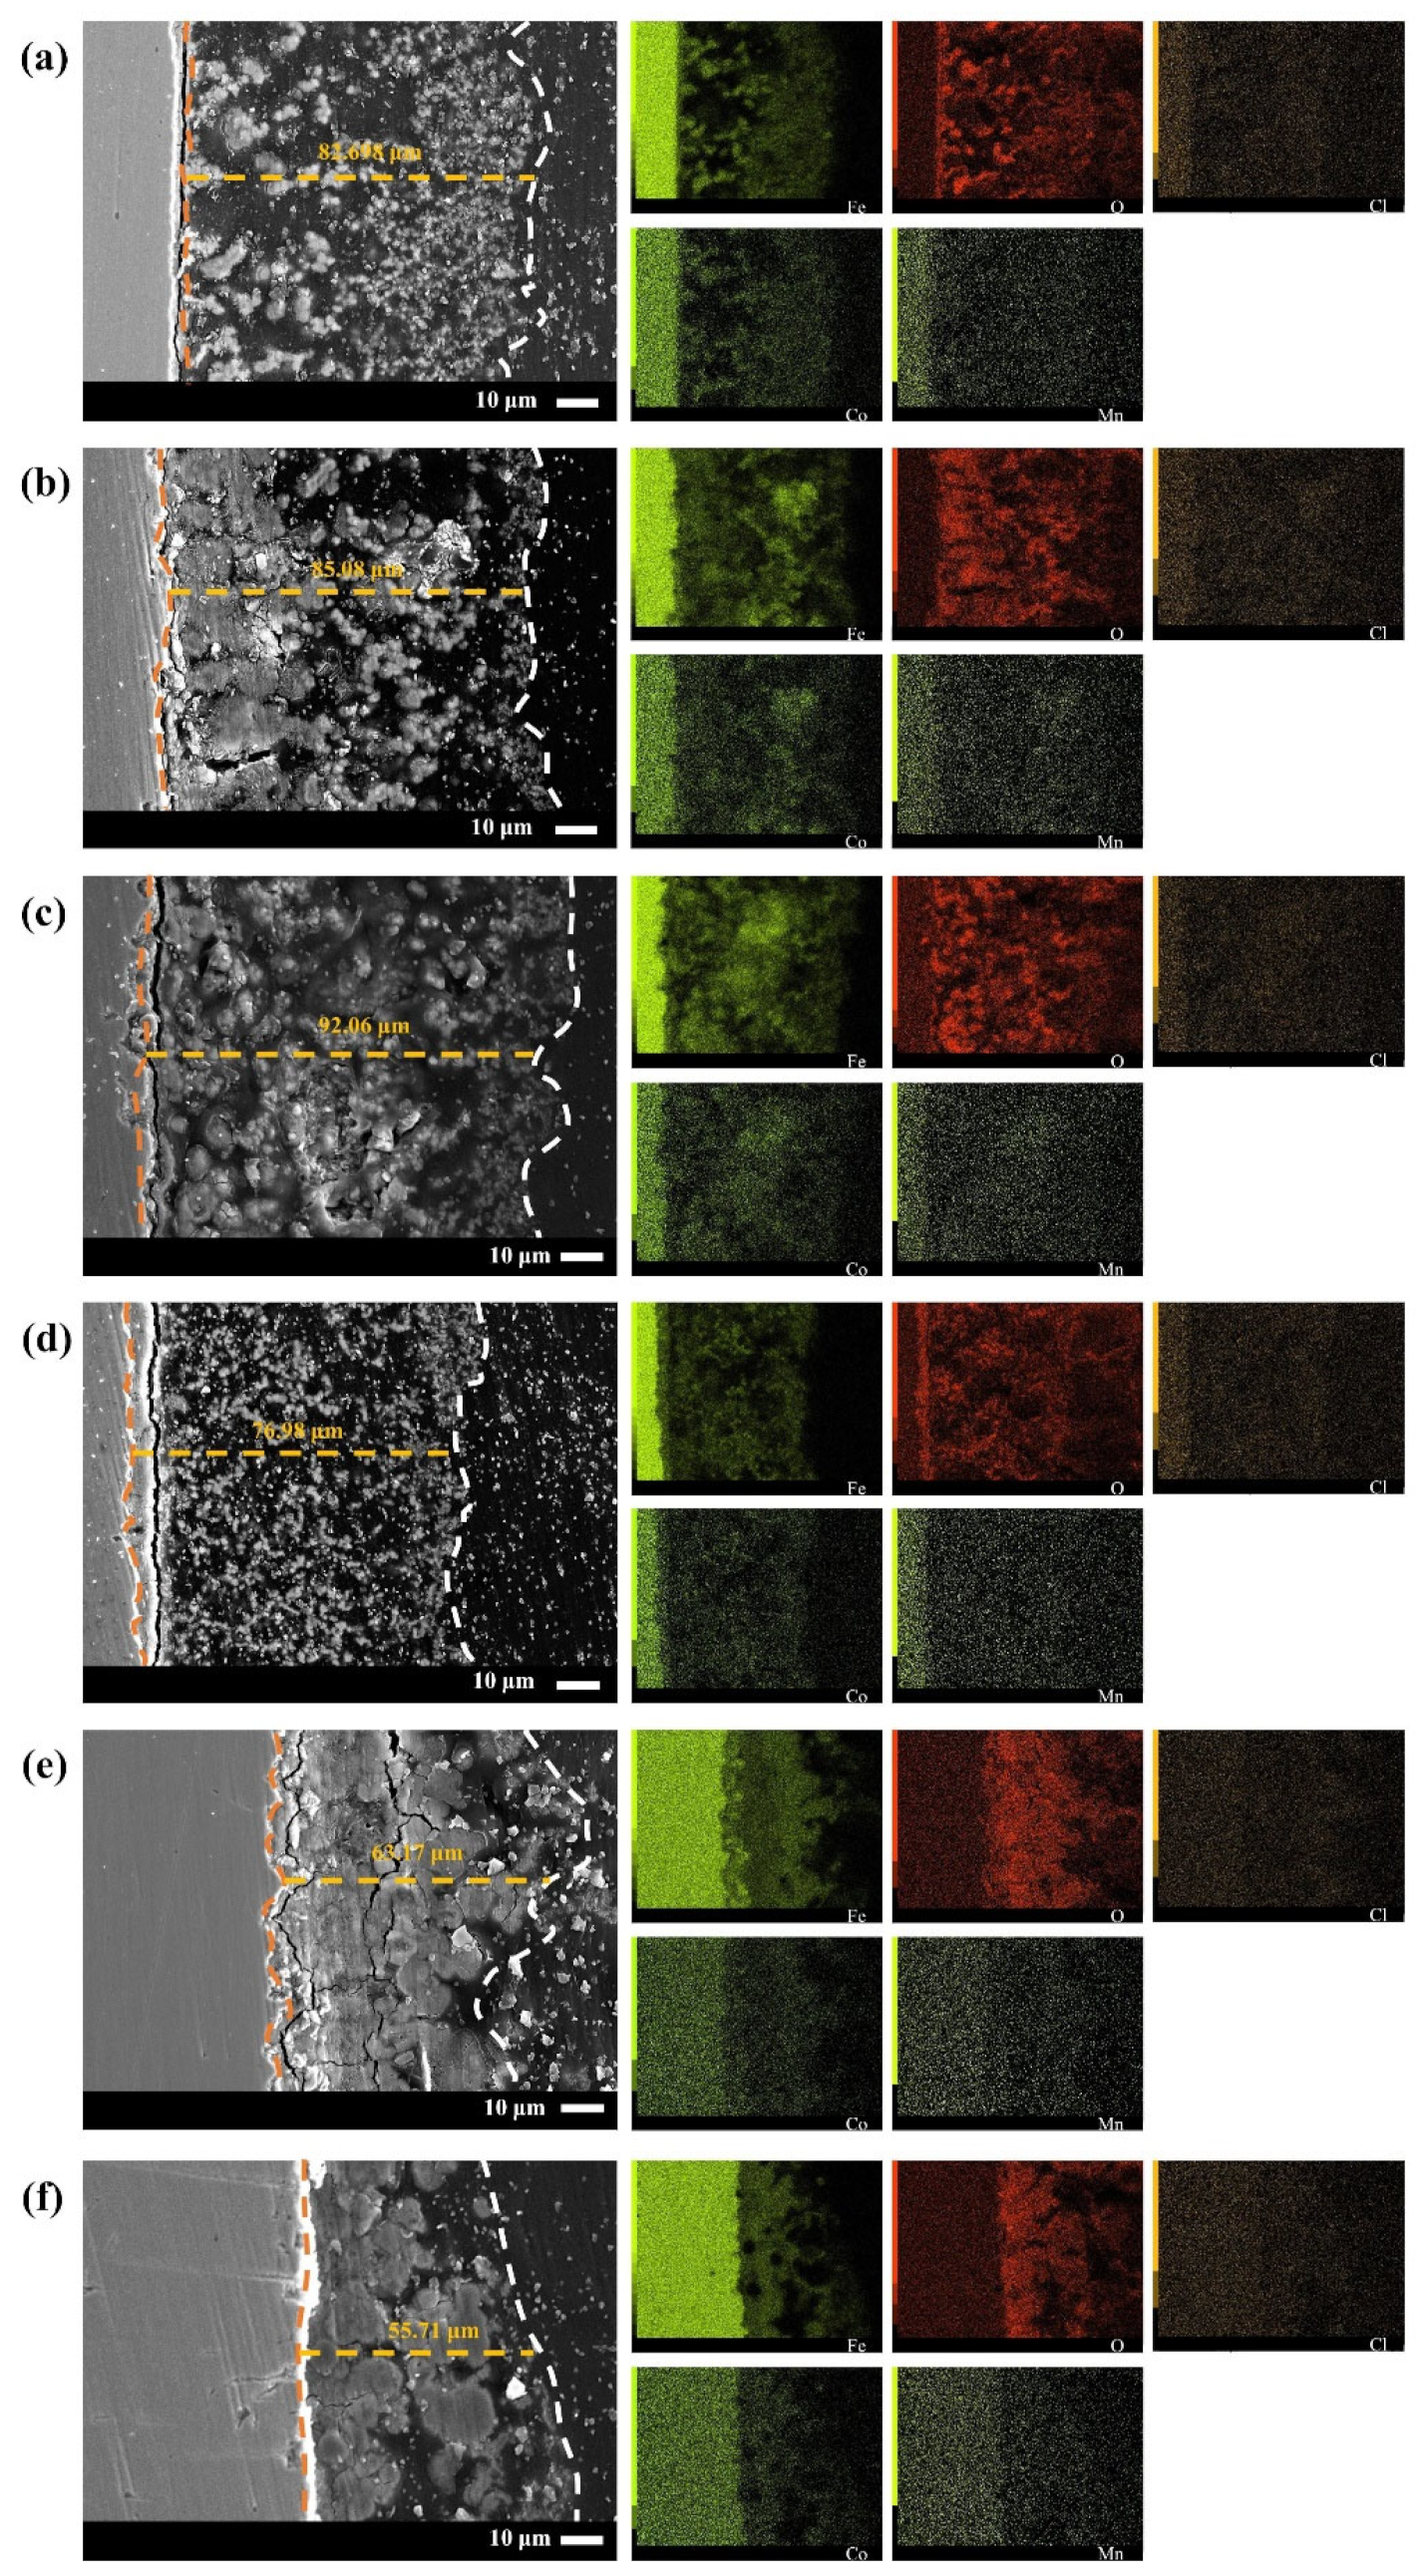
3.2.2. Corrosion Product Form

To study the quality of Q235-A steel corrosion products, we observed the microscopic morphology of corrosion products of both steels after 5 d immersion, as shown in Figure 5. The Q235-A steel in L0.1–L0.5 solution after immersion corrosion products becomes granular, and there is no local corrosion and pitting; it is worth noting that in L0.1 corrosion products, film bonding is not strong. The corrosion products on it are very loose so it will expose part of the substrate. With the increase in Cl concentration, the corrosion product particles gradually become larger, and the denseness of the corrosion product film also increases because of the larger particles. However, after L1 gradually decreases because of the increase in pores, the L1 solution has larger holes in the corrosion product film. Pin-like corrosion products were produced in L2 and L3. According to the literature [35], α-FeOOH has a cotton ball-like and cluster structure, and γ-FeOOH has a needle band-like structure. Based on the phase of corrosion product and XRD results, it can be concluded that the rise with Cl will inhibit the conversion of γ-FeOOH to α-FeOOH.
The distribution of elements in the corrosion product film of Q235-A steel after 5 d of corrosion in L0.1–L3 solution was observed by SEM and EDS methods combined, as shown in Figure 6. As the increase of Cl concentration, the samples corrosion product film thickness first increases then decreases. The maximum is 92.06 μm, and the minimum is 55.71 μm. In addition, in L0.1 and L1, the outer film is loose and thick, while the inner membrane is thin, relatively dense, and tightly bound to the substrate. As the concentration increased, the inner film of corrosion products showed holes, large longitudinal and transverse cracks, and transverse and longitudinal cracks between the substrate and the inner film. The appearance of cracks is related to the orientation of the substrate surface, e.g., different gold structures are formed on different surface orientations. Cracks may start at the boundaries of the defective regions as well as in thin gold layers with concave edges formed on the initial Cu3Au substrate. Once cracks or initial pores begin to grow, they usually continue to grow in the same direction. It follows that cracks are largest on the (110) grain surface [36]. The metallographic organization of Q235-A steel after annealing, quenching, and tempering is tempered martensite, but there is no significant difference in the surface corrosion of grains with different surface energies due to the activated state of Q235-A steel. This indicates that Cl reduced the adhesion between the substrate and the inner film.
From the element distribution, Fe and O compounds are the main phases on the corrosion product film, which are consistent with the results of XRD. Most of the compounds are loose and porous; Cl elements are uniformly distributed on the corrosion product film, whereas Co elements and Mn elements are not enriched, indicating that they have no obvious protective effect on the substrate.

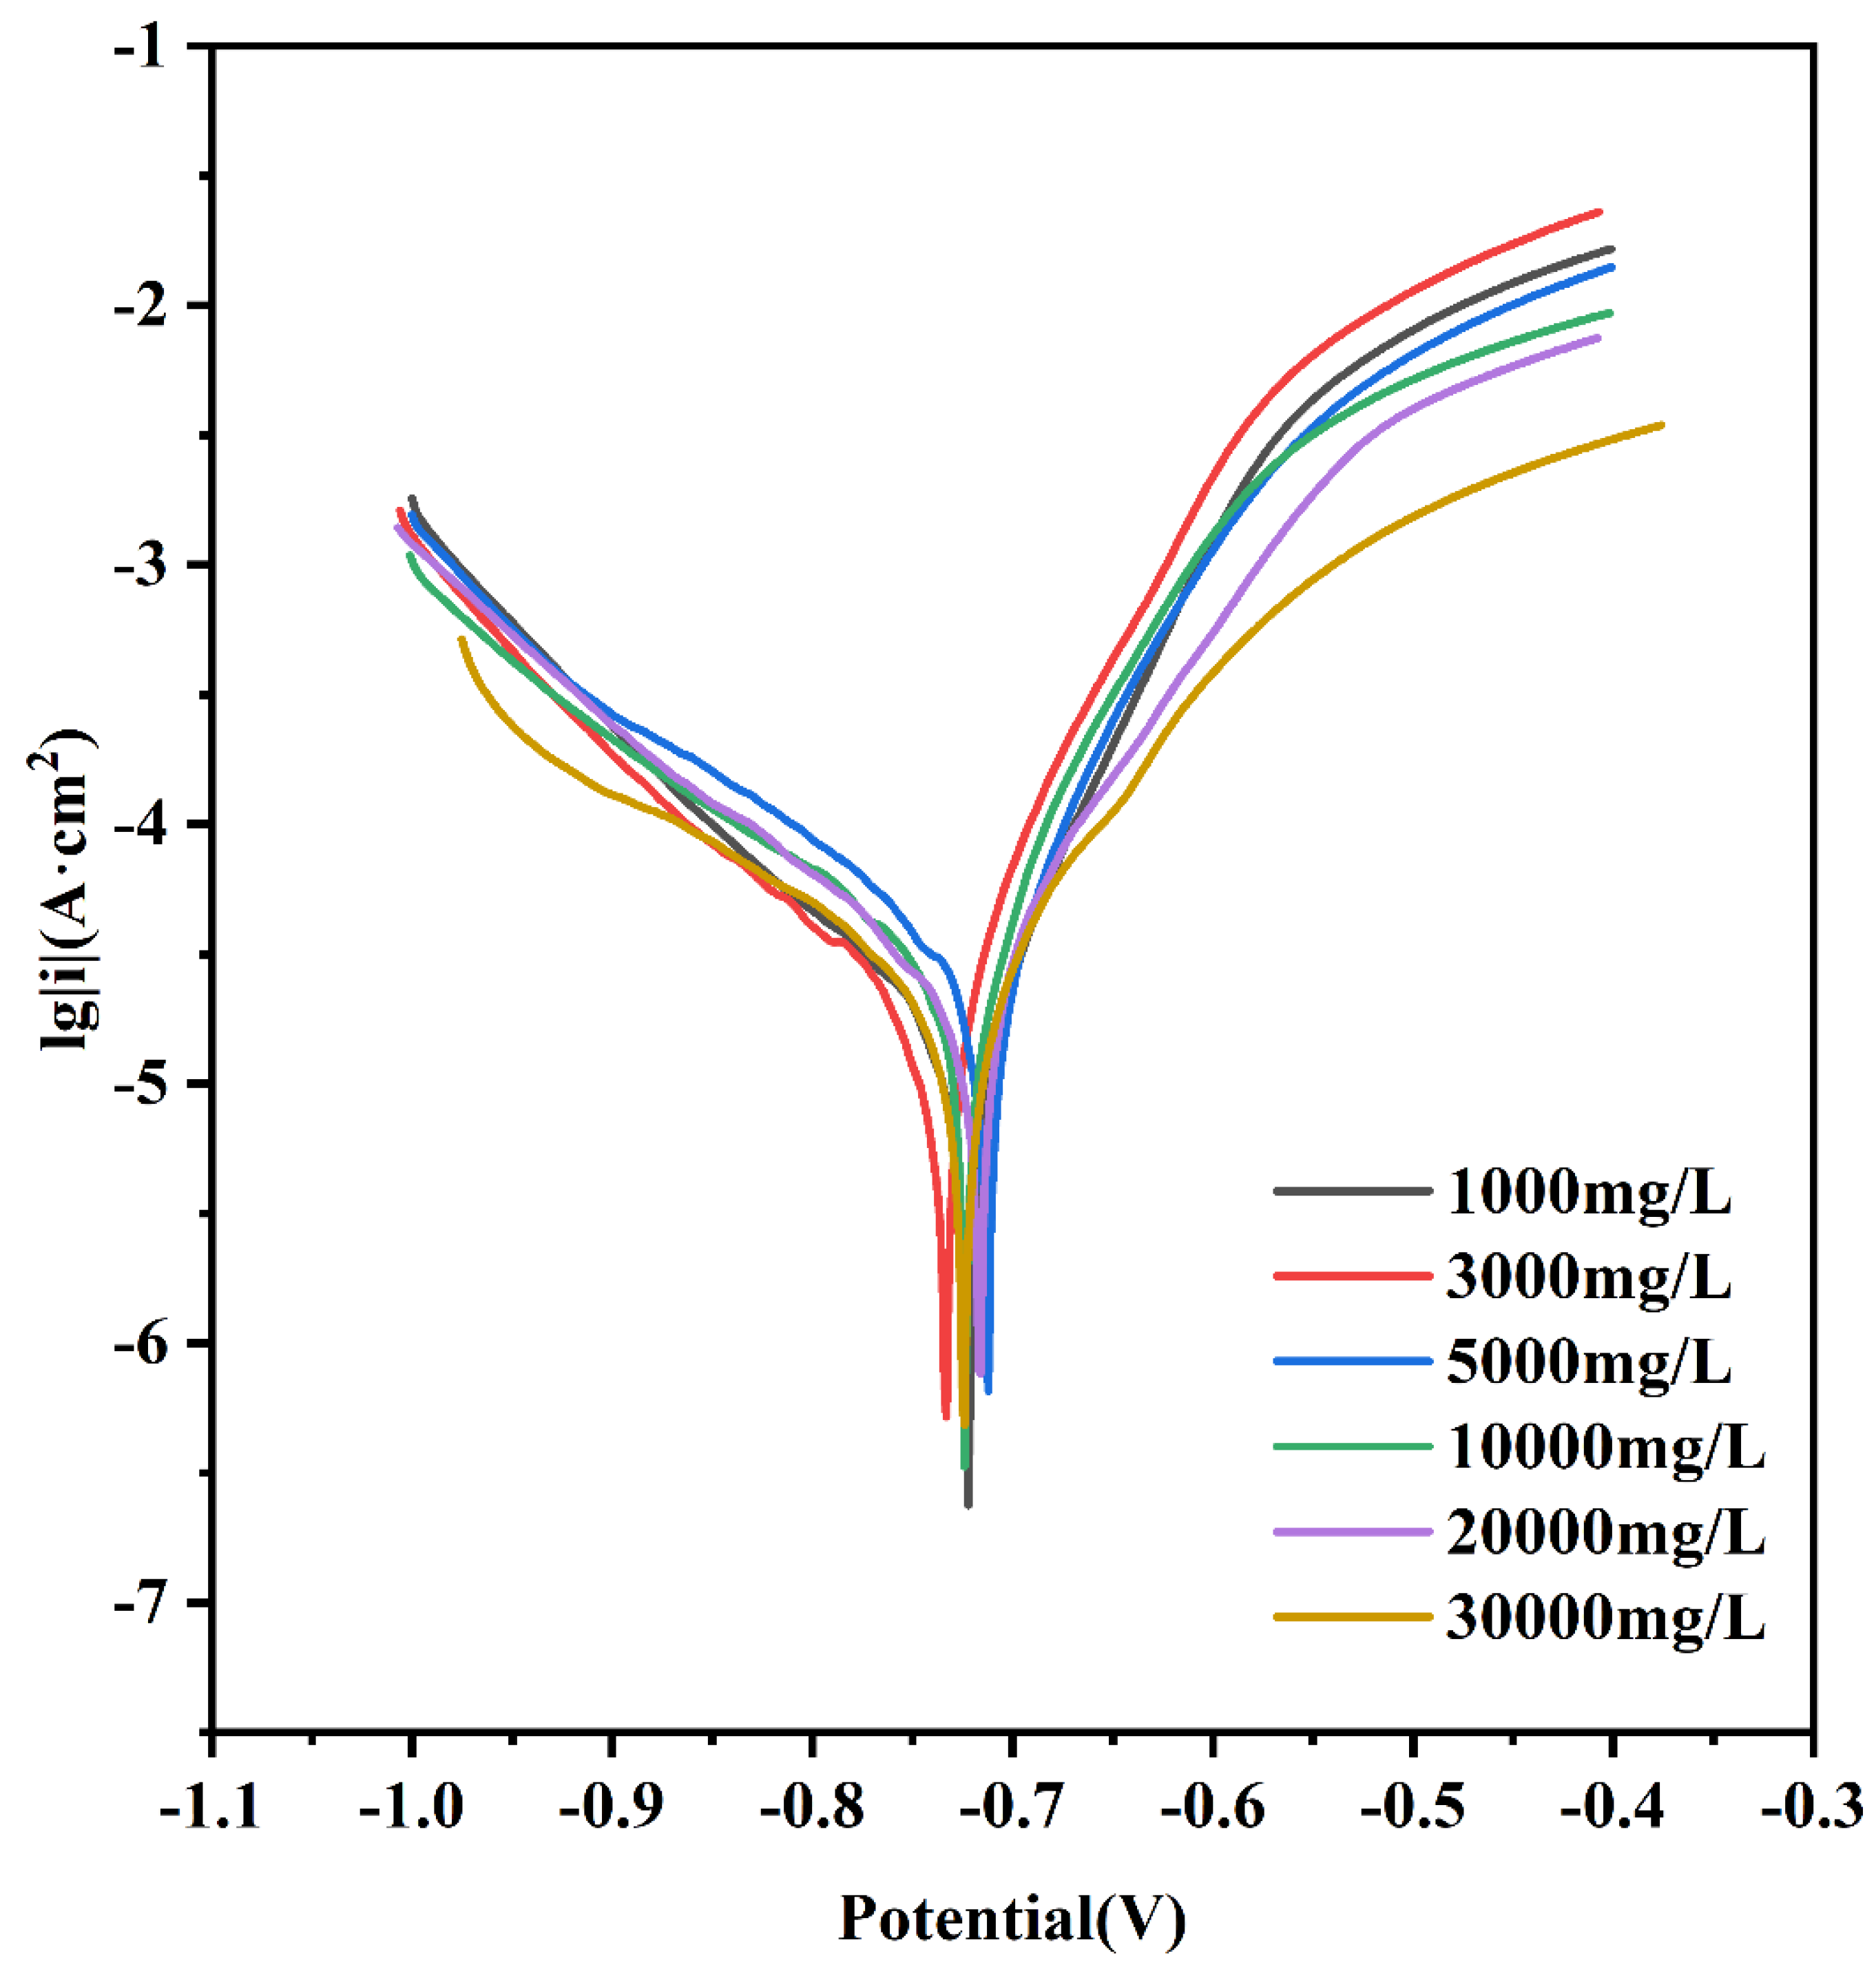
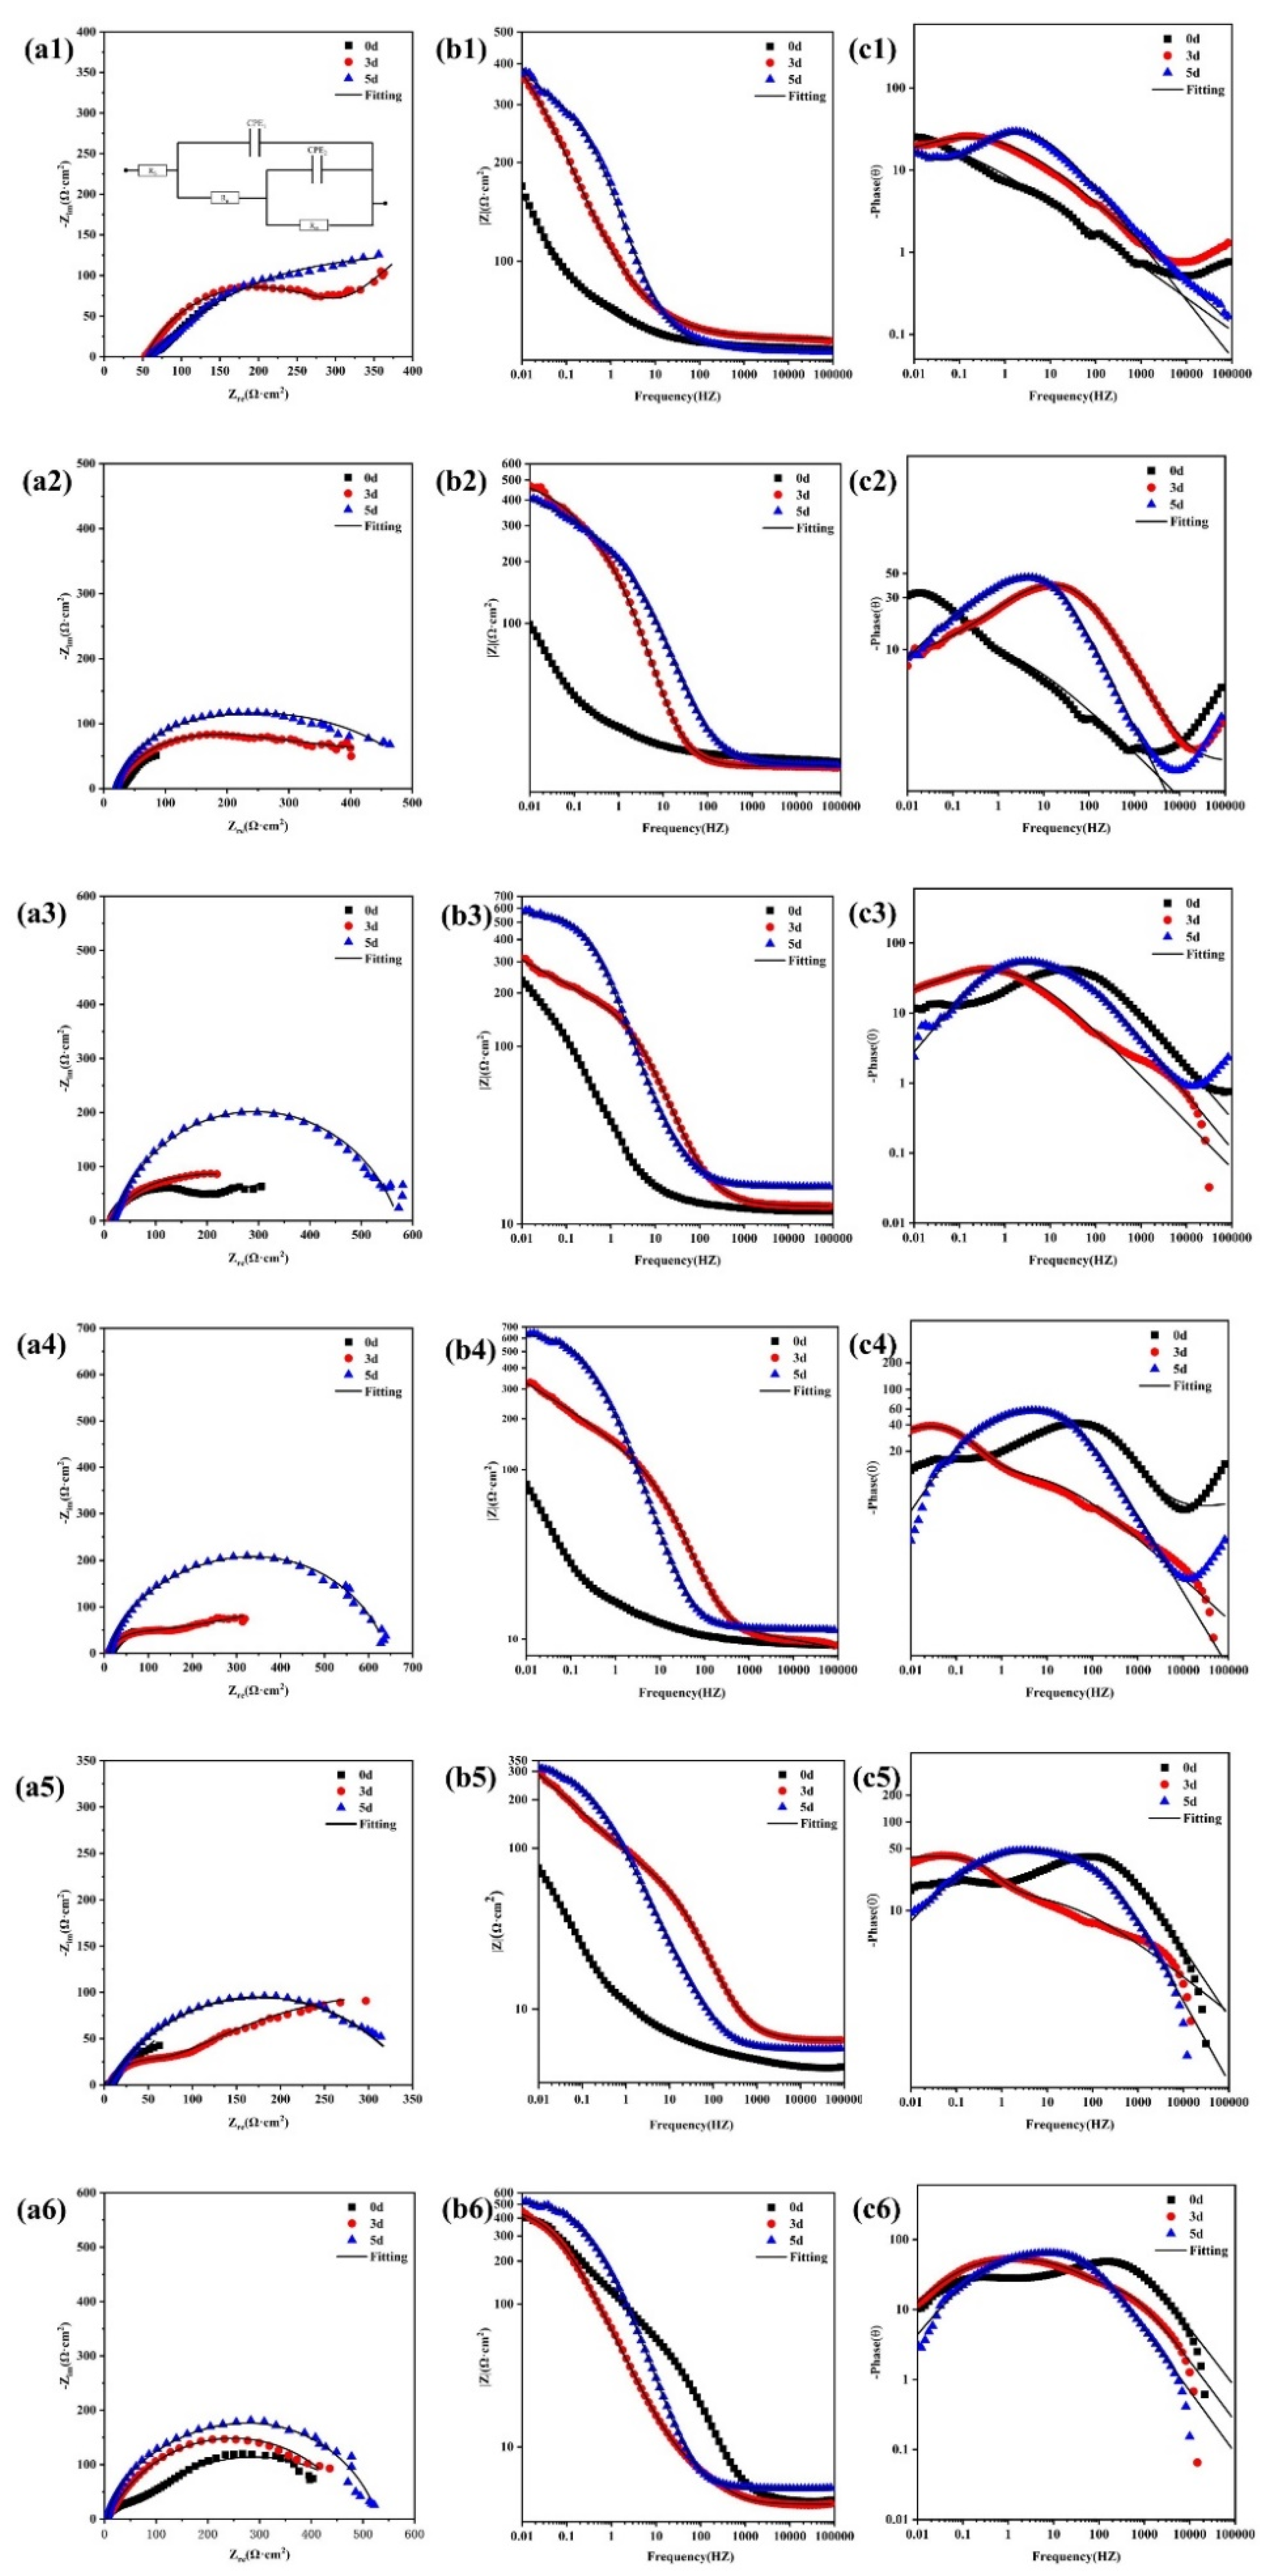
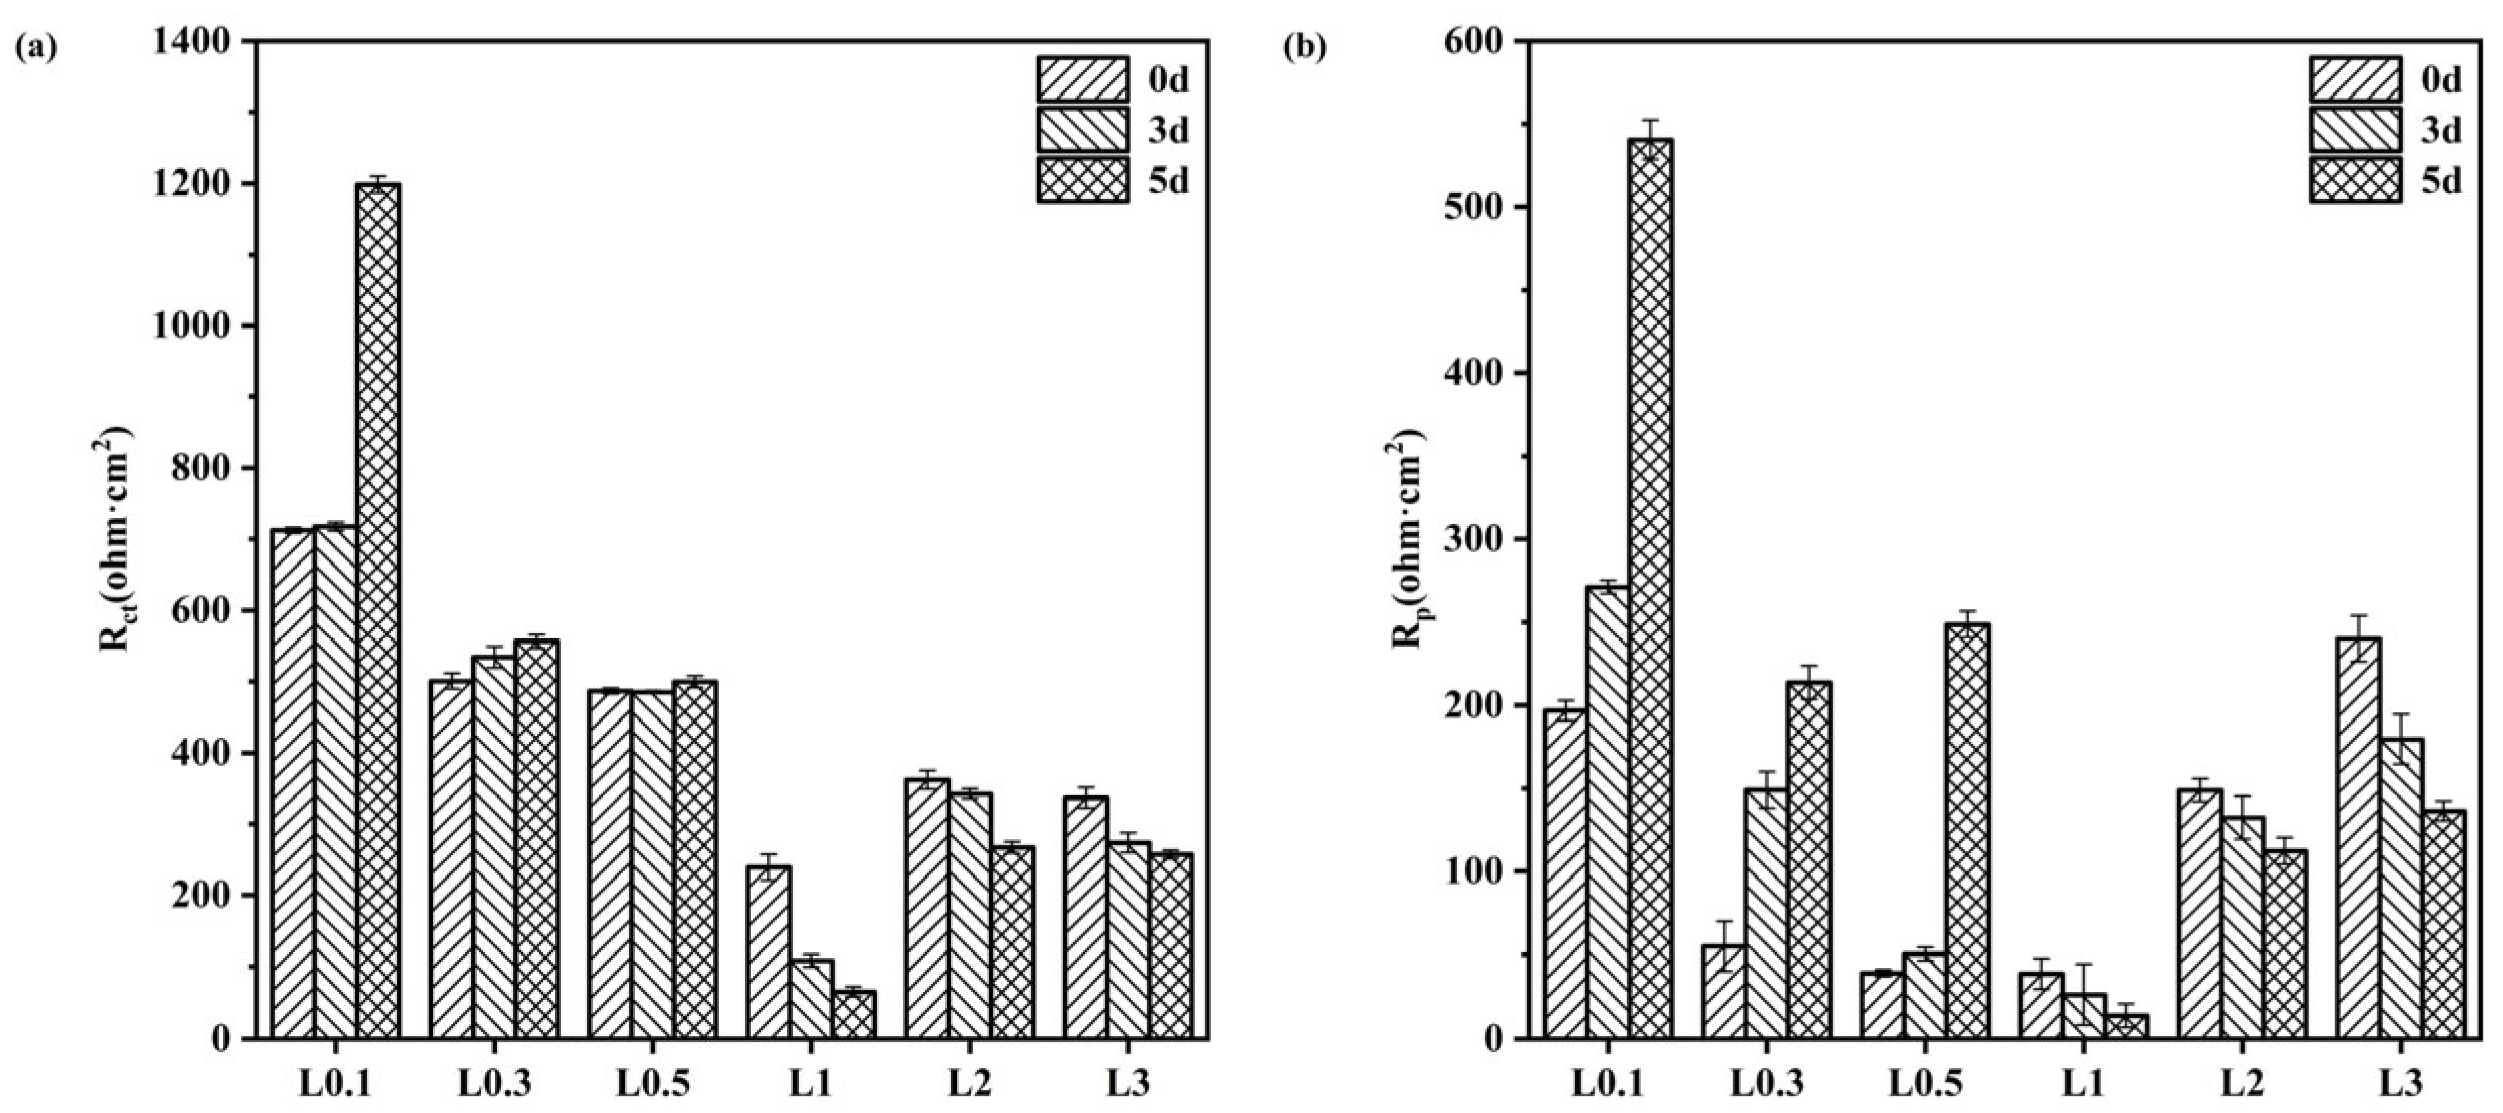
3.2.3. Electrochemical Characteristics

To determine the electrochemical properties of Q235-A steel in solution, the kinetic potential polarization curves in L1–L3 solutions were measured according to the experimental method described above (Figure 7). These curves show that the effect of solution concentration on the self-corrosion potential is not obvious, but L0.1 exhibits the lowest current density, which is related to the least amount of Cl in the solution, while L1 has the maximum current density, which decreases slightly as the concentration increases. This indicates that as the concentration increases, the reaction is inhibited and becomes more difficult. This is related to the decrease of O content in the solution and is consistent with the results obtained from the weight loss experiments. The corrosion potential and current density in each solution during the polarization test are shown in Table 2.
Figure 8 shows the EIS results for Q235-A steel after 0 d, 3 d, and 5 d of corrosion in L0.1–L3 solutions, where a1-a6 are Nernst plots, b1–b6 are Bode absolute value plots, and c1–c6 are Bode phase angle plots. Table 3 shows the fitted results, and the Nyquist curve for Q235-A steel consists of an impedance arc. The Bode phase diagram shows two overlapping time constants: one represents the nature of the corrosion product film in the high-frequency region and the other time constant reacts with the charge transfer reaction at the film-electrolyte interface in the low-frequency region [37,38]. Based on the above analysis, the EIS curve was fitted with the equivalent circuit shown in Figure 8(a1) [39,40]. The equivalent circuit comprises two time constants, where Rs represents the solution resistance; Qf represents the resistance of the corrosion product membrane; Rpore represents the pore-solution resistance of the membrane; Qdl represents a dual electrode layer aconstant phase angle element; and Rct represents the charge transfer resistance [41,42,43]. The values of Rct and Rpore for Q235-A steel in the L0.1–L3 solution are shown in Figure 9. The values of Rct and Rpore for Q235-A steel in L0.1–L3 solution are shown in Figure 9. L0.5 solution gradually increases, indicating that at low concentrations with time at Rct and Rpore, both increase with time and its corrosion product film becomes denser, thus resistance is greater. And L1–L3 solution gradually decreases, indicating that at higher concentrations, with the increase of time, its corrosion product film becomes less dense resistant. At L1, Rct and Rpore are the smallest. As Cl concentration increases, the corrosion product film protection of the substrate is same as the results of the hanging experiments with the trend of rising first and then declining.

4. Conclusions

From the results, corrosion with the extension of time in 5 d is gradually stable, in line with the corrosion mechanism that is free corrosion stage, corrosion control stage and stable corrosion stage. Free corrosion stage. In the initial stage of the metal surface in the activation state, the corrosion rate is very large, and shows an upward trend. The rust layer will be involved in the corrosion process, so this stage will not last long. Corrosion control stage. This stage is mainly due to the rust layer in the corrosion process from accelerated corrosion inhibiting the function of corrosion conversion, thus causing the corrosion rate reduction of the non-linear process. This process is quite complex, and there are many related theories (passivation film theory, microcell theory, etc.) to explain the role of the rust layer in the corrosion process. Stable corrosion stage. The corrosion rate eventually stabilizes the process. The function of the rust layer in the corrosion process has been determined, and the ultimate diffusion rate of dissolved oxygen in solution becomes the decisive factor affecting the corrosion rate. If other factors remain constant, corrosion will be carried out at this rate until the metal surface area changes dramatically.
With the increase of Cl concentration, the corrosion rate shows a trend of increasing and then decreasing, which in Cl concentration less than 10,000 mg/L, with the increase of Cl concentration, the corrosion rate increases, while in Cl concentration higher than 10,000 mg/L, the corrosion rate shows a decreasing trend; this is because with the increase of Cl concentration, O content will be reduced, thus hindering the corrosion process. In this paper, the corrosion mechanism of different concentrations of Cl in desulfurization wastewater on the slag-raking machine shell material was analyzed, and there is an inhibition efficiency relationship between its corrosion products and Cl concentration [44].
It is well known that Cl destroys the denseness of corrosion product films in tropical marine atmospheres with a higher Cl concentration, leading to the loosening of corrosion product films on steel surfaces [45]. The porosity of corrosion product films is determined by the size of FeOOH particles [46]. The pores between particles are positively correlated with FeOOH particles, and the nucleation and growth rate of FeOOH determines the size of FeOOH particles. The O content in the solution is negatively correlated with the Cl concentration, with the decrease of O content in the solution. Additionally, with the increase of Cl concentration, the decrease of other oxide content in the solution, due to anoxia, leads to the decrease of FeOOH nucleation sites, which makes the larger FeOOH generated in the corrosion product film. At lower concentrations, with the further increase of O concentration, more Fe3O4 is generated in the corrosion product, which makes the corrosion product film dense.
From the existing studies [47,48], it is known that, thermodynamically, the standard Gibbs free energy ΔGfθ of FeOOH (e.g., ΔGfθ = −495.748 kJ/mol for pinite α-FeOOH and ΔGfθ = −470.25 kJ/mol for fibrous iron ore γ-FeOOH) is higher than that of Fe3O4. ΔGfθ = −822.16 kJ/mol is higher [49]. Coupled with the fact that the experimental environment is liquid, it can be assumed that the Fe3O4 content becomes relatively high due to the difficulty of dehydrating the generated FeOOH to Fe2O3, which is then more easily transformed to Fe3O4, or due to the much more complicated process of transforming Fe2+ to FeOOH, resulting in the easy binding of Fe2+ to FeOOH on the desorbed surface of the specimen.
Combined with Figure 8 and Figure 9, it can be seen that at lower concentrations of corrosion products, film Rct and Rp increase with time and become larger, indicating that the corrosion film gradually completes with time, but at higher concentrations; Rct and Rp decrease with time, indicating that the denseness of its corrosion film becomes poor. In L1 solution, Q235-A steel Rct and Rp are the smallest, combined with its corrosion products film interface diagram L1 when its corrosion rate reaches its highest. This further proves that, with the increase of Cl concentration, the solution of dissolved O decreases, which will lead to the redox reaction being more difficult to carry out. The original O position in the corrosion product film is occupied by Cl, making the structure of the corrosion product film become loose, thus exhibiting cracks of various sizes.
Corrosion products are α-FeOOH and Fe3O4 and a small amount of γ-FeOOH and Fe2O3; the corrosion mechanism under alkaline environment can be known from the following formula [50,51,52]:
Fe − 2e = Fe2+
Fe2+ + OH = Fe(OH)2
Fe(OH)2 + O2 = FeOOH
FeOOH + Fe2+ = Fe3O4
F e O O H D e h y d r a t i o n F e 2 O 3

Author Contributions

Software, S.W., D.H.; Validation, J.B.; Formal analysis, J.B., D.H.; Investigation, J.B., X.M., J.N. and A.D.; Resources, J.Z. and D.S.; Data curation, Y.Y., D.S. and J.L.; Writing—original draft, J.B. and J.L.; Writing—review & editing, J.B. and Y.F.; Supervision, D.H., A.D., D.S. and J.L.; Project administration, Y.F.; Funding acquisition, Y.F. All authors have read and agreed to the published version of the manuscript.

Funding

This work was supported by the Hebei Province Science and Technology Support Program (grant number 19274009D), National Natural Science Foundation of China (grant number 51601056), and Natural Science Foundation of Hebei Province of China (grant number E2017202012).

Institutional Review Board Statement

Not applicable.

Informed Consent Statement

Not applicable.

Data Availability Statement

Data cannot be disclosed due to privacy requirements.

Conflicts of Interest

The authors declare no conflict of interest.

References

  1. An, W.H.; Zhao, J.; Lu, J.G.; Han, Y.; Li, D. Zero-liquid discharge technologies for desulfurization wastewater: A review. J. Environ. Manag. 2022, 321, 115953. [Google Scholar] [CrossRef] [PubMed]
  2. Zhou, Z.; Lu, J.; Feng, Q. Review on occurrence, speciation, transition and fate of sulfur in typical ultra-low emission coal-fired power plants. J. Acad. Nutr. Diet. 2022, 100, 259–276. [Google Scholar] [CrossRef]
  3. Xin, Y.; Zhou, Z.; Ming, Q.; Sun, D.; Han, J.; Ye, X.; Dai, S.; Jiang, L.-M.; Zhao, X.; An, Y. A two-stage desalination process for zero liquid discharge of flue gas desulfurization wastewater by chloride precipitation. J. Hazard. Mater. 2020, 397, 122744. [Google Scholar] [CrossRef]
  4. Izadi, R.; Assarian, D.; Altaee, A.; Mahinroosta, M. Investigation of methods for fuel desulfurization wastewater treatment. Chem. Eng. Res. Des. 2023, 190, 198–219. [Google Scholar] [CrossRef]
  5. Liu, Y.Z.; Shi, P.Y.; Jiang, M.F. Hydrothermal recovery and reuse of oxidated by-products in magnesium flue gas desulfurization: Experimental studies and molecular dynamics simulation. J. Environ. Chem. Eng. 2022, 10, 108099. [Google Scholar] [CrossRef]
  6. Koralegedara, N.H.; Pinto, P.X.; Dionysiou, D.D.; Al-Abed, S.R. Recent advances in flue gas desulfurization gypsum processes and applications—A review. J. Environ. Manag. 2019, 251, 109572. [Google Scholar] [CrossRef] [PubMed]
  7. Wang, Y.W. Research and application of power plant desulfurization wastewater reuse to wet slag collector. Low Carbon World 2018, 11, 64–65. [Google Scholar] [CrossRef]
  8. Liu, Y.Y.; Chen, J.F.; Tang, M.Z.; Jia, C.X.; Zhang, C. Optimization for desulfurization wastewater pretreatment in a typical coal-fired thermal power plant. J. Qufu. Nor. Univ. (Nat. Sci.) 2019. [Google Scholar] [CrossRef]
  9. Du, M.; Shao, N.; Jiang, Y.S. Analysis on feasible technology about wastewater treatment and desulfurization wastewater zero discharge in thermal power plant. Shanxi Archit. 2019, 45, 189–190. [Google Scholar] [CrossRef]
  10. Wang, N.J.; Wei, W.J.; Zhang, B.H.; Sun, H.; Li, J.F.; Chen, Q.; Cheng, G. Feasibility analysis of zero discharge reform scheme of desulfurization wastewater in thermal power plant based on flue gas evaporation technology. Liaoning Chem. Ind. 2019, 48, 1209–1211. [Google Scholar] [CrossRef]
  11. Zheng, L.B.; Wei, Y.S.; Jiao, Y.Y.; Wang, G.; Yue, Z.G. Status and prospect of zero liquid discharge technologies for flue gas desulfurization wastewater in thermal power plant. Chem. Ind. Eng. 2019, 36, 24–37. [Google Scholar] [CrossRef]
  12. Zhang, J.H.; Chi, Y.F.; Zou, Y.J.; Wang, B.H.; Zhang, J.Y.; Zheng, Y.M. Status and outlook of engineering applications of desulfurization wastewater treatment technology for coal-fired power plants. Ind. Water Treat. 2020. [Google Scholar] [CrossRef]
  13. Chen, B.; Xu, C.; Zhao, Q.; Fu, Y.Q. Experimental study of flue gas desulfurization wastewater discharge into slag water treatment system. Zhejiang Electr. Power 2010, 29, 33–36+54. [Google Scholar] [CrossRef]
  14. Zou, Y.J. Application and impact analysis of sludge water system to achieve zero discharge of desulfurization wastewater. J. Environ. Sci. 2022, 41, 49–52. [Google Scholar] [CrossRef]
  15. Motte, R.D.; Basilico, E.; Mingant, R.; Kittel, J.; Francois, R.; Combrade, P. A study by electrochemical impedance spectroscopy and surface analysis of corrosion product layers formed during CO2 corrosion of low alloy steel. Corros. Sci. 2020, 172, 108666. [Google Scholar] [CrossRef]
  16. Mundhenk, N.; Carrero, S.; Knauss, K.G.; Wonneberger, R.; Wu, Y. Kinetic and thermodynamic analysis of high-temperature CO2 corrosion of carbon steel in simulated geothermal NaCl fluids. Corros. Sci. 2020, 171, 108597. [Google Scholar] [CrossRef]
  17. He, C.C.; Xu, L.; Chen, L.; Xu, X.F.; OuYang, P.W. Mechanism prediction of flow-induced corrosion and optimization of protection measures in overhead system of atmospheric tower. Chem. Eng. J. 2019, 70, 1027–1034. [Google Scholar] [CrossRef]
  18. Marian, B.; Kellenberger, A.; Millet, J.P.; Muntean, C.; Vaszilcsin, N. Corrosion resistance of carbon steel in weak acid solutions in the presence of l-histidine as corrosion inhibitor. Corros. Sci. 2013, 69, 389–395. [Google Scholar] [CrossRef]
  19. Kadowaki, M.; Muto, I.; Sugawara, Y.; Doi, T.; Kawano, K.; Hara, N. Real-time microelectrochemical observations of very early stage pitting on ferrite-pearlite steel in chloride solutions. J. Electrochem. Soc. 2017, 164, C261–C268. [Google Scholar] [CrossRef] [Green Version]
  20. Kadowaki, M.; Muto, I.; Sugawara, Y.; Hara, N. Beneficial role of retained austenite in pitting corrosion resistance of Fe-C-Si-Mn steel in chloride environments. Corros. Sci. 2022, 200, 110251. [Google Scholar] [CrossRef]
  21. Feng, W.G.; Wei, R.Z.; Wang, S.; Yang, X.Q.; Wei, W.F.; Liu, Z.Z. Study on corrosion behavior and corrosion mechanism of carbon steel in cooling water of hydroelectric power plants. Mater. Protect. 2022, 55, 119–127. [Google Scholar] [CrossRef]
  22. Lin, X.F.; Zhong, T.D.; Tong, X.H.; Chen, G.Y.; Zhang, J.R.; Zheng, Y.M. Effect of desulfurization wastewater on slag water system corrosion. J. Environ. Eng. 2021, 15, 350–359. [Google Scholar] [CrossRef]
  23. Deng, J.Y.; Xiao, X.M.; Li, Y.Y.; Liu, J.Y. Low-carbon nitrogen removal from power plants circulating cooling water and municipal wastewater by partial denitrification-anammox. Bioresour. Technol. 2023, 380, 129071. [Google Scholar] [CrossRef] [PubMed]
  24. Feng, L.J.; Zhai, R.R.; Guo, Y.C. Water consumption of the integration of coal-fired power plant with CO2 post combustion system with different cooling methods. Int. J. Greenh. Gas. Con. 2022, 121, 103776. [Google Scholar] [CrossRef]
  25. Zhang, Z.; Zhou, M.; Yuan, B.; Guo, Z.; Wu, Z.Y.; Li, G.Y. Multipath retrofit planning approach for coal-fired power plants in low-carbon power system transitions: Shanxi Province case in China. Energy 2023, 275, 127502. [Google Scholar] [CrossRef]
  26. Fu, Y.; Wang, L.Y.; Liu, M.; Wang, J.S.; Yan, J.J. Performance analysis of coal-fired power plants integrated with carbon capture system under load-cycling operation conditions. Energy 2023, 276, 127532. [Google Scholar] [CrossRef]
  27. Yuan, Q.X.; Zhang, Y.X.; Wang, T.; Wang, J.W.; Romero, C.E. Mechanochemical stabilization of heavy metals in fly ash from coal-fired power plants via dry milling and wet milling. Waste Manag. 2021, 135, 428–436. [Google Scholar] [CrossRef]
  28. Chen, H.; Wang, Y.H.; An, L.M.; Xu, G.; Zhu, X. Performance evaluation of a novel design for the waste heat recovery of a cement plant incorporating a coal-fired power plant. Energy 2022, 246, 123420. [Google Scholar] [CrossRef]
  29. Kondash, A.J.; Albright, E.; Vengosh, A. Quantity of flowback and produced waters from unconventional oil and gas exploration. Sci. Total. Environ. 2017, 574, 314–321. [Google Scholar] [CrossRef] [Green Version]
  30. Boschee, P. Produced and flowback water recycling and reuse: Economics, limitations, and technology. Oil Gas Fac. 2014, 3, 16–21. [Google Scholar] [CrossRef]
  31. Onishi, V.C.; Carrero-Parreño, A.; Reyes-Labarta, J.A.; Ruiz-Femenia, R.; Salcedo-Díaz, R.; Fraga, E.S. LabaShale gas flowback water desalination: Single vs multiple-effect evaporation with vapor recompression cycle and thermal integration. Desalination 2017, 404, 230–248. [Google Scholar] [CrossRef]
  32. Zolfaghari, A.; Dehghanpour, H.; Noel, M.; Bearinger, D. Laboratory and field analysis of flowback water from gas shales. J. Unconv. Oil Gas Resour. 2016, 14, 113–127. [Google Scholar] [CrossRef]
  33. Rodrigues, R.T.; Rubio, J. DAF-dissolved air flotation: Potential applications in the mining and mineral processing industry. Int. J. Miner. Process. 2007, 82, 1–13. [Google Scholar] [CrossRef]
  34. Chen, L.; Wang, Y.J.; Yao, M.Y.; Zhou, Y. Corrosion kinetics and corrosion mechanisms of BN–ZrO2–SiC composites in molten steel. Corros. Sci. 2014, 89, 93–100. [Google Scholar] [CrossRef]
  35. Zhao, Y.G.; Liu, W.; Fan, Y.M.; Fan, E.D.; Dong, B.J.; Zhang, T.Y. Effect of cr content on the passivation behavior of cr alloy steel in a CO2 aqueous environment containing silty sand. Corros. Sci. 2020, 168, 108591. [Google Scholar] [CrossRef]
  36. Renner, F.U.; Ankah, G.N.; Bashir, A.; Ma, D.; Biedermann, P.U.; Shrestha, B.R.; Nellessen, M.; Khorashadizadeh, A.; Losada-Pérez, P.; Duarte, M.J.; et al. Star-Shaped Crystallographic Cracking of Localized Nanoporous Defects. Adv. Mater. 2015, 27, 4877–4882. [Google Scholar] [CrossRef]
  37. Yu, Q.; Dong, W.; Yang, X.Y.; Wang, Q.F.; Zhang, F.C. Insights into the corrosion mechanism and electrochemical properties of the rust layer evolution for weathering steel with various cl deposition in the simulated atmosphere. Mater. Res. Express. 2021, 8, 036515. [Google Scholar] [CrossRef]
  38. Nishikata, A.; Zhu, Q.J.; Tada, E. Long-term monitoring of atmospheric corrosion at weathering steel bridges by an electrochemical impedance method. Corros. Sci. 2014, 87, 80–88. [Google Scholar] [CrossRef]
  39. Dong, B.J.; Liu, W.; Chen, L.J.; Zhang, T.Y.; Fan, Y.Y.; Zhao, Y.Y.; Li, S.; Yang, W.; Banthukul, W. Optimize Ni, Cu, Mo element of low Cr-steel rebars in tropical marine atmosphere environment through two years of corrosion monitoring. Cem. Concr. Compos. 2022, 125, 104317. [Google Scholar] [CrossRef]
  40. Guo, X.Y.; Kang, J.F.; Zhu, J.S.; Duan, M.H. Corrosion behavior and mechanical property degradation of weathering steel in marine atmosphere. J. Mater. Civil. Eng. 2019, 31, 04019181. [Google Scholar] [CrossRef]
  41. Gao, X.L.; Han, Y.; Fu, G.Q.; Zhu, M.Y.; Zhang, X.Z. Evolution of the rust layers formed on carbon and weathering steels in environment containing chloride ions. Acta. Metall. 2016, 29, 1025–1036. [Google Scholar] [CrossRef] [Green Version]
  42. Fan, Y.M.; Liu, W.; Li, S.M.; Wongpat, B.; Zhao, Y.G.; Dong, B.J. Evolution of rust layers on carbon steel and weathering steel in high humidity and heat marine atmospheric corrosion. J. Mater. Sci. Technol. 2020, 39, 190–199. [Google Scholar] [CrossRef]
  43. Fu, J.D.; Wan, S.; Yang, Y.; Su, Q.; Han, W.W.; Zhu, Y.B. Accelerated corrosion behavior of weathering steel Q345qDNH for bridge in industrial atmosphere. Constr. Build. Mater. 2021, 306, 124864. [Google Scholar] [CrossRef]
  44. Kokalj, A.; Lozinek, M.; Kapun, B.; Taheri, P.; Neupane, S.; Losada-Pérez, P.; Xie, C.; Stavber, S.; Crespo, D.; Renner, F.U.; et al. Simplistic correlations between molecular electronic properties and inhibition efficiencies: Do they really exist? Corros. Sci. 2021, 179, 108856. [Google Scholar] [CrossRef]
  45. Kamimura, T.; Kashima, K.; Sugae, K.; Miyuki, H.; Kudo, T. The role of chloride ion on the atmospheric corrosion of steel and corrosion resistance of Sn-bearing steel. Corros. Sci. 2012, 62, 34–41. [Google Scholar] [CrossRef]
  46. Hai, C.; Wang, Z.; Lu, F.Y.; Zhang, S.P.; Du, C.W.; Cheng, X.Q. Analysis of corrosion evolution in carbon steel in the subtropical atmospheric environment of sichuan. J. Mater. Eng. Perform. 2021, 30, 8014–8022. [Google Scholar] [CrossRef]
  47. Asami, K.; Kikuchi, M. In-depth distribution of rusts on a plain carbon steel and weathering steels exposed to coastal–industrial atmosphere for 17 years. Corros. Sci. 2003, 45, 2671–2688. [Google Scholar] [CrossRef]
  48. Weissenrieder, J.; Leygraf, C. In situ studies of filiform corrosion of iron. J. Electrochem. Soc. 2004, 151, B165–B171. [Google Scholar] [CrossRef]
  49. Nie, X.H.; Li, Y.L.; Li, J.K.; Zhang, H.B. Morphology, products and corrosion mechanism analysis of Q235 carbon steel in sea-shore salty soil. J. Mater. Eng. Perform. 2010, 30, 24–28+33. [Google Scholar] [CrossRef]
  50. Gerwin, W.; Baumhauer, R. Effect of soil parameters on the corrosion of archaeological metal finds. Geoderma 2000, 96, 63–80. [Google Scholar] [CrossRef]
  51. Tamura, H. The role of rusts in corrosion and corrosion protection of iron and steel. Corros. Sci. 2008, 50, 1872–1883. [Google Scholar] [CrossRef] [Green Version]
  52. Yan, M.C.; Sun, C.; Xu, J.; Dong, J.H.; Ke, W. Role of fe oxides in corrosion of pipeline steel in a red clay soil. Corros. Sci. 2014, 80, 309–317. [Google Scholar] [CrossRef]
Figure 1. Schematic diagram of electrochemical test.
Materials 16 05270 g001
Figure 2. Weight loss rate curve with time.
Materials 16 05270 g002
Figure 3. Weight loss rate of Q235-A in different Cl concentrations of FGD wastewater solution.
Materials 16 05270 g003
Figure 4. XRD results of corrosion product film of Q235-A steel.
Materials 16 05270 g004
Figure 5. Microscopic morphology of Q235-A after 5 d corrosion in L0.1–L3 solution (a) L0.1, (b) L0.3, (c) L0.5, (d) L1, (e) L2, (f) L3.
Materials 16 05270 g005
Figure 6. Cross-sectional morphology of Q235-A after 5 d corrosion in L0.1–L3 solution (a) L0.1, (b) L0.3, (c) L0.5, (d) L1, (e) L2, (f) L3.
Materials 16 05270 g006
Figure 7. Dynamic potential polarization curve of Q235-A steel in L0.1–L3 solutio.
Materials 16 05270 g007
Figure 8. EIS results for Q235-A steel in L0.1–L3 solution with corrosion product film:L0.1 (a1c1),L0.3 (a2c2), L0.5 (a3c3), L1 (a4c4), L2 (a5c5), L3 (a6c6).
Materials 16 05270 g008
Figure 9. Rct (a) and Rp (b) of corrosion product film of Q235-A steel in L0.1–L3 solution.
Materials 16 05270 g009
Table 1. Water quality of desulfurization wastewater.
ProjectsNumerical Value
pH6.53
Conductivity, μS/cm36,200
Turbidity, NTU24.3
Tlkalinity, mmol/L10.51
Stiffness, mmol/L258.00
1/2Ca2+39.80
1/2Mg2+218.20
Table 2. Electrochemical parameters of Q235-A steel in L0.1–L3.
LableIcorr (A/cm2)Ecorr (A/cm2)
L0.1 1.750   × 10−5−0.7226
L0.3 2.497   × 10−5−0.7339
L0.5 3.993   × 10−5−0.7138
L1 3.897   × 10−5−0.7256
L2 3.614   × 10−5−0.7184
L3 2.497   × 10−5−0.7252
Table 3. Electrochemical parameters of the fitted corrosion product film.
Solution
(×103 mg/L)
Time
(d)
Rs
(Ω·cm2)
CPE110−4
−1 cm−2S−n)
n1Rp
(Ω·cm2)
CPE210−4
−1 cm−2S−n)
n2Rct
(Ω·cm2)
10000
3
5
53.66
54.63
58.00
26.61
16.10
7.559
0.3998
0.6985
0.5055
196.8
271.2
540.4
266.1
502.6
105.32
0.7391
0.6977
1.000
712
717.4
1198
30000
3
5
19.21
21.51
19.95
3.275
5.564
3.864
0.7779
0.7567
0.7836
54.92
149.05
213.6
48.77
129.6
87.59
0.3768
0.3635
0.4189
500.1
533.8
556.1
50000
3
5
12.57
12.12
16.17
5.109
2.053
8.191
0.8690
0.8491
0.7851
38.86
50.22
248.6
36.61
38.00
31.45
0.6776
0.5417
0.9327
486.4
484.8
499.5
10,0000
3
5
8.643
9.286
11.42
3.320
4.146
9.929
0.4271
0.4200
0.6604
38.43
26.16
13.74
22.08
19.62
22.25
0.8950
0.9126
0.9893
239.0
108.9
64.97
20,0000
3
5
6.340
4.300
5.673
5.564
4.017
6.145
0.7567
0.9204
0.8225
149.0
132.3
112.3
129.6
26.90
25.88
0.3635
0.5988
0.7317
362.0
342.4
266.8
Solution
(×103 mg/L)
Time
(d)
Rs
(Ω·cm2)
CPE110−4
−1cm−2S−n)
n1Rp
(Ω·cm2)
CPE210−4
−1cm−2S−n)
n2Rct
(Ω·cm2)
30,0000
3
5
4.173
3.980
5.126
8.575
8.907
2.860
0.4747
0.8012
0.8903
240.1
179.6
136.3
43.93
25.08
19.62
0.5182
0.7259
0.9126
336.8
273.3
256.9
Disclaimer/Publisher’s Note: The statements, opinions and data contained in all publications are solely those of the individual author(s) and contributor(s) and not of MDPI and/or the editor(s). MDPI and/or the editor(s) disclaim responsibility for any injury to people or property resulting from any ideas, methods, instructions or products referred to in the content.

