Article

Study on the Influence of Surface Treatment Process on the Corrosion Resistance of Aluminum Alloy Profile Coating

1
School of Mechanical Electronic & Information Engineering, China University of Mining & Technology (Beijing), Beijing 100083, China
2
Key Laboratory of Coal Mine Intelligence and Robot Innovation and Application of Emergency Ministry, Beijing 100083, China
3
Fine Chemicals Group Co., Ltd., Taizhou 318020, China
4
National Nonferrous Metals and Electronic Materials Analysis and Testing Center, Guobiao (Beijing) Inspection and Certification Co., Ltd., Beijing 101407, China
*
Authors to whom correspondence should be addressed.
Materials 2023, 16(17), 6027; https://doi.org/10.3390/ma16176027
Submission received: 13 July 2023 / Revised: 23 August 2023 / Accepted: 25 August 2023 / Published: 1 September 2023

Abstract

:
This work focuses on different surface treatment processes of the 6061 aluminum alloy profile coatings in the construction industry, mainly including the sand powder film coating, the flat powder coating, the hard anodized film, and the ordinary heat-sealing oxidized coating. The corrosion resistance of the coated aluminum alloy in a 3.5 wt.% NaCl solution (pH 6.5–7.5) and the influence of different surface treatment processes on the corrosion resistance of different samples were studied by scanning electron microscope (SEM) and electrochemical workstation. The result shows that with the increase in corrosion time, the corrosion inhibition performance of the four coated aluminum alloy materials decreased significantly, and the order of decline is: sand powder film coating > hard anodized film > flat powder coating > ordinary heat-sealing oxidized coating. When corroded in a 3.5 wt.% NaCl solution for 2 h, the corrosion inhibition performances of the flat powder coating and ordinary heat-sealing oxidized coating are poor, while the inhibition performances of the sand powder film coating and hard anodized film are good, and the inhibition performance follows the following sequence: the sand powder film coating > hard anodized film> the flat powder coating > ordinary heat-sealing oxidized coating. When corroded in a 3.5 wt.% NaCl solution for 200 h, the corrosion inhibition performances of the sand powder film coating and the flat powder coating are poor, while the inhibition performances of hard anodized film and ordinary heat-sealing oxidized coating are good, and the inhibition performance follows the following sequence: hard anodized film > ordinary heat-sealing oxidized coating > the sand powder film coating > the flat powder coating.

1. Introduction

Aluminum alloys have the advantages of low density, high specific strength, excellent corrosion resistance, recyclability, and low cost. They are widely used in construction and other fields, as well as being ideal raw materials for profiles in the construction industry [1,2,3,4,5]. With the global warming issue, the occurrence of extreme weather and climate events is increasing and intensifying, especially for extreme events such as heavy rain and flooding, high temperatures, and heat waves. In this context, the frequent occurrence of extreme weather has become the new normal in China [6,7,8,9,10,11]. Therefore, higher requirements are put forward for the corrosion resistance of architectural aluminum alloy profiles. Faced with a market for aluminum alloy profiles that is becoming increasingly competitive, the way for businesses to advance is to reduce costs, enhance the manufacturing process, and continuously enhance the corrosion resistance, weather resistance, and wear resistance of the aluminum alloy profiles.
At present, the most widely used treatment methods on aluminum alloy surfaces are anodizing and powder coating [1,12,13,14]. Minhas Badar et al. [15] developed an active protective coating surface using the rapid leaching and strong barrier properties of the corrosion inhibitor combined with the anodized aluminum alloy 2024-T3, and electrochemical studies showed that the rapid and sufficient leaching of lithium led to a significant improvement in the corrosion resistance of scratch coatings. X. H. Lin et al. [16] used PEMHP (piezoelectric machine hammer peening) to study the surface modification of 6016 aluminum alloy anodizing film, including surface roughness, surface morphology, and hardness. It is found that peening parameters strongly influence surface integrity, especially line pitch. Badhotiya Gaurav Kumar et al. [17] prepared an alumina coating using oxime-modified aluminum (III) isopropanol as a sol-gel precursor. The mechanical properties of the bare, dip-coated, anodized, and coated anodized aluminum alloy samples were investigated by the slow strain rate test. It indicates that simply dip-coated surfaces have a higher ultimate tensile strength as compared with other samples. Kumar J. Jagadesh et al. [18] studied the tribological, corrosion, and mechanical properties of AISI 316L stainless steel without and with an Al2TiO5 surface coating. The results show that a twenty-fold reduction in wear rate is recorded with the coating of Al2TiO5 on the base material when compared with the uncoated counterpart. The wear rate has also decreased by 16% with the increase in coating thickness from 300 to 375 μm. The fatigue life of the coated specimens was reduced by around 12%, while their corrosion resistance increased by 20% when compared with the uncoated specimens. The Si3N4 ceramics were successfully fabricated by DLP technology using Si3N4 powder coated with Al2O3-Y2O3 sintering additives by Li Meng et al. [19].
However, there are many coating studies but less about aluminum alloys, and performance studies mainly focus on surface modification, tribology, and mechanical properties, with less research on corrosion. In addition, comparative studies between different surface treatment processes are rarely seen. In this work, the corrosion resistance of powder coatings and anodized films on the surfaces of aluminum alloy building profiles was studied [20,21,22,23,24,25,26,27,28]. Through the coupling analysis of microscopic observation and electrochemical fitting, scanning electron microscopy (SEM) and electrochemical analysis were used to investigate the corrosion behavior and corrosion resistance of the sand texture film layer, the flat powder film layer, the hard anodized, and the ordinary anodized heat-sealed hole aluminum alloy profiles in weakly corrosive electrolytes. This paper aims to compare the corrosion resistance of aluminum alloys in different surface treatment processes and provide a reference for enterprises to improve the process in the future.

2. Materials and Methods

2.1. Experimental Materials

The powder-coated aluminum alloy samples are as follows: sand powder coating (sample number 1#), flat powder coating (sample number 2#), hard anodizing film (sample number 3#), and ordinary anodized heat seal hole specimen (sample number 4#) are obtained from Guangdong Haomei New Material Co., Ltd. (Qingyuan, China). Sample dimensions 10 mm × 10 mm × 5 mm were cut from aluminum alloy for static immersion corrosion measurements. Samples of 10 mm × 10 mm × 5 mm were cut for electrochemical measurements. The samples were embedded in epoxyresin made of polytetrafluoroethylene, and a surface area of 1 cm2 was exposed. Before each experiment, the working electrode was mechanically abraded with emery paper beginning at 400 # to 3000 #, rinsed with double-distilled water, and dried in air.

2.2. Static Immersion Corrosion Experiment

The static immersion corrosion test was carried out in a 3.5 wt.% NaCl solution at 40 ± 1 °C for 2 h and 200 h of immersion (HH-ZKB constant temperature water bath). The surface morphology of the immersed samples was observed by scanning electron microscope (SEM, Hitachi, Tokyo, Japan, S-3400N) at an accelerating voltage of 15 KV and a beam current of 10 nA.

2.3. Electrochemical Testing

A conventional three-electrode electrochemical workstation (PARSTAT, Versa STAT 3F, AMETEK, Berwyn, PA, USA) was used for the electrochemical tests, applying different processed samples as the working electrode (WE), a platinum electrode as the counter electrode (CE), and a saturated Ag/AgCl electrode as the reference electrode (RE). The test solution was 3.5 wt.% NaCl solution. The open circuit potential (OCP) was recorded for 30 min until a steady state was observed, and the potentiodynamic polarization (PDP) test was performed in a potential range of ±500 mV (vs. OCP) at a sweep rate of 1 mV/s. The electrochemical impedance spectroscopy (EIS) test was performed under OCP with an AC frequency range of 100 kHz–10 MHz and a disturbance signal amplitude of 10 mV, and the impedance data were further analyzed and fitted using ZView2 software. The measurements were repeated three times to ensure reproducibility.

3. Results and Discussion

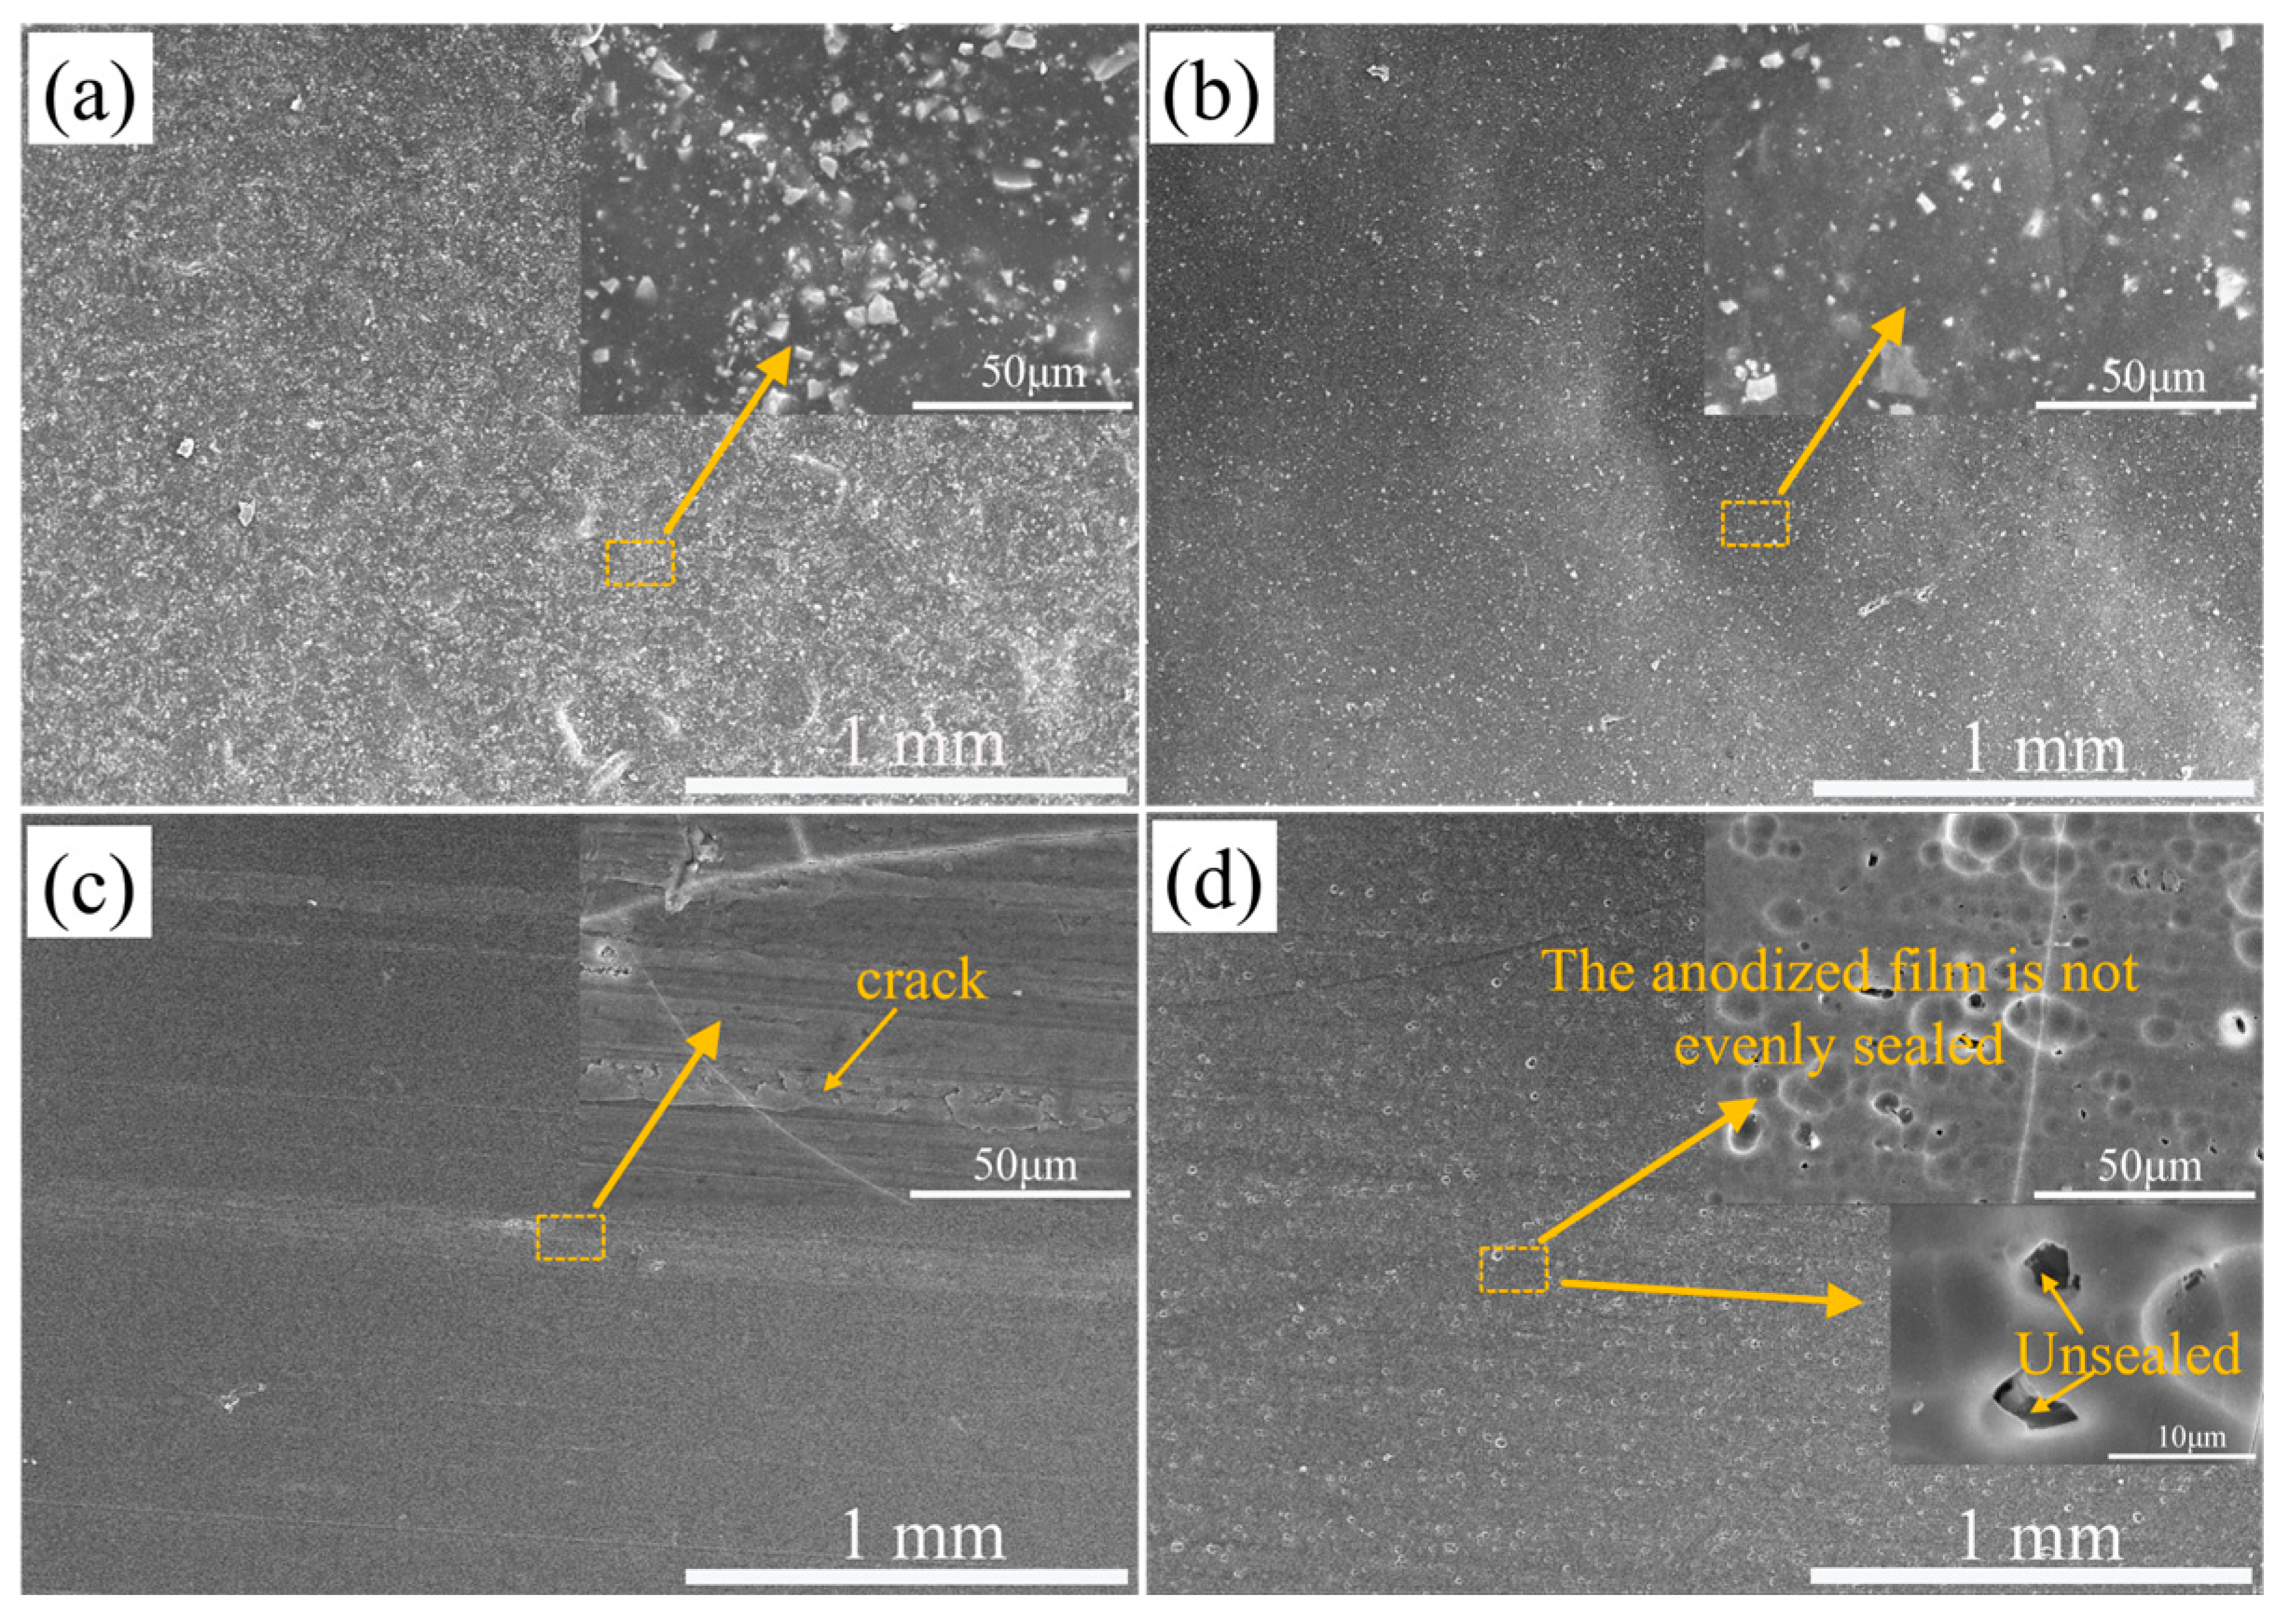
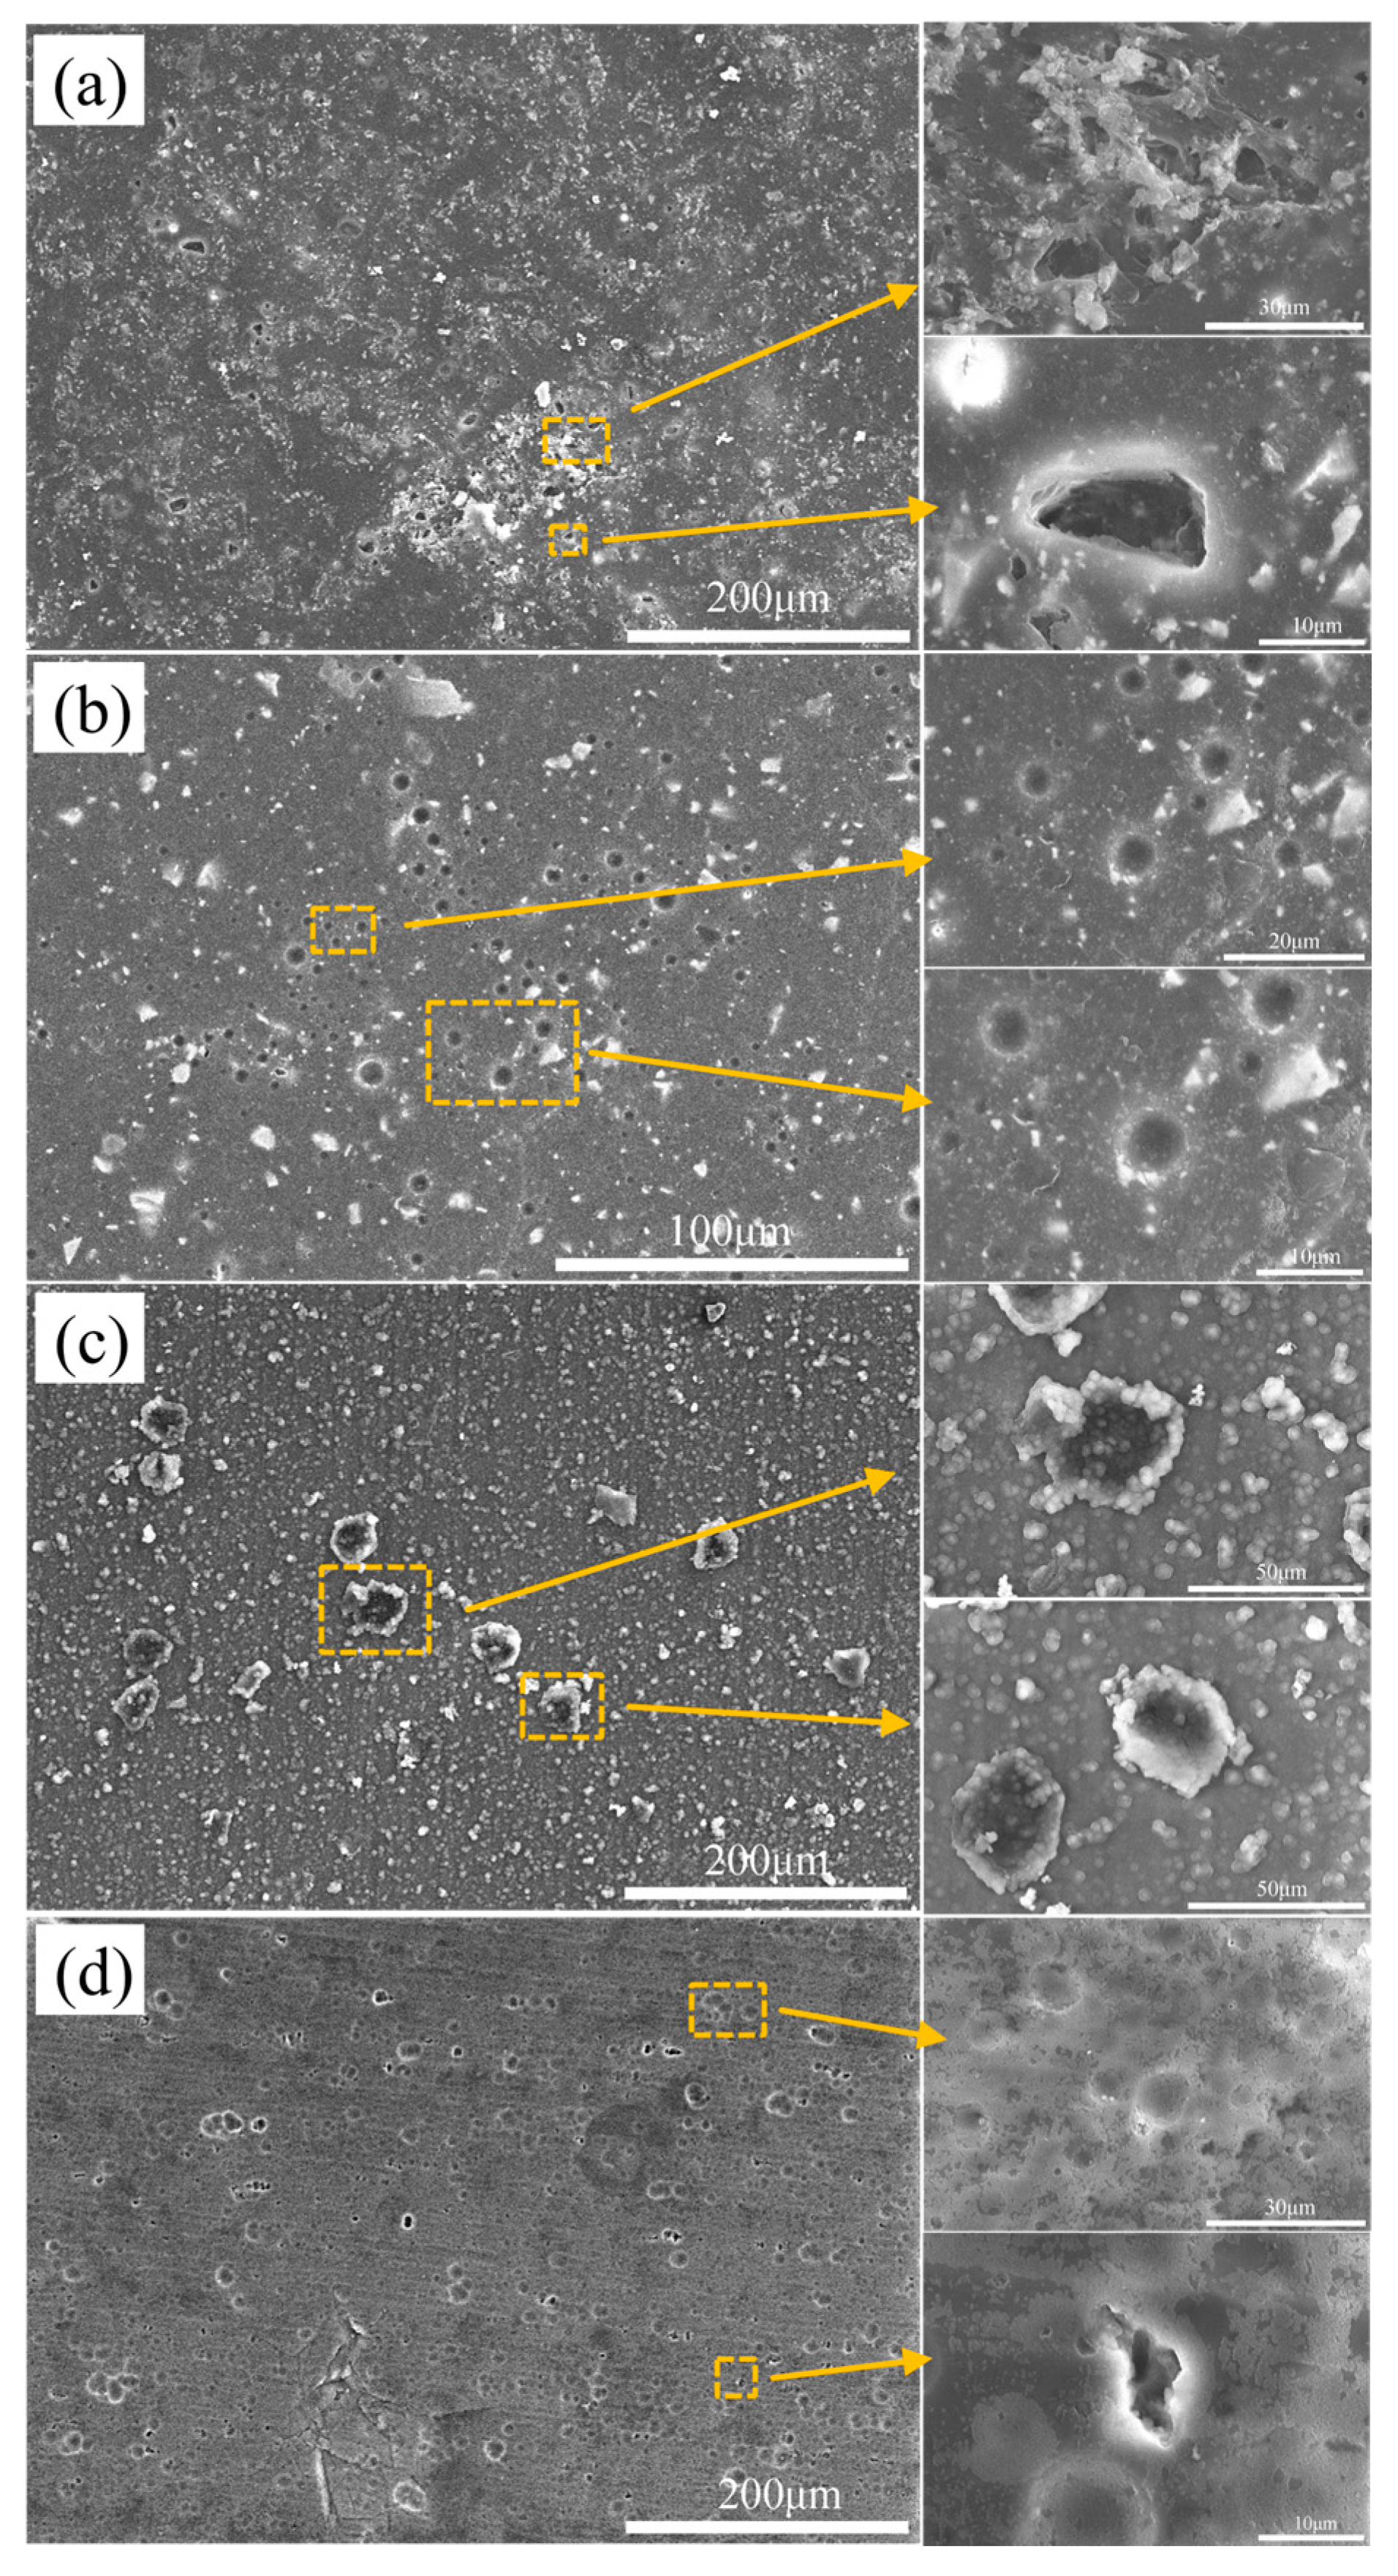
3.1. Micromorphology of the Coating after Corrosion

Figure 1 shows the pre-corrosion micromorphology of aluminum alloy with different surface treatment processes. The aluminum alloy (sample 1#) is coated with a layer of sand film, and the surface roughness is the largest among the four materials. Flat powder coating (sample 2#) has a smoother surface and smaller powder particle size than the sand film layer coating. A hard anodized aluminum alloy sample (sample 3#) has defects such as cracks due to the treatment process on the surface. The anodized film on the surface of ordinary anodized heat-sealed aluminum alloy (sample 4#) is unevenly sealed, and there are a large number of holes.
Figure 2a shows the microscopic corrosion morphology of the sand powder coating (sample 1#) after 200 h of immersion in the 3.5 wt.% NaCl solution. The corrosion type of the observed area is pitting corrosion; the pitting is irregular and hole-like, and the corrosion products are attached to the vicinity of the pit. The aluminum alloy matrix under the sand film layer has been corroded, and there is a tendency to gather and peel. As the corrosive solution continues to permeate holes and cracks, the corrosion area expands, resulting in a reduction in the corrosion resistance of the sample. In the enlarged image, the interior of the pitting area is also filled with corrosion products, suggesting that corrosion happens both on the surface and in the holes of the coating. As a result, the shielding effect of the coating is significantly diminished.
Figure 2b shows the microscopic corrosion morphology of a flat powder coating (sample 2#) after 200 h of immersion in the 3.5 wt.% NaCl solution. There are fewer corrosion products, and the majority of the pitting pits are more regularly shaped. A few are irregular holes, and there are fewer corrosion products. There are a small number of cracks and a great number of powder particles on the surface, and the powder particles are not covered by corrosion products, indicating that corrosion is more likely to occur at holes and fractures at the particle interface than on the bulk surface. The 6061 aluminum alloy substrate is not corroded, and the coating provides protection.
Figure 2c shows the microscopic corrosion morphology of a hard anodized aluminum alloy sample (sample 3#) after 200 h of immersion in the 3.5 wt.% NaCl solution. The surface of the coating is covered with many discontinuous particle corrosion products, and the corrosion type is mainly pitting corrosion. The surrounding and internal corrosion pits are covered by corrosion products; some pitting areas have cracks; there is a tendency to peel; the substrate is severely corroded; the degree of pitting corrosion is severe; and the coating has a poor protection effect on the substrate.
Figure 2d shows the microscopic corrosion morphology of ordinary anodized heat-sealed hole aluminum alloy (sample 4#) after 200 h of immersion in the 3.5 wt.% NaCl solution. There are no granular corrosion products on the sample surface, with the enlarged image showing that the sample surface is covered with a dense and continuous corrosion product film.

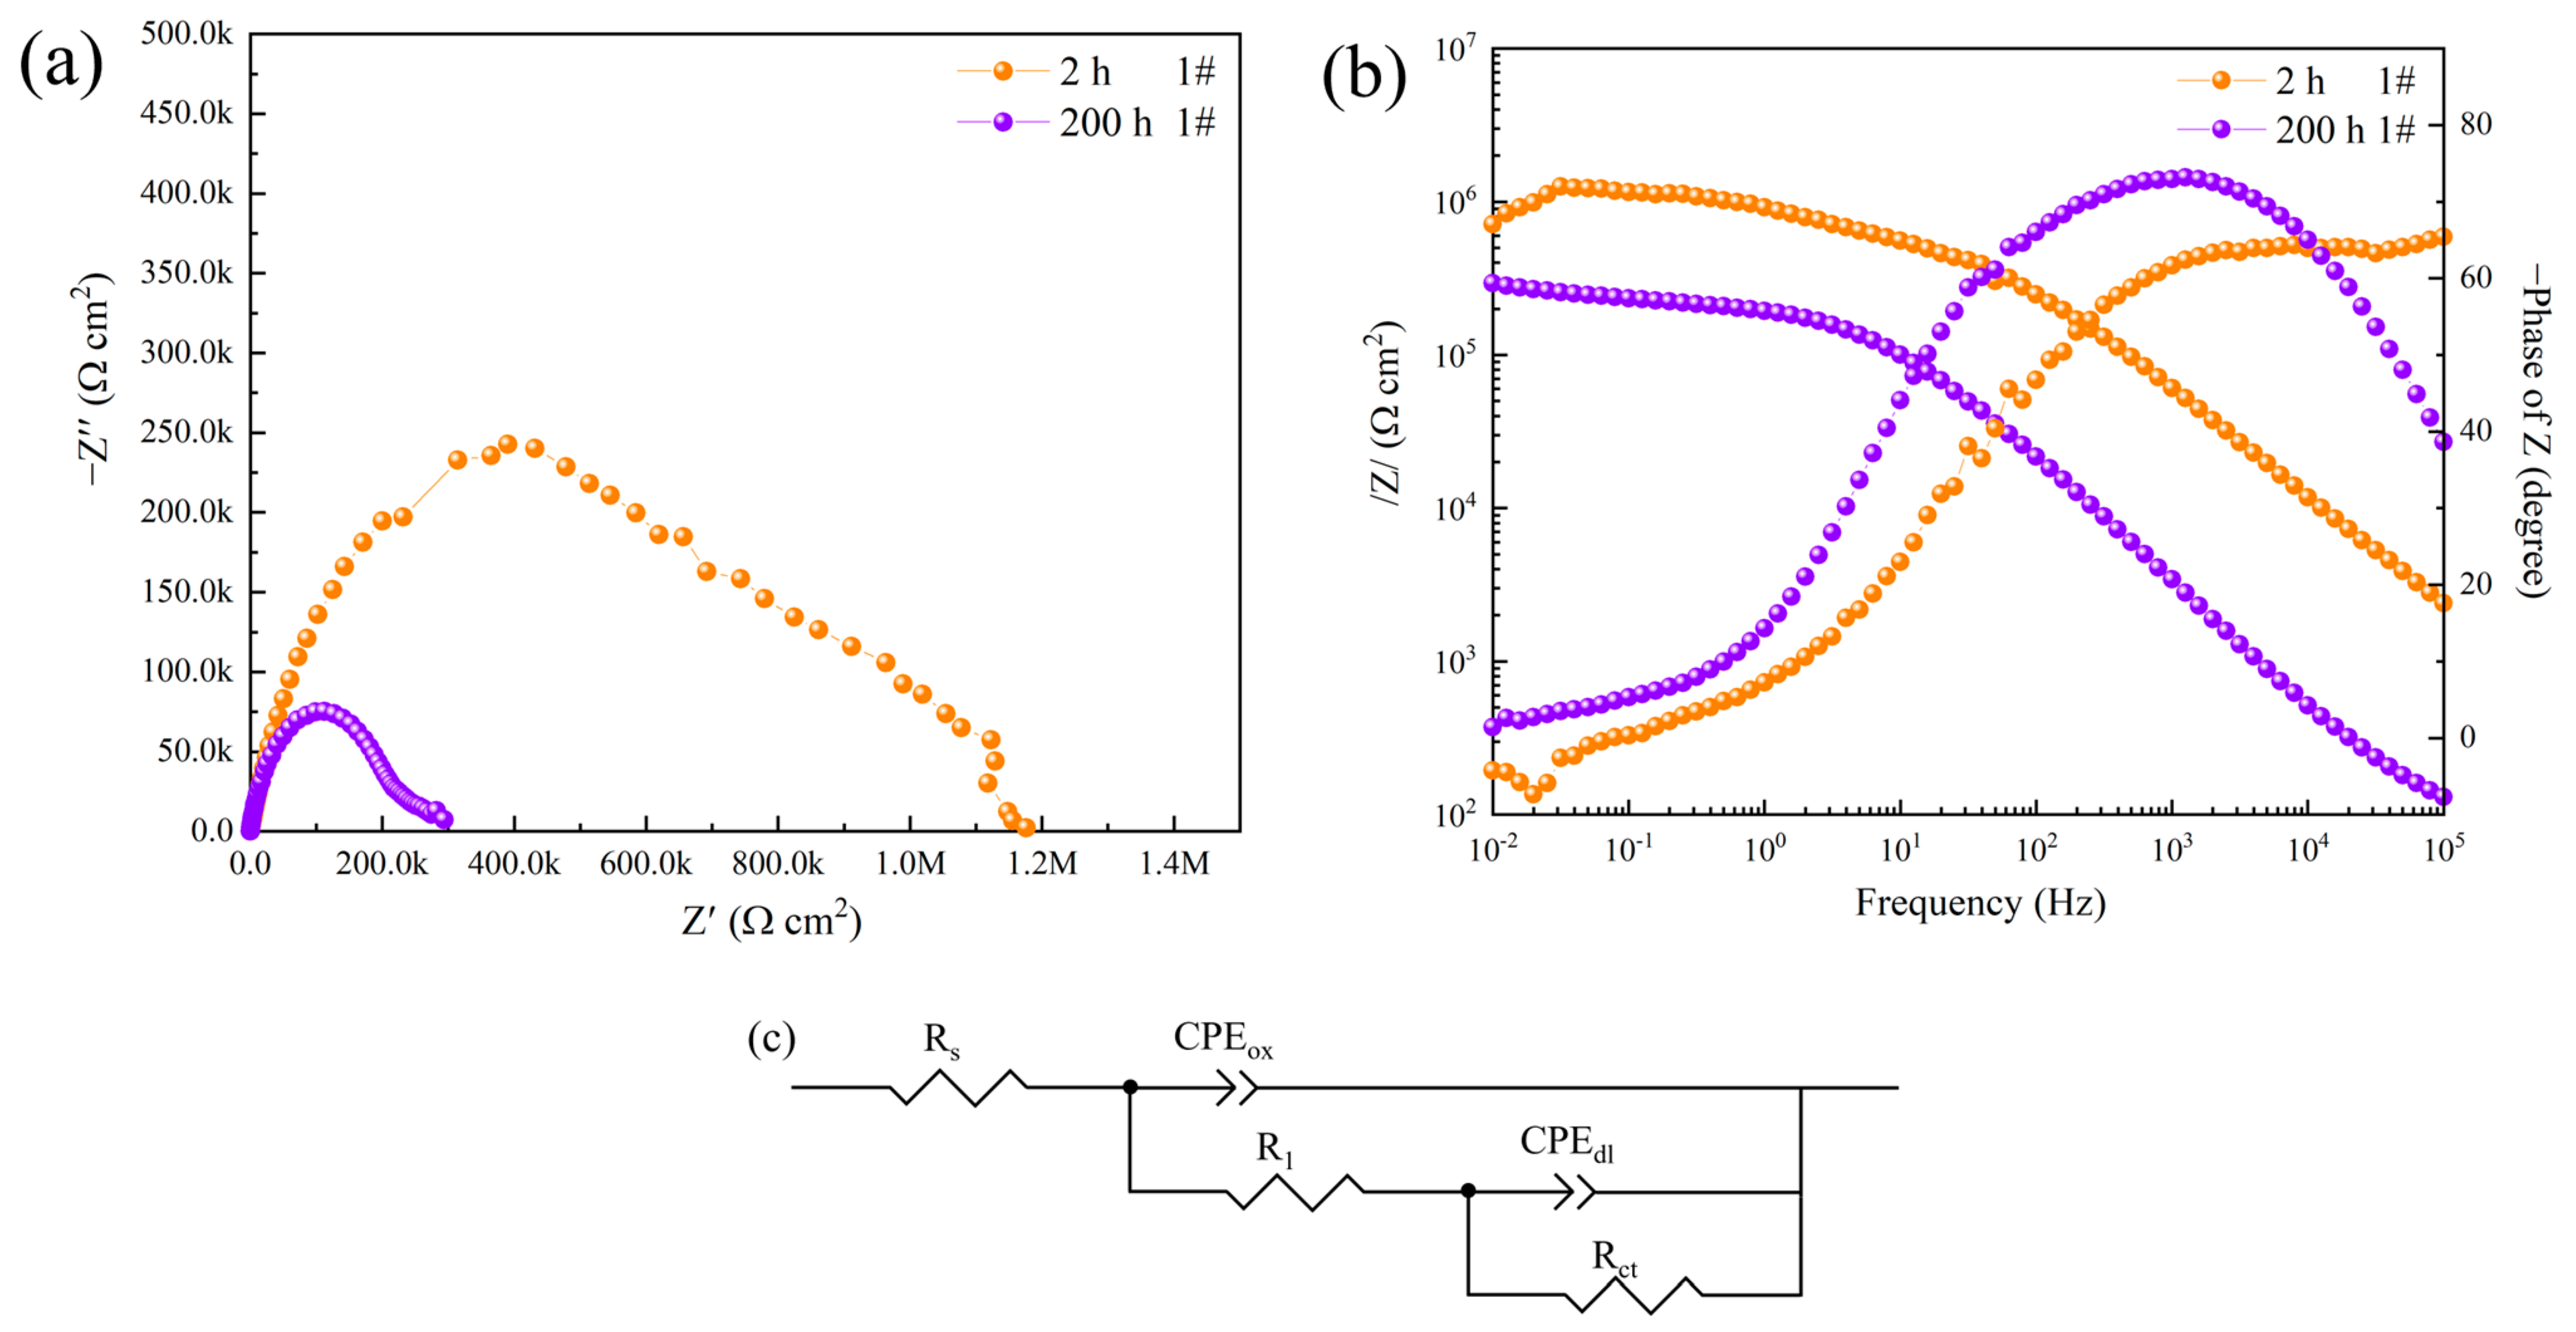
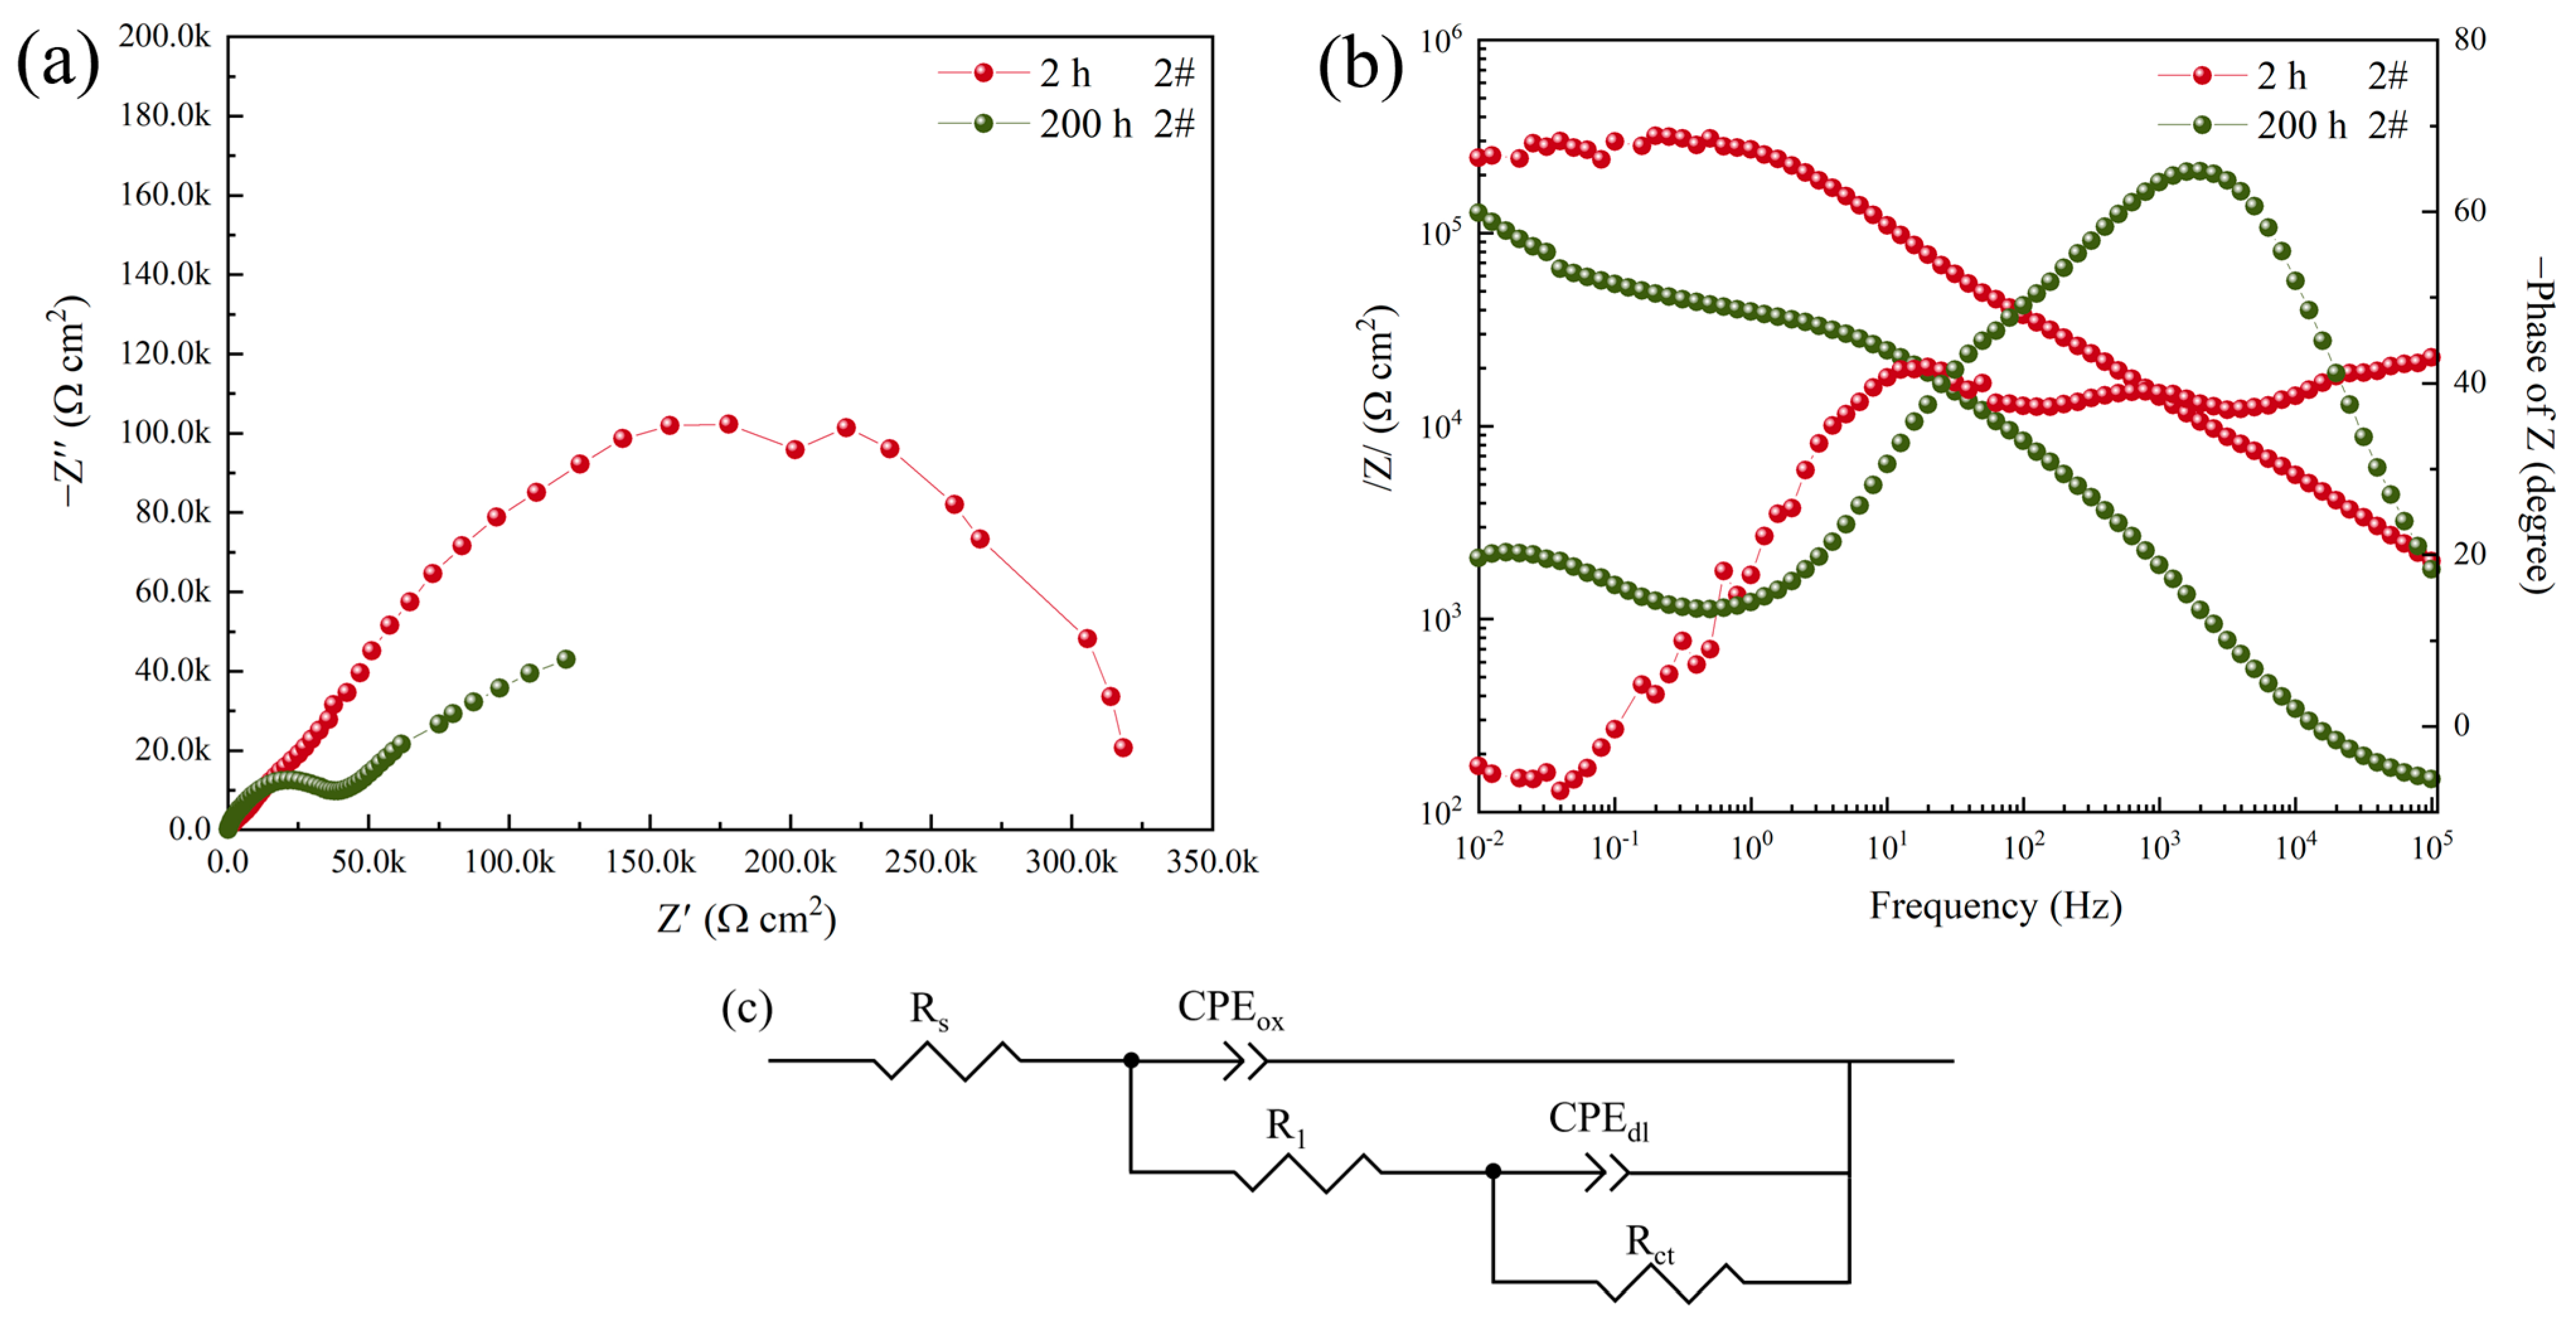
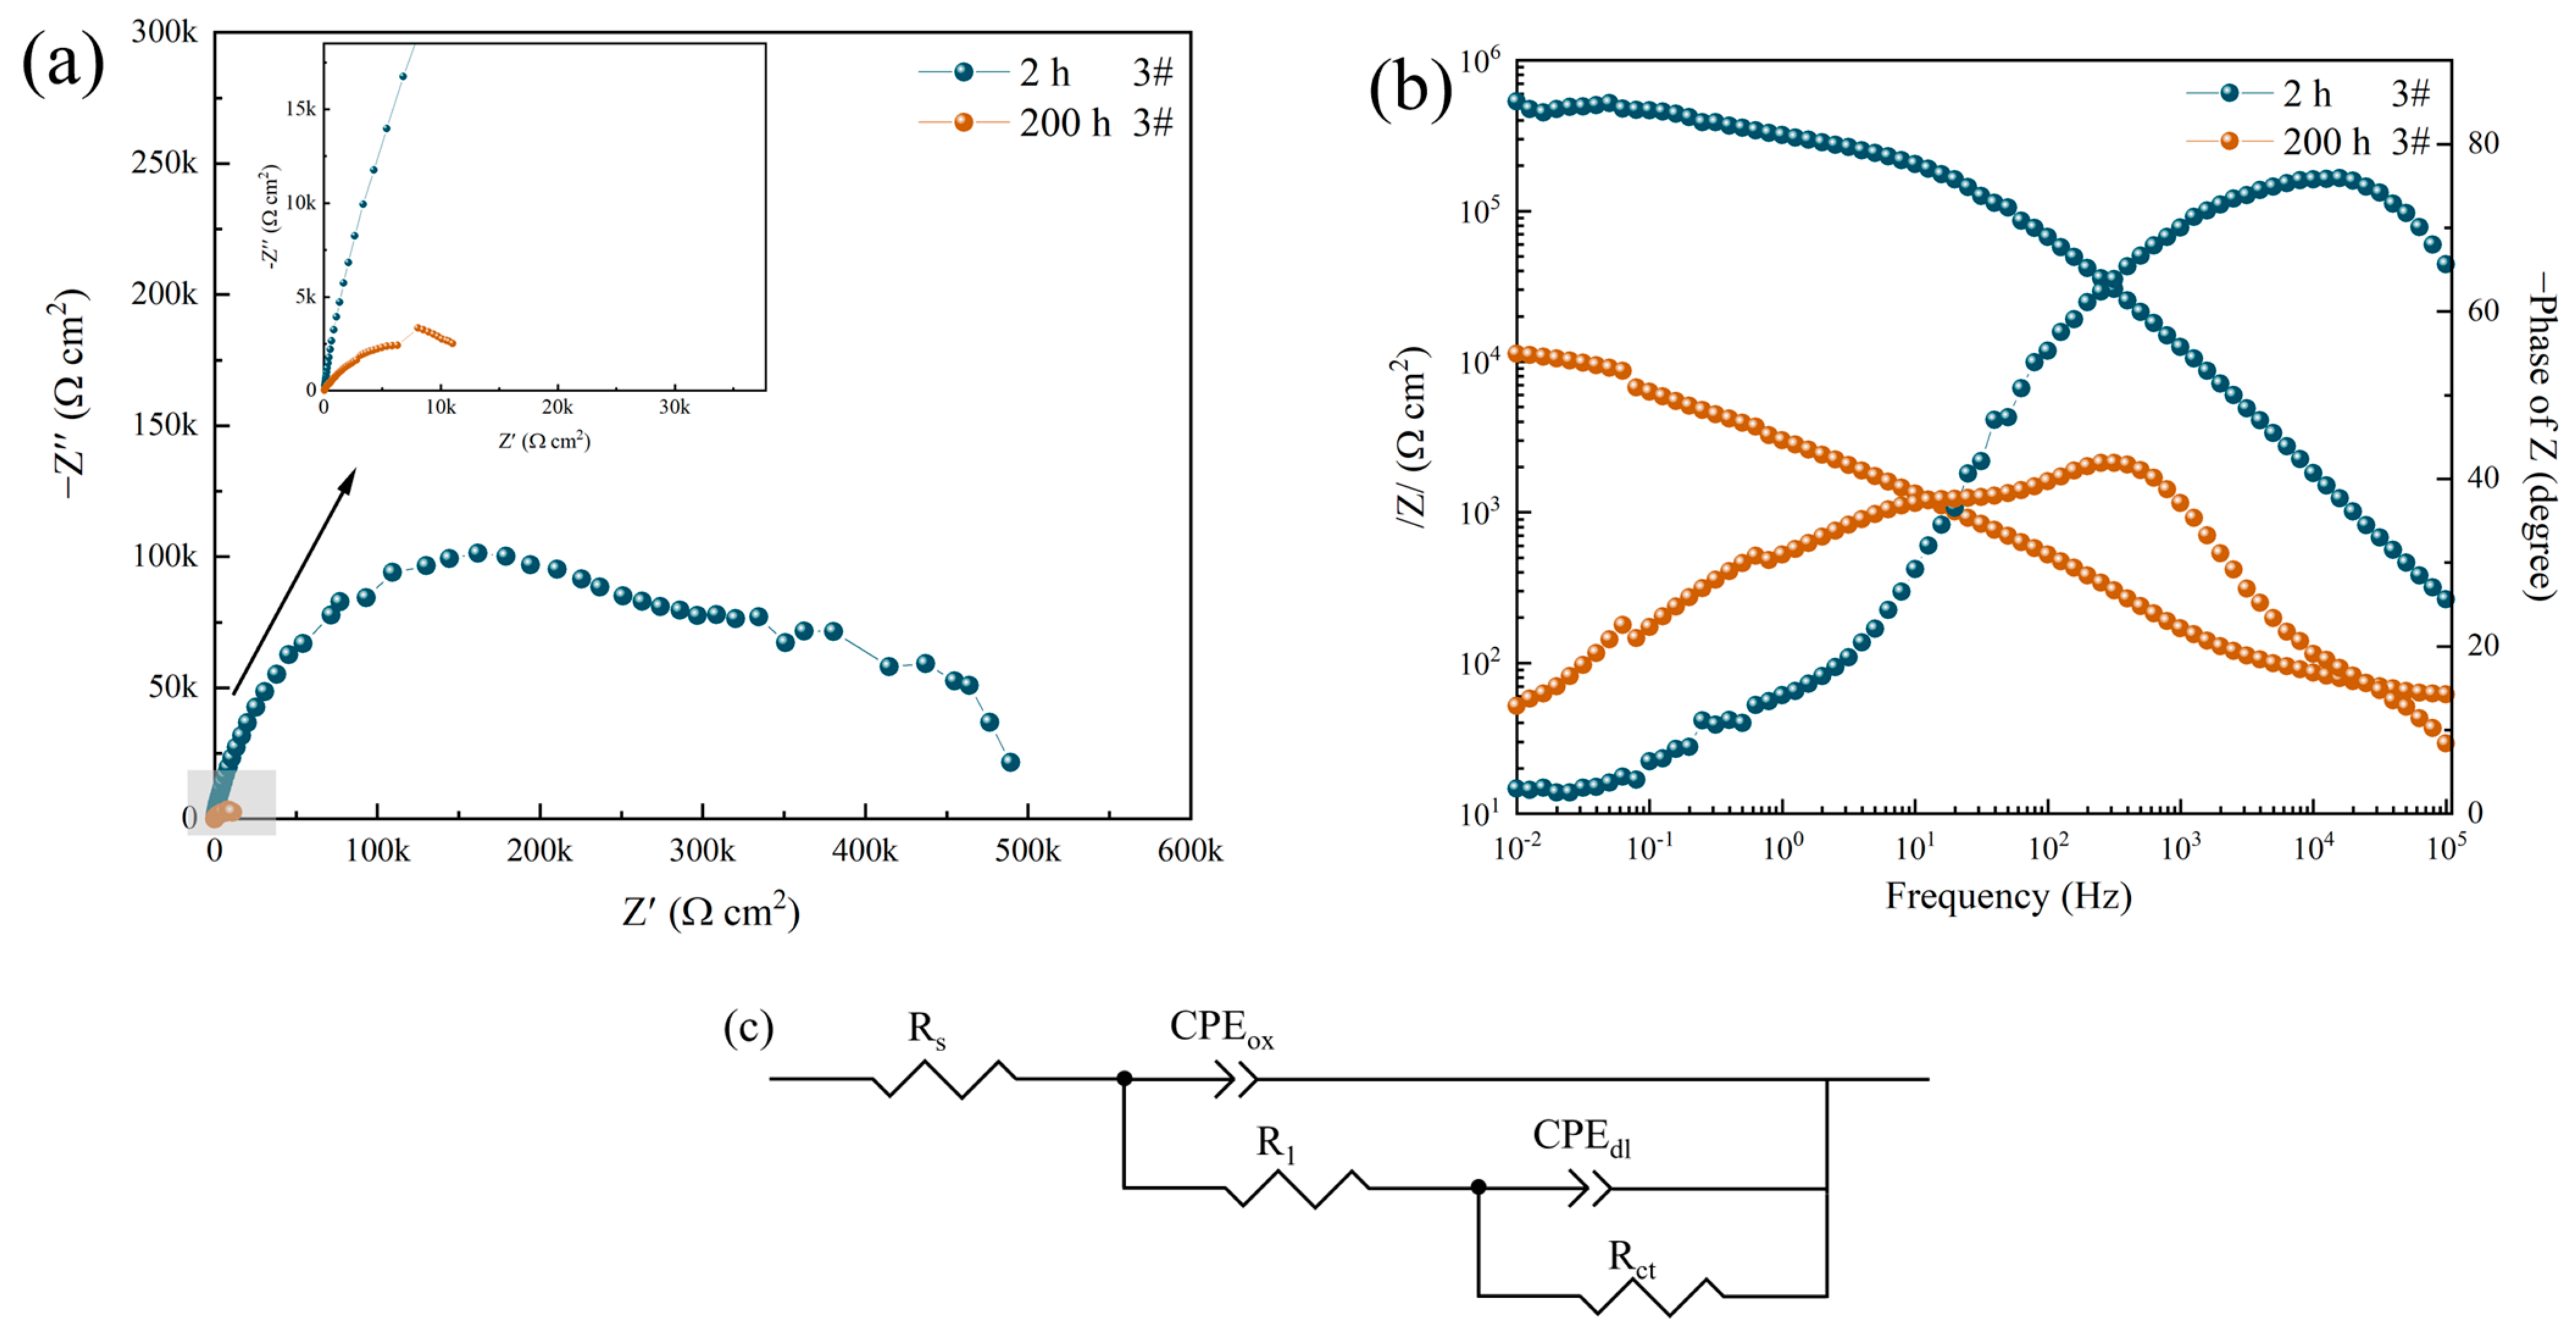
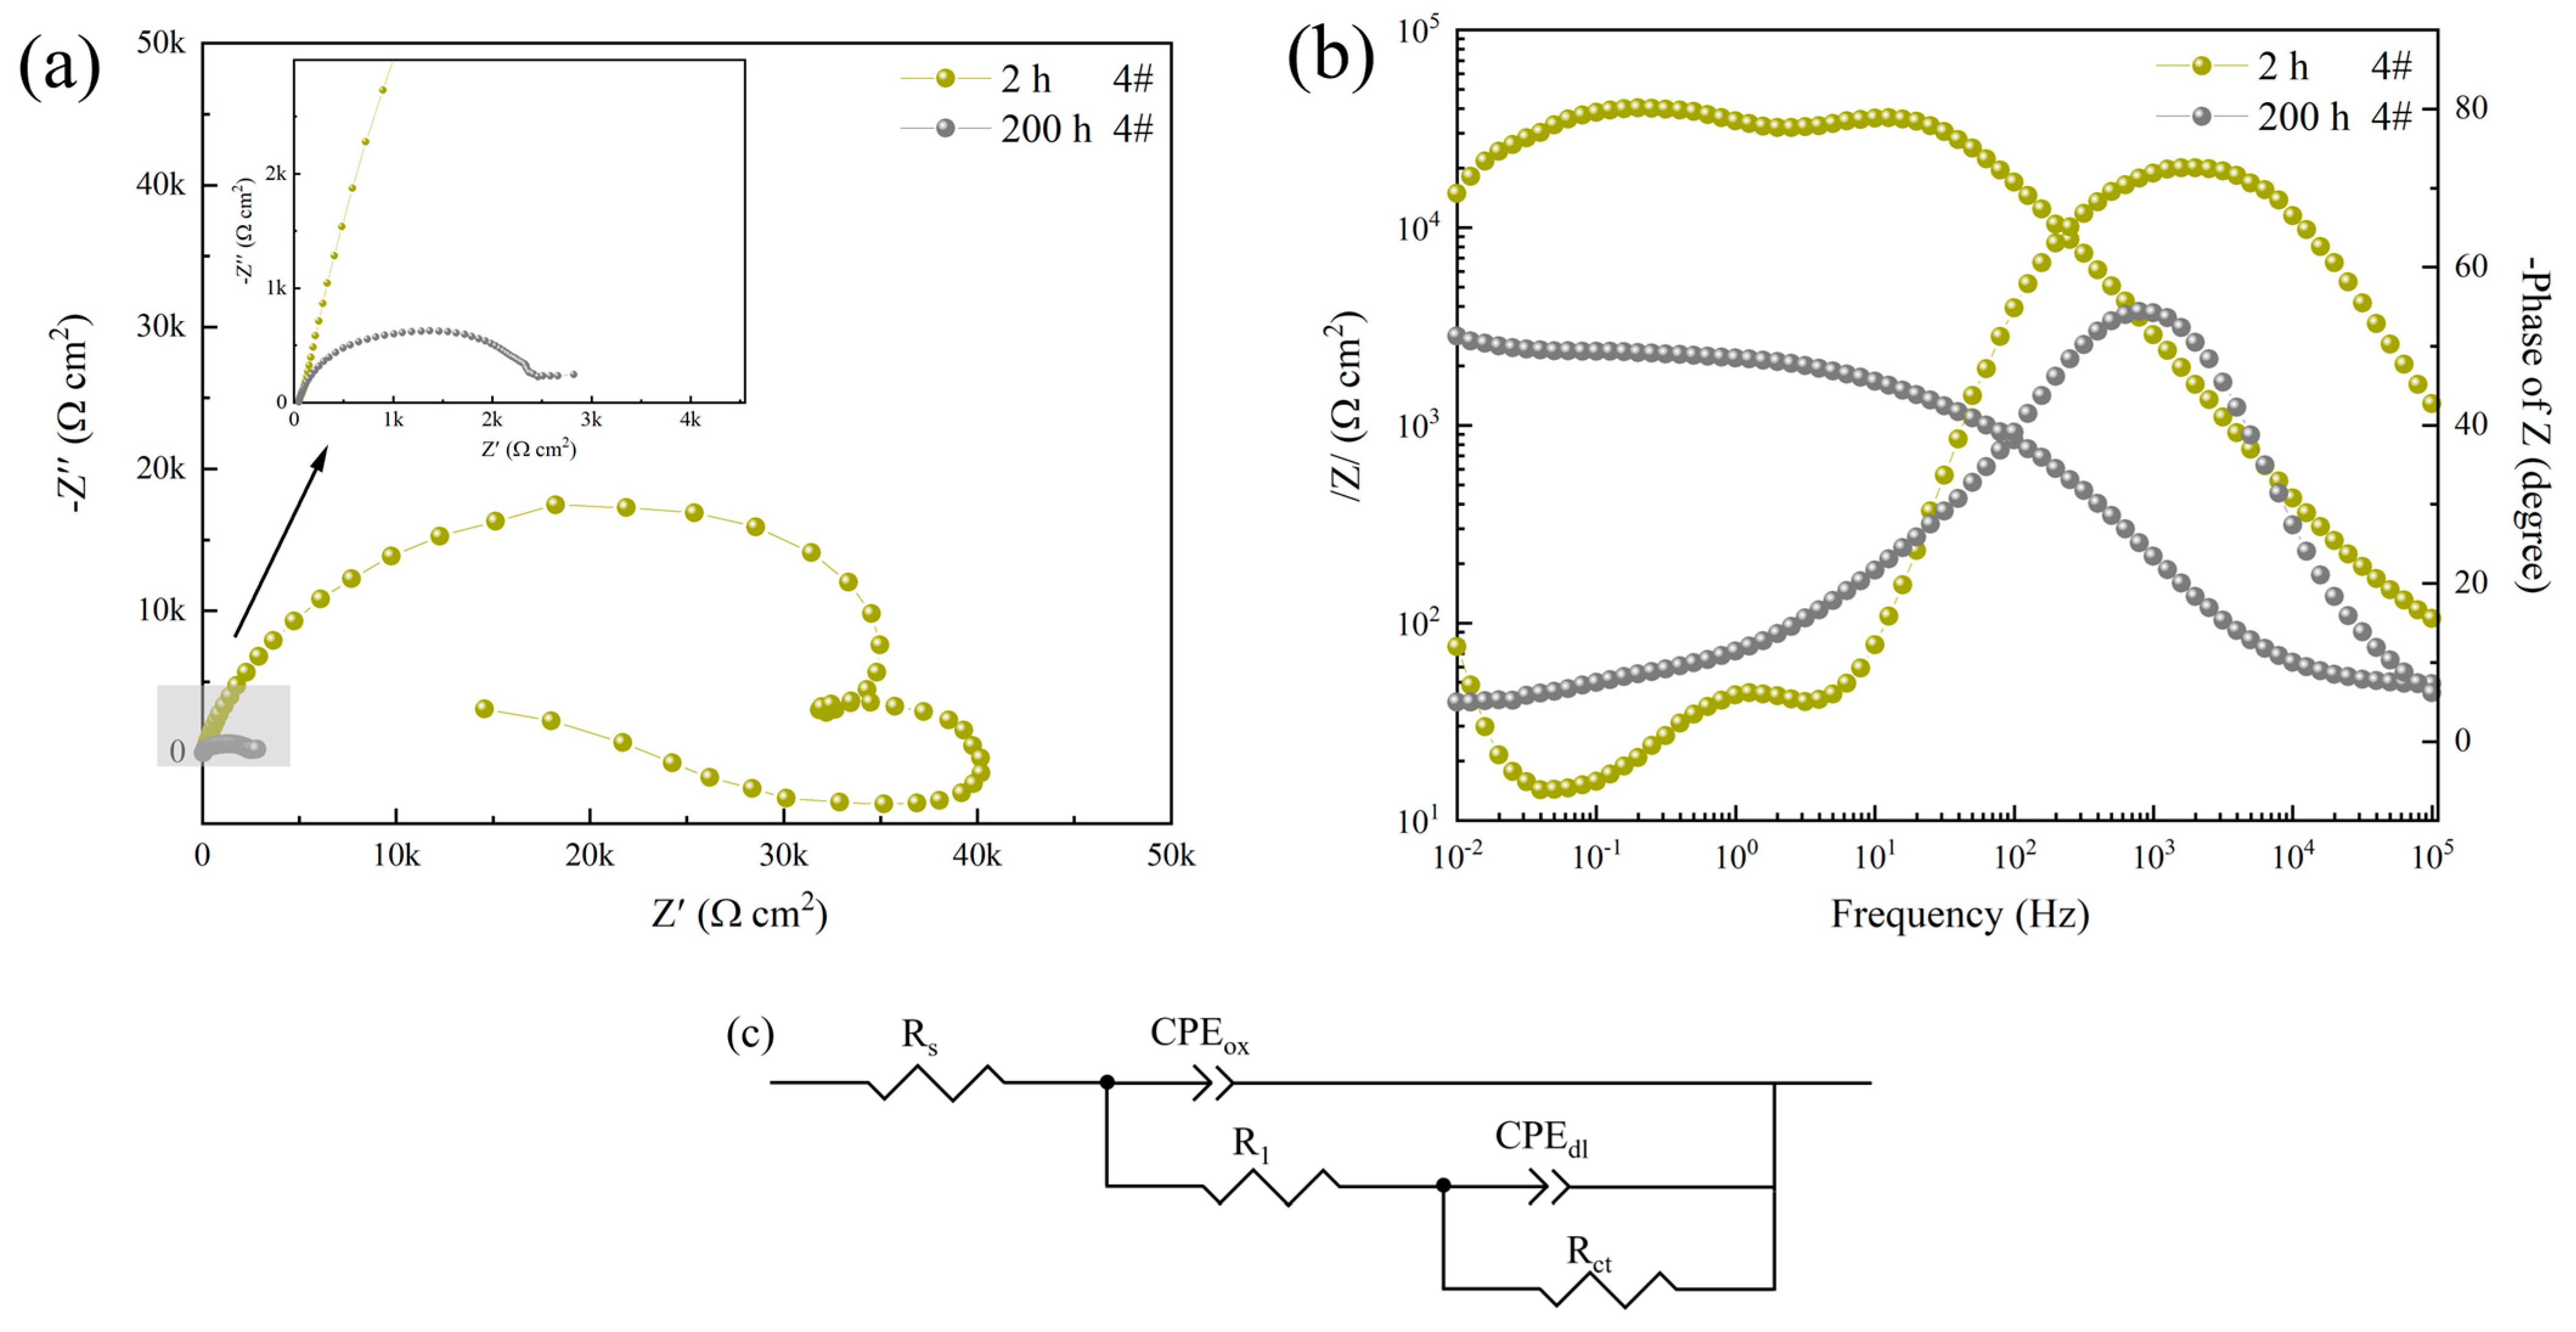
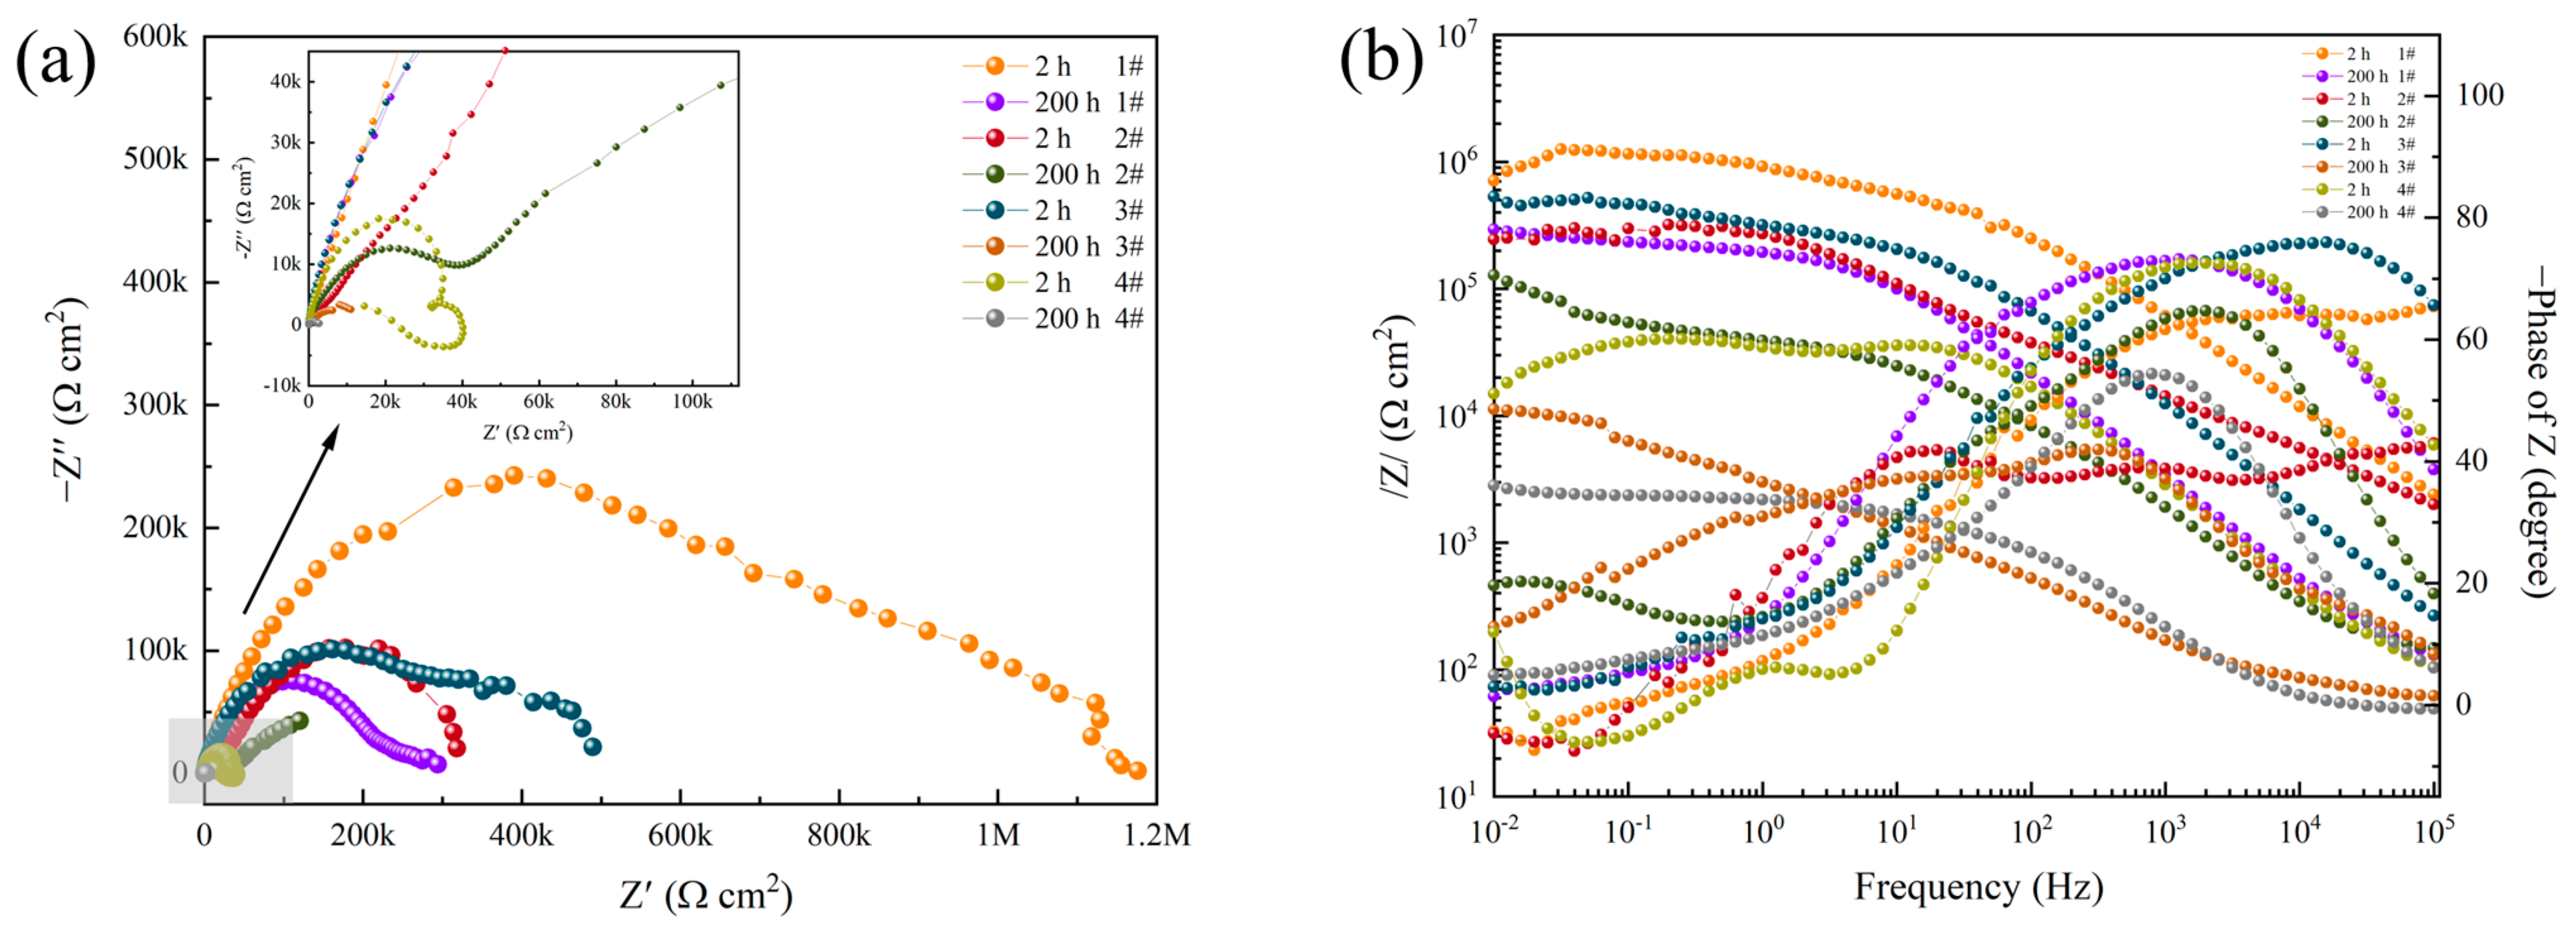
3.2. Electrochemical Impedance Spectroscopy

Figure 3 shows the electrochemical impedance spectrum obtained after the immersion of the sand-grained powder aluminum alloy sample (sample 1#) in a 3.5 wt.% NaCl solution for 2 h and 200 h, respectively. As the immersion time increases to 200 h, the diameter of the capacitor arc decreases significantly, indicating a great decrease in the impedance value. In order to better analyze the corrosion process of the coating, electrochemical data were fitted, and the results are shown in Table 1. Where RS is the solution resistance, R1 is the additional resistance of the electrolyte solution in the local corrosion part, and Rct represents the charge transfer resistance of the electric double layer. The improved corrosion efficiency obtained from EIS measurements was calculated according to the following Equation (1)
v % = R c t 0 R c t R c t 0 · 100 %
where Rct is the charge-transfer resistance of the sample in the test solution for 200 h and R c t 0 is the charge-transfer resistance of the sample in the test solution for 2 h. Since the environment of the entire system is not ideal, the capacitor is replaced by a constant phase angle element (CPE). The CPE has two components, namely CPE-Y0 and n, where Y0 is the frequency-independent admittance and n is the diffusion effect index. When n = 1, the CPE represents the capacitance; when 0.5 < n < 1, it means that the surface of the working electrode has high roughness or a non-uniform current distribution; and when n = 0.5, it corresponds to the diffusion process at low frequency or the response of the porous electrode at high frequency [29]. With the extension of immersion time, the value of CPE-Y0 increases significantly. According to Formula (2) [30]:
C = ε ε 0 A d 1
The C is the capacitance, the ε is the permittivity of the oxide layer, the ε0 is the dielectric constant in the vacuum, the A is the surface area of the sample in the experiment, and the d is the thickness of the passivation layer. If the surface area d of the sample does not change significantly with the increase in immersion time, the increase in CPEox can be attributed to the erosion effect of Cl on the oxide layer of aluminum alloy, which reduces the thickness d of the passivation layer. On the other hand, Ferreira et al. [31] found that the oxide layer of aluminum alloy (Al2O3·xH2O) increased due to hydration ε after being immersed and corroded. Therefore, the increase in capacitance value may be related to the continuous increase in hydration, which in turn leads to a decrease in the corrosion resistance of the coating on aluminum alloy surfaces. Due to the characteristics of the sand coating’s surface treatment process, its corrosion resistance is drastically reduced by hydration.
Figure 4 shows the EIS results of the flat powder-coated aluminum alloy (sample 2#) immersed in a 3.5 wt.% NaCl solution for 2 h and 200 h, respectively. The fitting data are summarized in Table 2. With the increase in immersion time, the capacitor arc diameter of sample 2# decreased significantly, and the value of Rct decreased from 451.16 kΩ·cm2 to 108.43 kΩ·cm2. The value of CPEdl-Y0 increases from 7.976 × 10⁻⁷ sn·Ω−1·cm−1 to 3.1047 × 10⁻⁵ sn·Ω−1·cm−1. Improved corrosion efficiency increased by 75.97%. In general, the value of CPEdl is positively correlated with the quantity and area of pitting. Therefore, with the increase in immersion time, the quantity of pitting corrosion in the coating increases, and the CPEdl value increases by two orders of magnitude.
Figure 5 shows the EIS results of the hard anodized aluminum alloy (sample 3#) immersed in a 3.5 wt.% NaCl solution for 2 h and 200 h, respectively. The fitting data are summarized in Table 3. It can be seen from Figure 5a that with the extension of the immersion time, the diameter of the capacitor arc of sample 3# decreases significantly, the Rct value of the electric double layer charge transfer resistance decreases sharply from 635.42 kΩ·cm2 to 11.94 kΩ·cm2, and the values of CPEox and CPEdl increase by three orders of magnitude, corresponding to the severe pitting corrosion. Improved corrosion efficiency increased by 98.12%. The erosion of chloride ions on the film is the main corrosion behavior, which in turn leads to the formation of local corrosion microbatteries, which is manifested as a decrease in (R1 + Rct), and when the corrosion products accumulate near the pit, the erosion of chloride ions will be weakened to a certain extent and R1 will increase slightly.
In Figure 6b, it can be seen that the Bode polt of sample 4# shows three-time constants after 2 h of corrosion, namely high-frequency, medium-frequency, and low-frequency capacitive arcs as well as low-frequency sensory arcs, indicating that the surface of the sample is still in an activated state at this time, the surface of the specimen is not completely covered by corrosion products, and the aluminum alloy substrate is still actively dissolving. With the increase in immersion time, the high-frequency, medium-frequency, and low-frequency capacitive arcs continue to shrink. And the low-frequency sensory arc resistance disappears, with the sample surface completely covered by the corrosion product film. The fitting data are summarized in Table 4. Improved corrosion efficiency increased by 98.73%.

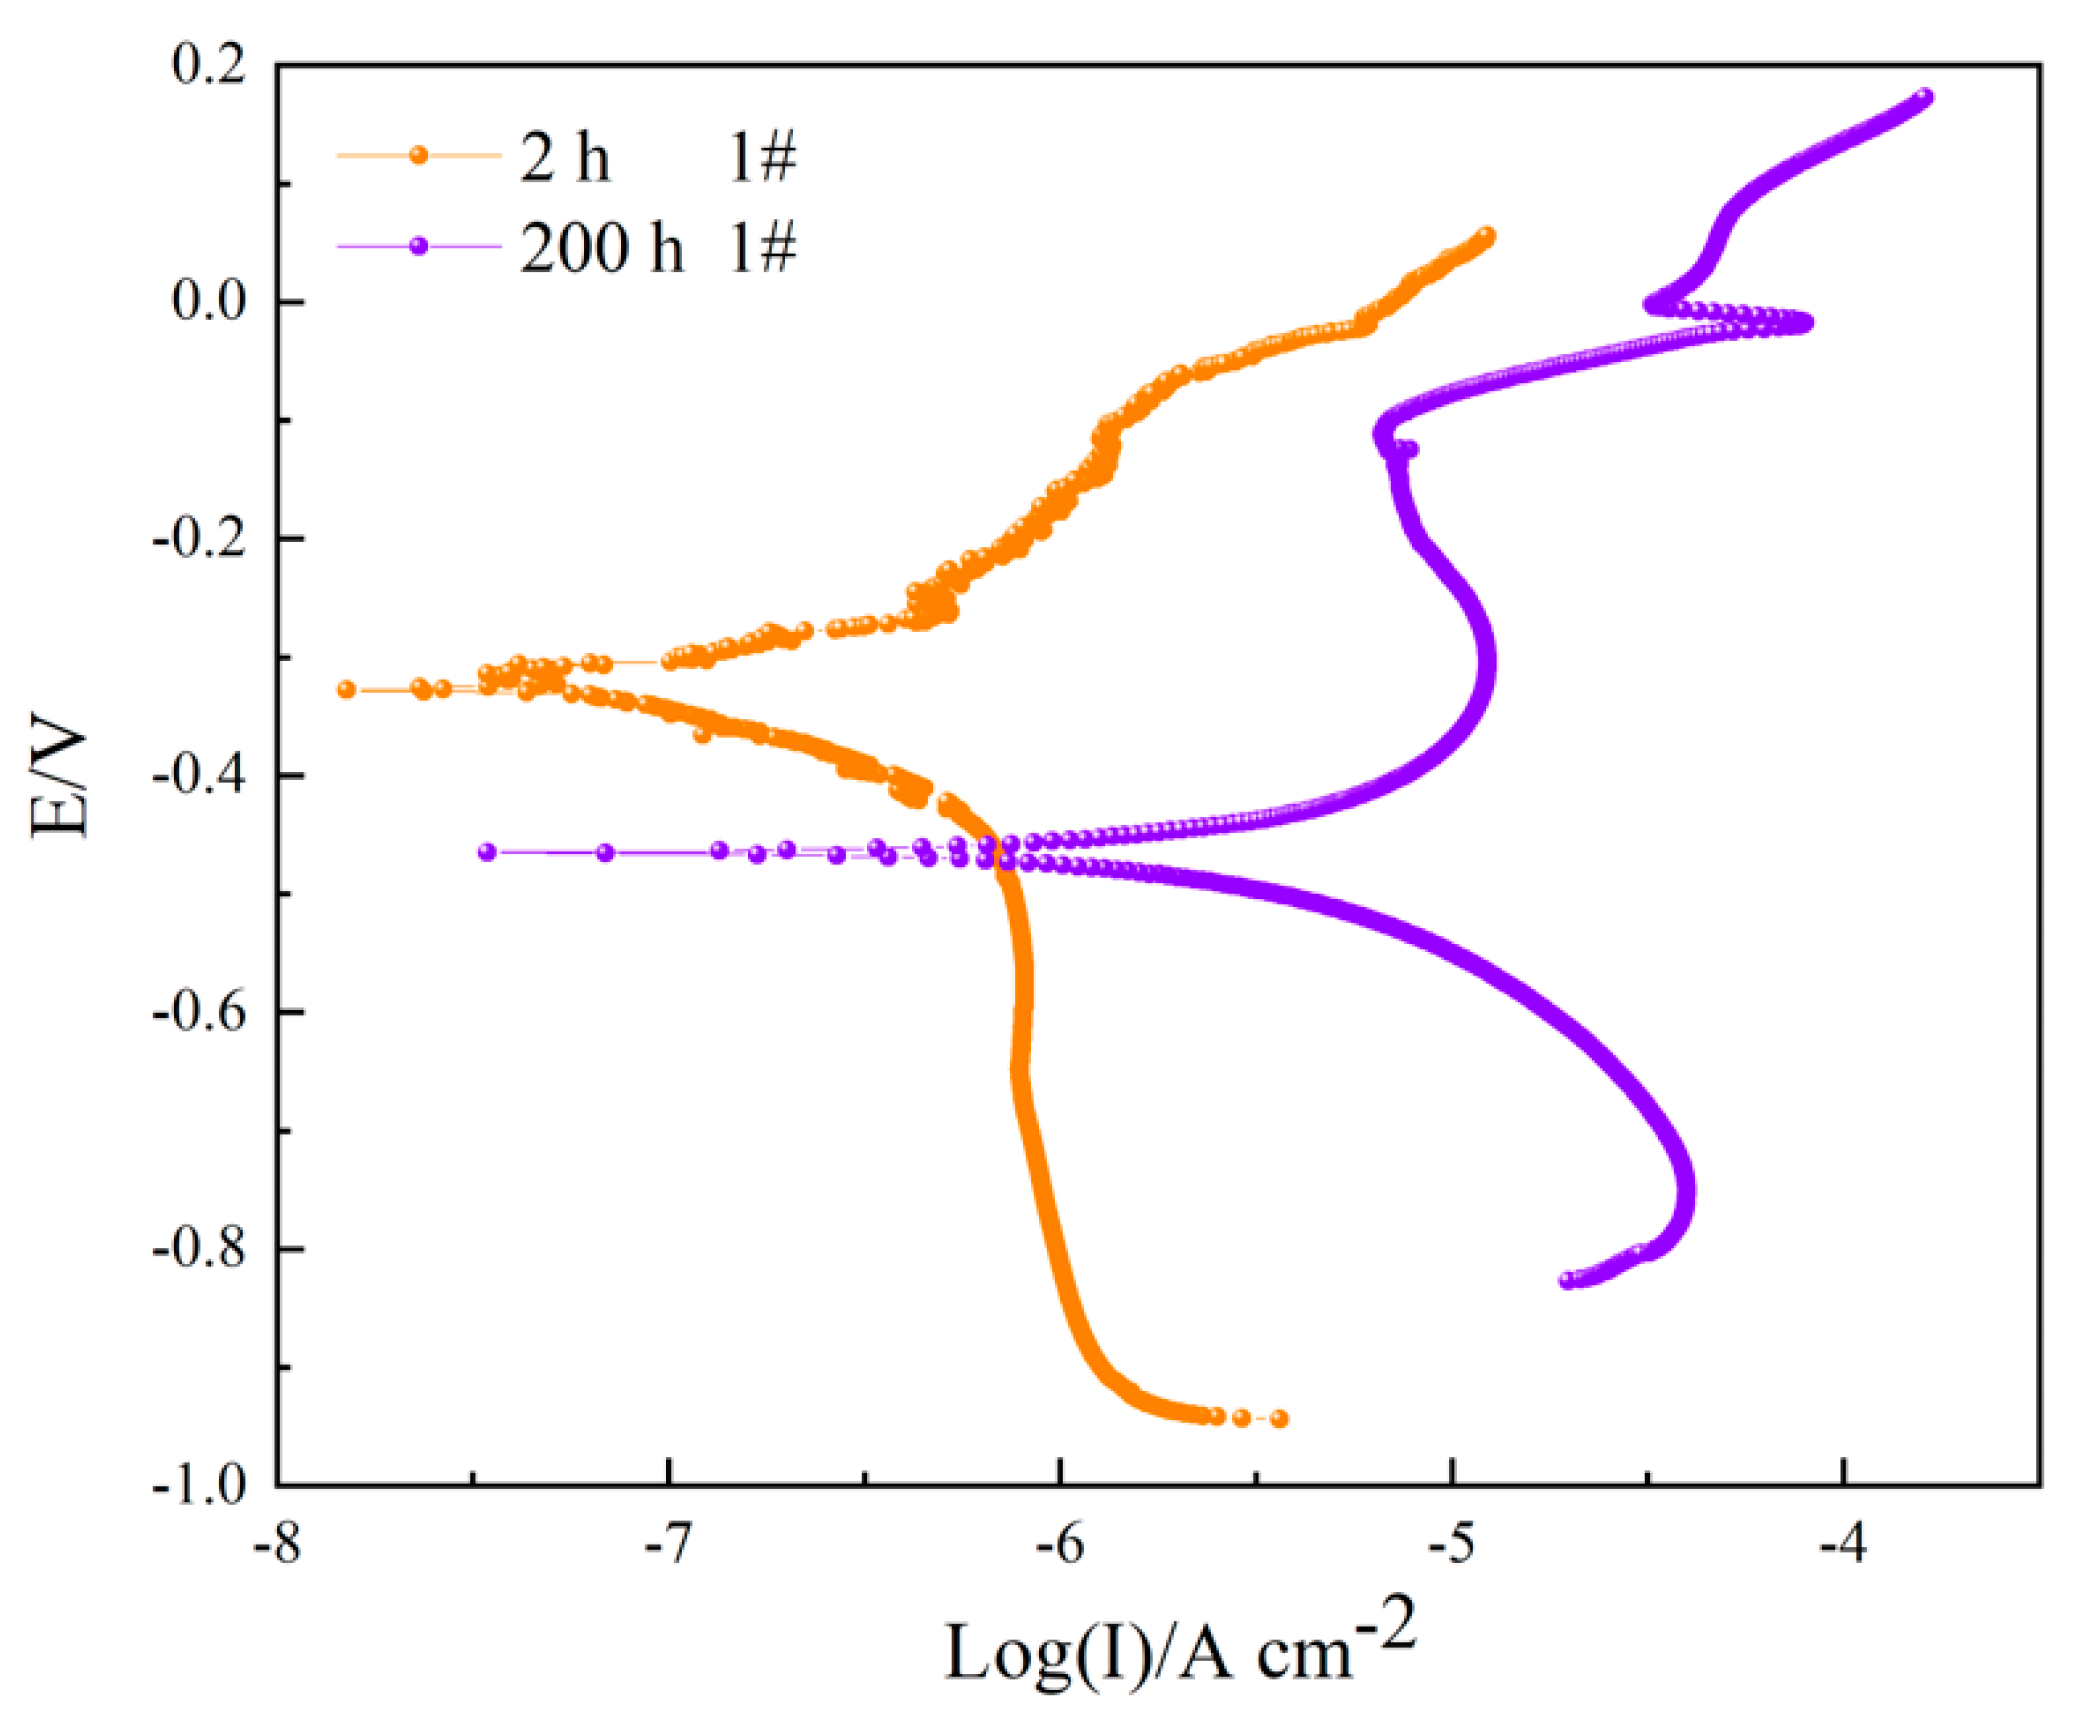
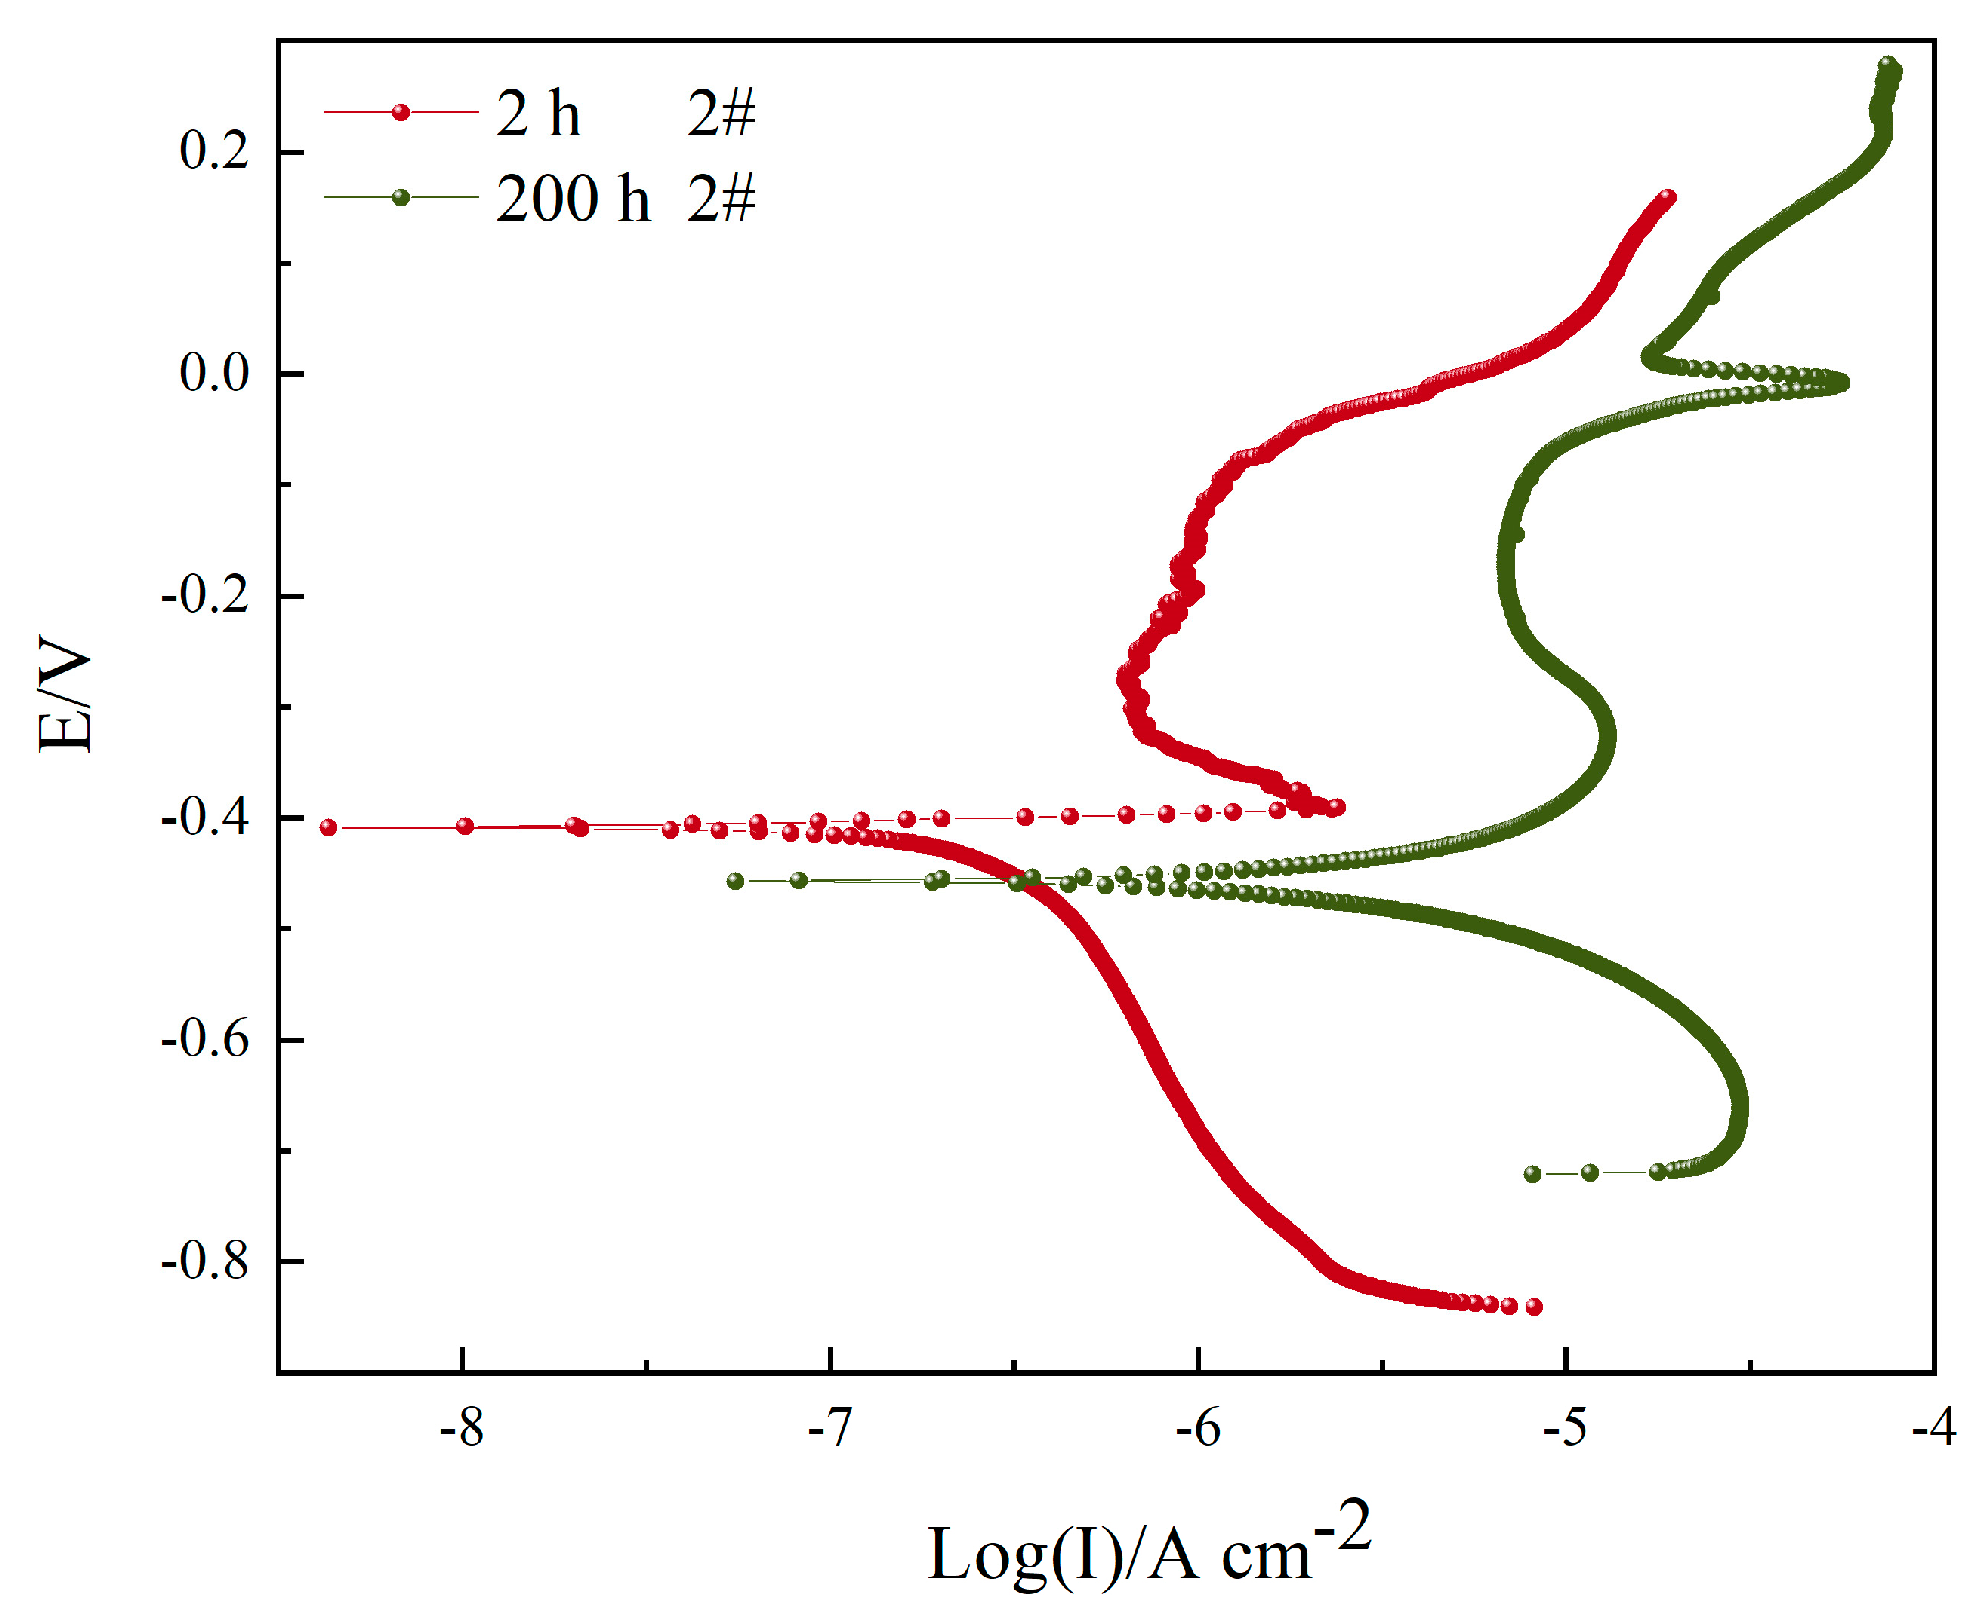
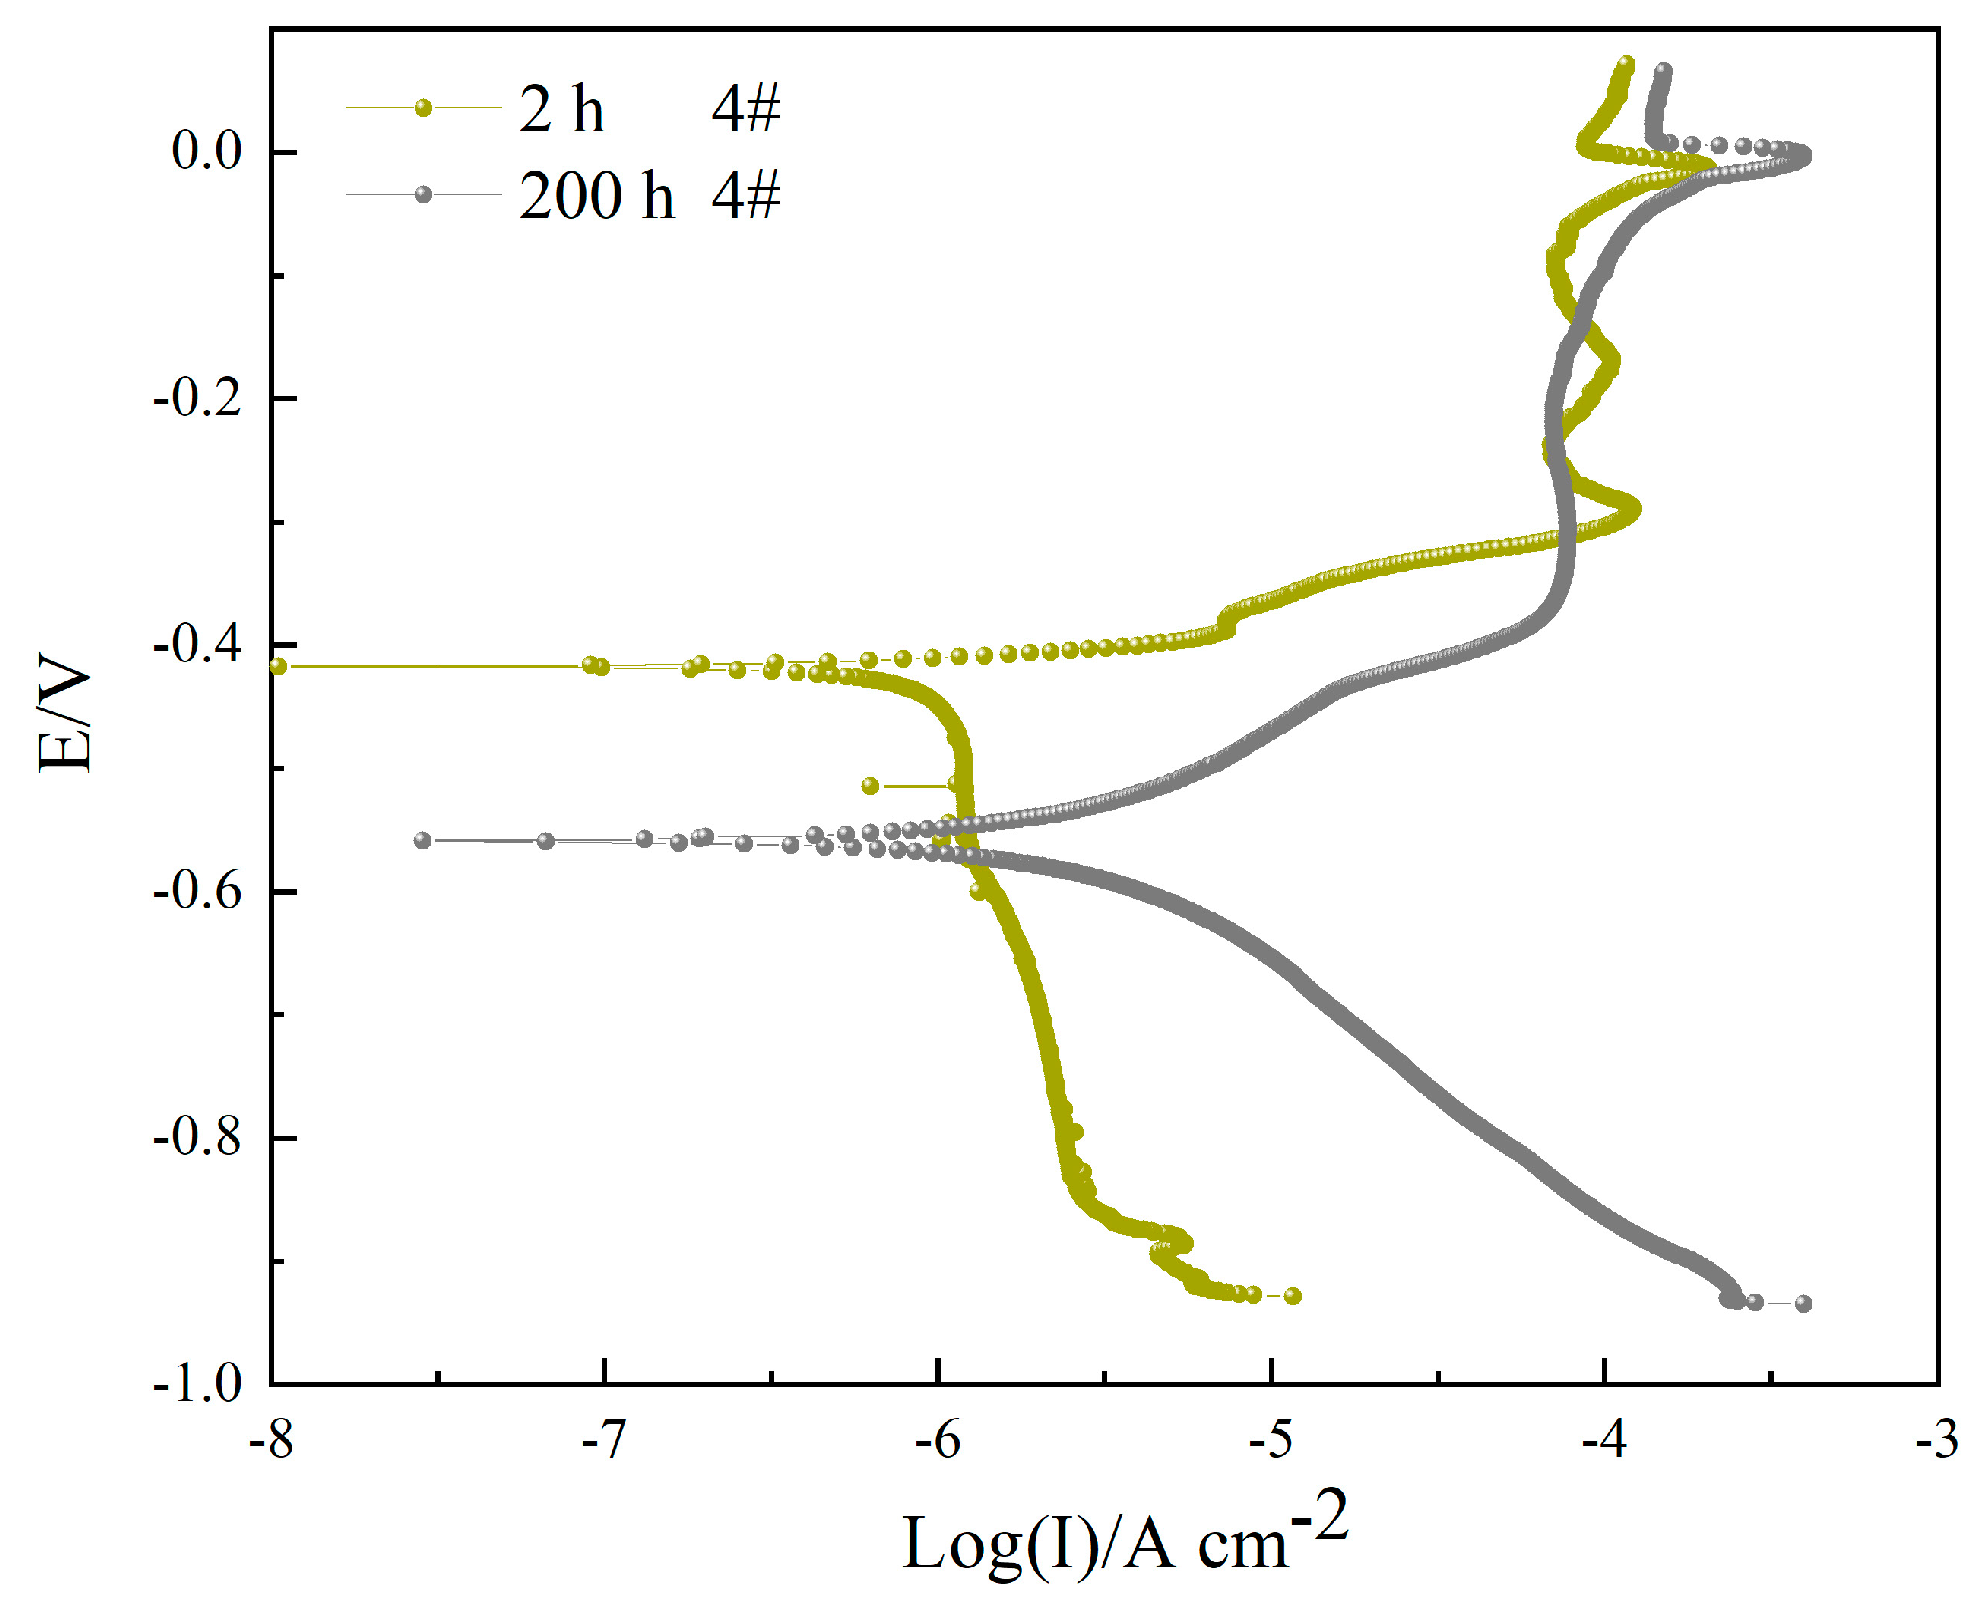
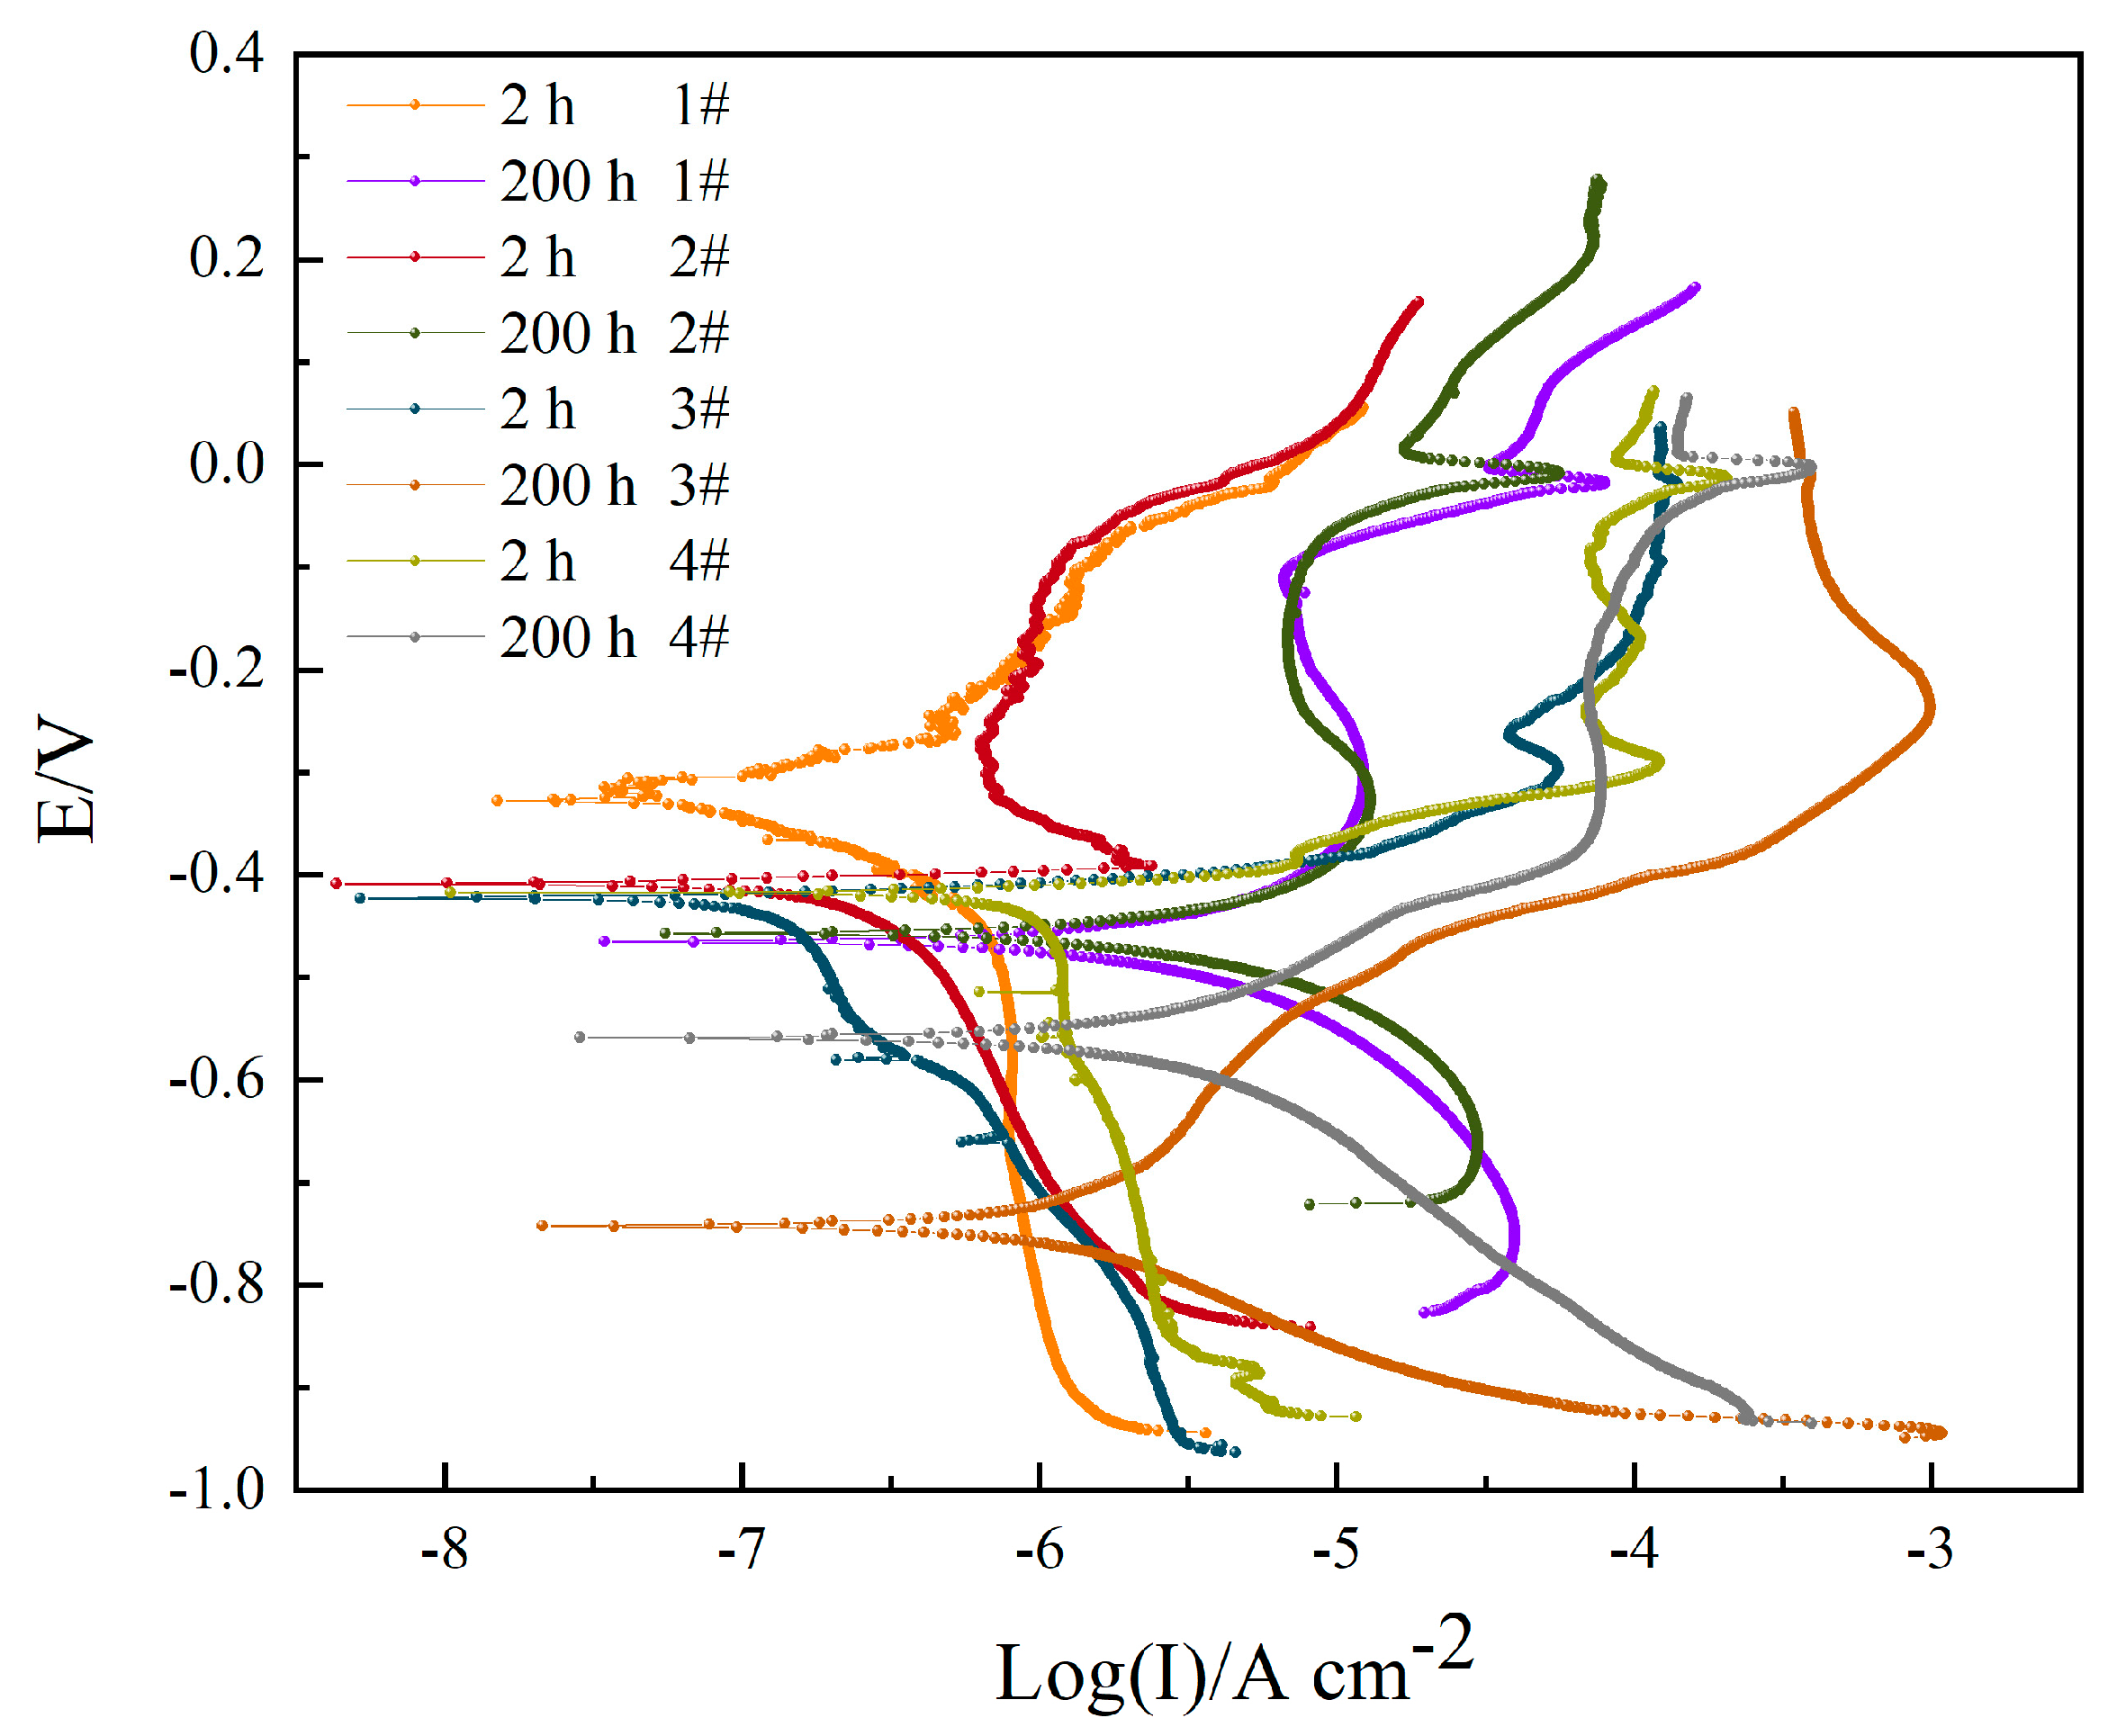
3.3. Polarization Curve

Figure 7 shows the potentiodynamic polarization curves of sample 1# after corrosion in a 3.5 wt.% NaCl solution for 2 h and 200 h. Both the cathode branch and the anode branch show typical Tafel behavior, and the cathode slope (bC) and anode slope (bA) and corrosion current density (Icorr) can be calculated by the Tafel extrapolation, as shown in Table 5. The improved corrosion efficiency values obtained from Tafel measurements were calculated according to the following Equation (3):
η % = i c o r r i c o r r 0 i c o r r · 100 %
where i c o r r 0 is the corrosion current density of the sample in the test solution for 2 h and icorr is the corrosion current density of the sample in the test solution for 200 h. After 2 h of immersion, several peeks occur in the current density plot when the applied potential is higher than Ecorr, indicating the pitting corrosion begins and the surface of the coating is activated. With the immersion time extending, the corrosion potential of sample 1# decreased from −350.97 mV to −486.49 mV. The corrosion current increased from 0.1709 μA cm−2 to 4.0059 μA cm−2, and the bA value increased. With an increase in immersion time, the anode reaction exhibited the primary control effect, and the sample exhibited obvious passivation. Improved corrosion efficiency increased by 95.73%.
Figure 8 shows the potentiodynamic polarization curves of sample 2# after corrosion in a 3.5 wt.% NaCl solution for 2 h and 200 h. The fitting results are shown in Table 6. The cathode curve and the anode curve exhibit typical Tafel behavior when immersed for 200 h. When immersed for 2 h, the anode curve does not show an obvious Tafel behavior, indicating that the pit potential Epit is approximately equal to Ecorr at this time, and the sample 2# coating corrodes under the self-corrosion potential. The corrosion potential decreased from −401.15 mV to −471.05 mV, and the corrosion current increased from 0.2418 μA cm−2 to 5.4439 μA cm−2. Both the cathodic and anodic reactions affect the surface electrochemical behavior of the sample, and anodic polarization acts as the main control mechanism. Improved corrosion efficiency increased by 95.56%.
Figure 9 shows the potentiodynamic polarization curves of sample 3# after corrosion in a 3.5 wt.% NaCl solution for 2 h and 200 h. The fitting results are shown in Table 7. With the extension of immersion time, the corrosion potential of the hard anodized coating decreases significantly, from −416.36 mV to −754.58 mV, and the corrosion current increases from 0.1371 μA cm−2 to 1.4051 μA cm−2. Improved corrosion efficiency increased by 90.24%. After being immersed for 2 h, the cathodic polarization is obvious, while the anodic polarization is slow. The substrate slowly dissolves and begins to pit, followed by passivation. When immersed for 200 h, the cathodic polarization process slows down and the anodic polarization process dominates. The corrosion rate of the sample is accelerated in this case, and the corrosion resistance seriously decreases.
Figure 10 shows the potentiodynamic polarization curves of sample 4# after corrosion in a 3.5 wt.% NaCl solution for 2 h and 200 h. The fitting results are shown in Table 8. The corrosion current first decreases slowly with the increase in potential and reaches a minimum value at Ecorr. Then the corrosion current increases rapidly with the small increase in potential. The Epit and Ecorr are closer to the generation of pitting corrosion, and the sample is passivated as the potential continues to rise. When the immersion time reaches 200 h, the corrosion potential decreases from −412.16 mV to −559.81 mV, and the corrosion current increases from 0.3069 μA cm−2 to 2.8404 μA cm−2, with both cathodic polarization and anodic polarization exhibiting typical Tafel behavior. Improved corrosion efficiency increased by 89.19%.

3.4. Summary

The electrochemical impedance spectra of aluminum alloy coatings with different surface treatment processes are summarized in Figure 11 and Table 9. When immersed for 2 h, the corrosion resistance order of the four samples is: 1# > 3# > 2# > 4#. Compared with sample 1#, the improved corrosion efficiency is increased by 58.65% (sample 2#), 41.77% (sample 3#), and 79.33% (sample 4#), respectively. When immersed for 200 h, the corrosion resistance order of the four samples is: 1# > 2# > 3# > 4#. Compared with sample 1#, the improved corrosion efficiency is increased by 39.48% (sample 2#), 93.33% (sample 3#), and 98.39% (sample 4#), respectively.
Under the double-layer protection of large particles and small powder, the coating of sample #1 is relatively dense, with a smaller porosity and obviously better corrosion resistance than the other three tested samples. It can be seen using the scanning electron microscope that the surface holes of sample #4 are not completely sealed, and there are many other surface defects that also offer the possibility of pitting corrosion. Due to the treatment process, the greater the thickness of sample #4’s oxide film, the more defects in appearance, the more cracks, and the poorer the uniformity and continuity of the oxide film’s surface. Therefore, in the early stages of corrosion, hard anodized coatings can also exhibit good corrosion resistance, but as immersion time is extended, the corrosion resistance of the sample decreases dramatically.
The polarization curves of different coated samples are summarized in Figure 12 and Table 10. When immersed for 2 h, the corrosion resistance order is 3# > 1# > 2# > 4#. Compared with sample 1#, the improved corrosion efficiency is increased by 41.49% (sample 2#) and 79.58% (sample 4#), respectively. While the inhibition efficiency is increased by 19.78% (sample 3#). From the corrosion potential observation of four coatings, sample 1# has the highest corrosion potential, indicating the best corrosion resistance. When immersed for 200 h, the corrosion resistance order becomes 3# > 4# > 1# > 2#. Compared with sample 1#, the inhibition efficiency is increased by 64.92% (sample 3#) and 29.09% (sample 4#), respectively. While the improved corrosion efficiency is increased by 35.90% (sample 2#). The corrosion potentials of the four samples move in the negative direction; samples 1# and 2# have the highest corrosion potentials, while sample 3#’s corrosion potential drops the most.
As for the electrochemical protection performance of the coating on aluminum alloy observed from the cathodic polarization, the hard anodized cathodic polarization curve of the sample 3# was the steepest when immersed for 2 h, indicating that it had good polarization performance, and the ordinary heat-sealing anodized sample (sample 4#) had the worst polarization performance and the flattest curve slope. When the immersion time reaches 200 h, the cathodic polarization curve of hard anodized sample 3# has the flattest slope, the worst polarization performance, and the weakest protection effect on the substrate.

4. Conclusions

In this work, the influence of four treated coatings on aluminum alloy profile coating surfaces on corrosion resistance was studied by static corrosion immersion tests and electrochemical tests, and the main conclusions are as follows: (1) When corroded in a 3.5 wt.% NaCl solution for 2 h, the corrosion inhibition performances of samples 2# and 4# are poor while the inhibition performances of samples 1# and 3# are good, and the inhibition performance follows the sequence: 1# > 3# > 2# > 4#. (2) When corroded in a 3.5 wt.% NaCl solution for 200 h, the corrosion inhibition performances of samples 1# and 2# are poor while the inhibition performances of samples 3# and 4# are good, and the inhibition performance follows the sequence: 3# > 4# > 1# > 2#. (3) With the increase in corrosion time, the corrosion inhibition performance of the four coated aluminum alloy materials decreased significantly, and the order of decline is 1# > 3# > 2# > 4#.

Author Contributions

Conceptualization, L.F. and X.H.; methodology, F.W.; software, F.W.; validation, Z.W., N.Y. and D.R.; formal analysis, F.W.; investigation, L.F.; resources, X.H.; data curation, F.W.; writing—original draft preparation, F.W.; writing—review and editing, X.H.; visualization, Z.W.; supervision, L.F.; project administration, F.W.; funding acquisition, X.H. All authors have read and agreed to the published version of the manuscript.

Funding

This work was supported by the Tribology Science Fund of the State Key Laboratory of Tribology (No. SKLTKF20B11) and the National Training Program of Innovation and Entrepreneurship for Undergraduates (No. 202304058).

Institutional Review Board Statement

Not applicable.

Informed Consent Statement

Not applicable.

Data Availability Statement

Not applicable.

Acknowledgments

The authors extend their appreciation to the Tribology Science Fund of the State Key Laboratory of Tribology (No. SKLTKF20B11) and the National Training Program of Innovation and Entrepreneurship for Undergraduates (No. 202304058).

Conflicts of Interest

The authors declare no conflict of interest.

References

  1. Sill, T.E.; Zaheer, W.; Valdes, C.G.; Balcorta, V.H.; Douglas, L.; Fletcher, T.; Steiger, S.; Spinner, N.S.; Verkhoturov, S.V.; Kalyanaraman, V.; et al. Mechanistic origins of corrosion protection of aluminum alloys by graphene/polyetherimide nanocomposite coatings. NPJ Mater. Degrad. 2023, 7, 35. [Google Scholar] [CrossRef]
  2. Rahmani, M.H.; Marhamati, F.; Haddadi, S.A.; Olivier, M.-G.; Mahdavian, M. N-doped carbon hollow sphere reservoirs containing Zn2+-mercaptobenzoxazole with pH-responsive function to fabricate a high-performance corrosion protective epoxy coating for aluminum alloy. Corros. Sci. 2023, 219, 111202. [Google Scholar] [CrossRef]
  3. Yang, M.; Lei, L.; Jiang, Y.; Xu, F.; Yin, C. Simultaneously improving tensile properties and stress corrosion cracking resistance of 7075-T6 aluminum alloy by USRP treatment. Corros. Sci. 2023, 218, 111211. [Google Scholar] [CrossRef]
  4. Zhang, P.; Xiong, Q.; Cai, Y.; Zhai, W.; Cai, M.; Cai, Z.; Zhu, J.; Gu, L. Dry fretting and sliding wear behavior of 7075-T651 aluminum alloy under linear reciprocating motion: A comparative study. Wear 2023, 526–527, 204942. [Google Scholar] [CrossRef]
  5. Li, X.; Zhao, S.; Jiang, L.; Lu, Y.; Gong, M.; Zhang, C.; Gao, M. Droplet detachment and motion behaviors in laser-MIG hybrid welding of aluminum alloy. Int. J. Heat Mass Transf. 2023, 210, 124165. [Google Scholar] [CrossRef]
  6. Van Truong, P.; Van Bo, N.; Van Minh, N.; Anh, N.V.; Kumar, G.S.; Shkir, M. Investigation of corrosion and wear resistance of PEO coated D16T aluminium alloys in the marine tropical climate conditions. Mater. Chem. Phys. 2022, 290, 126587. [Google Scholar] [CrossRef]
  7. Li, T.; Li, X.G.; Dong, C.F.; Cheng, Y.F. Characterization of Atmospheric Corrosion of 2A12 Aluminum Alloy in Tropical Marine Environment. J. Mater. Eng. Perform. 2010, 19, 591–598. [Google Scholar] [CrossRef]
  8. Cui, Z.Y.; Li, X.G.; Man, C.; Xiao, K.; Dong, C.F.; Wang, X.; Liu, Z.Y. Corrosion Behavior of Field-Exposed 7A04 Aluminum Alloy in the Xisha Tropical Marine Atmosphere. J. Mater. Eng. Perform. 2015, 24, 2885–2897. [Google Scholar] [CrossRef]
  9. Wang, B.; Zhang, L.; Jiang, H.; Li, X.; Mu, X. Atmospheric corrosion comparison of antirust aluminum exposed to industrial and coastal atmospheres. Mater. Corros. 2018, 69, 1516–1525. [Google Scholar] [CrossRef]
  10. Gu, T.; Liu, Y.; Peng, C.; Zhang, P.; Wang, Z. Initial atmospheric corrosion of zinc-aluminum-magnesium coated steel and galvanized steel in regions of extremely cold and industrial climate. Mater. Chem. Phys. 2022, 291, 126686. [Google Scholar] [CrossRef]
  11. Zhu, Y.-Q.; Li, J.-M.; Zhao, F.-C.; Dai, L.; Su, Y. The Characterization Research on Atmospheric Environmental Corrosion of Aluminum Alloy. In Proceedings of the 4th International Conference on System Reliability and Safety Engineering (SRSE), Guangzhou, China, 15–18 December 2022; pp. 399–406. [Google Scholar] [CrossRef]
  12. Miramontes, J.C.; Tiburcio, C.G.; Mata, E.G.; Alcála, M.E.; Maldonado-Bandala, E.; Lara-Banda, M.; Nieves-Mendoza, D.; Olguín-Coca, J.; Zambrano-Robledo, P.; López-León, L.D.; et al. Corrosion Resistance of Aluminum Alloy AA2024 with Hard Anodizing in Sulfuric Acid-Free Solution. Materials 2022, 15, 6401. [Google Scholar] [CrossRef]
  13. EL Mazyani, A.; Chafi, M.; Essahli, M. Assessment of AA5005 aluminum alloy corrosion resistance by Direct Blue 15 inhibitor in sodium chloride medium. Mater. Today Proc. 2021, 37, 3882–3888. [Google Scholar] [CrossRef]
  14. Zhang, S.; Wang, C.; Zhao, S.; Niu, A.; Ma, Y.; Liu, B. Enhanced long-term corrosion protection of 2A14 aluminum alloy: Hybrid effect of micro-arc oxidation coating and cerium based conversion treatment. Surf. Coat. Technol. 2023, 464, 129579. [Google Scholar] [CrossRef]
  15. Minhas, B.; Dino, S.; Huang, L.; Wu, D. Active Corrosion Protection by Epoxy Coating on Li2CO3-Pretreated Anodized Aluminum Alloy 2024-T3. Front. Mater. 2022, 8, 804328. [Google Scholar] [CrossRef]
  16. Lin, X.H.; Huang, H.B.; Zhou, C.S.; Liu, J.C.; Saleh, M.; Wang, Z.Z. Research on surface modification of anodized aluminum alloy using piezoelectric machine hammer peening. Int. J. Adv. Manuf. Technol. 2019, 104, 1211–1219. [Google Scholar] [CrossRef]
  17. Badhotiya, G.K.; Saini, A.; Singh, D.; Chauhan, A.S. Oxime-modified aluminum (III) isopropoxide: A promising sol-gel precursor coating to improve mechanical strength of an aluminum alloy. Mater. Today Proc. 2021, 46, 10600–10603. [Google Scholar] [CrossRef]
  18. Kumar, J.J.; Satyanarayana, V.V.; Reddy, G.S.; Reddy, B.R.; Dharmavarapu, P. Effect of Al2TiO5 powder coating on the tribological, corrosion and mechanical properties of AISI 316L stainless steel. Mater. Res. Express 2023, 10, 066511. [Google Scholar] [CrossRef]
  19. Li, M.; Huang, H.-L.; Wu, J.-M.; Wu, Y.-R.; Shi, Z.-A.; Zhang, J.-X.; Shi, Y.-S. Preparation and properties of Si3N4 ceramics via digital light processing using Si3N4 powder coated with Al2O3-Y2O3 sintering additives. Addit. Manuf. 2022, 53, 102713. [Google Scholar] [CrossRef]
  20. Martínez-Viademonte, M.P.; Abrahami, S.T.; Hack, T.; Burchardt, M.; Terryn, H. A Review on Anodizing of Aerospace Aluminum Alloys for Corrosion Protection. Coatings 2020, 10, 1106. [Google Scholar] [CrossRef]
  21. Gordeeva, E.O.; Roslyakov, I.V.; Napolskii, K.S. Aluminium anodizing in selenic acid: Electrochemical behaviour, porous structure, and ordering regimes. Electrochim. Acta 2019, 307, 13–19. [Google Scholar] [CrossRef]
  22. Ali, I.; Quazi, M.M.; Zalnezhad, E.; Sarhan, A.A.D.; Sukiman, N.L.; Ishak, M. Hard Anodizing of Aerospace AA7075-T6 Aluminum Alloy for Improving Surface Properties. Trans. Indian Inst. Met. 2019, 72, 2773–2781. [Google Scholar] [CrossRef]
  23. Li, J.; Wei, H.; Zhao, K.; Wang, M.; Chen, D.; Chen, M. Effect of anodizing temperature and organic acid addition on the structure and corrosion resistance of anodic aluminum oxide films. Thin Solid Film. 2020, 713, 138359. [Google Scholar] [CrossRef]
  24. Atz-Dick, P.; Konrath, A.; Melo, Y.R.; Radtke, C.; Dick, L.F. Aluminum anodizing with simultaneous silanization for increased hydrophobicity and corrosion protection. Appl. Surf. Sci. 2022, 593, 153392. [Google Scholar] [CrossRef]
  25. Mirabedini, S.M.; Moradian, S.; Scantlebury, J.D.; Thompson, G.E. Characterization and corrosion performance of powder coated aluminium alloy. Iran Polym. J. 2003, 12, 261–269. [Google Scholar]
  26. Lutz, A.; Halseid, M.C.; De Graeve, I. Corrosion performance of powder-coated aluminum profiles with increased trace element content. Mater. Corros. 2022, 73, 1575–1585. [Google Scholar] [CrossRef]
  27. Halseid, M.; Gundersen, J.T.B.; Bauger, Ø.; Hentschel, T. The effect of trace additions of copper and pretreatment conditions on the filiform corrosion of powder-coated aluminium alloy AA6060. Surf. Interface Anal. 2019, 51, 1225–1230. [Google Scholar] [CrossRef]
  28. Niedźwiedź, M.; Bara, M.; Barylski, A. Dependence of the Surface Morphology and Micromechanical and Sclerometric Properties of Al2O3 Layers on the Parameters of Anodizing Aluminum Alloy. Materials 2022, 15, 8482. [Google Scholar] [CrossRef]
  29. Conde, A.; de Damborenea, J. Electrochemical impedance spectroscopy for studying the degradation of enamel coatings. Corros. Sci. 2002, 44, 1555–1567. [Google Scholar] [CrossRef]
  30. Wong, K.P.; Alkire, R.C. Local Chemistry and Growth of Single Corrosion Pits in Aluminum. J. Electrochem. Soc. 1990, 137, 3010. [Google Scholar] [CrossRef]
  31. Ferreira, S.; Rocha, L.; Ariza, E.; Sequeira, P.; Watanabe, Y.; Fernandes, J. Corrosion behaviour of Al/Al3Ti and Al/Al3Zr functionally graded materials produced by centrifugal solid-particle method: Influence of the intermetallics volume fraction. Corros. Sci. 2011, 53, 2058–2065. [Google Scholar] [CrossRef]
Figure 1. Pre-corrosion micromorphology of aluminum alloy samples with different surface treatments. (a) sand powder coating, (b) flat powder coating, (c) hard anodizing film, and (d) ordinary anodized heat seal hole specimen.
Materials 16 06027 g001
Figure 2. Micromorphology of different treated samples after corrosion in 3.5 wt.% NaCl solution for 200 h. (a) sand powder coating, (b) flat powder coating, (c) hard anodizing film, and (d) ordinary anodized heat seal hole specimen.
Materials 16 06027 g002
Figure 3. Nyquist plot (a), Bode impedance plot (b), and equivalent circuit (c) of sample 1# after corrosion in 3.5 wt.% NaCl solution for 2 h and 200 h.
Materials 16 06027 g003
Figure 4. Nyquist plot (a), Bode impedance plot (b), and equivalent circuit (c) of sample 2# after corrosion in 3.5 wt.% NaCl solution for 2 h and 200 h.
Materials 16 06027 g004
Figure 5. Nyquist plot (a), Bode impedance plot (b), and equivalent circuit (c) of sample 3# after corrosion in 3.5 wt.% NaCl solution for 2 h and 200 h.
Materials 16 06027 g005
Figure 6. Nyquist plot (a), Bode impedance plot (b), and equivalent circuit (c) of sample 4# after corrosion in 3.5 wt.% NaCl solution for 2 h and 200 h.
Materials 16 06027 g006
Figure 7. Potentiodynamic polarization curves of sample 1# after corrosion in 3.5 wt.% NaCl solution for 2 h and 200 h.
Materials 16 06027 g007
Figure 8. Potentiodynamic polarization curves of sample 2# after corrosion in 3.5 wt.% NaCl solution for 2 h and 200 h.
Materials 16 06027 g008
Figure 9. Potentiodynamic polarization curves of sample 3# after corrosion in 3.5 wt.% NaCl solution for 2 h and 200 h.
Materials 16 06027 g009
Figure 10. Potentiodynamic polarization curves of sample 4# after corrosion in 3.5 wt.% NaCl solution for 2 h and 200 h.
Materials 16 06027 g010
Figure 11. Nyquist plots (a) and Bode impedance plots (b) of different samples after corrosion in 3.5 wt.% NaCl solution for 2 h and 200 h.
Materials 16 06027 g011
Figure 12. Potentiodynamic polarization curves of different samples after corrosion in 3.5 wt.% NaCl solution for 2 h and 200 h.
Materials 16 06027 g012
Table 1. The fitting results of sample 1# from the electrochemical tests.
SampleRs
/(Ω·cm2)
CPEox-Y0
/(sn·Ω−1·cm−1)
CPE-noxR1
/(Ω·cm2)
CPEdl-Y0
/(sn·Ω−1·cm−1)
CPE-ndlRct
/(kΩ·cm2)
v (%)
1#, 2 h99.53 ± 6.232.1170 × 10−90.92838.0740 × 1049.0023 × 10−80.54341091.20 ± 50.12-
1#, 200 h83.20 ± 4.302.1803 × 10−70.82461.4101 × 1065.0555 × 10−60.2777179.15 ± 2.4483.58
Table 2. The fitting results of sample 2# from the electrochemical tests.
SampleRs
/(Ω·cm2)
CPEox-Y0
/(sn·Ω−1·cm−1)
CPE-noxR1
/(Ω·cm2)
CPEdl-Y0
/(sn·Ω−1·cm−1)
CPE-ndlRct
/(kΩ·cm2)
v (%)
2#, 2 h133.2 ± 10.21.4130 × 10−90.95433.8050 × 1037.976 × 10−70.5412451.16 ± 23.87-
2#, 200 h116.1 ± 7.36.7045 × 10−70.76992.5064 × 1053.1047 × 10−50.3362108.43 ± 2.1775.97
Table 3. The fitting results of sample 3# from the electrochemical tests.
SampleRs
/(Ω·cm2)
CPEox-Y0
/(sn·Ω−1·cm−1)
CPE-noxR1
/(Ω·cm2)
CPEdl-Y0
/(sn·Ω−1·cm−1)
CPE-ndlRct
/(kΩ·cm2)
v (%)
3#, 2 h49.39 ± 3.43.6644 × 10−80.86851.410 × 1038.3306 × 10−70.2883635.42 ± 10.15-
3#, 200 h55.91 ± 2.64.5205 × 10−50.57882.512 × 1031.2077 × 10−40.546711.94 ± 0.9598.12
Table 4. The fitting results of sample 4# from the electrochemical tests.
SampleRs
/(Ω·cm2)
CPEox-Y0
/(sn·Ω−1·cm−1)
CPE-noxR1
/(Ω·cm2)
CPEdl-Y0
/(sn·Ω−1·cm−1)
CPE-ndlRct
/(kΩ·cm2)
v (%)
4#, 2 h62.41 ± 7.482.3807 × 10−70.83424.2038 × 1041.8558 × 10−51.543225.5 ± 3.4-
4#, 200 h47.17 ± 6.262.534 × 10−60.85231.044 × 1037.6539 × 10−50.29382.87 ± 0.2298.73
Table 5. Potentiodynamic polarization parameters of sample 1# after corrosion in 3.5 wt.% NaCl solution for 2 h and 200 h.
SampleIcorr/(μA cm−2)E0 (mV)bC/(mV dec−1)bA/(mV dec−1)η (%)
1#, 2 h0.1709 ± 0.0422−350.97 ± 7.56160.20226.68-
1#, 200 h4.0059 ± 0.1130−486.49 ± 4.50163.94298.1995.73
Table 6. Potentiodynamic polarization parameters of sample 2# after corrosion in 3.5 wt.% NaCl solution for 2 h and 200 h.
SampleIcorr/(μA cm−2)E0 (mV)bC/(mV dec−1)bA/(mV dec−1)η (%)
2#, 2 h0.2418 ± 0.0330−401.15 ± 5.24337.009.08-
2#, 200 h5.4439 ± 0.2503−471.05 ± 4.16176.98331.6195.56
Table 7. Potentiodynamic polarization parameters of sample 3# after corrosion in 3.5 wt.% NaCl solution for 2 h and 200 h.
SampleIcorr/(μA cm−2)E0 (mV)bC/(mV dec−1)bA/(mV dec−1)η (%)
3#, 2 h0.1371 ± 0.0214−416.36 ± 4.88532.7311.25-
3#, 200 h1.4051 ± 0.0832−754.58 ± 9.00125.20323.8390.24
Table 8. Potentiodynamic polarization parameters of sample 4# after corrosion in 3.5 wt.% NaCl solution for 2 h and 200 h.
SampleIcorr/(μA cm−2)E0 (mV)bC/(mV dec−1)bA/(mV dec−1)η (%)
4#, 2 h0.3069 ± 0.0412−412.16 ± 3.1069.2210.02-
4#, 200 h2.8404 ± 0.1004−559.81 ± 5.24173.79165.0289.19
Table 9. The fitting results of the different samples from the electrochemical tests.
SampleRs
/(Ω·cm2)
CPEox-Y0
/(sn·Ω−1·cm−1)
CPE-noxR1
/(Ω·cm2)
CPEdl-Y0
/(sn·Ω−1·cm−1)
CPE-ndlRct
/(kΩ·cm2)
v (%)
2 h 1#995.032.117 × 10−90.928380749.0023 × 10−80.54341091.2-
2 h 2#1343.21.413 × 10−90.954338057.976 × 10−70.5412451.1658.65
2 h 3#49.393.6644 × 10−80.868514108.3306 × 10−70.2883635.4241.77
2 h 4#62.412.3807 × 10−70.83424.2038 × 1041.8558 × 10−51.543225.579.33
200 h 1#83.22.1803 × 10−70.8246141,0105.0555 × 10−60.2777179.15-
200 h 2#116.16.7045 × 10−70.769925,0643.1047 × 10−50.3362108.4339.48
200 h 3#55.914.5205 × 10−50.578825121.2077 × 10−40.546711.9493.33
200 h 4#47.172.534 × 10−60.852310.447.6539 × 10−50.29382.8798.39
Table 10. Potentiodynamic polarization parameters of different samples after corrosion in 3.5 wt.% NaCl solution for 2 h and 200 h.
SampleIcorr/(μA cm−2)E0 (mV)bC/(mV dec−1)bA/(mV dec−1)η (%)
2 h 1#0.1709−350.97160.20226.68-
2 h 2#0.2418−401.15337.009.0841.49
2 h 3#0.1371−416.36532.7311.25−19.78
2 h 4#0.3069−412.1669.2210.0279.58
200 h 1#4.0059−486.49163.94298.19-
200 h 2#5.4439−471.05176.98331.6135.90
200 h 3#1.4051−754.58125.20323.83−64.92
200 h 4#2.8404−559.81173.79165.02−29.09
Disclaimer/Publisher’s Note: The statements, opinions and data contained in all publications are solely those of the individual author(s) and contributor(s) and not of MDPI and/or the editor(s). MDPI and/or the editor(s) disclaim responsibility for any injury to people or property resulting from any ideas, methods, instructions or products referred to in the content.

