Article

Influence of Nb and Mo Substitution on the Structure and Magnetic Properties of a Rapidly Quenched Fe79.4Co5Cu0.6B15 Alloy

1
Lukasiewicz Research Network—Institute of Non-Ferrous Metals, 5 Sowinskiego St., 44-100 Gliwice, Poland
2
Institute of Metallurgy and Materials Science, Polish Academy of Sciences, 25 Reymonta St., 30-059 Krakow, Poland
3
Laryngology Department, School of Medicine in Katowice, Medical University of Silesia in Katowice, 20-24 Francuska St., 40-027 Katowice, Poland
4
Faculty of Mechanical Engineering, PhD School, Silesian University of Technology, 18A Konarskiego St., 44-100 Gliwice, Poland
*
Author to whom correspondence should be addressed.
Materials 2023, 16(18), 6288; https://doi.org/10.3390/ma16186288
Submission received: 7 August 2023 / Revised: 13 September 2023 / Accepted: 14 September 2023 / Published: 19 September 2023

Abstract

:
The importance of amorphous and nanocrystalline Fe-based soft magnetic materials is increasing annually. Thus, characterisation of the chemical compositions, alloying additives, and crystal structures is significant for obtaining the appropriate functional properties. The purpose of this work is to present comparative studies on the influence of Nb (1, 2, 3 at.%) and Mo (1, 2, 3 at.%) in Fe substitution on the thermal stability, crystal structure, and magnetic properties of a rapidly quenched Fe79.4Co5Cu0.6B15 alloy. Additional heat treatments in a vacuum (260–640 °C) were performed for all samples based on the crystallisation kinetics. Substantial improvement in thermal stability was achieved with increasing Nb substitution, while this effect was less noticeable for Mo-containing alloys. The heat treatment optimisation process showed that the least lossy states (with a minimum value of coercivity below 10 A/m and high saturation induction up to 1.7 T) were the intermediate state of the relaxed amorphous state and the nanocomposite state of nanocrystals immersed in the amorphous matrix obtained by annealing in the temperature range of 340–360 °C for 20 min. Only for the alloy with the highest thermal stability (Nb = 3%), the α-Fe(Co) nanograin grows, without the co-participation of the hard magnetic Fe3B, in a relatively wide range of annealing temperatures up to 460 °C, where the second local minimum in coercivity and core power losses exists. For the remaining annealed alloys, due to lower thermal stability than the Nb = 3% alloy, the Fe3B phase starts to crystallise at lower annealing temperatures, making an essential contribution to magneto-crystalline anisotropy, thus the substantial increase in coercivity and induction saturation. The air-annealing process tested on the studied alloys for optimal annealing conditions has potential use for this type of material. Additionally, optimally annealed Mo-containing alloys are less lossy materials than Nb-containing alloys in a frequency range up to 400 kHz and magnetic induction up to 0.8 T.

1. Introduction

Although amorphous and nanocrystalline soft magnetic materials have been studied for many years, they are constantly being developed and underestimated. The (Fe, Co)-based alloys have constituted an important group of soft magnetic materials where applications for high magnetic flux densities are required (data storage, pole tips for high-field magnets, and transformers) [1,2]. Their magnetic properties are tailored by compositional variation and structure induced by the annealing process [3,4]. The combination of superior soft magnetic properties, low power losses, and high saturation magnetisation has fueled interest in Fe-based nanocrystalline materials. Today, Finemet alloys have excellent soft magnetic properties [5], while Nanoperm alloys were developed to achieve high saturation magnetisation [6]. Moreover, by introducing Co to Nanoperm, Hitperm alloys were developed to increase the Curie temperature [7]. Many other studies have shown that a small amount of Co-doping coupled with appropriate annealing is an effective method of improving the saturation magnetisation of many Fe-based alloys [8,9,10,11]. Co leads to the alignment of Fe moments, thus increasing the atomic magnetic moment of individual Fe atoms [12]. Unfortunately, high Co addition deteriorates soft magnetic properties due to its large magneto-crystalline anisotropy, which is in accordance with the Slater-Pauling curves [13,14].
Cu is insoluble in Fe-based alloys and can refine the primary particles and promote the uniformity of grain dispersion. In Fe-based alloys, during the annealing process, Cu atoms agglomerate in clusters and act as nucleation sites for the α-Fe particles. The crystallisation behaviour of Cu-free alloys is completely different from that of Cu-containing alloys. Additionally, the appropriate amount of Cu addition can optimise and allow the highest possible magnetic properties [15,16]. The co-presence of Nb and Cu can further refine the microstructure. Nb promotes the Cu cluster’s nucleation on a much finer scale, impacts the grain size, and hinders the growth of the α-Fe particles [17].
Additionally, 3% Nb is the maximum limit of effective grain refining [18]. For Si-containing alloys, Mo and W are less effective than Nb in limiting grain growth [19]. Both elements (Mo and Nb) are good grain growth inhibitors in Si-containing alloys [20,21]. Moreover, both elements provide improved GFA, thermal stability, and a shift to higher temperatures at the beginning of the alpha-Fe phase crystallisation [22,23,24]. For this reason, they are crucial to obtaining amorphous materials and enabling proper, controlled processing. However, Mo and Nb are paramagnetic elements and magnetically affect the local atomic environment around Fe. A larger addition of these elements may negatively affect the magnetic properties of the alloy (e.g., saturation induction); hence, it is not recommended to use < 5 at.% Mo or Nb for materials that require a high Bs value [25,26,27]. It is worth noting that, currently, a large proportion of commercially available Fe-based metallic ribbons contain the addition of Nb to obtain the appropriate structure and magnetic properties.
Zhu et al. reported the possibility of partial Nb replacement by Mo in Fe80(Nb1-xMox)B15 alloys, which improved the material’s thermal stability and magnetic properties. Similar work was carried out by Ramasamy et al., comparing the effect of Mo and Nb addition on Fe37.5Co37.5B20Si5 alloy in the form of rods, showing that at 4 at.% Mo addition, the material has better soft magnetic properties and retains similar thermal stability as the material with Nb addition. However, a further increase in Mo reduced the magnetic and thermal properties [25]. Therefore, it is necessary to study the effect of minor additions of Nb and Mo on the magnetic properties, thermal stability, and crystallisation kinetics of the Si-free Fe-B metallic ribbons.
This work comparatively studies the influence of Nb and Mo additions on the B-rich Fe79.4Co5Cu0.6B15 alloy. The effect of the increase in the amount of grain refining elements (Nb and Mo) for Fe up to 3 at.% on magnetic properties, such as the B(H) relationship, core losses, and complex magnetic permeability as a function of annealing temperature during the conventional isothermal annealing process, is evaluated. For optimised heat-treated conditions, the crystal structure is then verified by X-ray diffraction and transmission electron microscopy. This information provides deeper insight into the impact of grain refining on comprehensive magnetic properties.

2. Materials and Methods

The amorphous alloys with nominal composition Fe79.4-xCo5MxCu0.6B15, M = Nb, Mo, x = 1, 2, 3 at.% in the form of a ribbon with a thickness of approximately 18–23 µm and a width of 5–7 mm were obtained via the melt spinning technique on a 650 mm diameter Cu wheel in an air atmosphere. The primary alloys were produced from pure chemical elements (Fe (3N), Co (3N), and Cu (3N)) and FeNb65 (2.5N) and FeB18 (2.5N) alloys using the induction furnace SecoWarwick VIM-LAB 50–60 (SecoWarwick S.A., Swiebodzin, Poland). For the annealing process and subsequent magnetic measurements, the amorphous ribbon was wound into toroidal cores with an inner diameter of ~20 mm and an outer diameter of ~30 mm. The toroidal cores were isothermally annealed for 20 min in a vacuum furnace (10−3 mbar) at different temperatures (260–640 °C) to achieve the nanocrystalline state. The structural properties of the as-spun and heat-treated ribbons were studied by X-ray diffraction (XRD). XRD measurements were performed at room temperature using a Rigaku MiniFlex 600 diffractometer (Rigaku Co., Tokyo, Japan) equipped with CuKα radiation (λ = 0.1542 nm), Kβ Ni filter, and the D/teX Ultra-high-speed silicon strip detector. The crystallisation processes were monitored using differential scanning calorimetry (DSC) performed with a 10 °C/min heating rate using the thermal analyser Netzsch DSC 214 Polyma (NETZSCH, Houston, TX, USA). Transmission electron microscopy (TEM) images in the bright-field (BF) mode and selected area diffraction patterns (SADPs) were recorded for the selected annealed samples using the Tecnai G2 F20 (200 kV) electron microscope (FEI, Hillsboro, OR, USA). The Remacomp C-1200 (MAGNET-PHYSIK Dr. Steingroever GmbH) magnetic measurement system was used to determine hysteresis and magnetic properties (saturation induction Bs, coercivity Hc, core power losses P10/50, i.e., in B = 1 T and f = 50 Hz) of the annealed samples. Additionally, for samples annealed at optimum conditions, the Ps parameter was measured in the frequency range f = 50 Hz–400 kHz and the magnetic induction B = 0.1–0.8 T. For samples annealed at characteristic temperatures, the complex magnetic permeability at room temperature in the frequency range f = 104–108 Hz was determined using the Agilent 4294A impedance analyser (Agilent, Santa Clara, CA, USA).

3. Results and Discussion

The X-ray diffraction method verified the amorphousness of the quenched as-spun ribbons; all recorded patterns possessed only diffused maxima characteristics for a fully amorphous state. Figure 1a depicts the DSC curves of the as-spun alloys, showing that the crystallisation of all ribbons proceeded in two stages: primary crystallisation of α-Fe(Co) and secondary Fe-B phase crystallisation. The onset of the primary crystallisation peak (Tx1) value and both crystallisation peaks (Tp1, Tp2) were marked in the figure, while all crystallisation temperatures with the temperature interval (ΔTx = Tx2 − Tx1) were gathered in Table 1. Nb and Mo for Fe substitution increased the primary crystallisation temperature (Tx1) with substitution content. However, the temperature interval (ΔTx) increased substantially for Nb-containing alloys. The effect of Mo substitution on ΔTx was lower than for Nb. This indicates that Nb substitution might enhance the thermal stability of the alloy matrix, which is beneficial for crystallisation heat treatment.
The kinetics of α-Fe type phase crystallisation (primary crystallisation peak) were studied using the DSC method by performing measurements with heating rates ranging from 10 to 50 °C/min. The Kissinger model [28] was used to determine the average activation energies for such a non-isothermal crystallisation process. This method is based on Equation (1):
l n ϕ T p 2 = l n A 0 R E a E a R T p ,
where ϕ is the heating rate, T p is the temperature of the crystallisation peak, E a is the activation energy, R is the gas constant, and A 0 is the pre-exponential factor. By linear fitting of l n ϕ / T p 2 vs. 1 / T p curves, the average activation energy Ea of the process was determined from the slopes of these curves. The Kissinger plots and calculated Ea values are presented in Figure 1b. The Ea values correlated positively with Tx1 for the Mo-containing ribbons, where Ea increased with Tx1 from 219.8 kJ/mol for Mo = 1% up to 236.3 kJ/mol for Mo = 3%. There was some peculiar behaviour for the Nb-containing alloys, where ribbons with Nb = 2% and Nb = 3% Ea values were similar (Ea = 231 kJ/mol), while there were no changes in the Tx1 increase. Calculated Ea values, as an extension of the values obtained for Fe85B15 (199.1 kJ/mol) and Fe84.6Cu0.6B15 (223.4 kJ/mol) alloys, fit into the obtained trend of values [29].
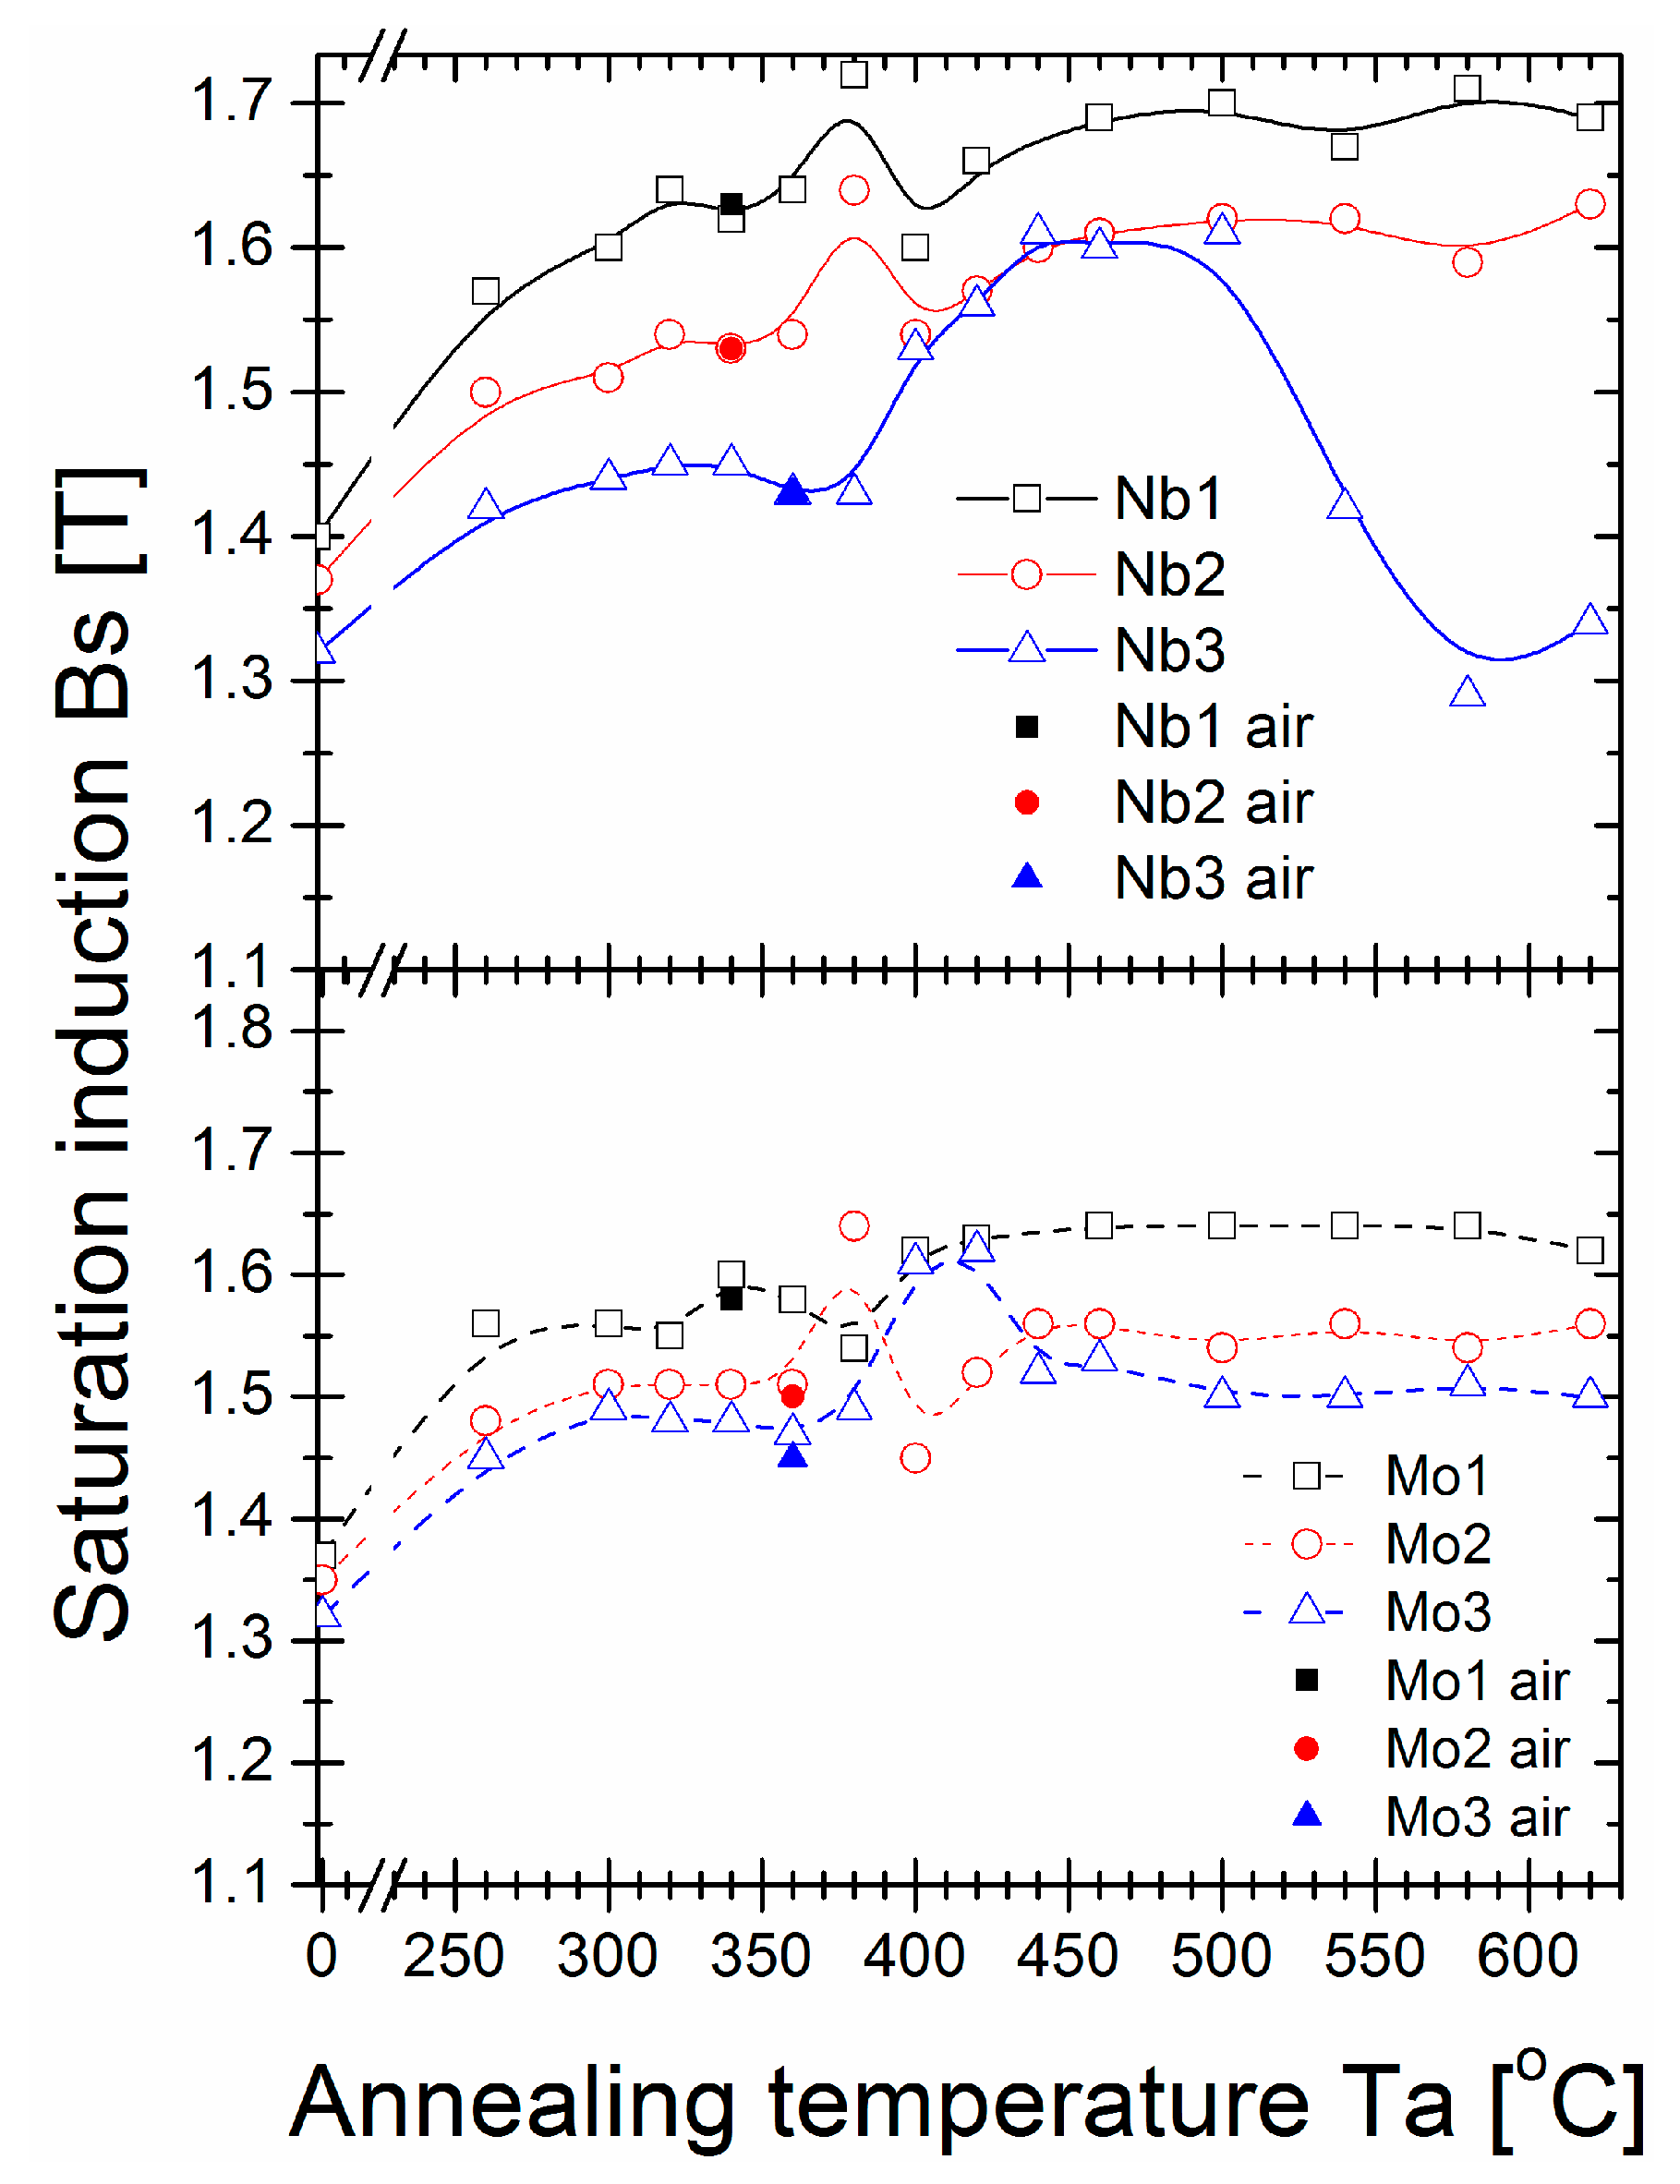
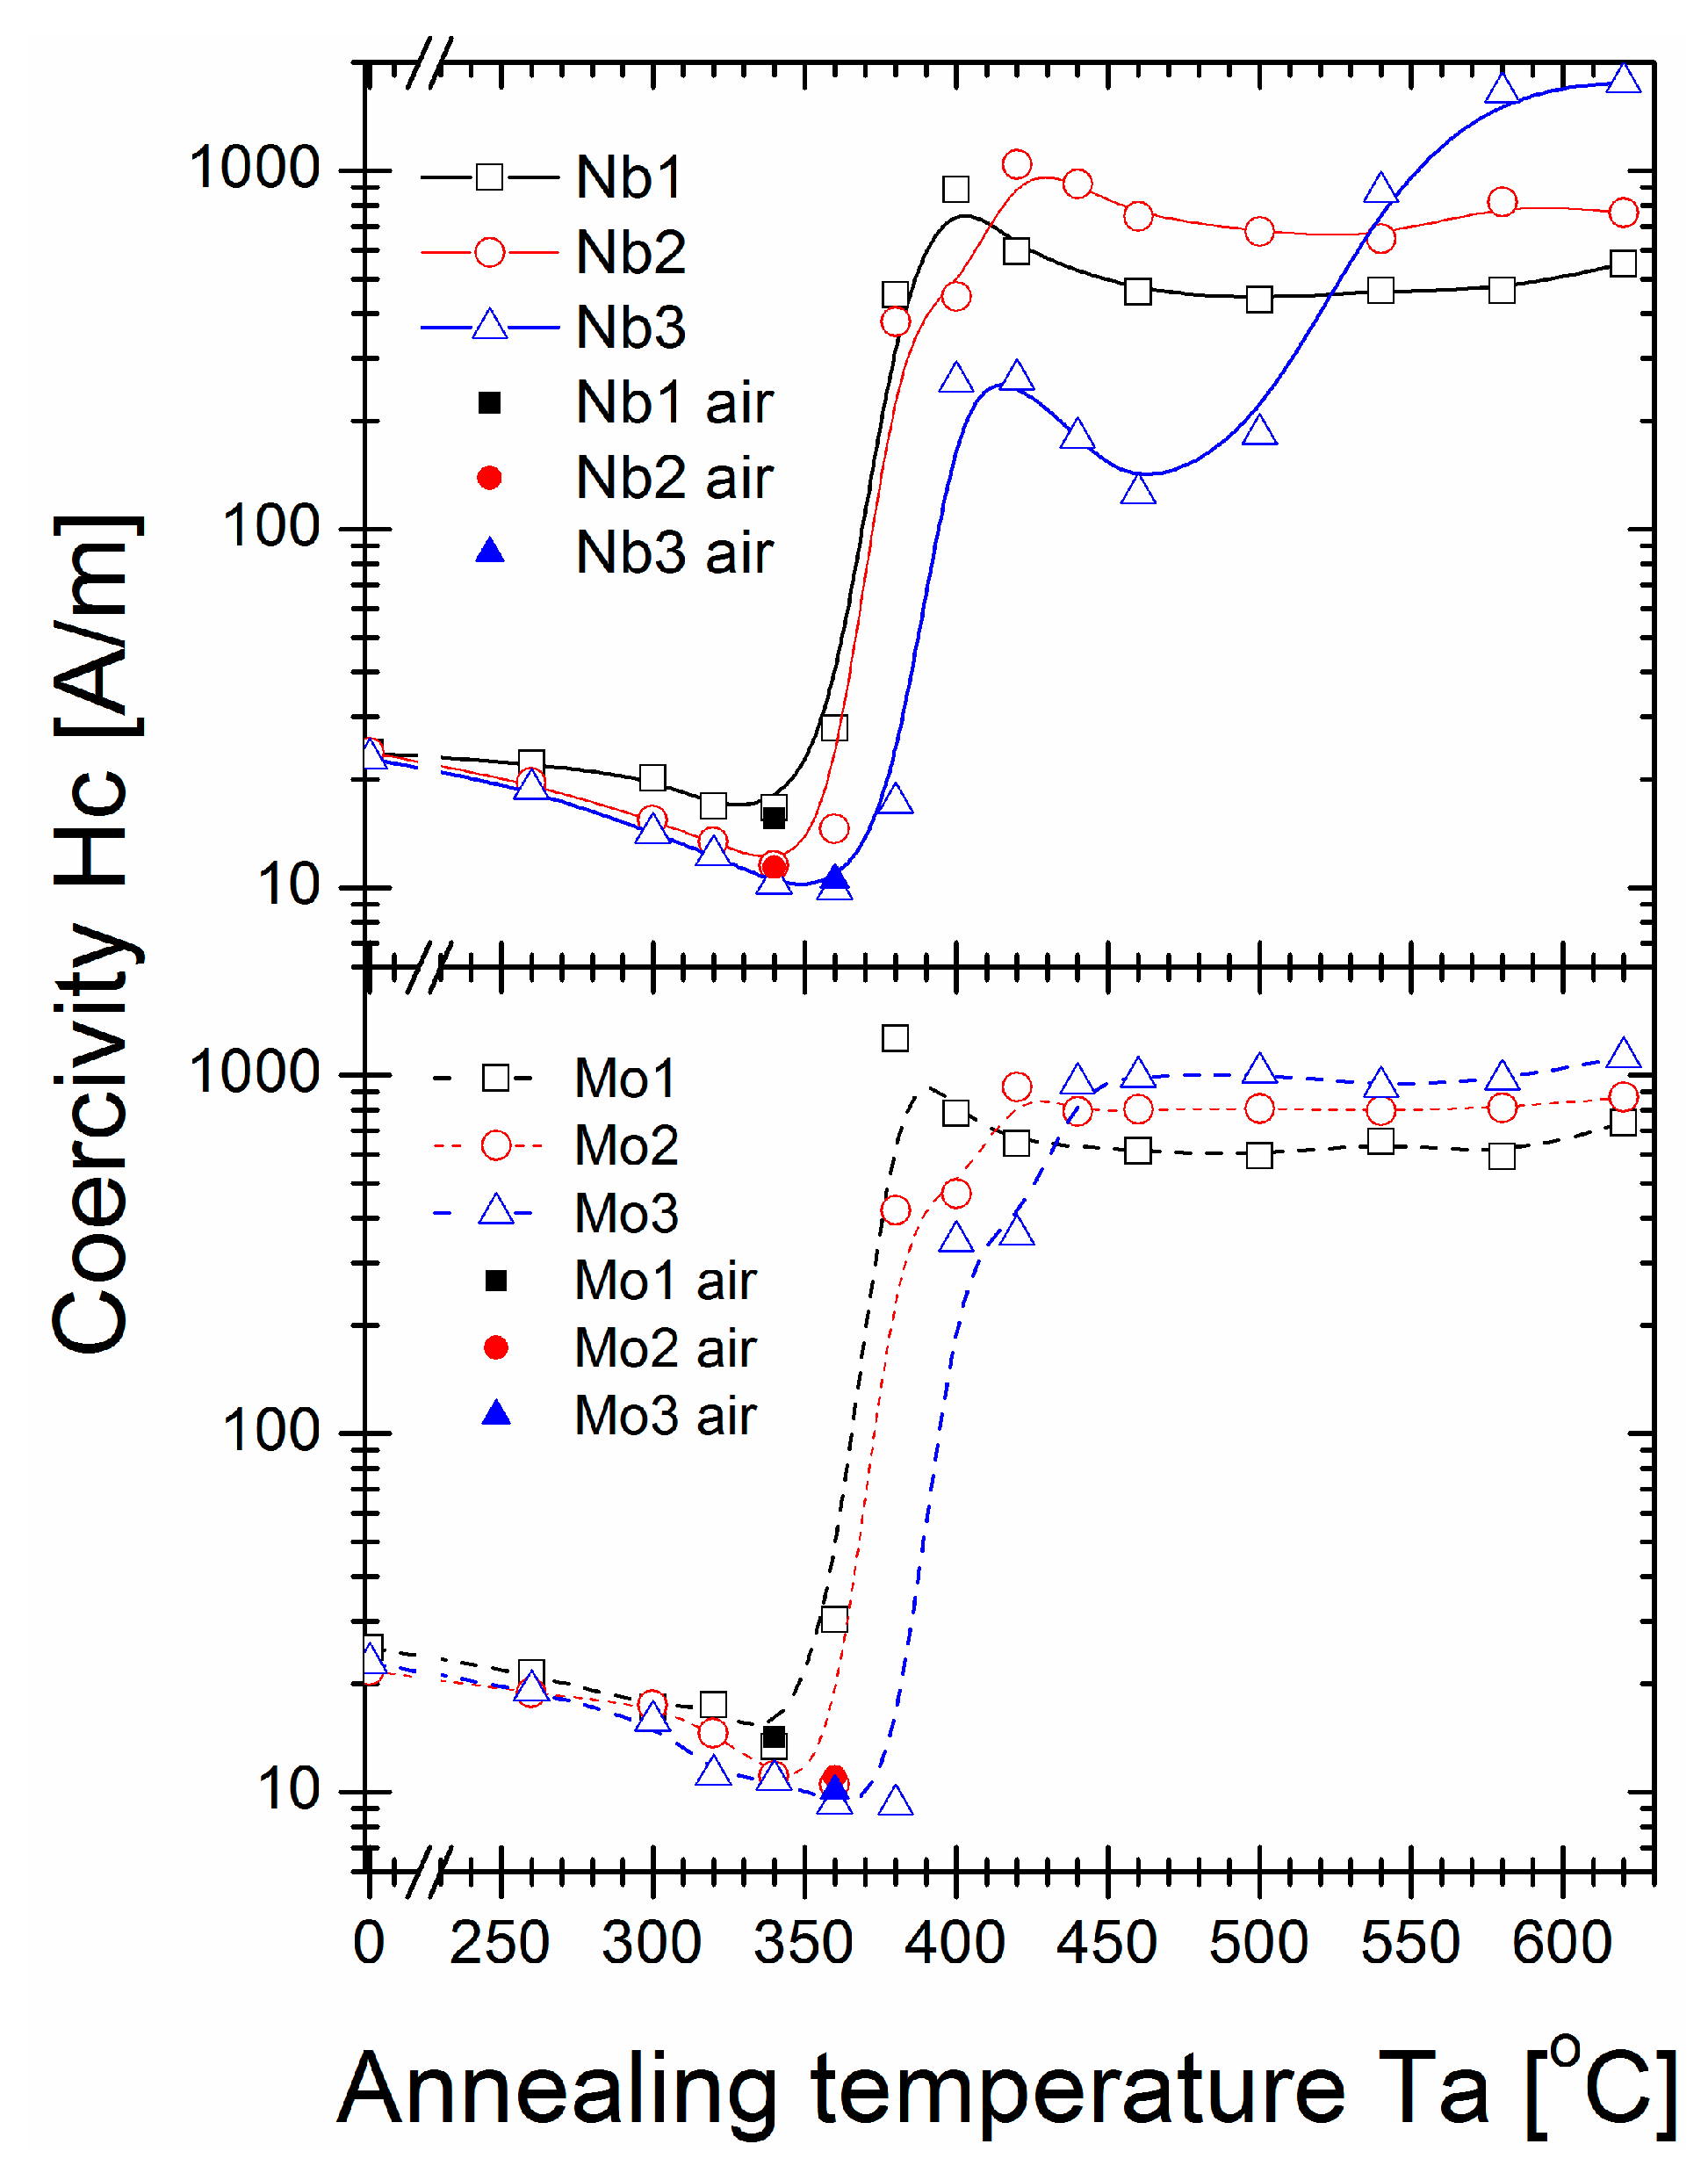
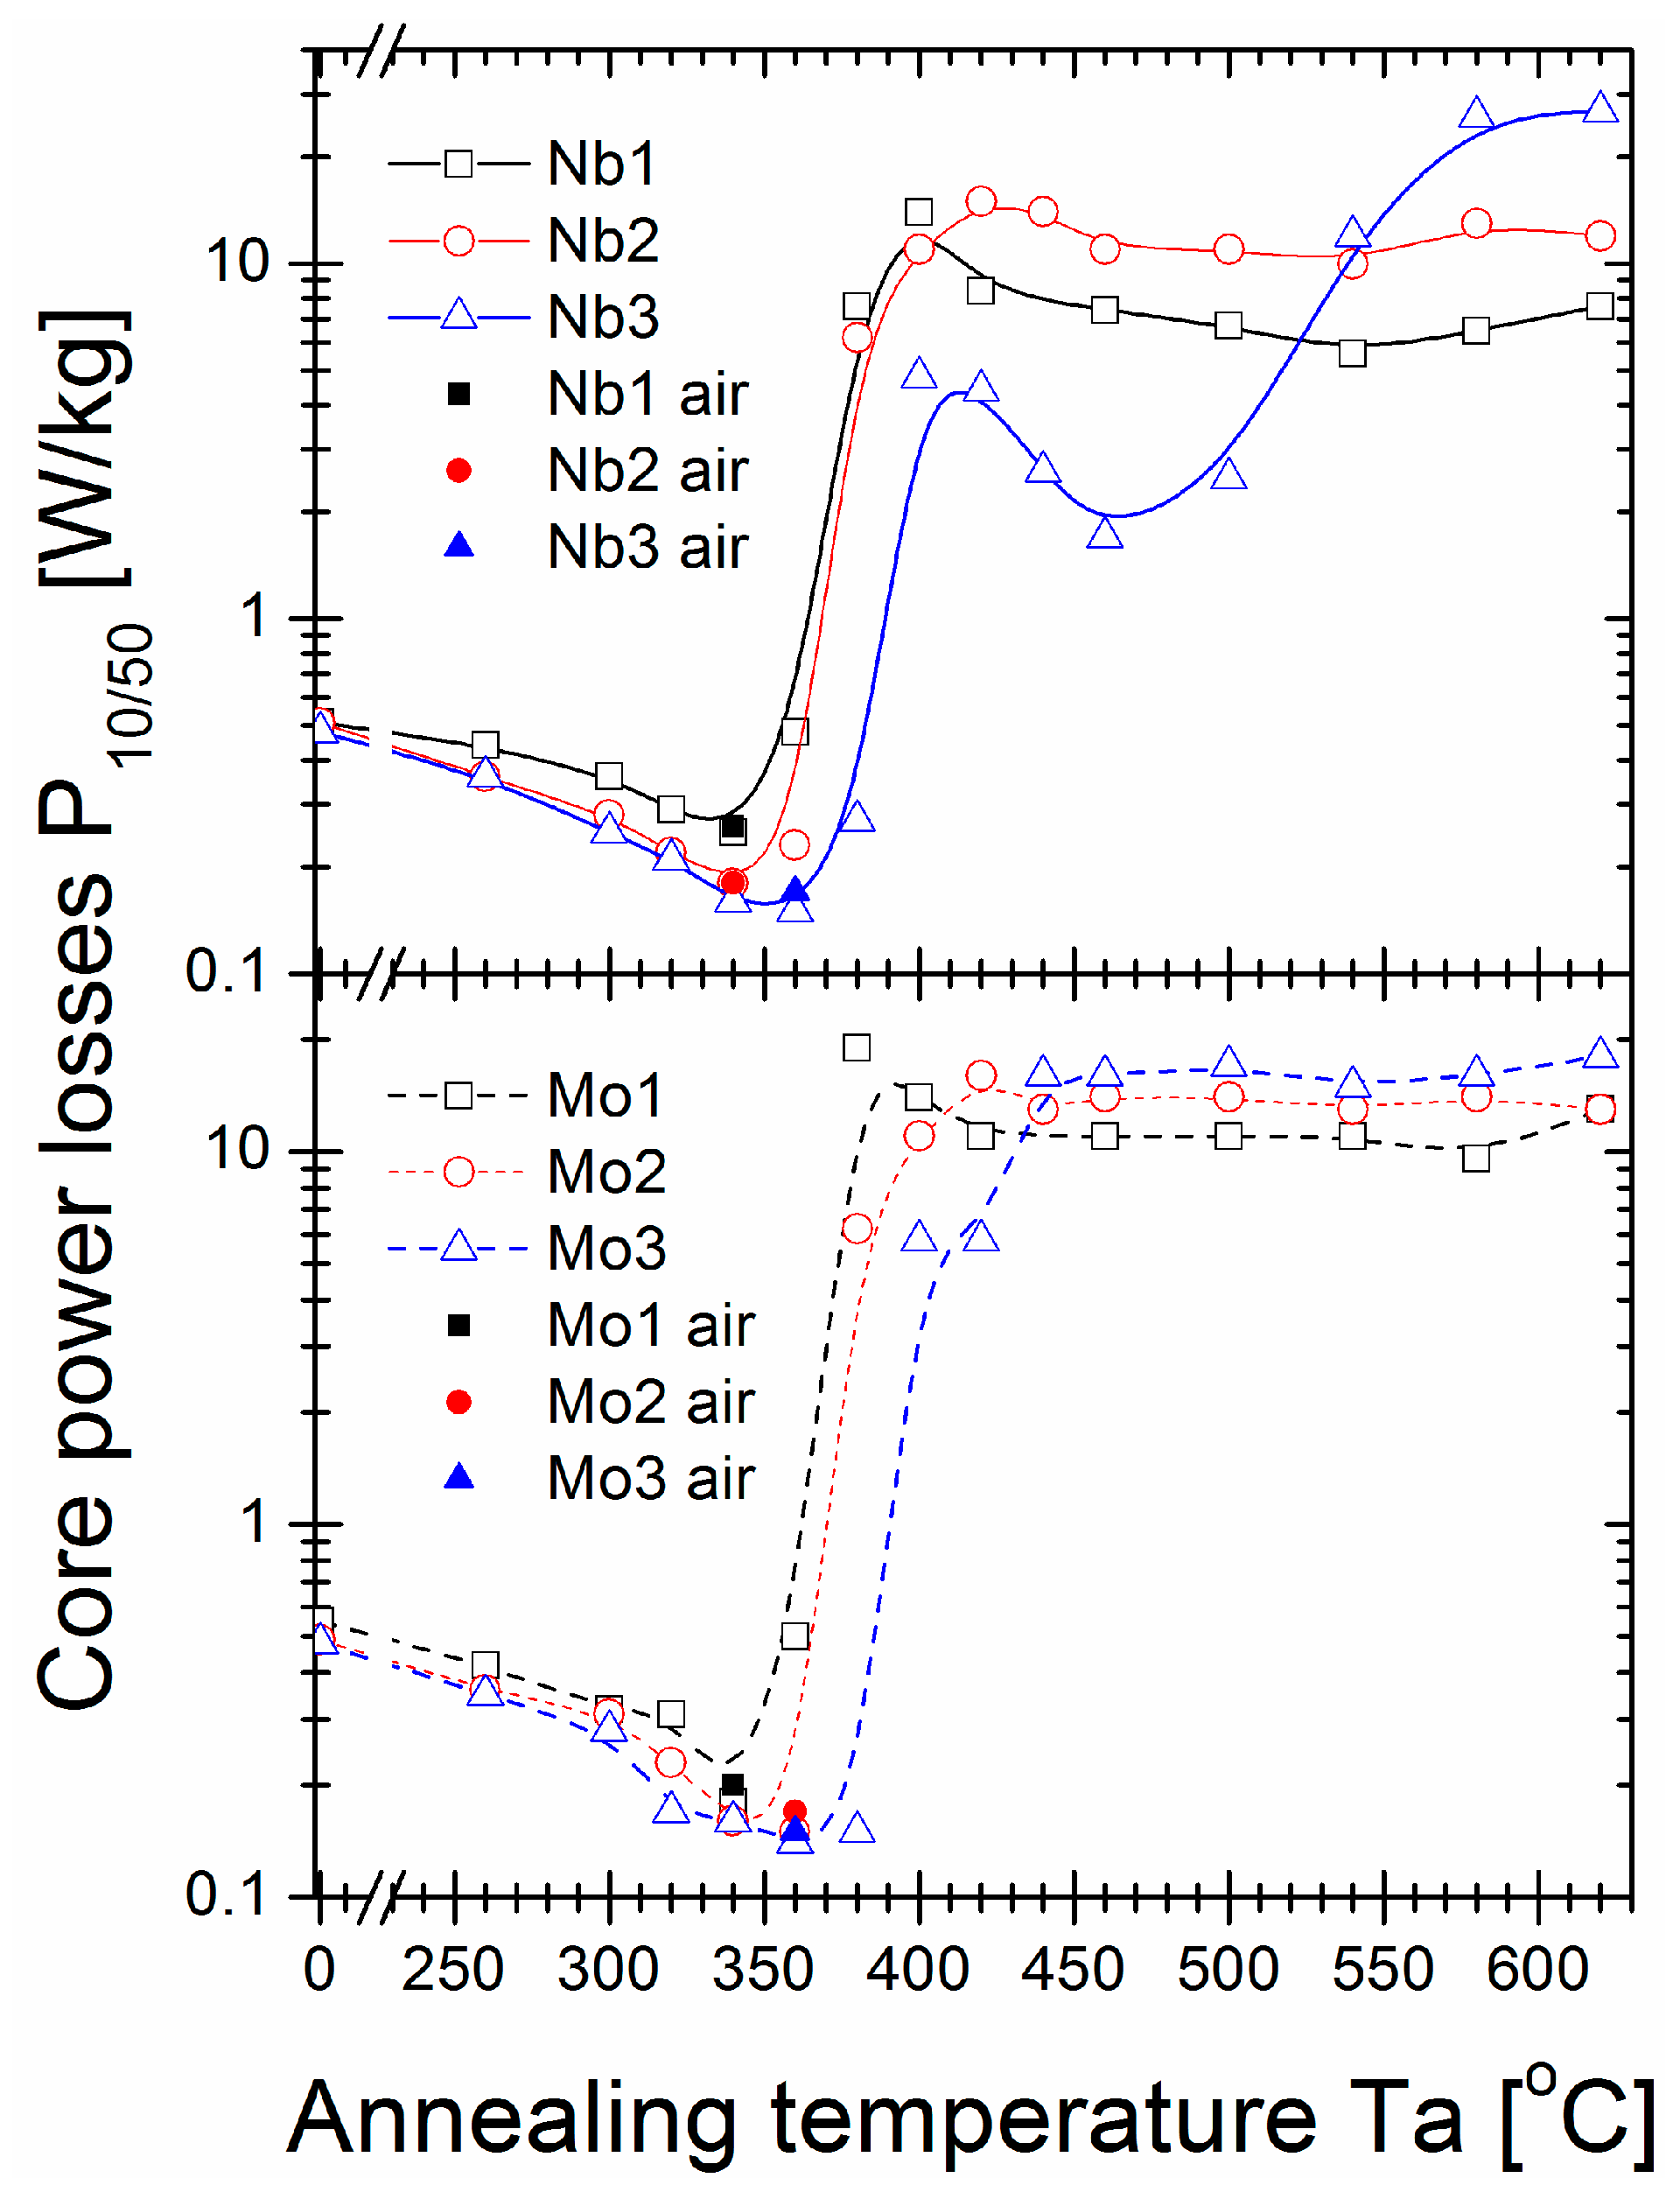
The saturation induction Bs (Figure 2), coercivity Hc (Figure 3), and core power losses P10/50 (Figure 4) of Nb- and Mo-containing alloys were assessed after annealing for 20 min at varying annealing temperatures (Ta). For as-quenched alloys, saturation induction decreased from 1.4 T to 1.3 T with Nb content, which can be attributed to the weaker ferromagnetic exchange coupling. Mo-containing alloys did not exhibit such an effect, and Bs was equal to 1.35 T for all studied samples. The Bs values of all alloys (except an Nb = 3% alloy) increased with increasing Ta, with noticeable fluctuations in the 350–420 °C temperature range. The maximum value of induction saturation for all samples was detected for annealed alloys with a Ta over 400 °C. The maximum induction saturation value reached ~1.7 T for Nb = 1% alloy and ~1.6 T for Nb = 2% and Nb = 3% alloys. However, the Nb = 3% alloy had a significant drop in Bs values for Ta > 500 °C, usually as a deterioration effect. For Mo-containing alloys, a rather flat plateau occurred in Bs(Ta > 420 °C) dependence, and Bs decreased with Mo content from ~1.64 T for Mo = 1% to ~1.56 T for Mo = 2% and ~1.53 T for Mo = 3%. This Bs(Ta) behaviour is completely different from previously studied Fe85B15 and Fe84.6Cu0.6B15 alloys, where the saturation induction deteriorated substantially just over the temperature value of optimal annealing (at 330 °C) [29]. Herein, for Nb and Mo-containing alloys, such a high induction region was broadened to 600 °C. Regarding Hc(Ta) and P10/50(Ta) (Figure 3 and Figure 4, respectively) dependences, a large increase in both values (log scale) was observed in the same Ta region (350–420 °C) where Bs values fluctuated. Additionally, for the Nb = 3% alloy, a strong “double-minima shape” dependence was identified, while for other alloys, this dependence shape was rather weak (in log-scale) or unidentified, like for Mo = 1% and Mo = 2% alloys. The global minimum of the Hc and P10/50 values were identified for Ta = 340 °C (for Nb = 1%, Nb = 2%, and Mo = 1% alloys) and Ta = 360 °C (for the remaining alloys). The least lossy alloy content was obtained for 3% Nb or Mo with P10/50 = 0.15 W/kg and P10/50 = 0.14 W/kg, respectively. For the Nb = 3% alloy second-local minimum in Hc(Ta) and P10/50(Ta), dependencies existed for Ta = 460 °C. However, Hc and P10/50 were approximately ten times greater. By comparing with the previously studied Fe85B15 and Fe84.6Cu0.6B15 alloys, the Nb- and Mo- addition extended the relatively narrow thermal stability window of the optimal annealing process; however, the Hc(Ta) and Ps(Ta) first minima had similar values and shapes as the minima for Fe85B15 and Fe84.6Cu0.6B15 alloys [29]. For optimal annealing conditions defined by Ta with a global minimum P10/50 value, an additional test for the air-annealing process was performed. As shown in Figure 2, Figure 3 and Figure 4, results presented for magnetic properties confirmed that all study materials were sufficiently resistant to oxygen content during annealing in the temperature range of 340–360 °C for 20 min. This seems to be a cheaper, less demanding alternative manufacturing process option that may be used on an industrial scale.
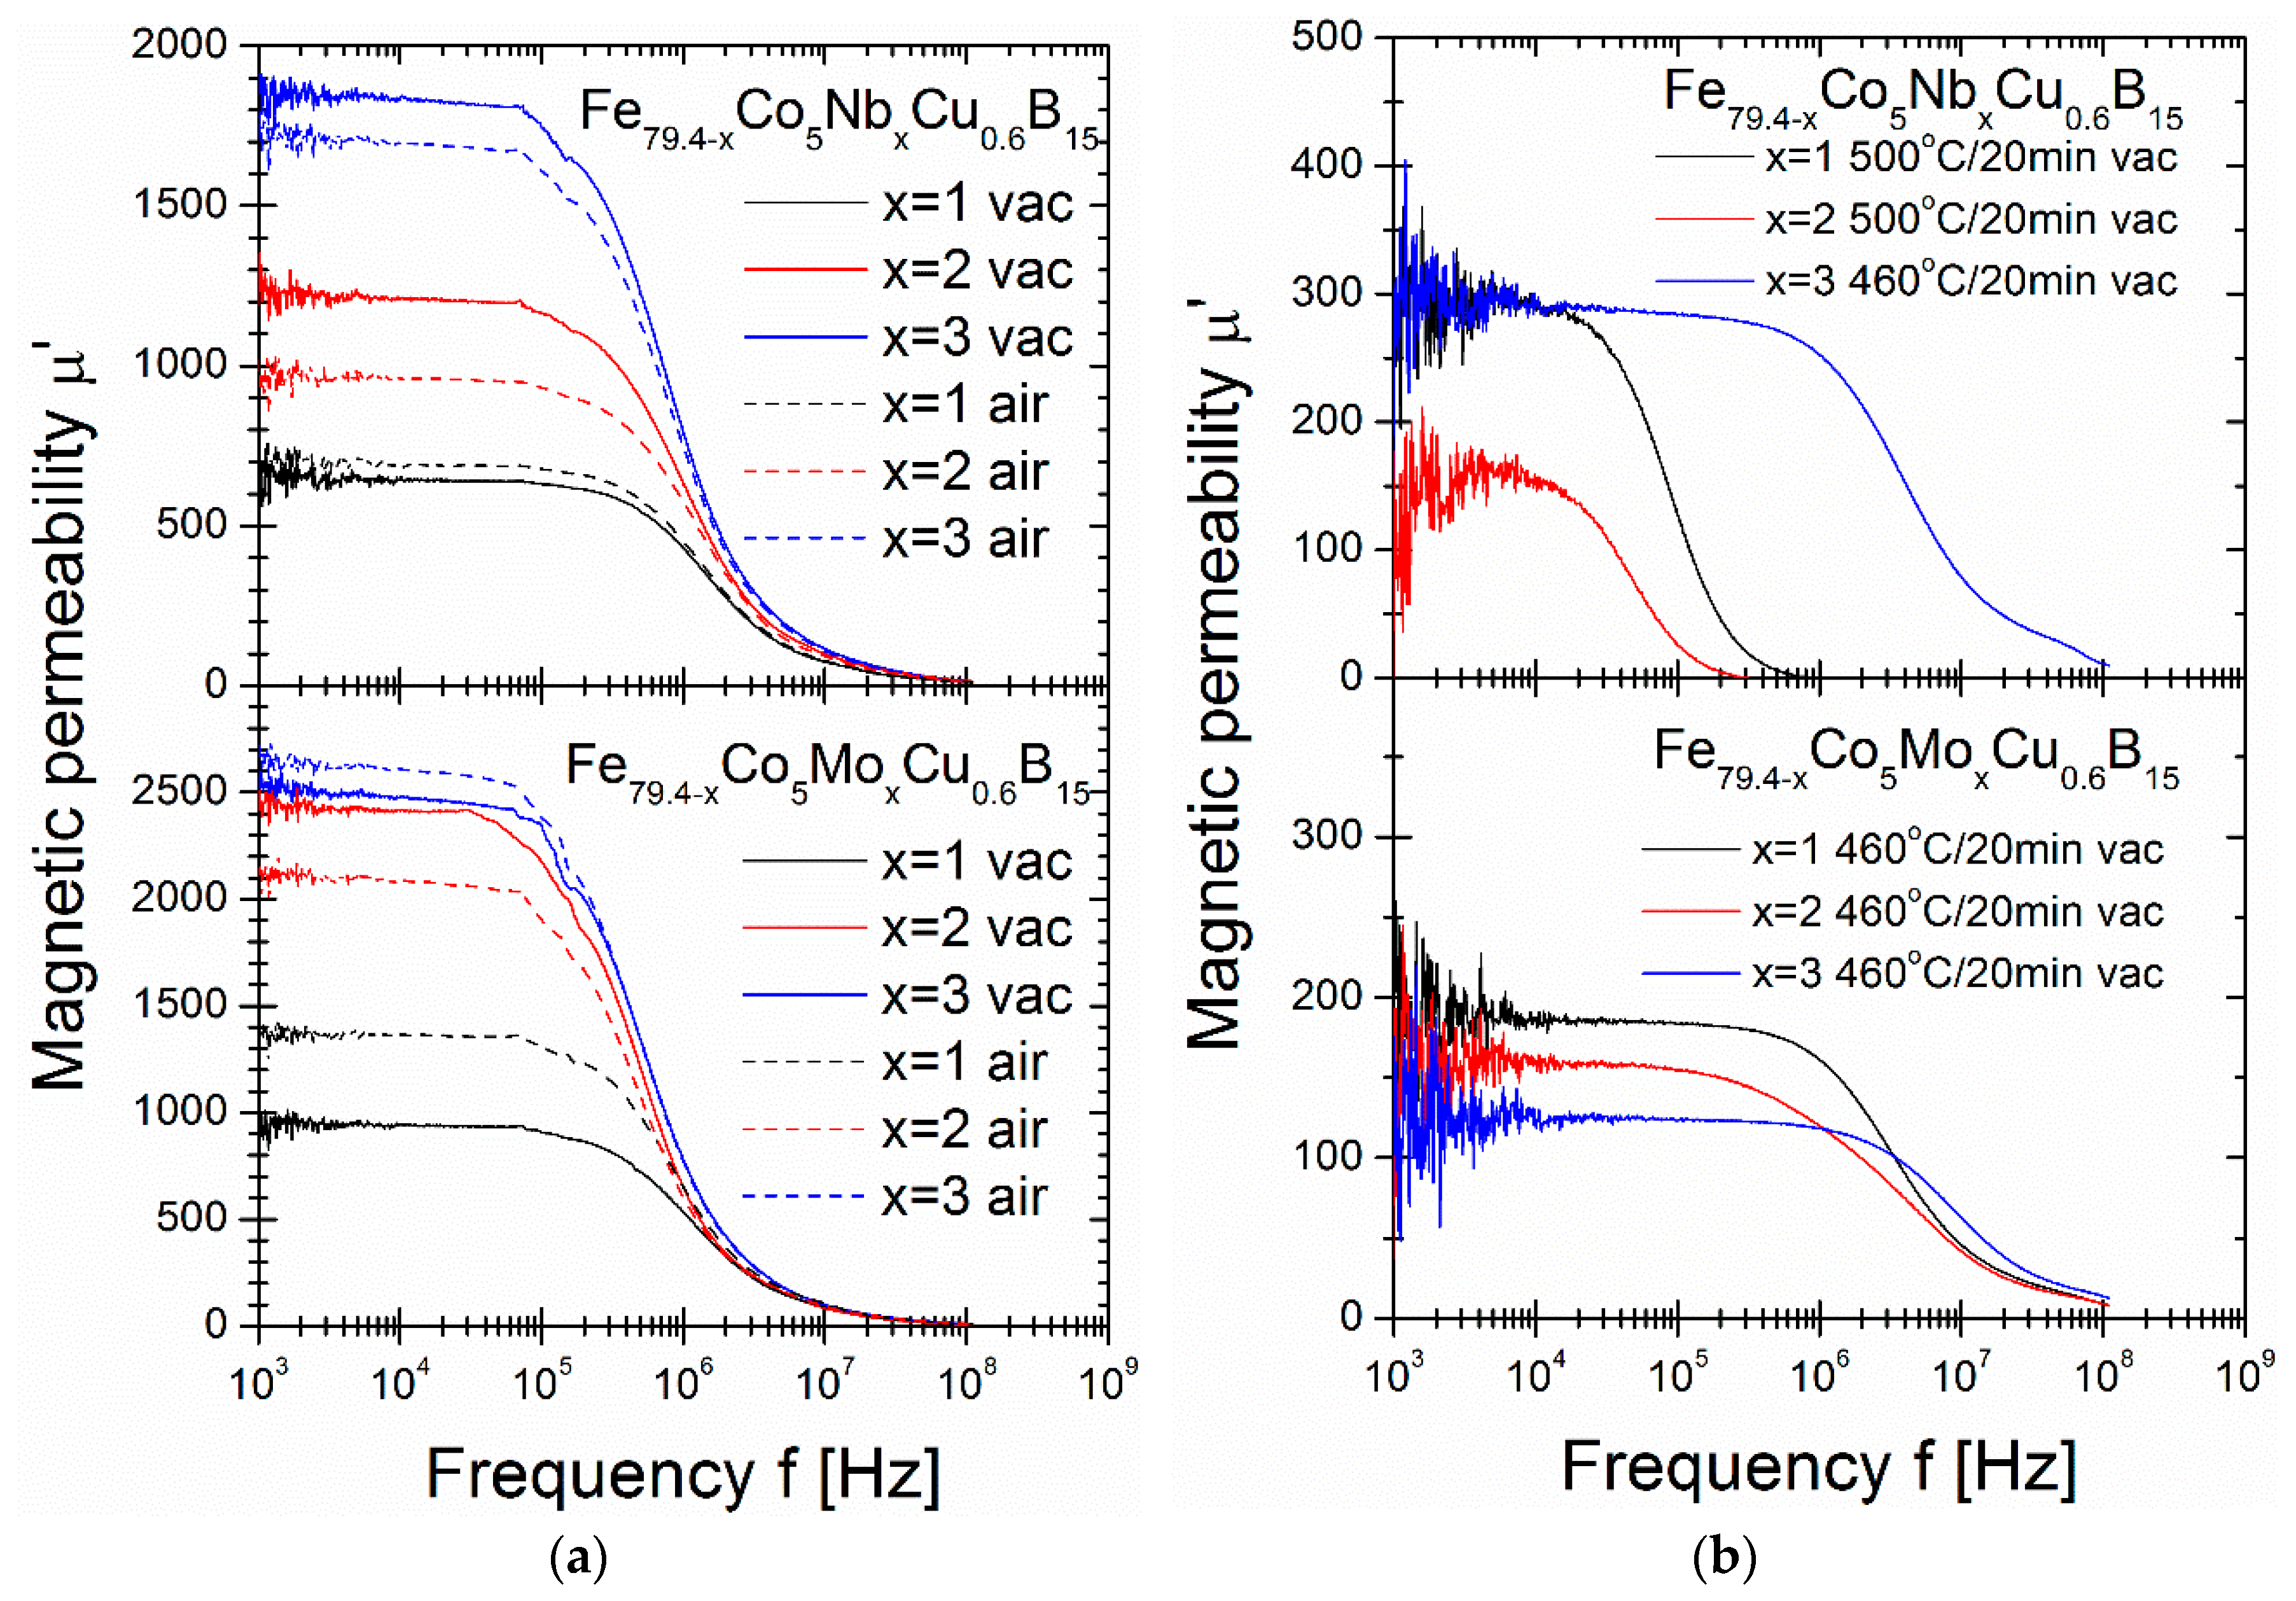
Figure 5 shows the µ’ of the alloy complex permeability at two different stages: in optimal annealing conditions at Ta = 340 °C and Ta = 360 °C in a vacuum and air (Figure 5a) and for annealing close to the second-local minimum of P10/50(Ta) dependence at 460 and 500 °C in a vacuum (Figure 5b). Figure 5a shows that vacuum-annealed Mo and Nb samples influence µ’, increasing from 631 for Nb = 1% alloy to 1746 for Nb = 3% alloy and from 907 for Mo = 1% alloy to 2543 for Mo = 3% alloy. For air-annealed samples, similar increases in µ’ were observed for Nb, while the Mo content effect was similar with small differences in values. The magnetic permeability of vacuum-annealed alloys at higher temperatures (Figure 5b) shows a significant drop in values up to µ’ = 100–300 for all samples. Similar effects have previously been observed for Fe85B15 and Fe84.6Cu0.6B15 alloys [29]. Additionally, the abrupt change in the µ’ slopes shifts into lower frequency values for Nb-containing alloys. These frequencies are identified from maximum µ’ values, designated as the cut-off frequency (fcut-off), and strongly depend on the crystal structure (grain size and phase content). The µ’ values, together with the rest of the magnetic parameter values, are presented in Table 2. For the interpretation of all the magnetic property fluctuations, it is necessary to verify the crystal structure at both states: optimal annealing temperature (340–360 °C) and second-local minimum (460–500 °C).
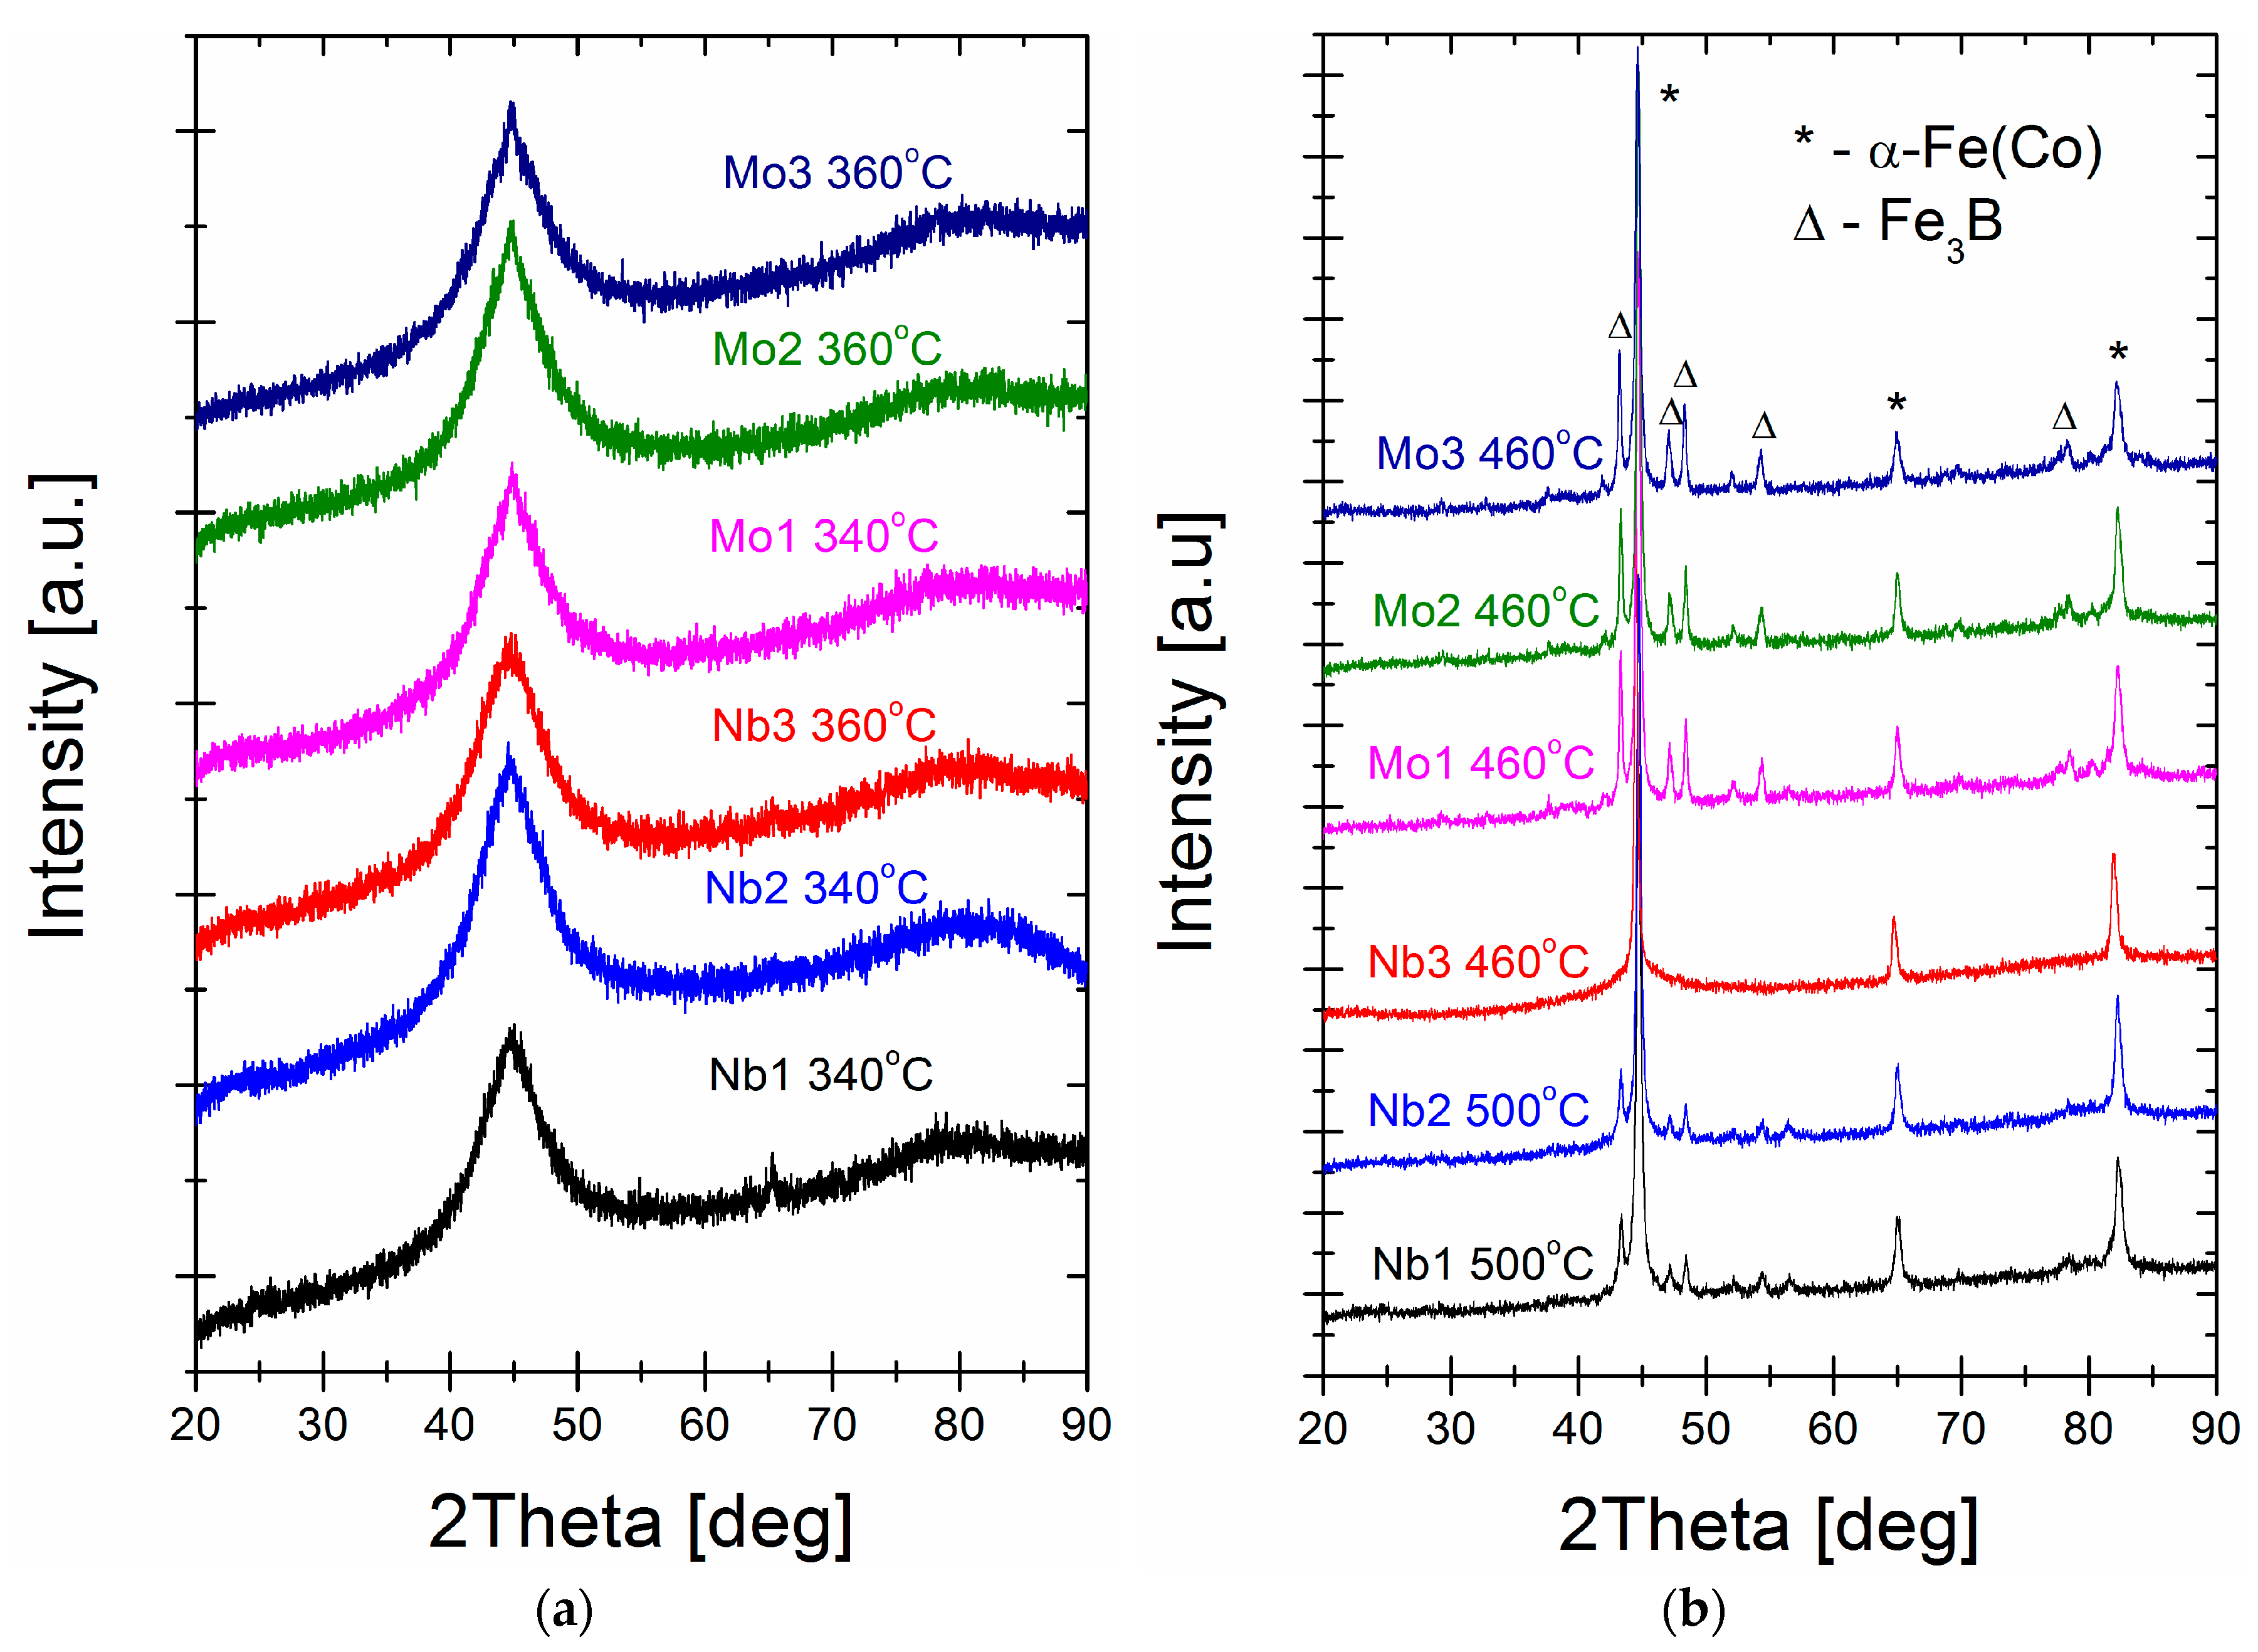
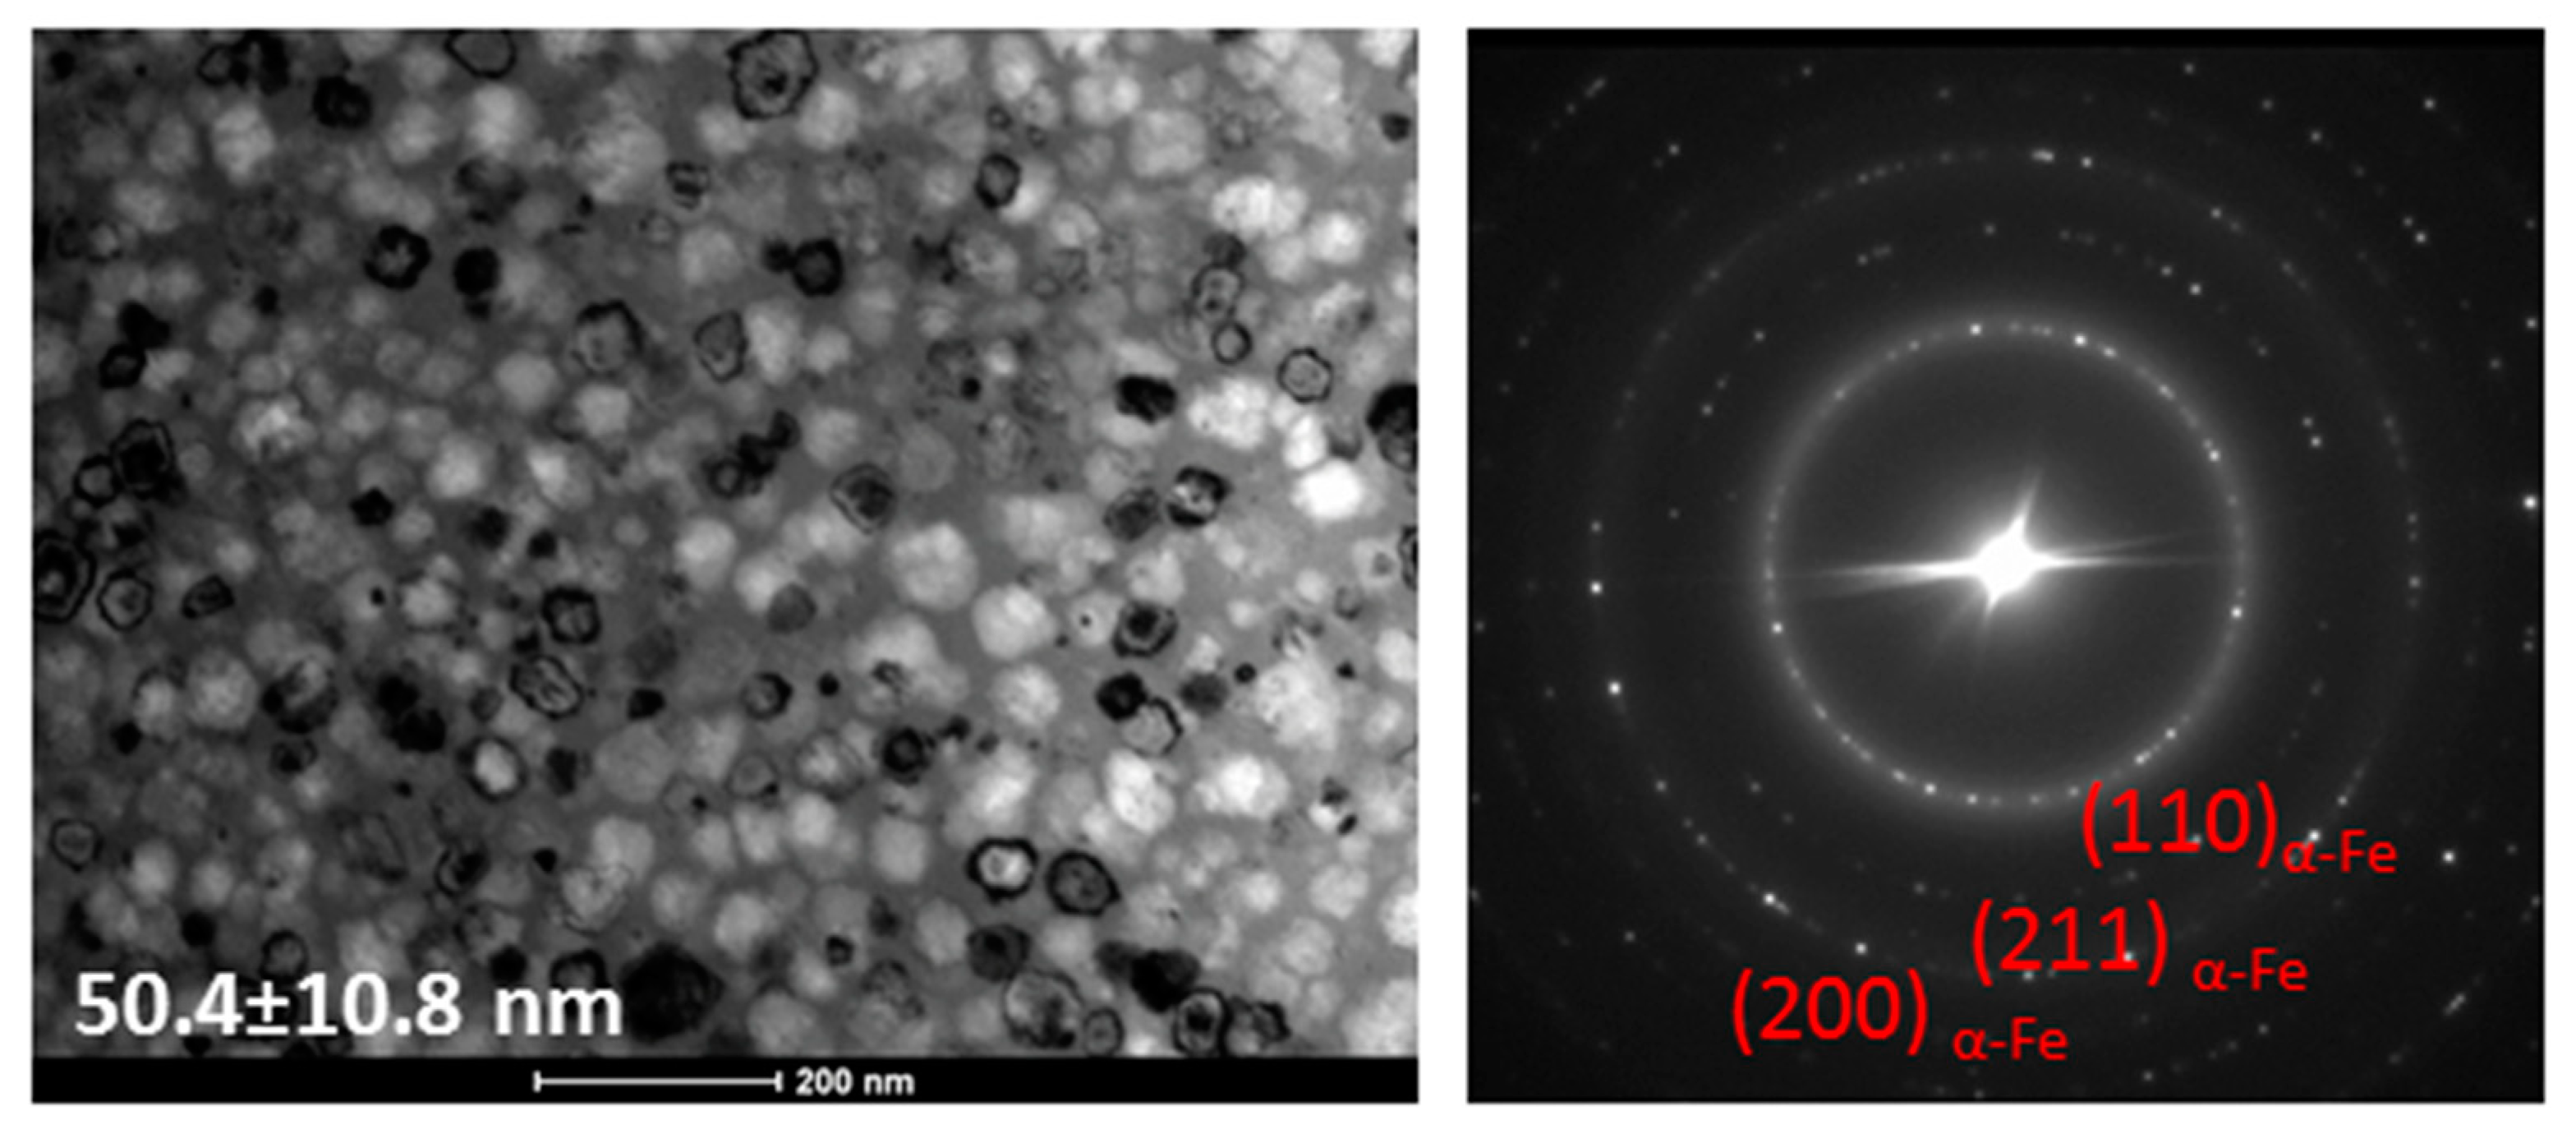
From inspection of the XRD patterns for the optimal annealing temperature (Figure 6a), the initial state of the α-Fe(Co) phase crystallisation with the dominant contribution of the amorphous state as an amorphous diffraction halo. Only a small diffraction peak emerging from the first-order amorphous halo at 2 Theta = 43–45 deg is seen. The crystal structure of annealed alloys at higher temperatures (Figure 6b) shows an almost fully crystalline two-phase (α-Fe(Co) + Fe3B) system structure for all alloys except the Nb = 3% alloy, where only the α-Fe(Co) phase exists as a dominant contribution with a small amount of amorphous diffused content. A bright-field (BF) image and selected area electron diffraction (SAED) pattern are shown in Figure 7. It can be seen from the BF TEM image that nanoscale grains precipitate randomly, and the residual amorphous matrix is the minority component. Statistical analysis and careful grain size determination using the Gatan Digital Microscopy suite helped to determine the average nanograin size of ~50 nm. The SAED pattern indicated that only the α-Fe(Co) phase existed with randomly oriented nanocrystals. TEM observations agree with the XRD results presented in Figure 6. Based on structural studies and thermal analysis, we can interpret the origin of the changes in magnetic properties. The α-Fe(Co) phase is identified here as the soft magnetic phase, while the Fe3B phase belongs to the hard magnetic counterpart [30,31]. During the annealing process in the temperature range of 340–380 °C, the atoms rearrange locally in a short-range order and form clusters immersed in the amorphous matrix. The coupling of these clusters leads to magnetocrystalline anisotropy. With increased annealing temperature, the mean grain size decreases, and only for the Nb = 3% alloy, the crystallisation products remain the same up to 460–500 °C. The ferromagnetic exchange between the α-Fe(Co) nanocrystals is enhanced, as seen in the increasing value of saturation induction in Figure 2. A further increase in the annealing temperature causes further grain coarsening, hard magnetic Fe3B phase precipitation, and a strong drop in the Bs(Ta) dependence. This effect of stably coarsening the α-Fe(Co) phase is only possible thanks to the high thermal stability ΔTx of 155 °C shown in the DSC studies. For all other alloys with lower thermal stability, the hard magnetic Fe3B phase co-precipitates with α-Fe(Co), blocking the stable α-Fe(Co) coarsening. According to the random anisotropy model proposed by Herzer [32], the Hc is proportional to the fourth power of magneto-crystalline anisotropy. As previously reported, this value for the Fe3B phase is equal to 430 kJ/m3 and is substantially larger than for the α-Fe(Co) phase [33]. High-induction soft magnetic materials are especially used in high-frequency applications where the core power losses of the materials are significant. Thus, for samples annealed at optimum conditions, the Ps parameters were measured in the frequency range f = 50 Hz–400 kHz and the magnetic induction B = 0.1–0.8 T. Table 3 presents results for four different f and B measurement combinations: 50 Hz/0.8 T, 50 kHz/0.8 T, 100 kHz/0.4 T, and 400 kHz/0.1 T. The core power losses decrease with increasing Mo and Nb content. Moreover, the Mo-containing alloys are ~20% less lossy than the Nb-containing ones, which agrees with the change tendency of the coercivity values.

4. Conclusions

In this work, comparative studies on the influence of Nb (1, 2, 3 at.%) and Mo (1, 2, 3 at.%) for Fe substitution on the thermal stability, crystal structure, and magnetic properties of a rapidly quenched Fe79.4Co5Cu0.6B15 alloy were performed. The research results can be summarised as follows:
  • Successive Nb substitution enhances thermal stability more efficiently than Mo, which is beneficial for crystallisation heat treatment.
  • The 20-min vacuum-annealing process was optimised for a wide temperature range from 260 to 640 °C. For the Nb = 3% alloy, the highest thermal stability favours the precipitation of only α-Fe(Co) nanograins in the amorphous matrix at a broadened annealing temperature range of up to 460 °C. Hc(Ta) and P10/50(Ta) dependences correlate strongly with crystal structure evolution. For example, the α-Fe(Co) grain growth and Fe3B phase precipitation significantly increase the magneto-crystalline anisotropy, leading to an increase in the Hc value. A double minimum of Hc(Ta) dependence exists with different α-Fe(Co) nanograin contents. The first minimum is related to a relaxed amorphous state, while the second is related to a relaxed α-Fe(Co)/amorphous nanocomposite.
  • For all alloys except Nb = 3%, the limited thermal stability of <150 °C does not only allow for α-Fe(Co) nanograins to precipitate at higher temperatures. Rather, the fast co-precipitation of the hard magnetic Fe3B phase also substantially increases magnetic saturation while stabilising Hc and P10/50.
  • Optimally vacuum-annealed alloys (when the P10/50 is at a minimum) exhibit excellent magnetic properties with high saturation induction up to 1.7 T and low coercivity below 10 A/m. Optimally vacuum-annealed Mo-containing alloys are 20% less lossy than Nb-containing alloys in the whole B (up to 0.8 T) and f (up to 400 kHz) ranges.
  • The air-annealing process may be an alternative and effective heat treatment process for use on an industrial scale. There are no significant differences in magnetic properties between the vacuum- and air-annealed materials under optimal annealing conditions.

Author Contributions

Conceptualisation, L.H.; investigation, T.W., P.Z., A.W., J.H. and L.H.; writing—original draft preparation, L.H.; writing—review and editing, L.H., T.W. and J.H.; supervision, L.H. All authors have read and agreed to the published version of the manuscript.

Funding

This work was financed by the National Science Centre OPUS14 Grant No. 2017/27/B/ST8/01601. Tymon Warski thanks the Ministry of Education and Science of Poland for funding his PhD programme, Grant No. DWD/4/21/2020–70/003.

Institutional Review Board Statement

Not applicable.

Informed Consent Statement

Not applicable.

Data Availability Statement

The data presented in this study are available on request from the authors.

Conflicts of Interest

The authors declare no conflict of interest. The funders had no role in the design of this study, in the collection, analysis, or interpretation of data, in the writing of the manuscript, or in the decision to publish the results.

References

  1. Naitoh, Y.; Bitoh, T.; Hatanai, T.; Makino, A.; Inoue, A. Application of nanocrystalline soft magnetic Fe–M–B (M = Zr,Nb) alloys to choke coils. J. Appl. Phys. 1998, 83, 6332–6334. [Google Scholar] [CrossRef]
  2. Hasegawa, R. Advances in amorphous and nanocrystalline materials. J. Magn. Magn. Mater. 2012, 324, 3555–3557. [Google Scholar] [CrossRef]
  3. Masumoto, T.; Egami, T. Designing the composition and heat treatment of magnetic amorphous alloys. Mater. Sci. Eng. 1981, 48, 147–165. [Google Scholar] [CrossRef]
  4. Herzer, G. Modern soft magnets: Amorphous and nanocrystalline materials. Acta Mater. 2013, 61, 718–734. [Google Scholar] [CrossRef]
  5. Yoshizawa, Y.A.; Oguma, S.; Yamauchi, K. New Fe-based soft magnetic alloys composed of ultrafine grain structure. J. Appl. Phys. 1988, 64, 6044–6046. [Google Scholar] [CrossRef]
  6. Suzuki, K.; Makino, A.; Inoue, A.; Masumoto, T. Soft magnetic properties of bcc Fe-MB-Cu (M = Ti, Nb or Ta) alloys with nanoscale grain size. Jpn. J. Appl. Phys. 1991, 30, L1729. [Google Scholar] [CrossRef]
  7. Willard, M.A.; Laughlin, D.E.; McHenry, M.E.; Thoma, D.; Sickafus, K.; Cross, J.O.; Harris, V.G. Structure and magnetic properties of (Fe0.5Co0.5)88Zr7B4Cu1 nanocrystalline alloys. J. Appl. Phys. 1998, 84, 6773–6777. [Google Scholar] [CrossRef]
  8. Blázquez, J.S.; Franco, V.; Conde, C.F.; Conde, A. Microstructure and magnetic properties of Fe78−xCoxNb6B15Cu1 (x = 18, 39, 60) alloys. J. Magn. Magn. Mater. 2003, 254, 460–462. [Google Scholar] [CrossRef]
  9. Zhang, Y.; Sharma, P.; Makino, A. Effects of Cobalt Addition in Nanocrystalline Fe83.3Si4B8P4Cu0.7 Soft Magnetic Alloy. IEEE Trans. Magn. 2014, 50, 2003004. [Google Scholar] [CrossRef]
  10. Hawelek, L.; Warski, T.; Wlodarczyk, P.; Polak, M.; Zackiewicz, P.; Radon, A.; Wojcik, A.; Kolano-Burian, A. Effect of Co Substitution on Crystallization and Magnetic Behavior of Fe85.45−xCoxCu0.55B14 Metallic Glass. Materials 2020, 13, 919. [Google Scholar] [CrossRef]
  11. Hawelek, L.; Polak, M.; Wlodarczyk, P.; Zackiewicz, P.; Radon, A.; Lukowiec, D.; Hreczka, M.; Kolano-Burian, A. Influence of Co substitution for Fe on magnetic properties and crystal structure of soft magnetic Fe81.3Mo0.2Cu0.5Si4B14 alloy. J. Magn. Magn. Mater. 2020, 512, 166681. [Google Scholar] [CrossRef]
  12. Victora, R.H.; Falicov, L.M. Calculated magnetization of iron-cobalt disordered alloys. Phys. Rev. B 1984, 30, 259. [Google Scholar] [CrossRef]
  13. Slater, J.C. Electronic structure of alloys. J. Appl. Phys. 1937, 8, 385–390. [Google Scholar] [CrossRef]
  14. Pauling, L. The nature of the interatomic forces in metals. Phys. Rev. 1938, 54, 899. [Google Scholar] [CrossRef]
  15. Warski, T.; Wlodarczyk, P.; Polak, M.; Zackiewicz, P.; Radon, A.; Wojcik, A.; Szlezynger, M.; Kolano-Burian, A.; Hawelek, L. Influence of Cu content on structure and magnetic properties in Fe86-xCuxB14 alloys. Materials 2020, 13, 1451. [Google Scholar] [CrossRef] [PubMed]
  16. Warski, T.; Radon, A.; Zackiewicz, P.; Wlodarczyk, P.; Polak, M.; Wojcik, A.; Maziarz, W.; Kolano-Burian, A.; Hawelek, L. Influence of Cu Content on Structure, Thermal Stability and Magnetic Properties in Fe72−xNi8Nb4CuxSi2B14 Alloys. Materials 2021, 14, 726. [Google Scholar] [CrossRef]
  17. Ohta, M.; Yoshizawa, Y. Recent progress in high Bs Fe-based nanocrystalline soft magnetic alloys. J. Phys. D Appl. Phys. 2011, 44, 064004. [Google Scholar] [CrossRef]
  18. Lashgari, H.R.; Chu, D.; Xie, S.; Sun, H.; Ferry, M.; Li, S. Composition dependence of the microstructure and soft magnetic properties of Fe-based amorphous/nanocrystalline alloys: A review study. J. Non Cryst. Solids 2014, 391, 61–82. [Google Scholar] [CrossRef]
  19. Lu, W.; Fan, J.; Wang, Y.; Yan, B. Microstructure and magnetic properties of Fe72.5Cu1M2V2Si13.5B9 (M = Nb, Mo,(NbMo),(MoW)) nanocrystalline alloys. J. Magn. Magn. Mater. 2010, 322, 2935–2937. [Google Scholar] [CrossRef]
  20. Yoshizawa, Y.; Yamauchi, K. Magnetic properties of Fe Cu M Si B (M = Cr, V, Mo, Nb, Ta, W) alloys. Mater. Sci. Eng. A 1991, 133, 176–179. [Google Scholar] [CrossRef]
  21. Tsepelev, V.S.; Starodubtsev, Y.N. Nanocrystalline soft magnetic iron-based materials from liquid state to ready product. Nanomaterials 2021, 11, 108. [Google Scholar] [CrossRef] [PubMed]
  22. Li, H.X.; Kim, K.B.; Yi, S. Enhanced glass-forming ability of Fe-based bulk metallic glasses prepared using hot metal and commercial raw materials through the optimization of Mo content. Scr. Mater. 2007, 56, 1035–1038. [Google Scholar] [CrossRef]
  23. Jiao, Z.; Li, H.; Wu, Y.; Gao, J.; Wang, S.; Yi, S.; Lu, Z. Effects of Mo additions on the glass-forming ability and magnetic properties of bulk amorphous Fe-C-Si-BP-Mo alloys. Sci. China Phys. Mech. Astron. 2010, 53, 430–434. [Google Scholar] [CrossRef]
  24. Kumar, A.; Murugaiyan, P.; Panda, A.K.; Roy, R.K. Effect of compositional elements and processing routes on structural and thermal response in Fe-based metallic glasses. J. Alloys Compd. 2020, 821, 153279. [Google Scholar] [CrossRef]
  25. Ramasamy, P.; Stoica, M.; Bera, S.; Calin, M.; Eckert, J. Effect of replacing Nb with (Mo and Zr) on glass forming ability, magnetic and mechanical properties of FeCoBSiNb bulk metallic glass. J. Alloys Compd. 2017, 707, 78–81. [Google Scholar] [CrossRef]
  26. Kraus, L.; Hašlar, V.; Duhaj, P.; Švec, P.; Studnička, V. The structure and magnetic properties of nanocrystalline Co21Fe64− xNbxB15 alloys. Mater. Sci. Eng. A 1997, 226, 626–630. [Google Scholar] [CrossRef]
  27. Tinh, N.H.; Dung, N.V.; Nghi, N.H.; Phan, M.H. Influence of Nb substitution for Fe on the magnetic and magneto-impedance properties of amorphous and annealed Fe76.5−xSi13.5B9Cu1Nbx (x = 0–7) ribbons. Phys. B Condens. 2012, 407, 3790–3796. [Google Scholar] [CrossRef]
  28. Kissinger, H.E. Reaction kinetics in differential thermal analysis. Anal. Chem. 1957, 29, 1702–1706. [Google Scholar] [CrossRef]
  29. Hawelek, L.; Warski, T.; Radon, A.; Pilsniak, A.; Maziarz, W.; Szlezynger, M.; Kolano-Burian, A. Structure and magnetic properties of thermodynamically predicted rapidly quenched Fe85-xCuxB15 alloys. Materials 2021, 14, 7807. [Google Scholar] [CrossRef]
  30. Stoica, M.; Kumar, S.; Roth, S.; Ram, S.; Eckert, J.; Vaughan, G.; Yavari, A.R. Crystallization kinetics and magnetic properties of Fe66Nb4B30 bulk metallic glass. J. Alloys Compd. 2009, 483, 632–637. [Google Scholar] [CrossRef]
  31. Xue, L.; Liu, H.; Dou, L.; Yang, W.; Chang, C.; Inoue, A.; Wang, X.; Li, R.-W.; Shen, B. Soft magnetic properties and microstructure of Fe84−xNb2B14Cux nanocrystalline alloys. Mater. Des. 2014, 56, 227–231. [Google Scholar] [CrossRef]
  32. Herzer, G. Grain size dependence of coercivity and permeability in nanocrystalline ferromagnets. IEEE Trans. Magn. 1990, 26, 1397–1402. [Google Scholar] [CrossRef]
  33. Hoque, S.M.; Hakim, M.A.; Dhar, U.; Saha, D.K.; Nordblad, P.; Paul, D.P. Detailed study of ultra-soft magnetic properties of Fe74Cu0.8Nb2.7Si15.5B7. Philos. Mag. 2011, 91, 2117–2139. [Google Scholar] [CrossRef]
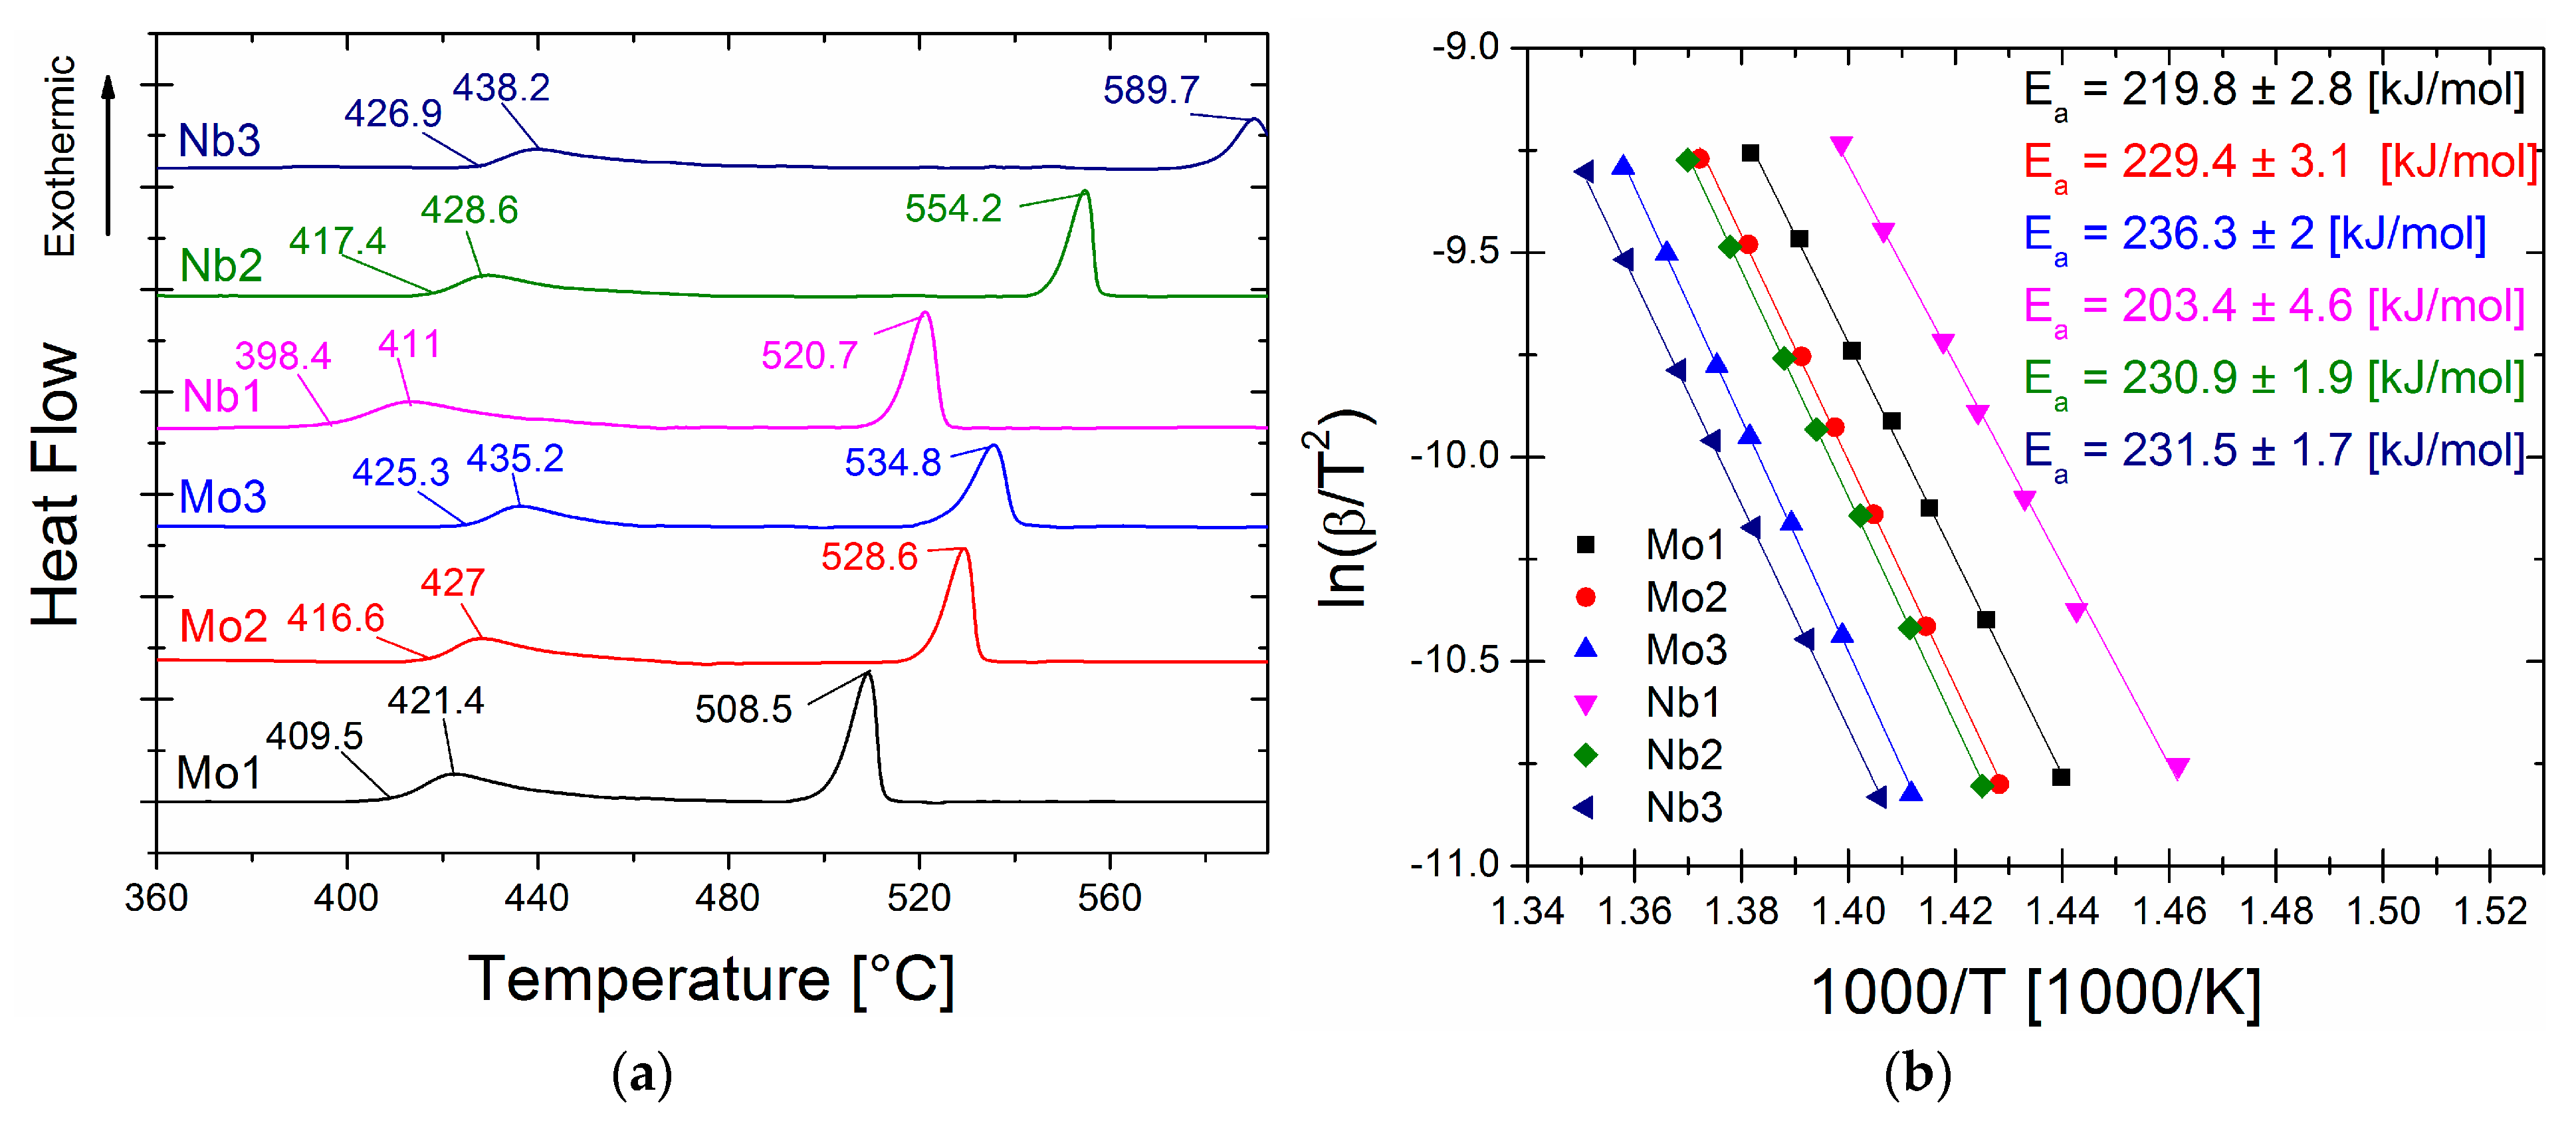
Figure 1. (a) DSC signals for as-spun alloys. (b) Kissinger plots with calculated activation energy for as-spun alloys.
Materials 16 06288 g001
Figure 2. Saturation induction from annealing temperature dependence.
Materials 16 06288 g002
Figure 3. Coercivity from annealing temperature dependence.
Materials 16 06288 g003
Figure 4. Core power losses from annealing temperature dependence.
Materials 16 06288 g004
Figure 5. (a) Magnetic permeability for air- and vacuum-annealed samples under P10/50 optimum conditions. (b) Magnetic permeability for vacuum-annealed samples at a second-local minimum of P10/50(Ta) dependence.
Materials 16 06288 g005
Figure 6. XRD patterns for annealed alloys: (a) at P10/50 optimum conditions; (b) at a second-local minimum of P10/50(Ta) dependence.
Materials 16 06288 g006
Figure 7. Set of BF image and SAED pattern for vacuum-annealed Fe76.4Co5Nb3Cu0.6B15 at 460 °C for 20 min.
Materials 16 06288 g007
Table 1. Characteristic crystallisation temperatures: Tp1, Tp2, Tx1, Tx2, ΔTx.
CompositionTx1 [°C]Tp1 [°C]Tx2 [°C]Tp2 [°C]ΔTx = Tx2 − Tx1 [°C]
Fe78.4Co5Nb1Cu0.6B15398.4411513520.7114.6
Fe77.4Co5Nb2Cu0.6B15417.4428.6546.4554.2129
Fe76.4Co5Nb3Cu0.6B15426.9438.2581.6589.7154.7
Fe78.4Co5Mo1Cu0.6B15409.5421.4500.3508.590.8
Fe77.4Co5Mo2Cu0.6B15416.6427521528.6104.4
Fe76.4Co5Mo3Cu0.6B15425.3435.2525.5534.8100.2
Table 2. Magnetic properties for selected heat-treated samples (vac—vacuum-annealing, air—air-annealing).
CompositionTa [°C]Bs [T]Hc [A/m]P10/50[W/kg]µ’fcut-off [kHz]
Fe78.4Co5Nb1Cu0.6B15340 vac1.6216.70.256311472
340 air1.6315.60.266781394
500 vac1.74376.728778
Fe77.4Co5Nb2Cu0.6B15340 vac1.5311.50.1811651022
340 air1.5311.40.189321472
500 vac1.626751115045
Fe76.4Co5Nb3Cu0.6B15360 vac1.439.90.151746791
360 air1.4310.50.171614791
460 vac1.61261.72913951
Fe78.4Co5Mo1Cu0.6B15340 vac1.613.40.189071182
340 air1.5814.20.21306867
460 vac1.64615111873351
Fe77.4Co5Mo2Cu0.6B15360 vac1.5110.50.152416519
360 air1.5110.171904483
460 vac1.56801141593950
Fe76.4Co5Mo3Cu0.6B15360 vac1.479.30.142543529
360 air1.4510.10.152681483
460 vac1.53989161198993
Table 3. Core losses Ps measured at selected f and B.
CompositionTa [°C]50 Hz/0.8 T [W/kg]50 kHz/0.8 T [W/kg]100 kHz/0.4 T [W/kg]400 kHz/0.1 T [W/kg]
Fe78.4Co5Nb1Cu0.6B15340 vac0.002515137.3
Fe77.4Co5Nb2Cu0.6B15340 vac0.001813116.6
Fe76.4Co5Nb3Cu0.6B15360 vac0.0015118.84.7
Fe78.4Co5Mo1Cu0.6B15340 vac0.001812105.5
Fe77.4Co5Mo2Cu0.6B15360 vac0.00149.17.65.0
Fe76.4Co5Mo3Cu0.6B15360 vac0.00127.45.93.6
Disclaimer/Publisher’s Note: The statements, opinions and data contained in all publications are solely those of the individual author(s) and contributor(s) and not of MDPI and/or the editor(s). MDPI and/or the editor(s) disclaim responsibility for any injury to people or property resulting from any ideas, methods, instructions or products referred to in the content.