1. Introduction
Recent advancements in additive manufacturing (AM) enable multi-materials processing [
1]. From a design standpoint, these innovations provide exceptional opportunities, allowing us to meet several functional requirements in the same component in a single process. Moreover, recent studies show the advantages of multi-materials in achieving the shape memory effect [
2,
3]. Nevertheless, the literature shows several limits in the design and manufacturing of multi-materials AM components such as compatible materials processing, interface behavior, and mechanical properties [
4,
5,
6].
During the product design, a variation in the properties usually occurred by separating the product into parts with different homogeneous materials. The same variation can be obtained by locally changing the composition to achieve tailored characteristics. Products with a heterogeneous composition can have several delimited areas associated with different functions or a gradual variation in the material fractions among different regions. The latter ones are called functionally graded materials (FGM) and Functionally Graded Additive Manufacturing (FGAM) when one is referring to their AM production [
4].
Although FGAM has great potential, its adoption is still limited due to the lack of knowledge mainly related to three bottlenecks: processability, indeed, the materials that can be simultaneously manufactured, and their relevant process parameters are often unknown, and the features of Computer-Aided Manufacturing (CAM) software rarely allow us to process virtual models of FGM; properties, i.e., only few combinations of materials were investigated from a functional point of view; design tools, which means that Computer-Aided Design (CAD) software does not support geometric modeling, analysis, and data exchange for FGM and, in general, for non-homogeneous solids. In this scenario, new CAD/CAM/CAE AM software should be able to optimize the allocation of material in a logical distribution during the generation of the FGM model [
7].
Nevertheless, multi-material AM technologies are available in a variety of prosumer and industrial technologies used for FGAM. Among these, due to their diffusion and range of available materials, Fused Deposition Modeling (FDM), also known as Fused Filament Fabrication (FFF) [
8], is the material extrusion (MEX) technology adopted in this study.
Due to the simplicity of assembly and the wide range of materials available, FDM has become a widespread technology since the Stratasys’s patent decay [
9]. The functioning of the FDM consists of the extrusion of a thermoplastic material, which is supplied as a filament, commonly with a diameter of 1.75 mm. In addition to the common styrenic polymers (Acrylonitrile Butadiene Styrene—ABS; Acrylonitrile Styrene Acrylate—ASA), polyesters (Polyethylene Terephthalate—PET; Polybutylene Terephthalate—PBT), naturally derived polymers (Polylactic Acid—PLA), and polyamides (PA), other materials are available on the market which extend the range of obtainable properties [
10]. Some examples of technical polymers are elastomers and polymers loaded with a variety of fillers (carbon, metals, minerals, pigments, and nanomaterials, etc.) that allow us to obtain various properties such as electrical and thermal conductivity, resistance abrasion, and color variations. Moreover, some companies (e.g., 3DXTech [
11]) have introduced technopolymers onto the market: Polyetherimide (PEI), Polyetheretherketone (PEEK), and Polyphenylene Sulfide (PPS) are some of the materials that promise metal-replaceable performances. One way to increase the range of properties in the same component is to use graded materials fractions in a single AM process.
When we are dealing with FDM multi-materials, in the most common of cases, the printing head carriage has two or more identical extruders, each of which processes a different material independently [
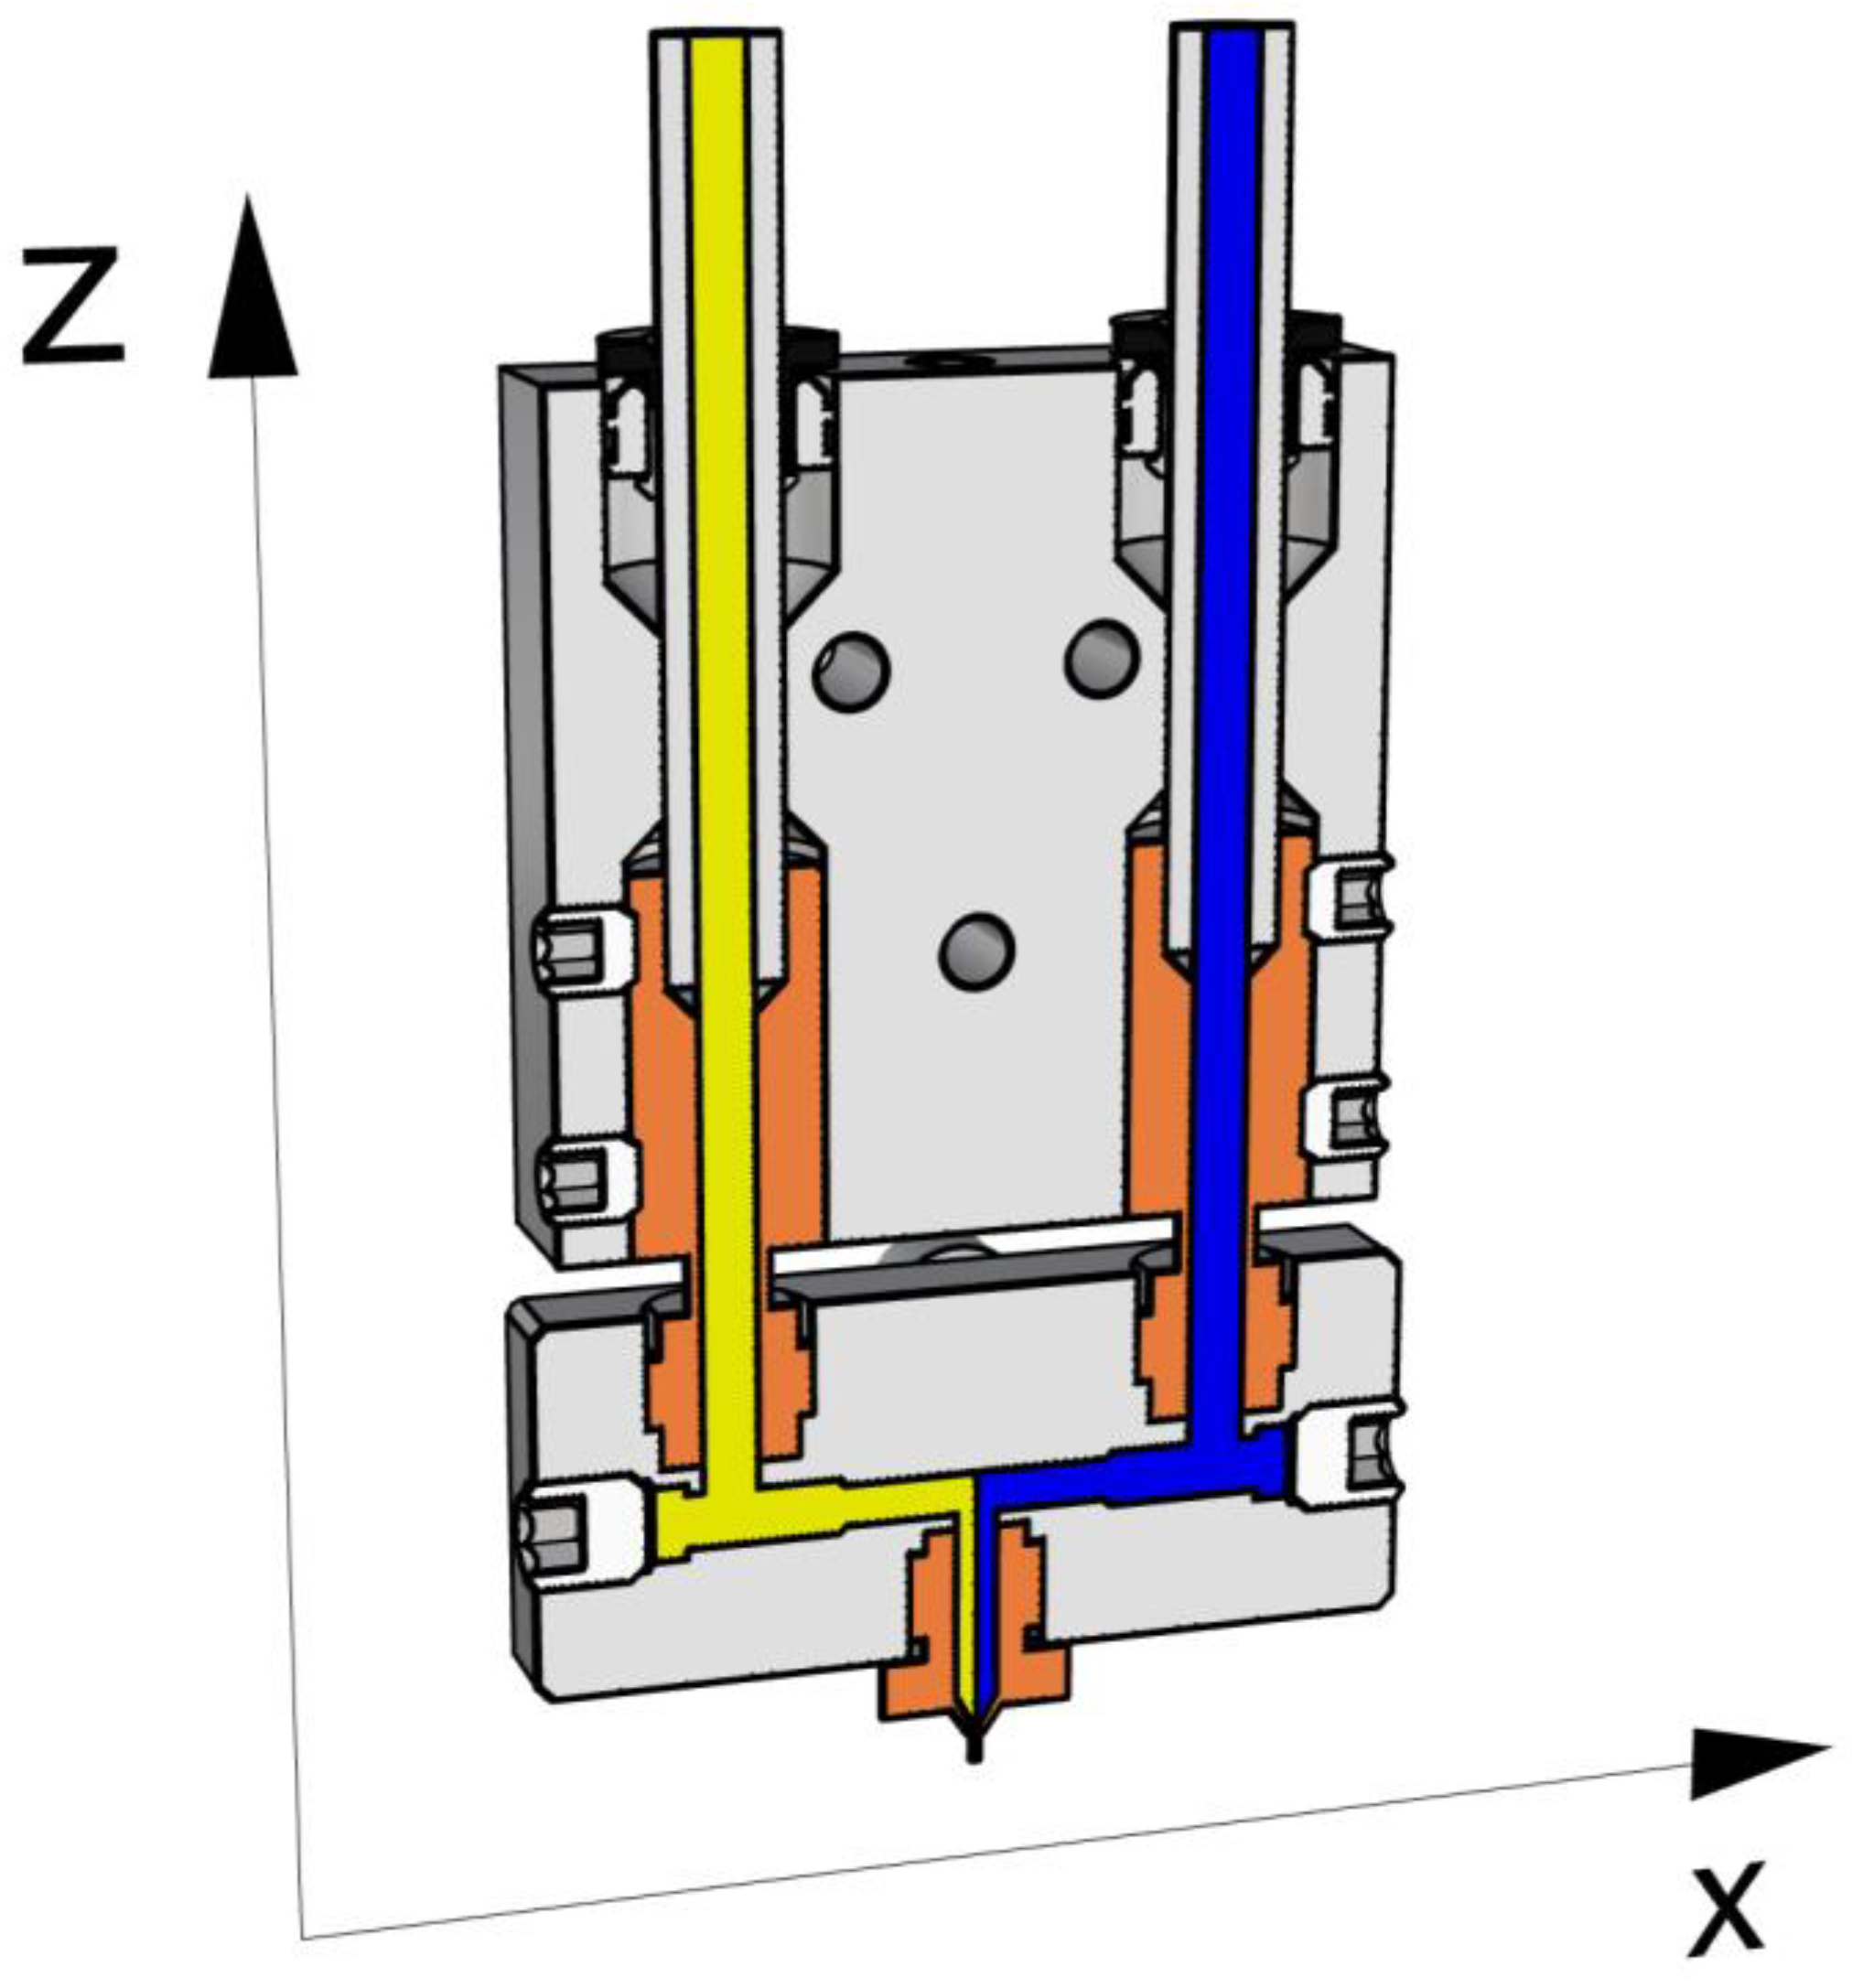
12]. Alternatively, multiple independent extruders can move on an independent head carriage. Another way to add multi-material capabilities to an FDM printer is represented by the multi material units from Prusa3d and Mosaic. Those are standalone systems that can support several filament feeds and combine them to work with most desktop machines. FGMs in MEX can also be achieved by flowing multiple materials using a single nozzle. An example comes from the RepRap project with the diamond hotend [
13]. The hotend system features three independent filament lines, which are controlled according to an established fractional composition, and the combined materials come out of the same nozzle. This type of printing head is often named a mixing nozzle. However, due to the high viscosity, resulting in a laminar flow, the materials come out of the nozzle side by side in a process called coextrusion. Garland and Fadel highlighted the challenges in the coextrusion of FGMs, proposing some solutions regarding the design and the software associated with the process planning, based on a discretized gradient [
14]. Due to the printing ease and the difference between the elastic moduli, PLA and Nylon were selected for the experiments, demonstrating the feasibility of the production of FGMs by FDM technologies.
As an alternative to coextrusion, materials can be mixed to obtain a blend by passive or active approaches. To obtain color mixing, thermo-fluid dynamics phenomena inside a custom nozzle have been studied in depth by Han et al. [
15]. They designed and manufactured a mixing nozzle and simulated the behavior of the melted material inside the extrusion chamber, searching for the most suitable temperature parameters at each extrusion speed to blend the materials. Other research groups have tried to improve the mixing of filaments inside the extruder working on the hardware: Khondoker et al. [
16] proposed an approach based on static mixing, whereas Kennedy and Christ [
17] worked on dynamic mixing. In the first case [
16], the design and characterization of a bi-extruder with a static intermixer was proposed, which can interlock two thermoplastics of different natures, regardless of their miscibility. The components fabricated with this extruder showed a better cohesion between the layers, which reduces the delamination problems. Moreover, the reduction of the extrusion chamber size also reduces the delay between one composition and another one. In general, the use of an intermixer could improve the strength and aesthetic homogeneity when compared to those which were achieve using a coextrusion. Kennedy and Christ [
17] proposed a process named “in situ blending”. The extruder was designed to be adaptable to common low-cost machines, and it contains a drill bit that actively mixes the filaments inside the extrusion chamber using different types of bits with an adjustable speed. Using this extruder, the authors produced specimens with blended PLA and Thermoplastic Polyurethane (TPU) or PLA and Nylon. The result, in general, shows how the blending process, which previously required several different steps, can now be carried out in a single step with this extruder, thereby raising the range of possibilities obtainable with a common 3D printer.
This works aims to lay the foundations to understand the FDM coextrusion process, identifying models of material distribution from a geometrical point of view, which is the base used to describe mechanical properties. Based on a simplified deposition model, the couplings of PLA-TPU and ASA-TPU were analytically, numerically, and experimentally investigated by elastic models, the Representative Volume Element (RVE), and tensile tests.
3. Results and Discussions
Table 4 summarized the investigated cases. The validation of the deposition model was obtained by the superimposition of the microscope image with the expected results. The comparison of the mechanical properties computed by the models and experiments was performed on the elastic modulus.
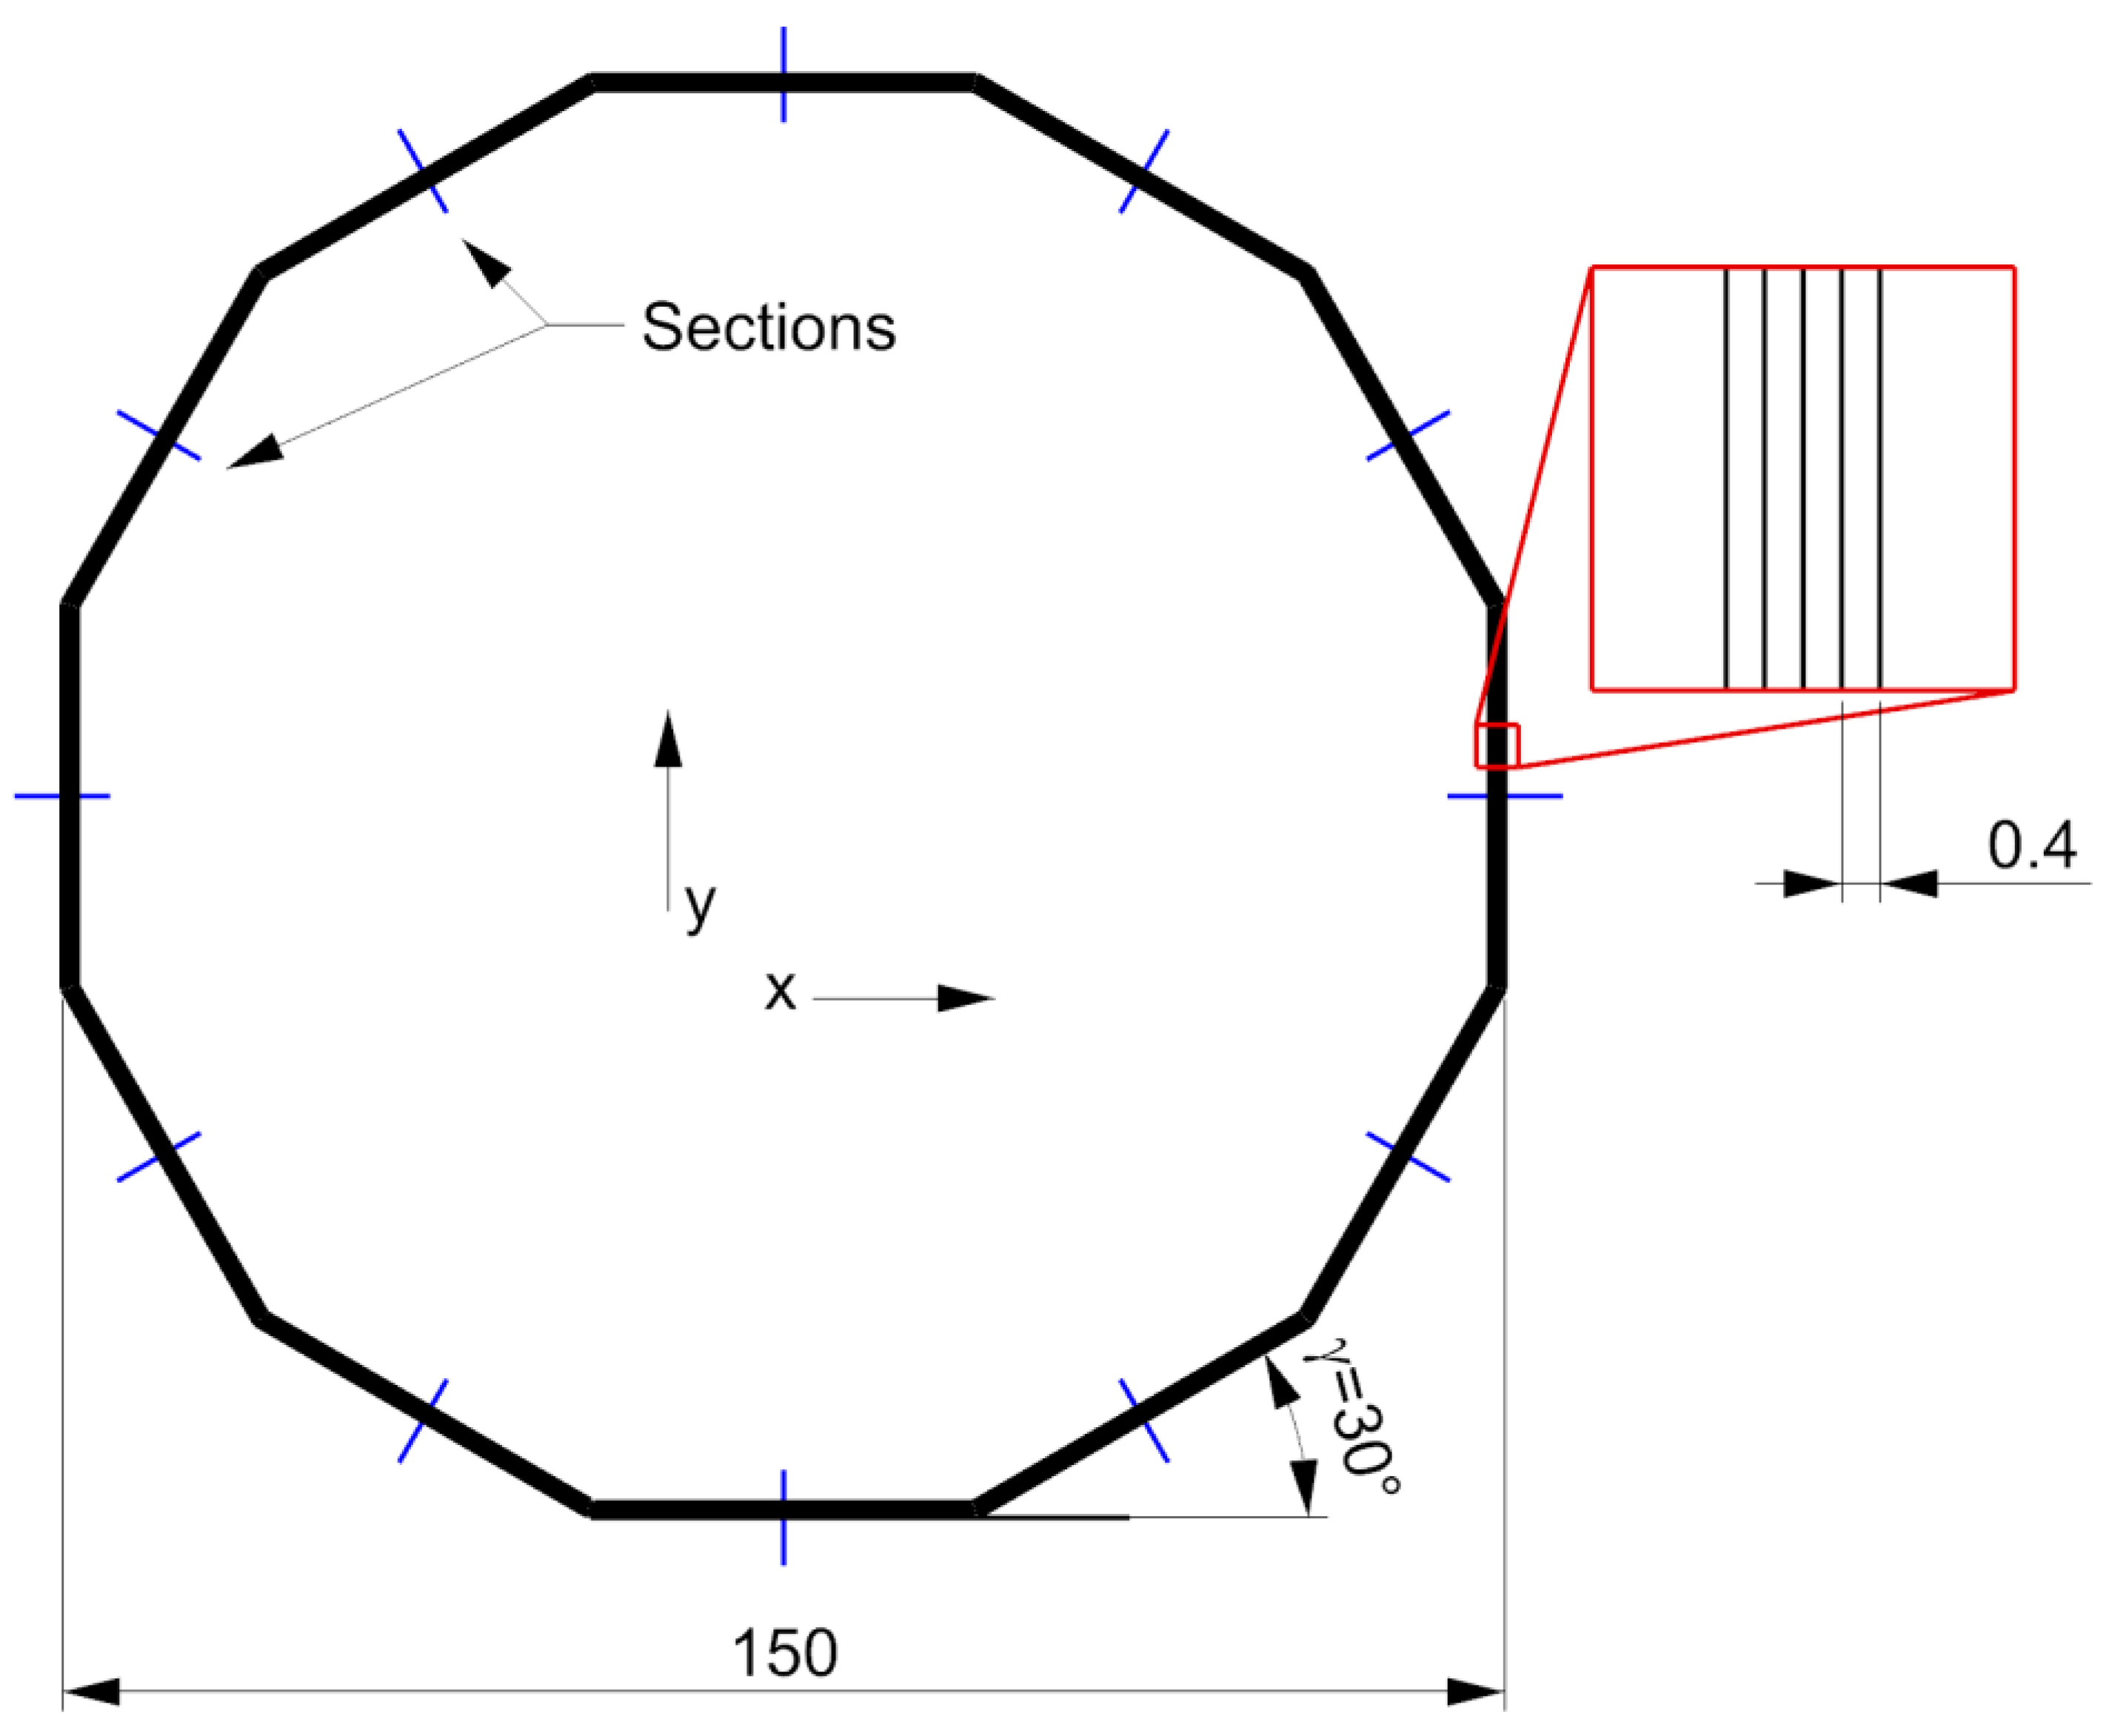
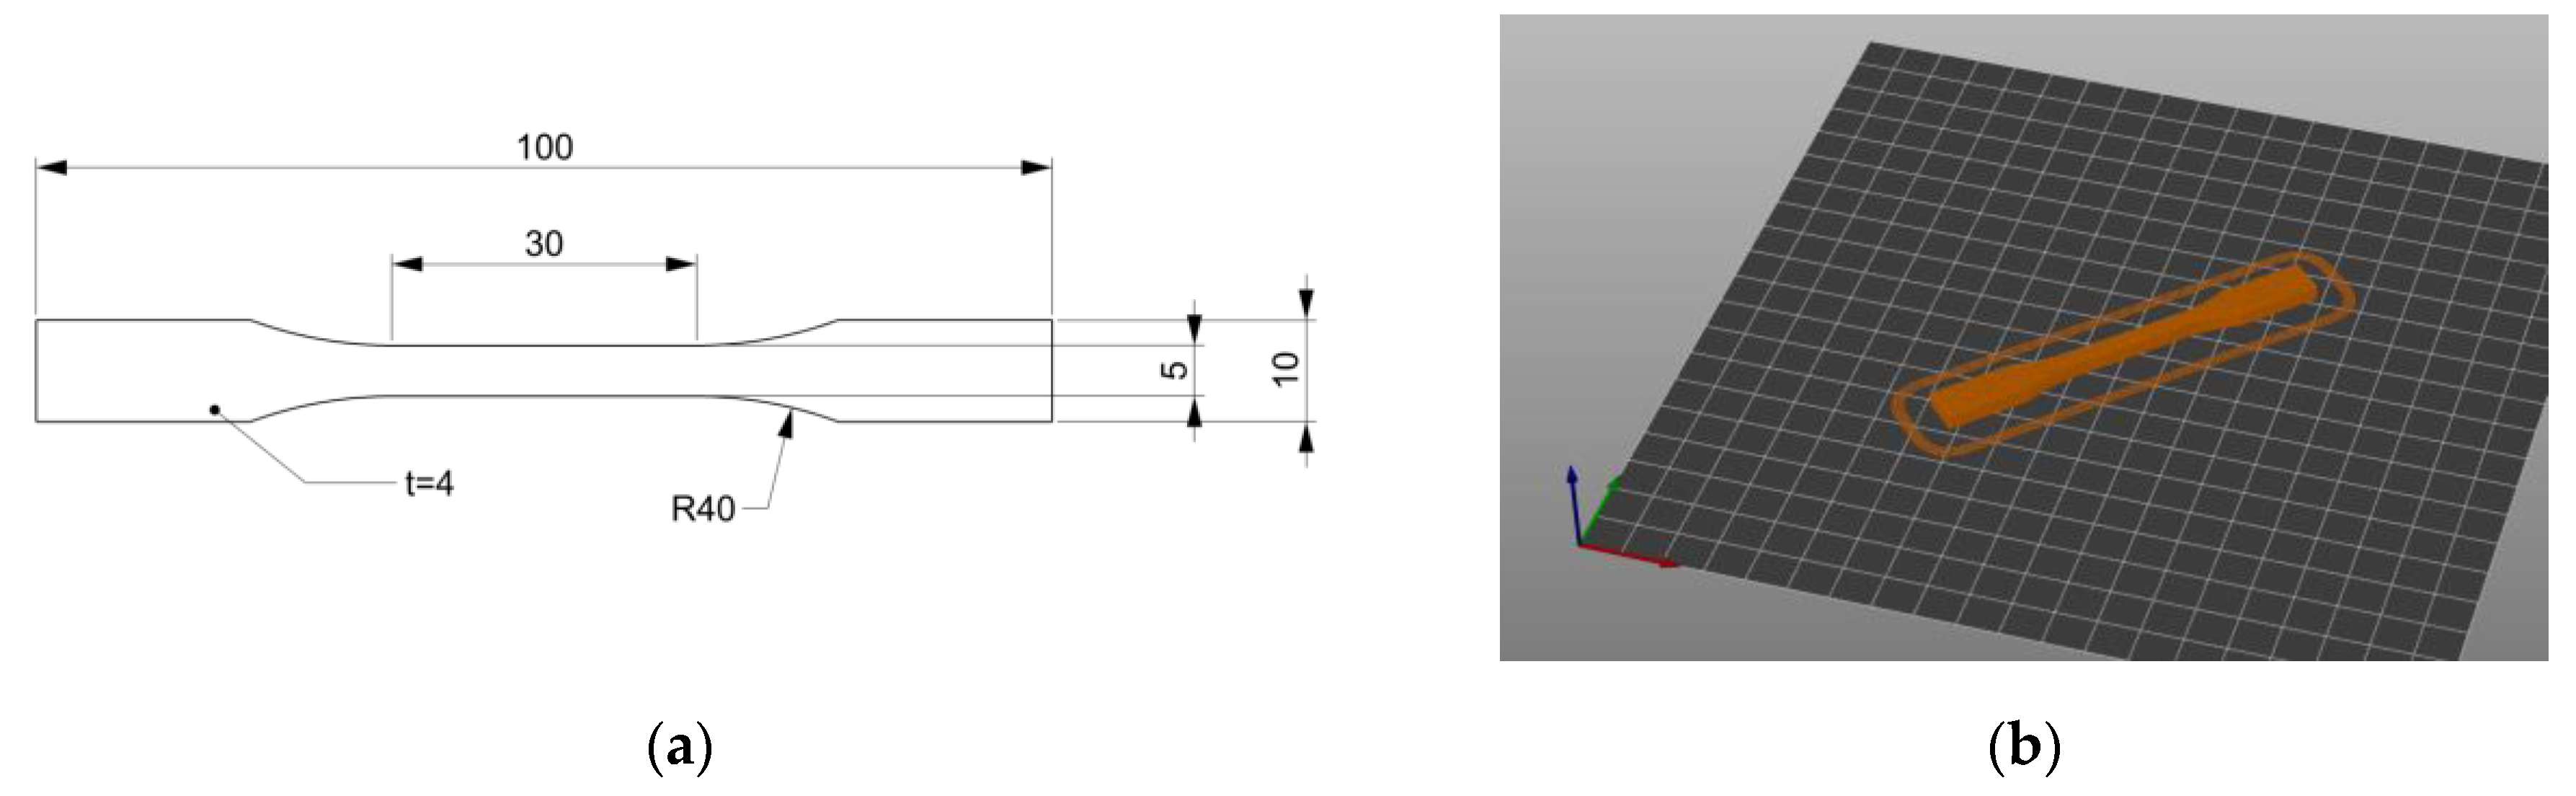
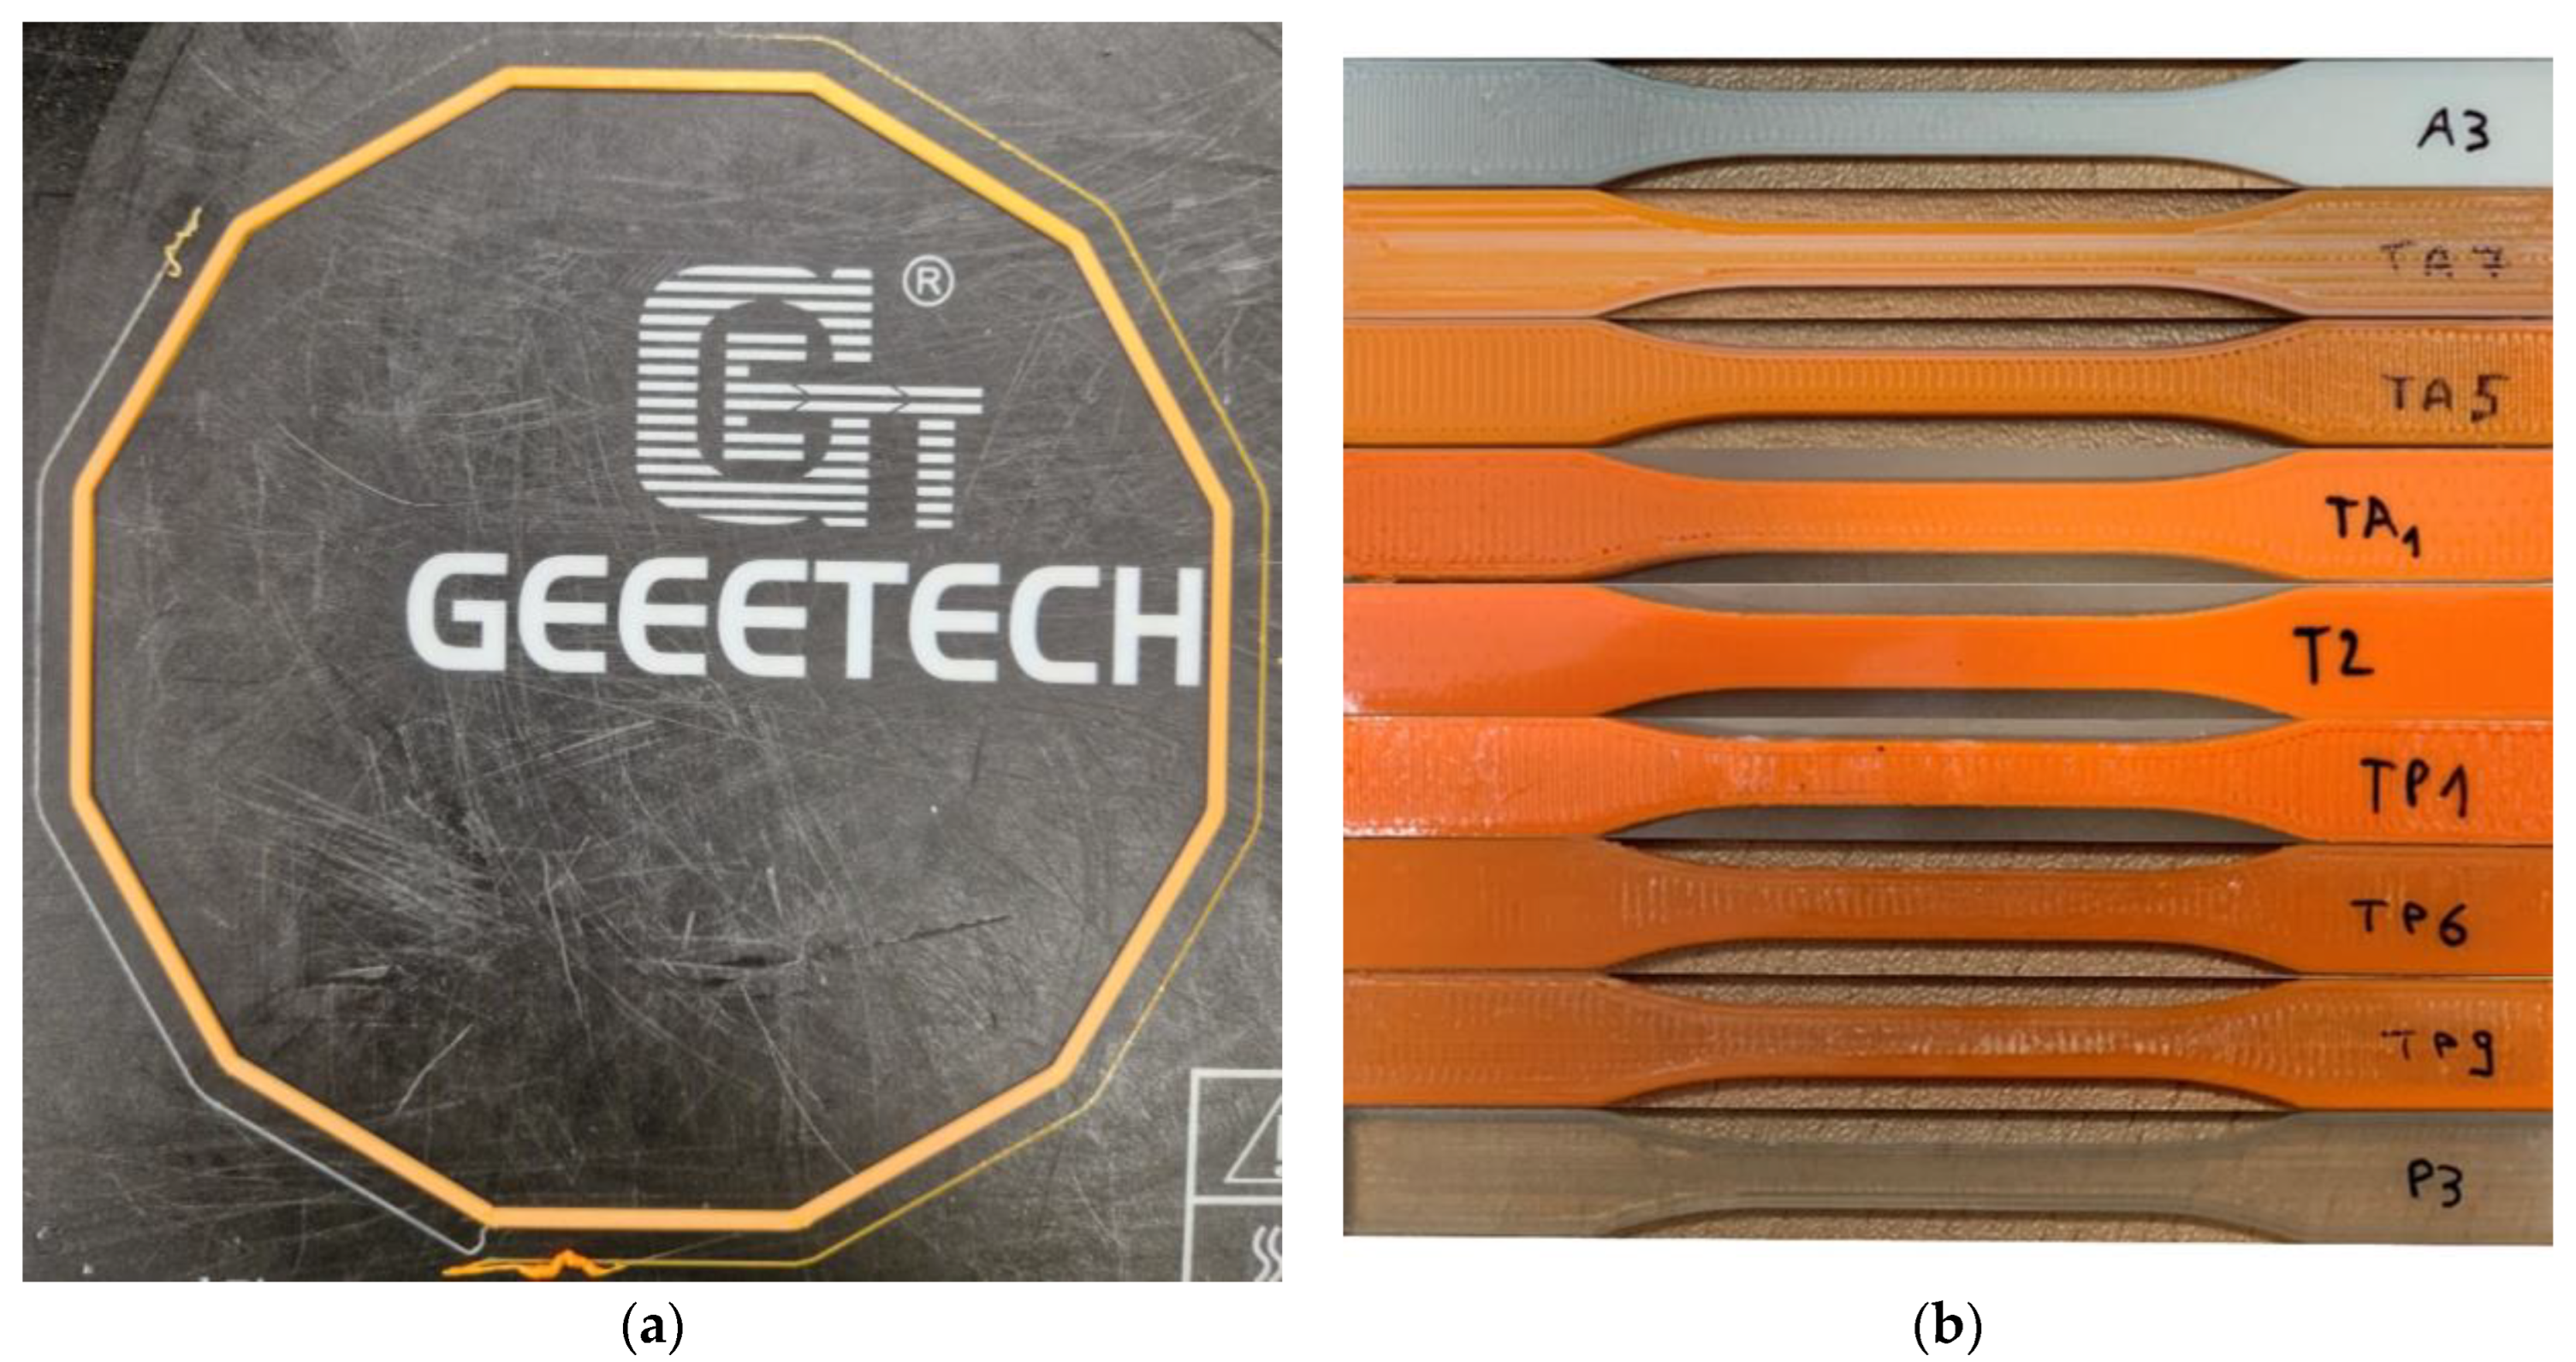
Figure 8 shows some of the manufactured samples; the regular dodecagon used to evaluate the interface between the deposited materials is shown in
Figure 8a, whereas
Figure 8b shows one tensile test specimen for each material mixture.
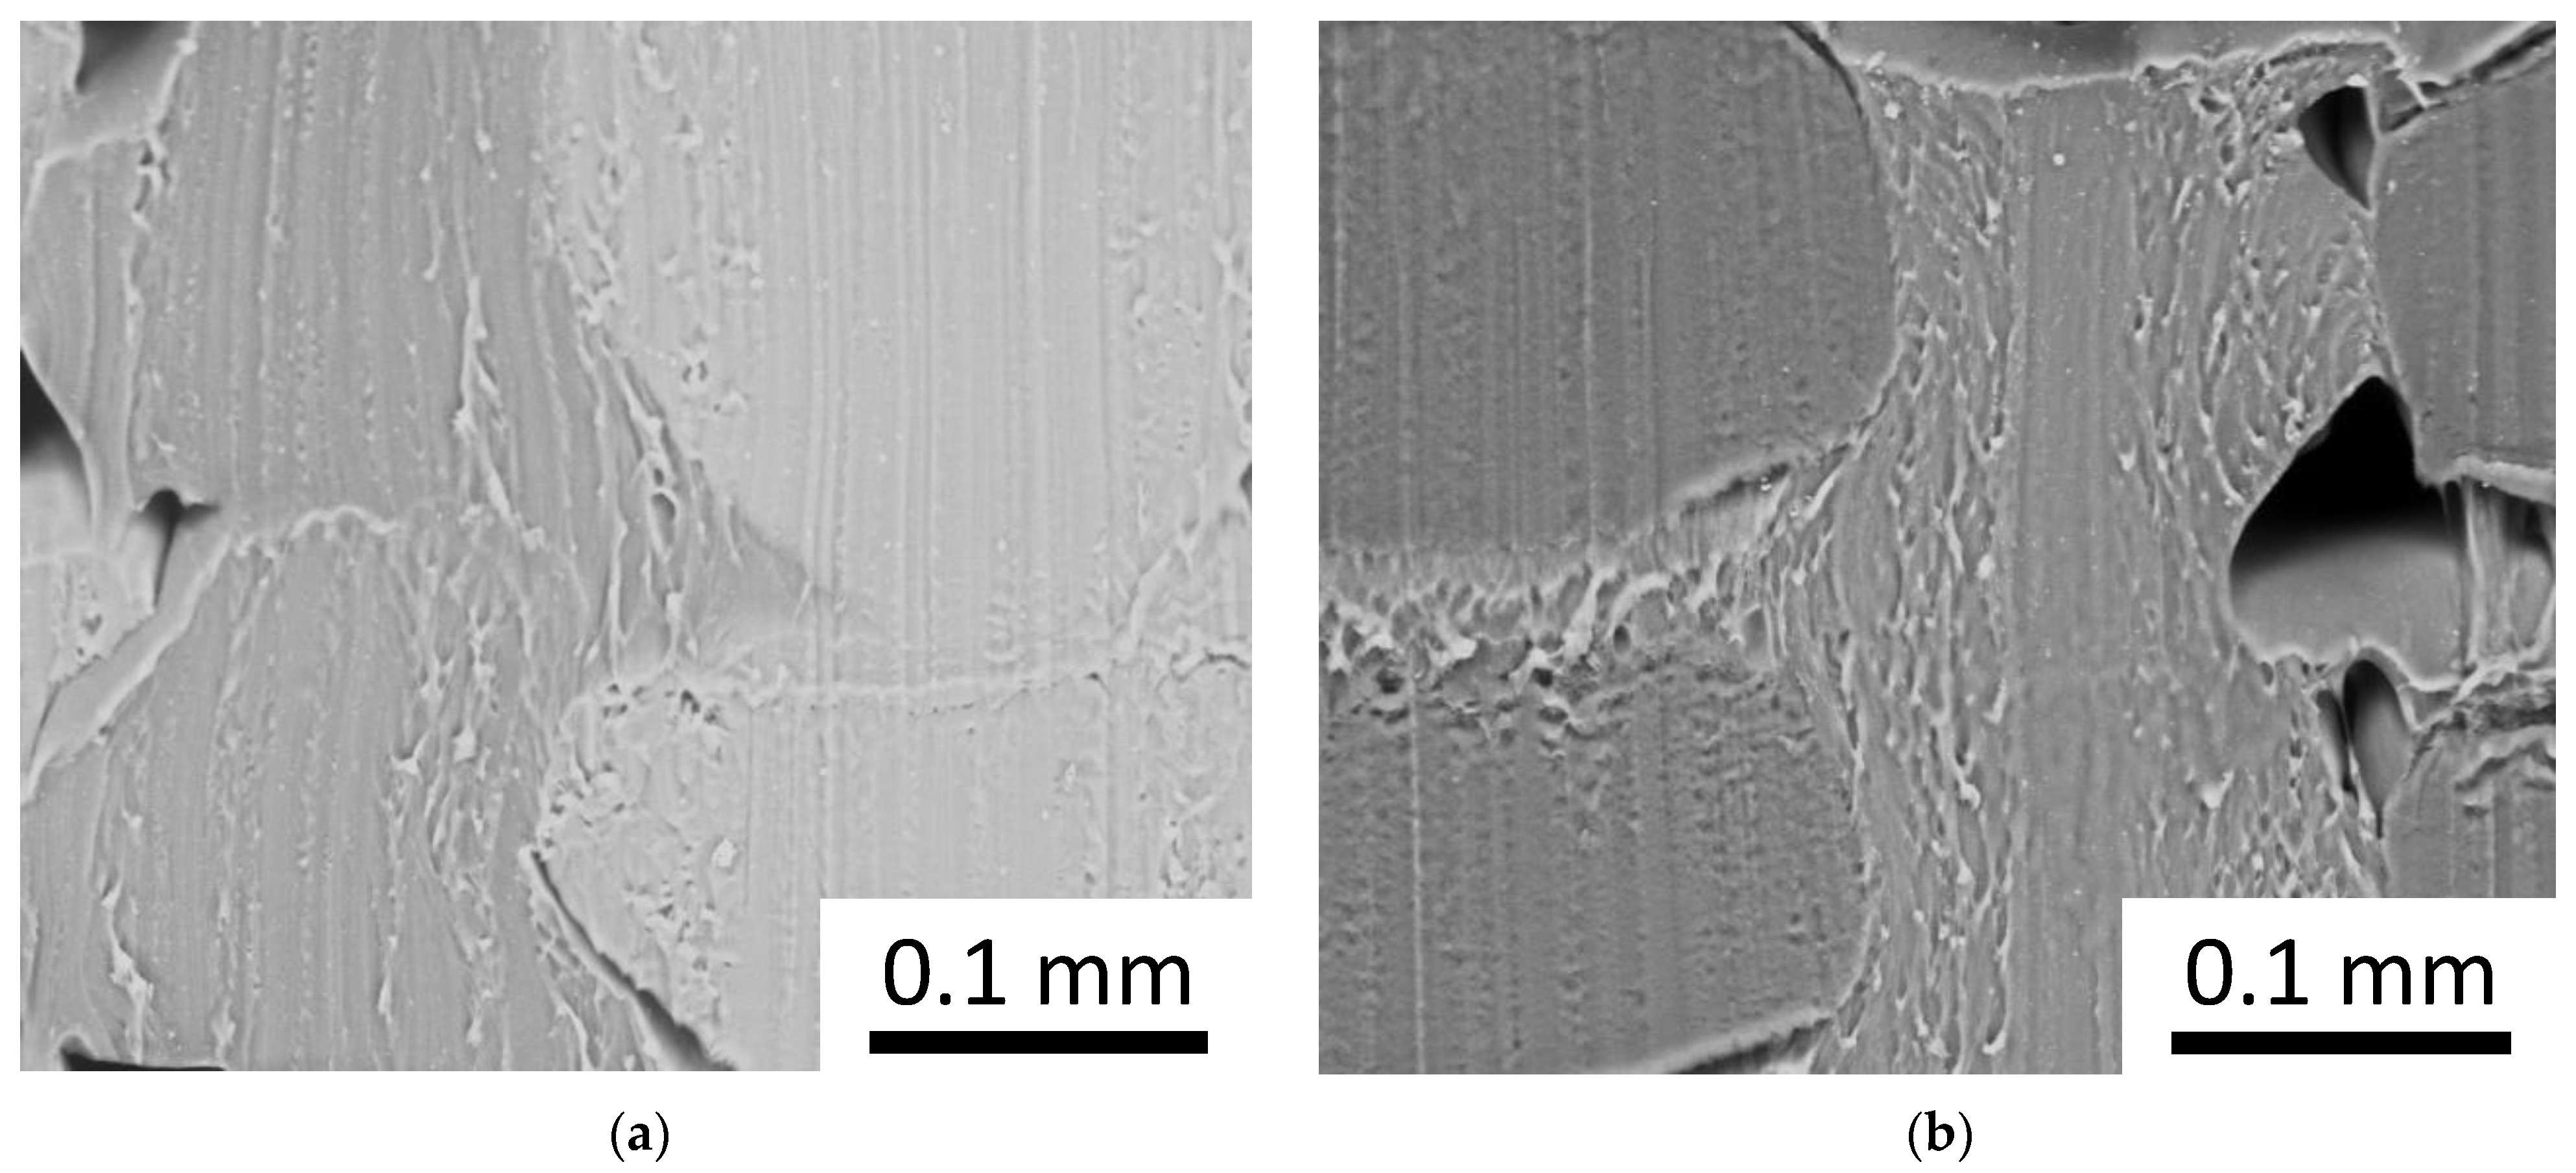
Figure 9 shows the SEM images of a section of the dodecagon with a 0.5 material fraction. In both of the mixes, i.e., PLA-TPU and ASA-TPU, the coextruded stripes show a clear separation between the materials, i.e., the materials did not mix, and they consolidated together with an appropriately strong adhesion. Moving to the interface between the stripes, in the same or in different layers, a good adhesion between the materials can be observed, even if a few pores appear, which are typical of the FDM process [
44,
45]. These defects can be mitigated by the tuning process parameters such as the raster angle, build orientation, flow, and temperature [
46,
47,
48]. Moreover, the different melting temperature of the materials leads to a different viscosity, and more fluid material allows for a better flow in the nozzle and leads to a better coverage of the pores. Other aspects that influence material adhesion are related to adsorption, diffusion, and electrostatic phenomena [
49]. In the coextrusion process, the more compliant material reduces the product defects and increases the manufacturability; indeed, the TPU compliance and adhesion compensate for the solidification shrinkage of the other material, especially in the case of ASA, reducing the delamination among the layers and increasing the strength of the adhesion to the printer bed surface.
3.1. Materials Deposition
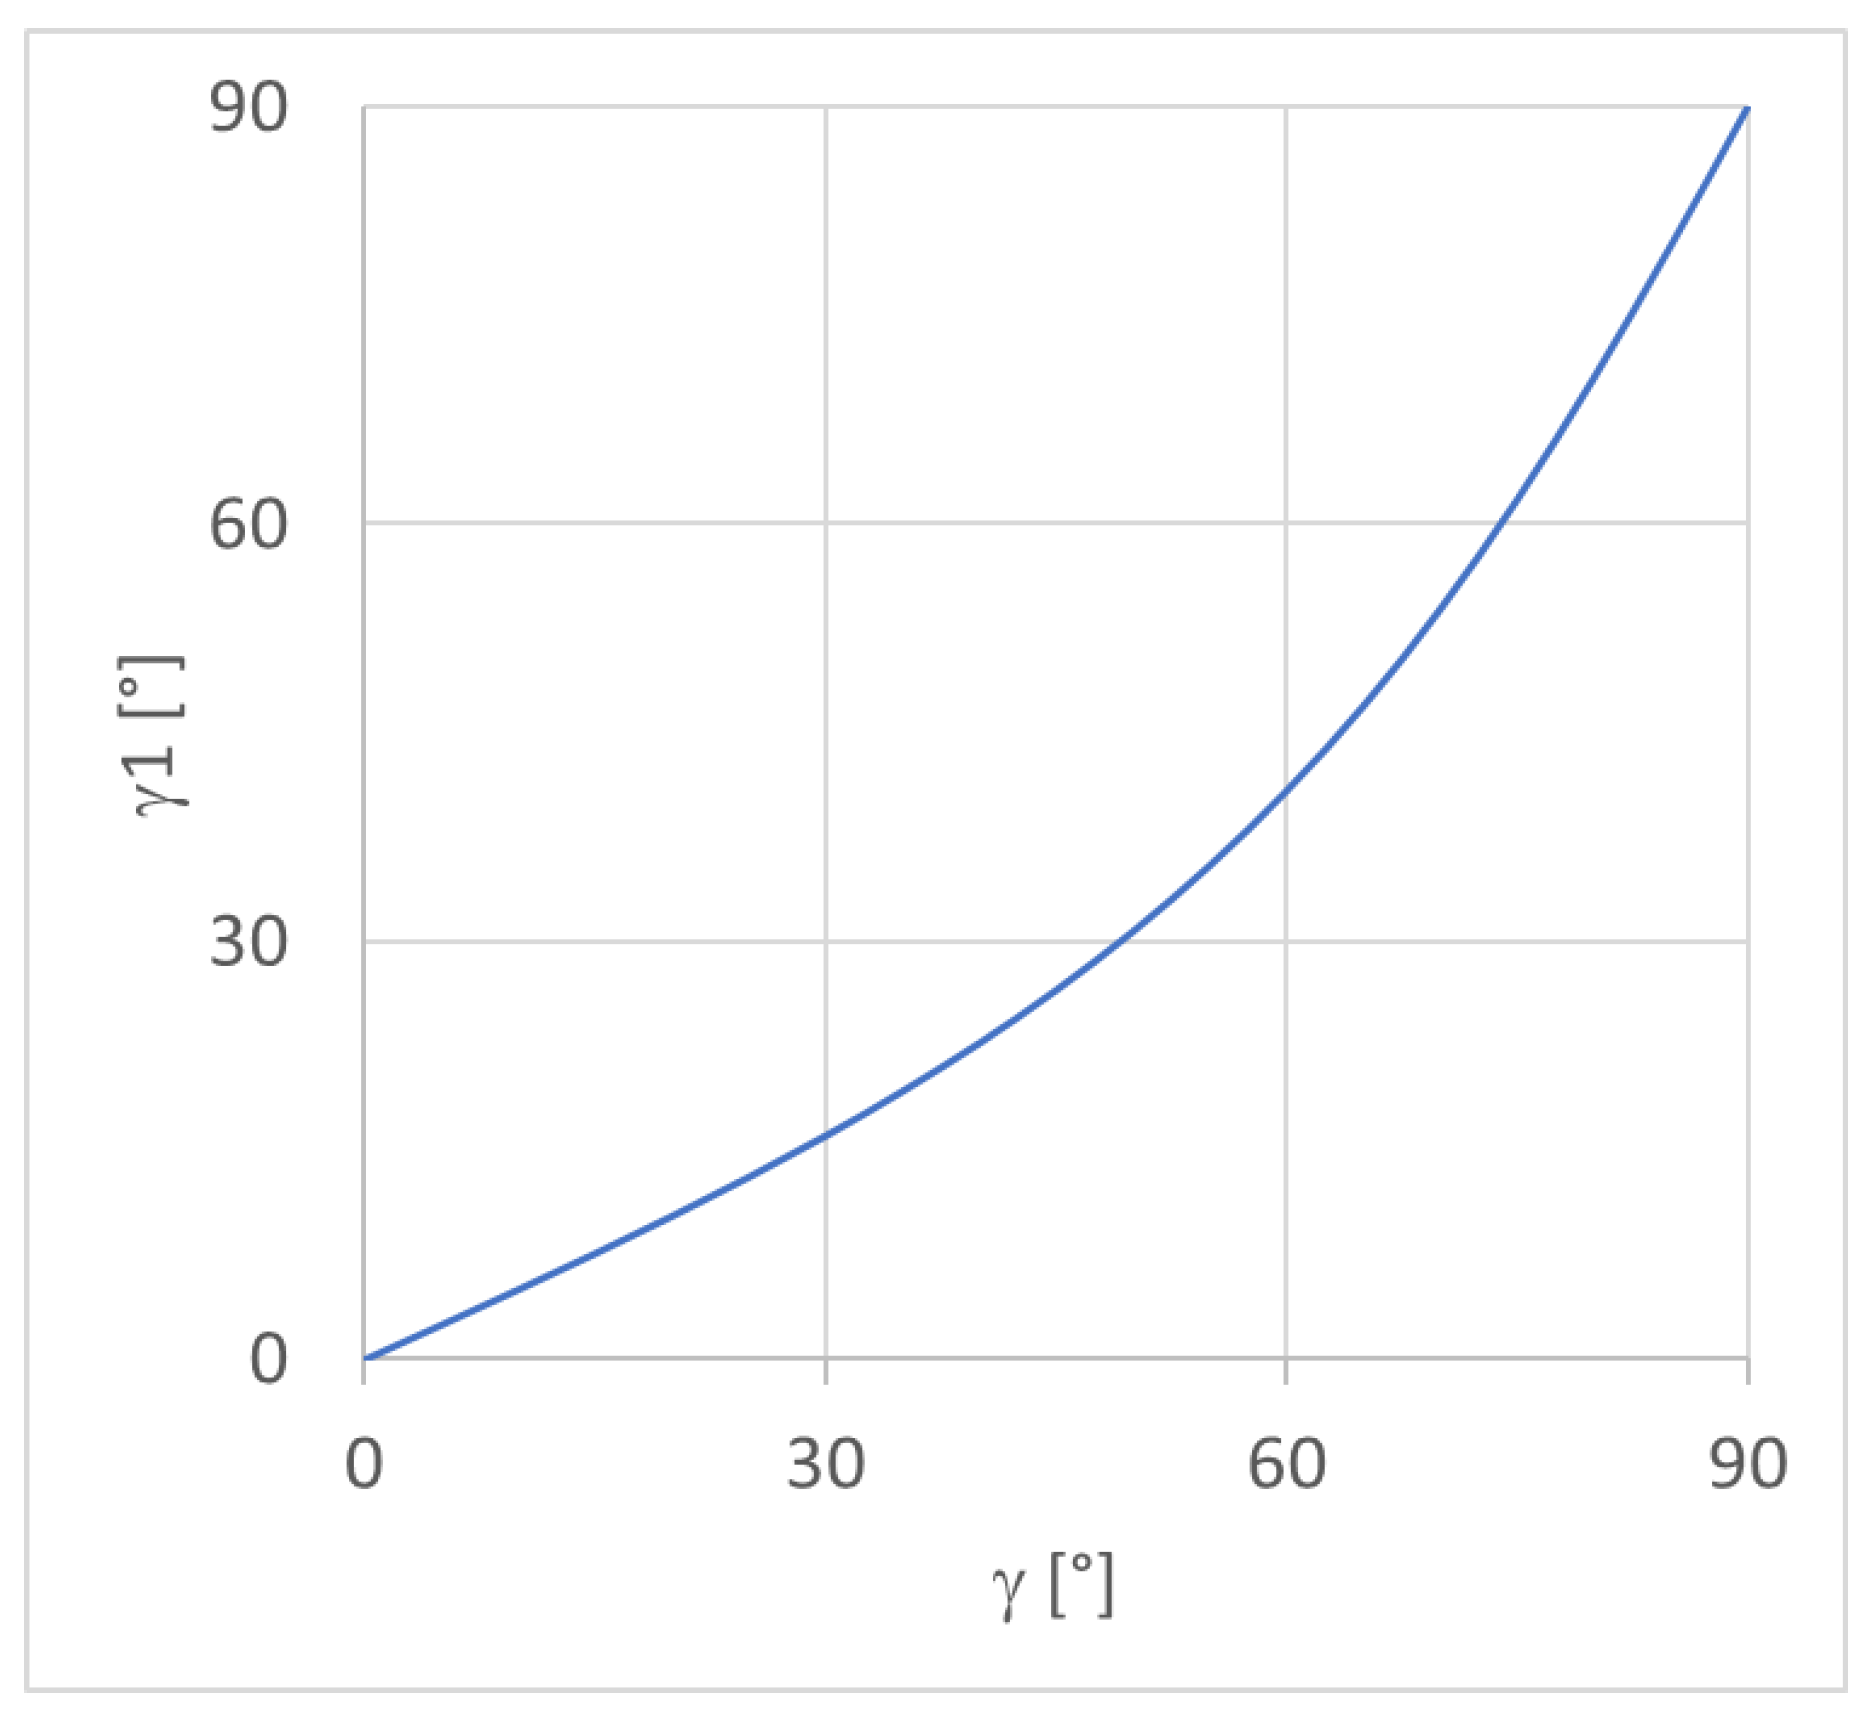
Using the adopted process parameters, i.e.,
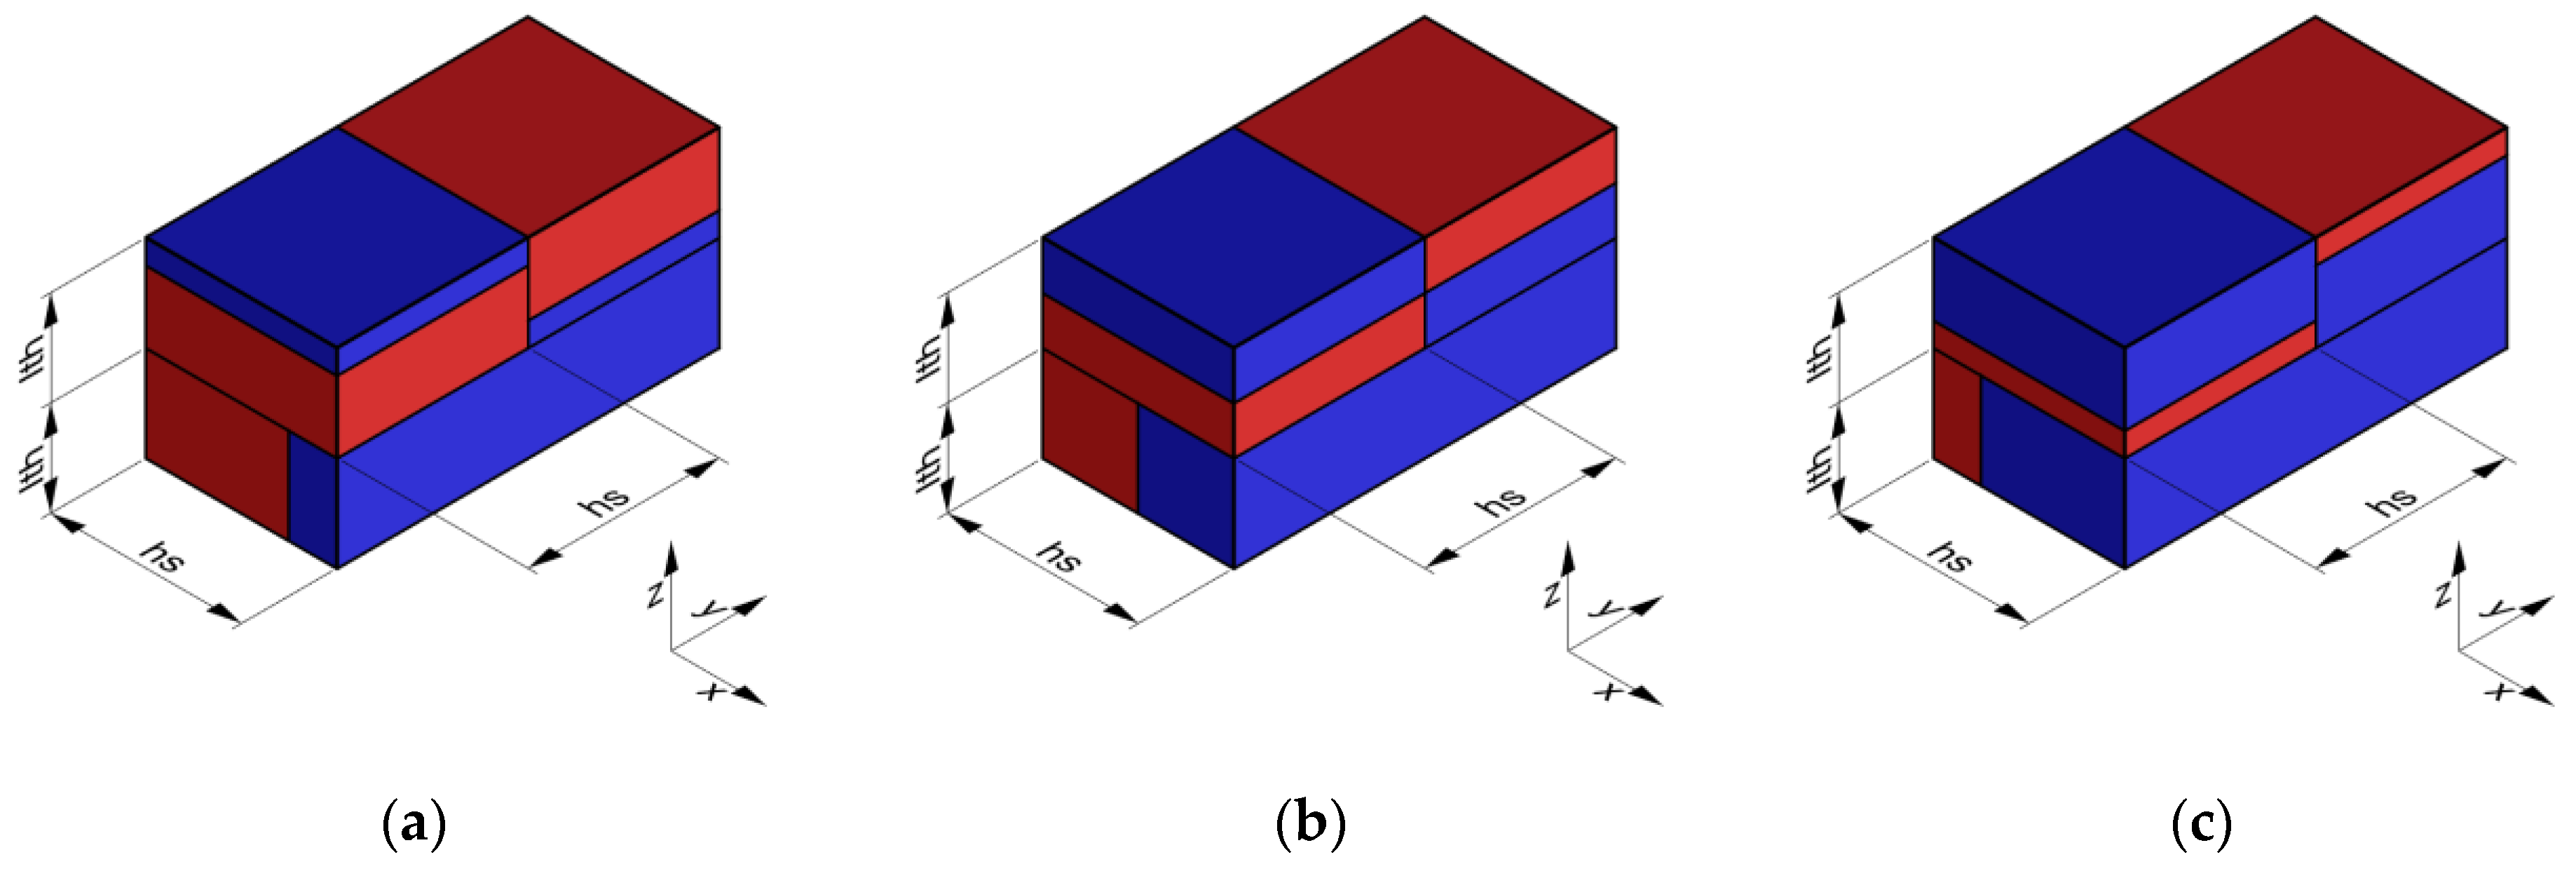
lth = 0.2 mm and
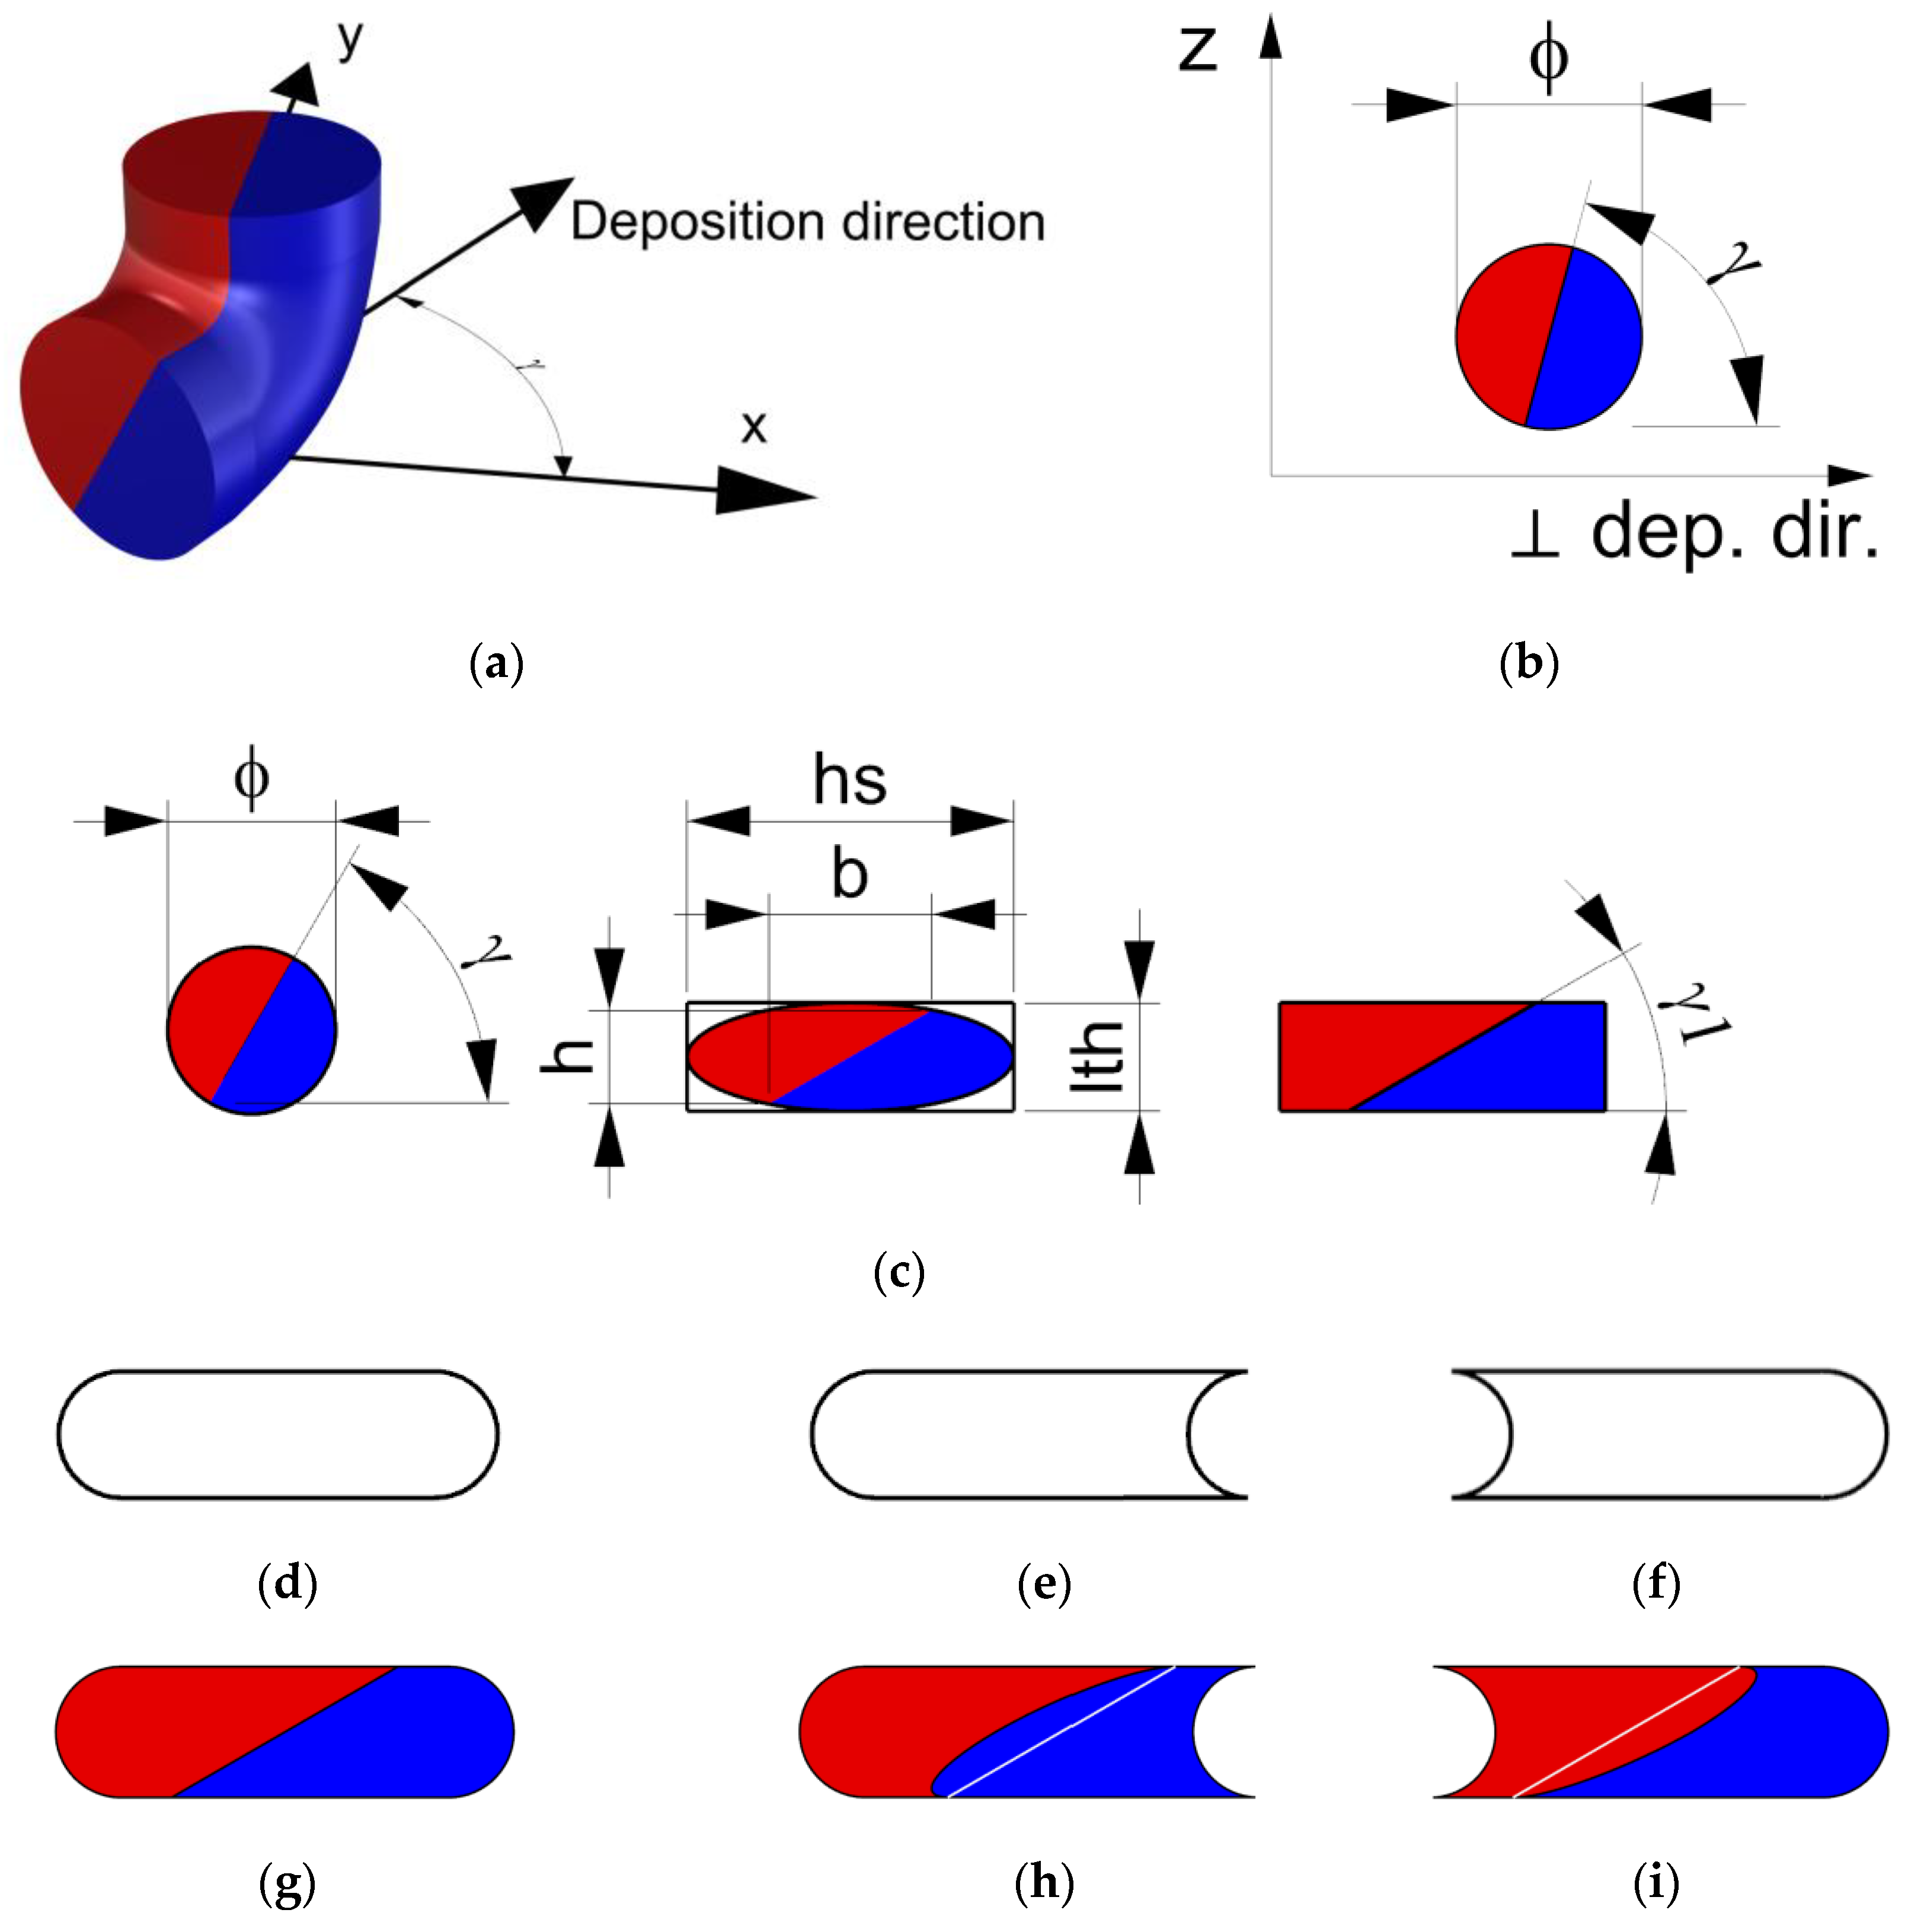
hs = 0.4 mm, the inclination of the interface between the materials
γ1 (
Figure 3c) is represented in
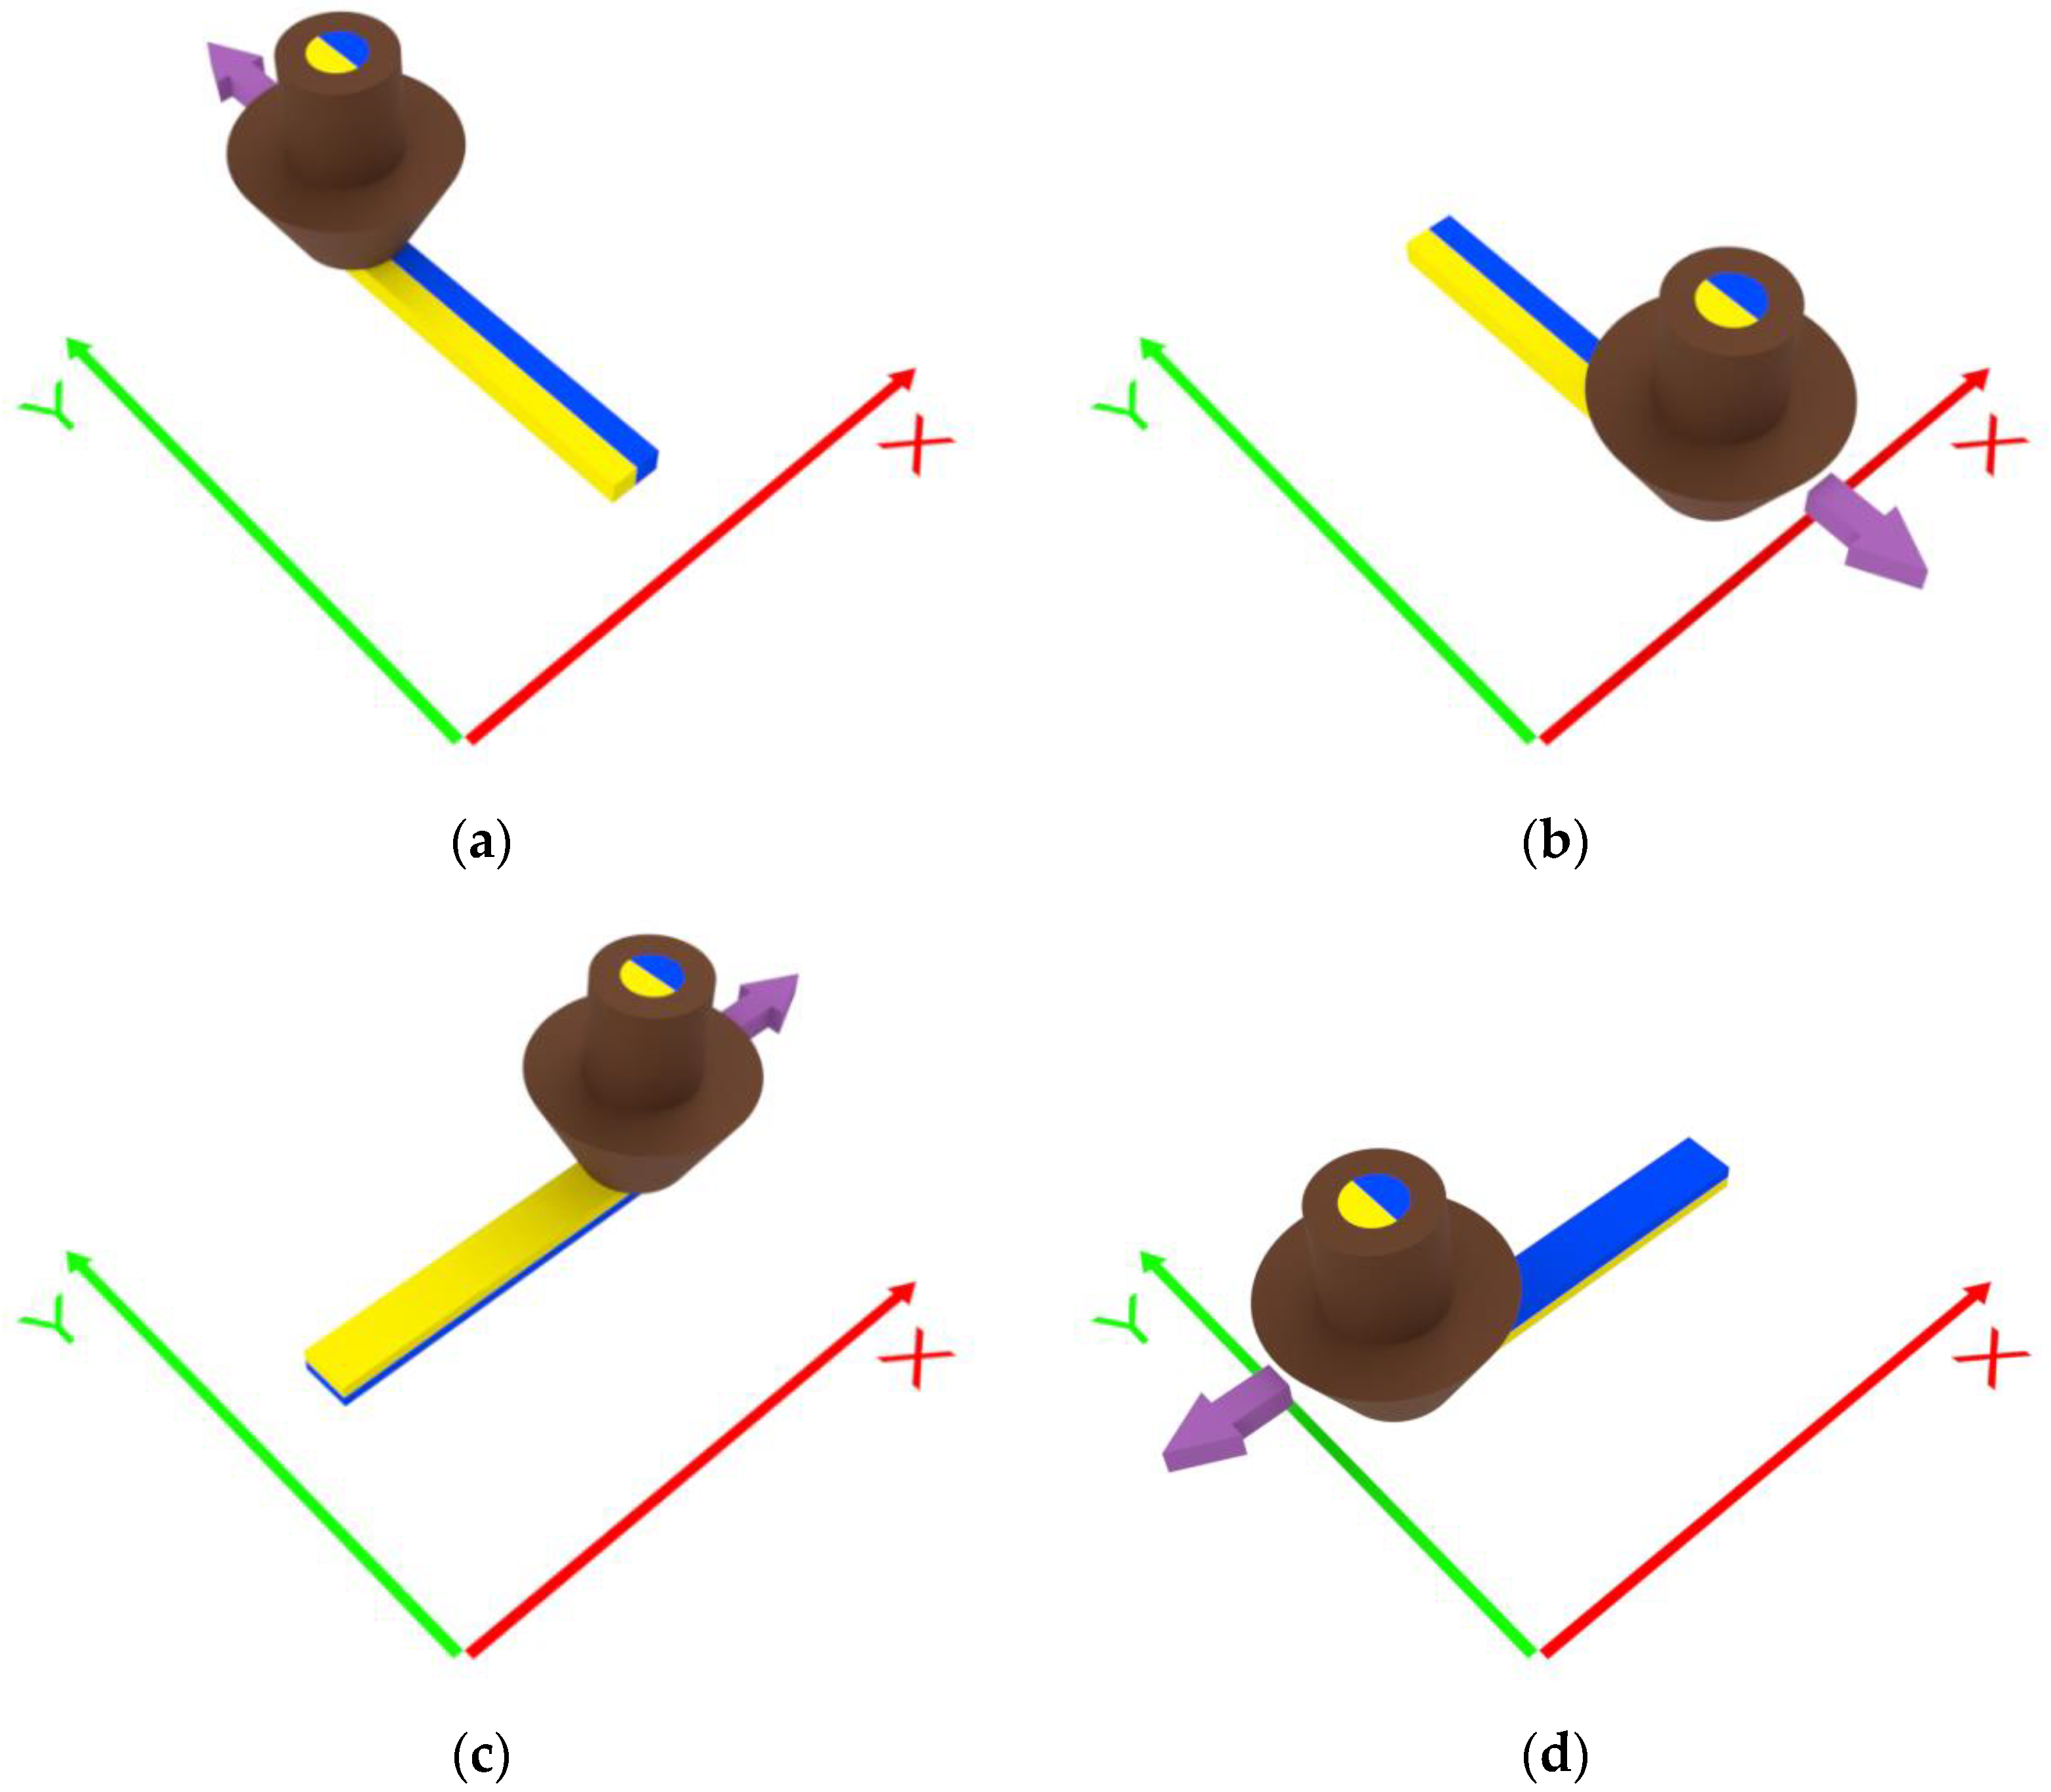
Figure 10, which was acquired according to the deposition direction
γ and Equation (3). The trend is not linear, and the inclination of the interface is always lower than the deposition angle.
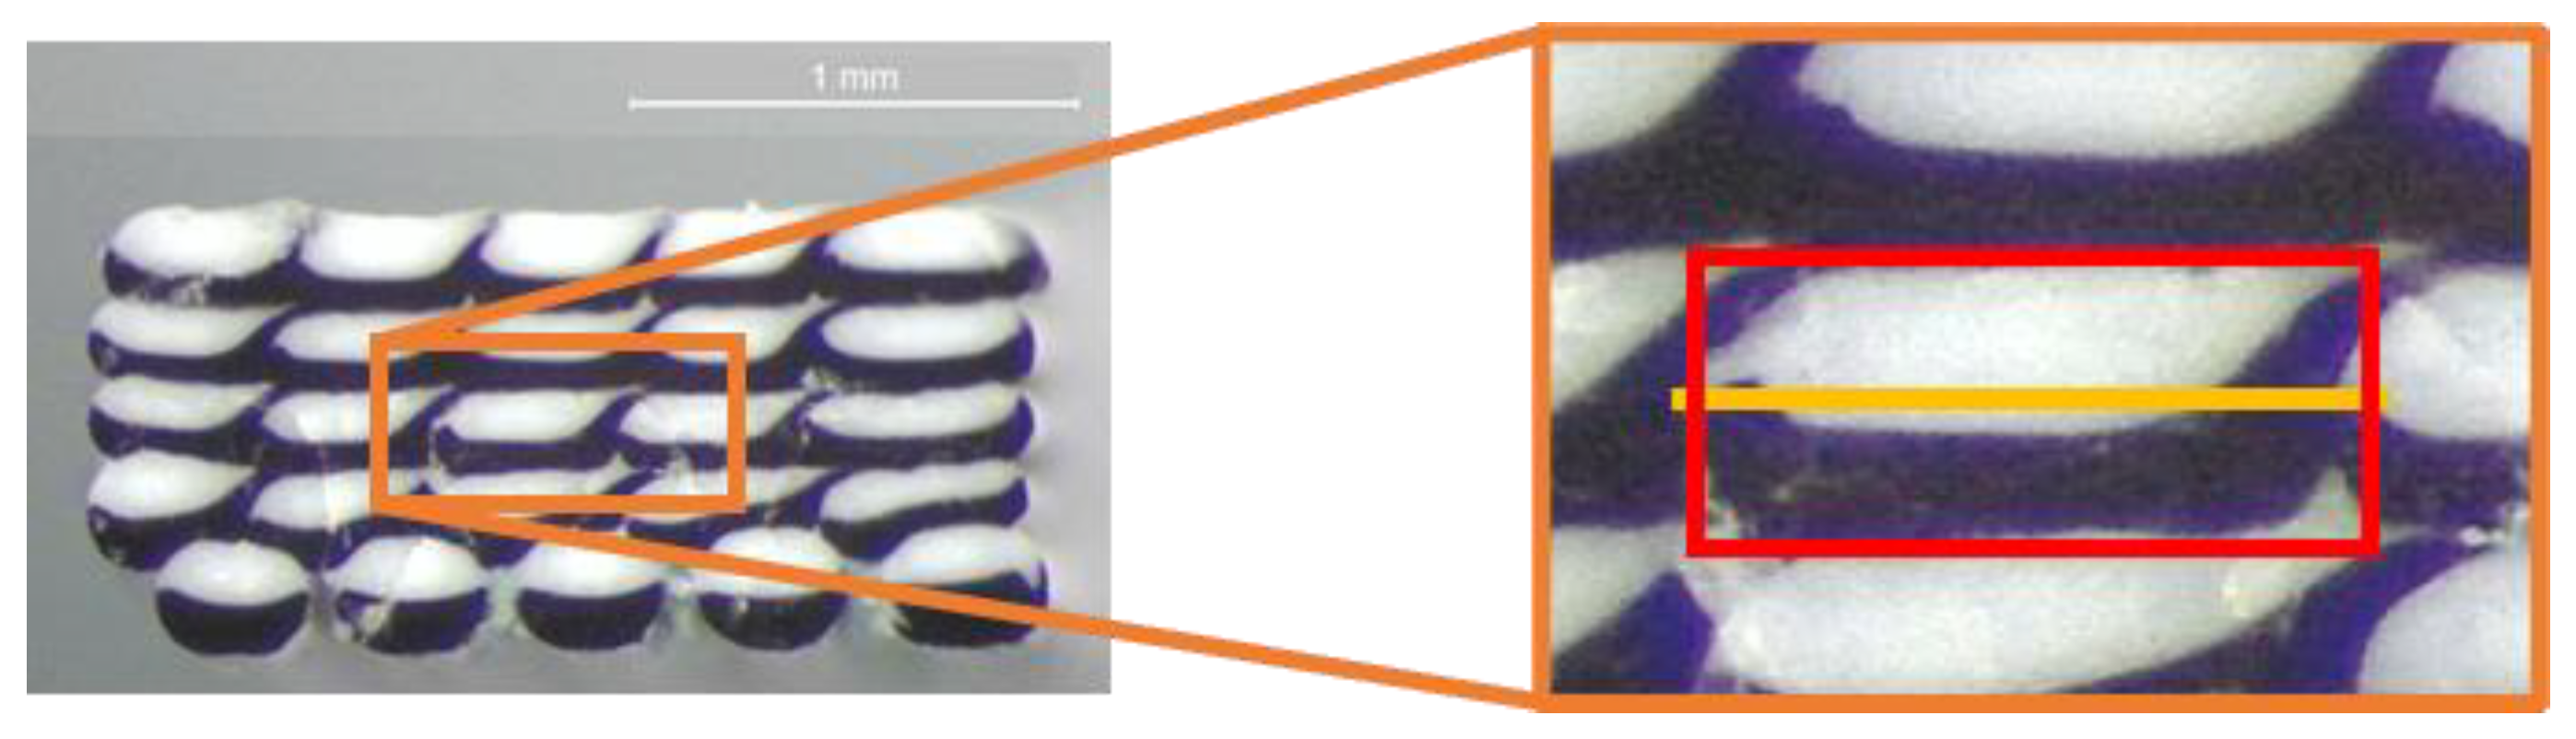
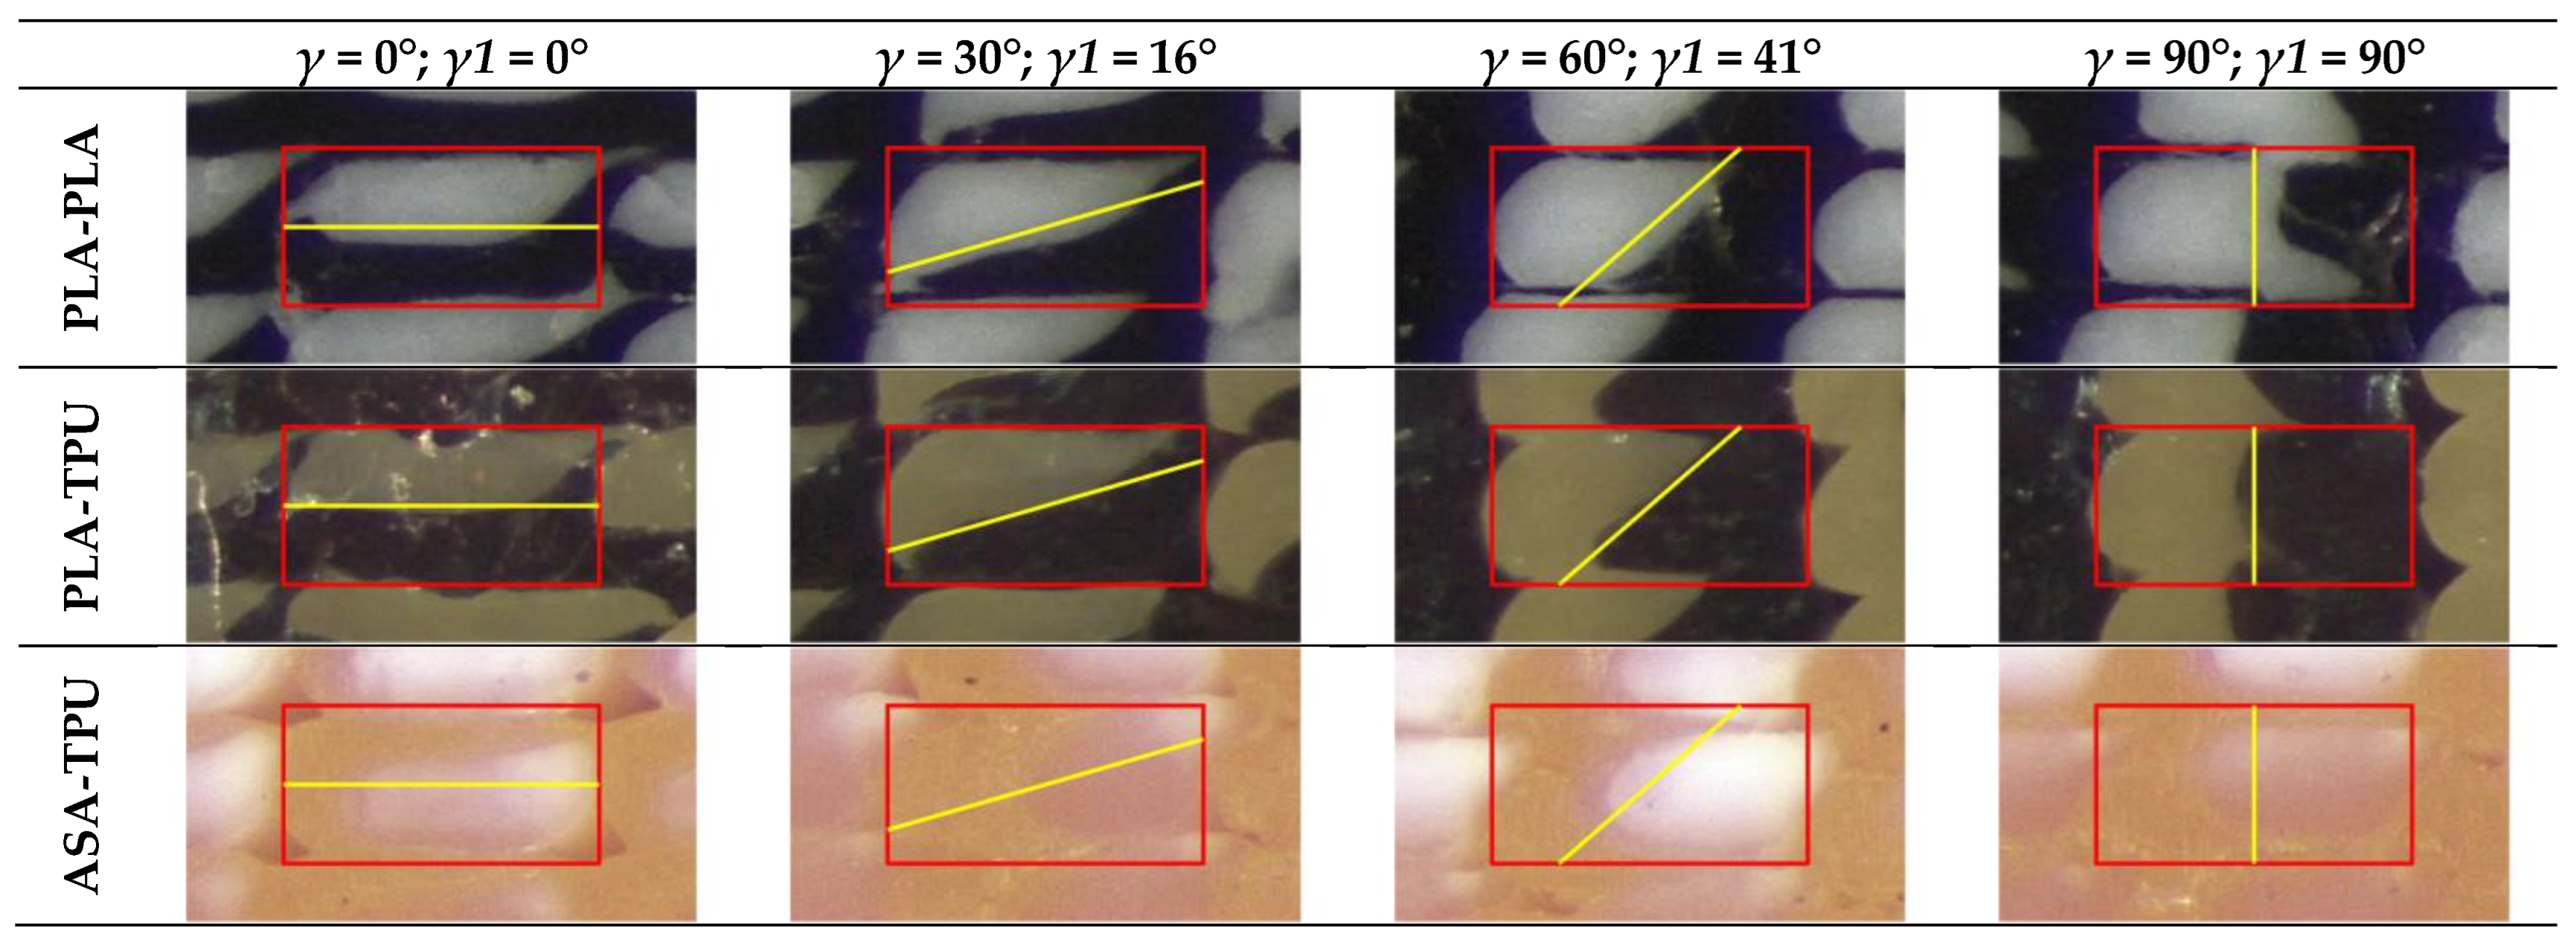
To evaluate the actual interface between the coextruded materials and avoid boundary effects, the central stripe of each dodecagon section, representing the 3rd stripe of the 3rd layer, was extracted and superimposed onto the rectangular deposition model presented in
Figure 3c, together with the angles of
Figure 10 (Equation (3)), as shown in
Figure 11. The rectangular deposition model was selected to reflect the condition of the analytical model and the RVE analyses.
Figure 12 shows the actual cross section of the material deposited in the dodecagon, which was superimposed onto the rectangular model for the three pairs of materials, PLA-PLA, PLA-TPU, and ASA-TPU, at 50% of the material fraction. Due to the periodic behavior, only the results in the range of 0–90° are presented. The yellow lines represent the inclination of the interface between the materials
γ1 according to Equation (3) and
Figure 10, while the red rectangle represents the rectangular deposition model (
Figure 3). As observed in the SEM images, a clear interface between the coextruded materials appears both inside each stripe and between the stripes. It can be observed that the proposed model accurately represents the actual angle formed between the two coextruded materials especially in the pairs PLA-PLA and PLA-TPU. ASA-TPU slightly differs from the model; in this case, there are bigger deviations such as non-linear “shapes” in the material interfaces, such as squeezing or warping in the center or alterations towards the corners. The deviations from the model can be due to the differences in the materials’ rheological properties according to the temperature, such as surface tension, viscosity, diffusion, the hotend dynamics [
45], the deposition order of the pattern, and the polymers’ density. For example, the upper right corner of every section forms a hook-like shape involving the downer material due to the deposition order so that the deposited material “anchors” to the previously deposited one. Moreover, porosities can be appreciated at the four corners among the stripes that are typical of the FDM process, and they can be removed, as previously discussed, by tuning the process parameters.
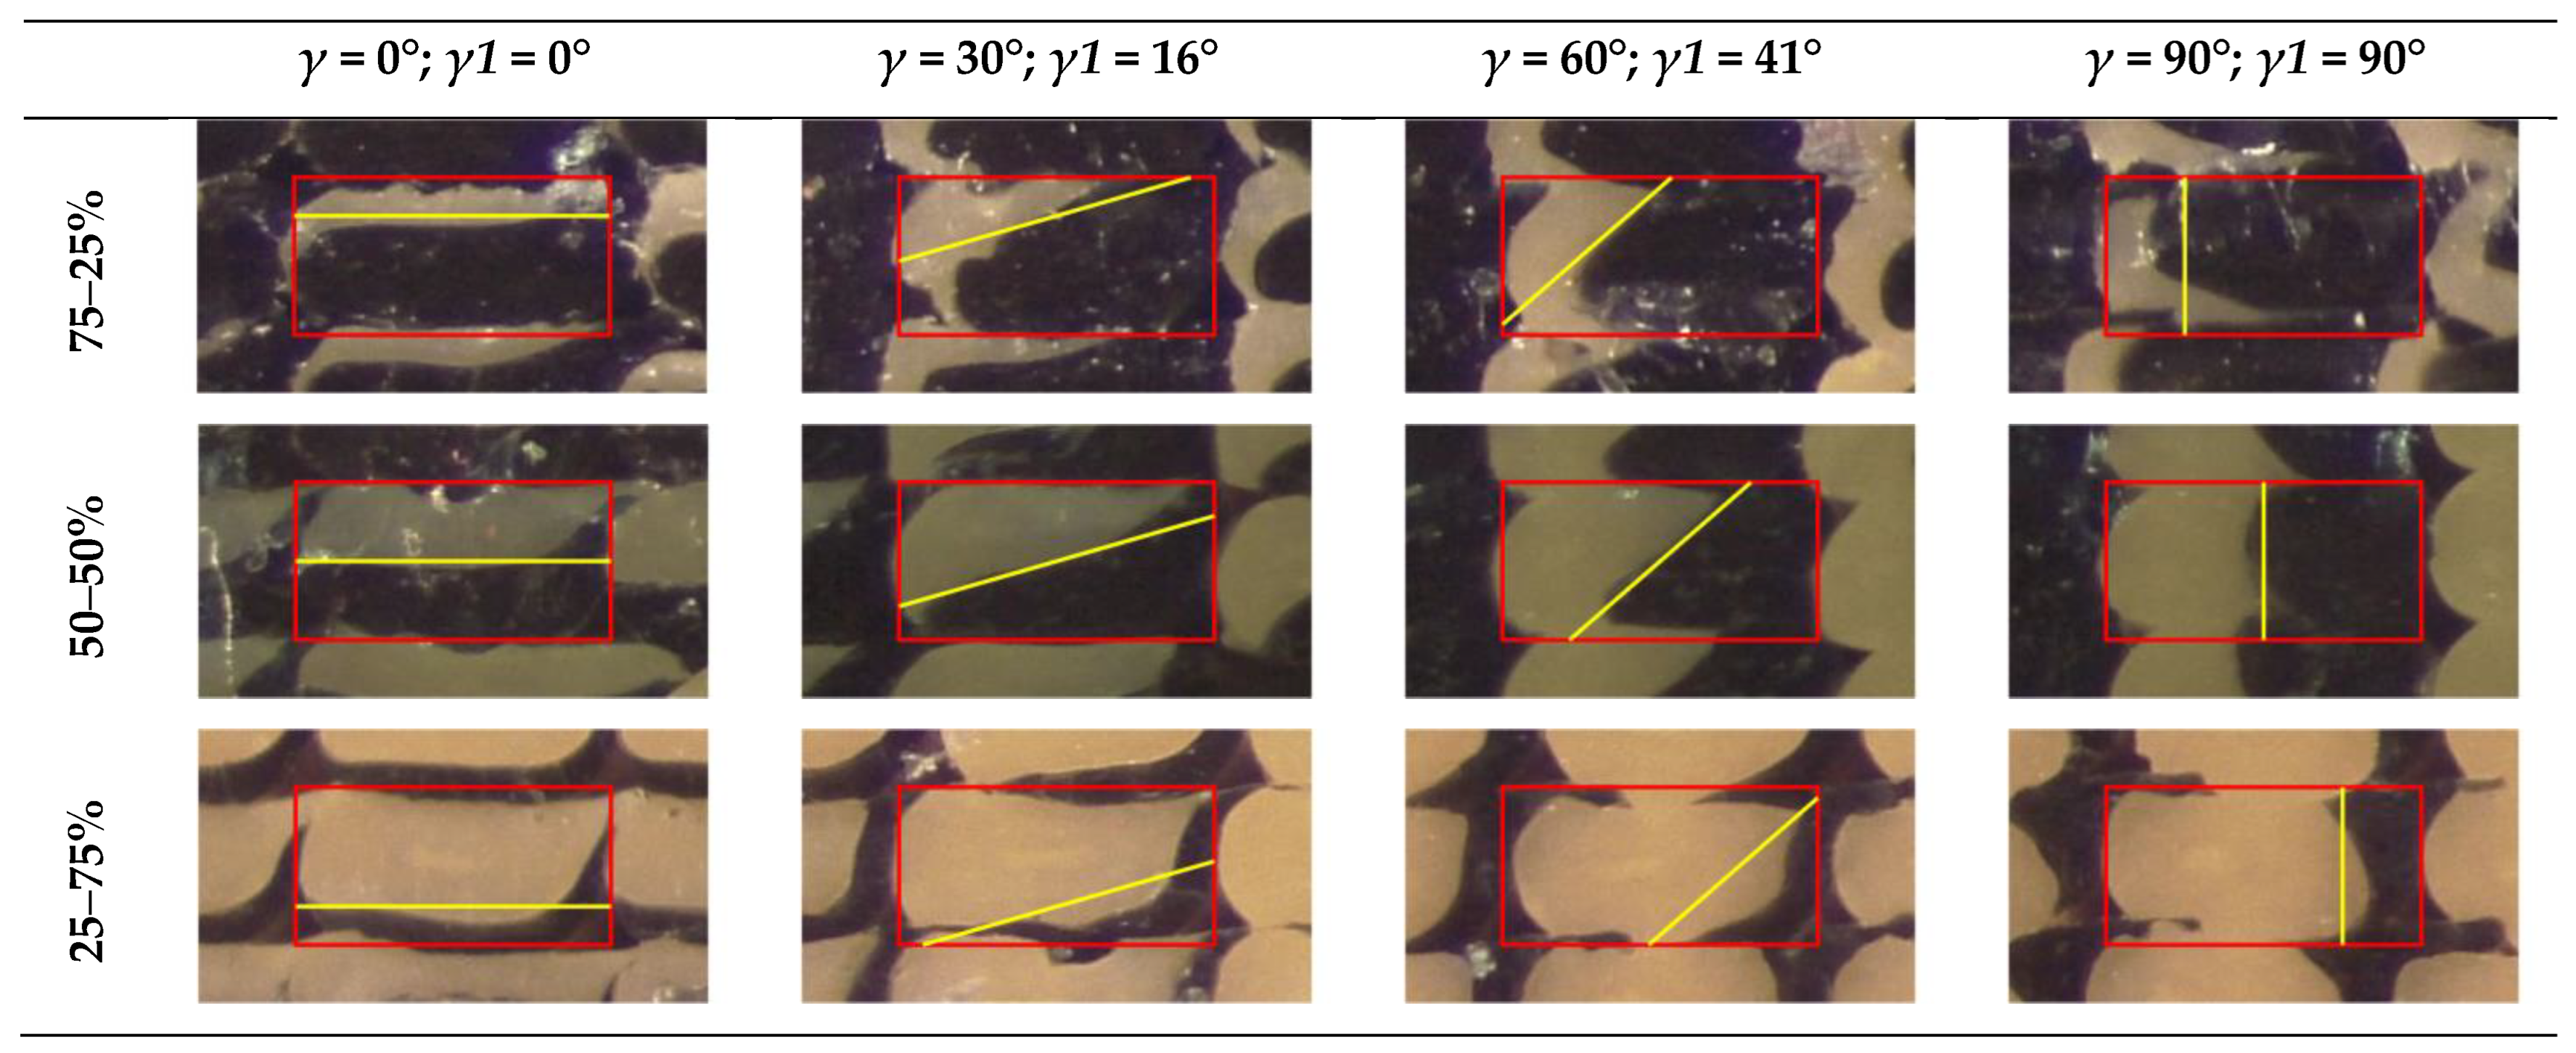
Figure 13 shows the actual cross section of the deposited material, which was superimposed to the rectangular model of PLA-TPU for three material fractions: 75–25%; 50–50%; 25–75%. The yellow lines are translated to reflect the material fraction in the rectangular model (red line), as proposed in
Section 2.3. Considerations that are similar to the previous case can be made, and it is possible to observe that the translation related to the material fraction is effective. Moreover, the interface between the coextruded material is not perfectly straight, and it is more similar to the model based on the rounded rectangle as shown in
Figure 3. On the other hand, this first approximation can be considered to be adequate for the analytical model and for the RVE simulations.
3.2. Mechanical Tests
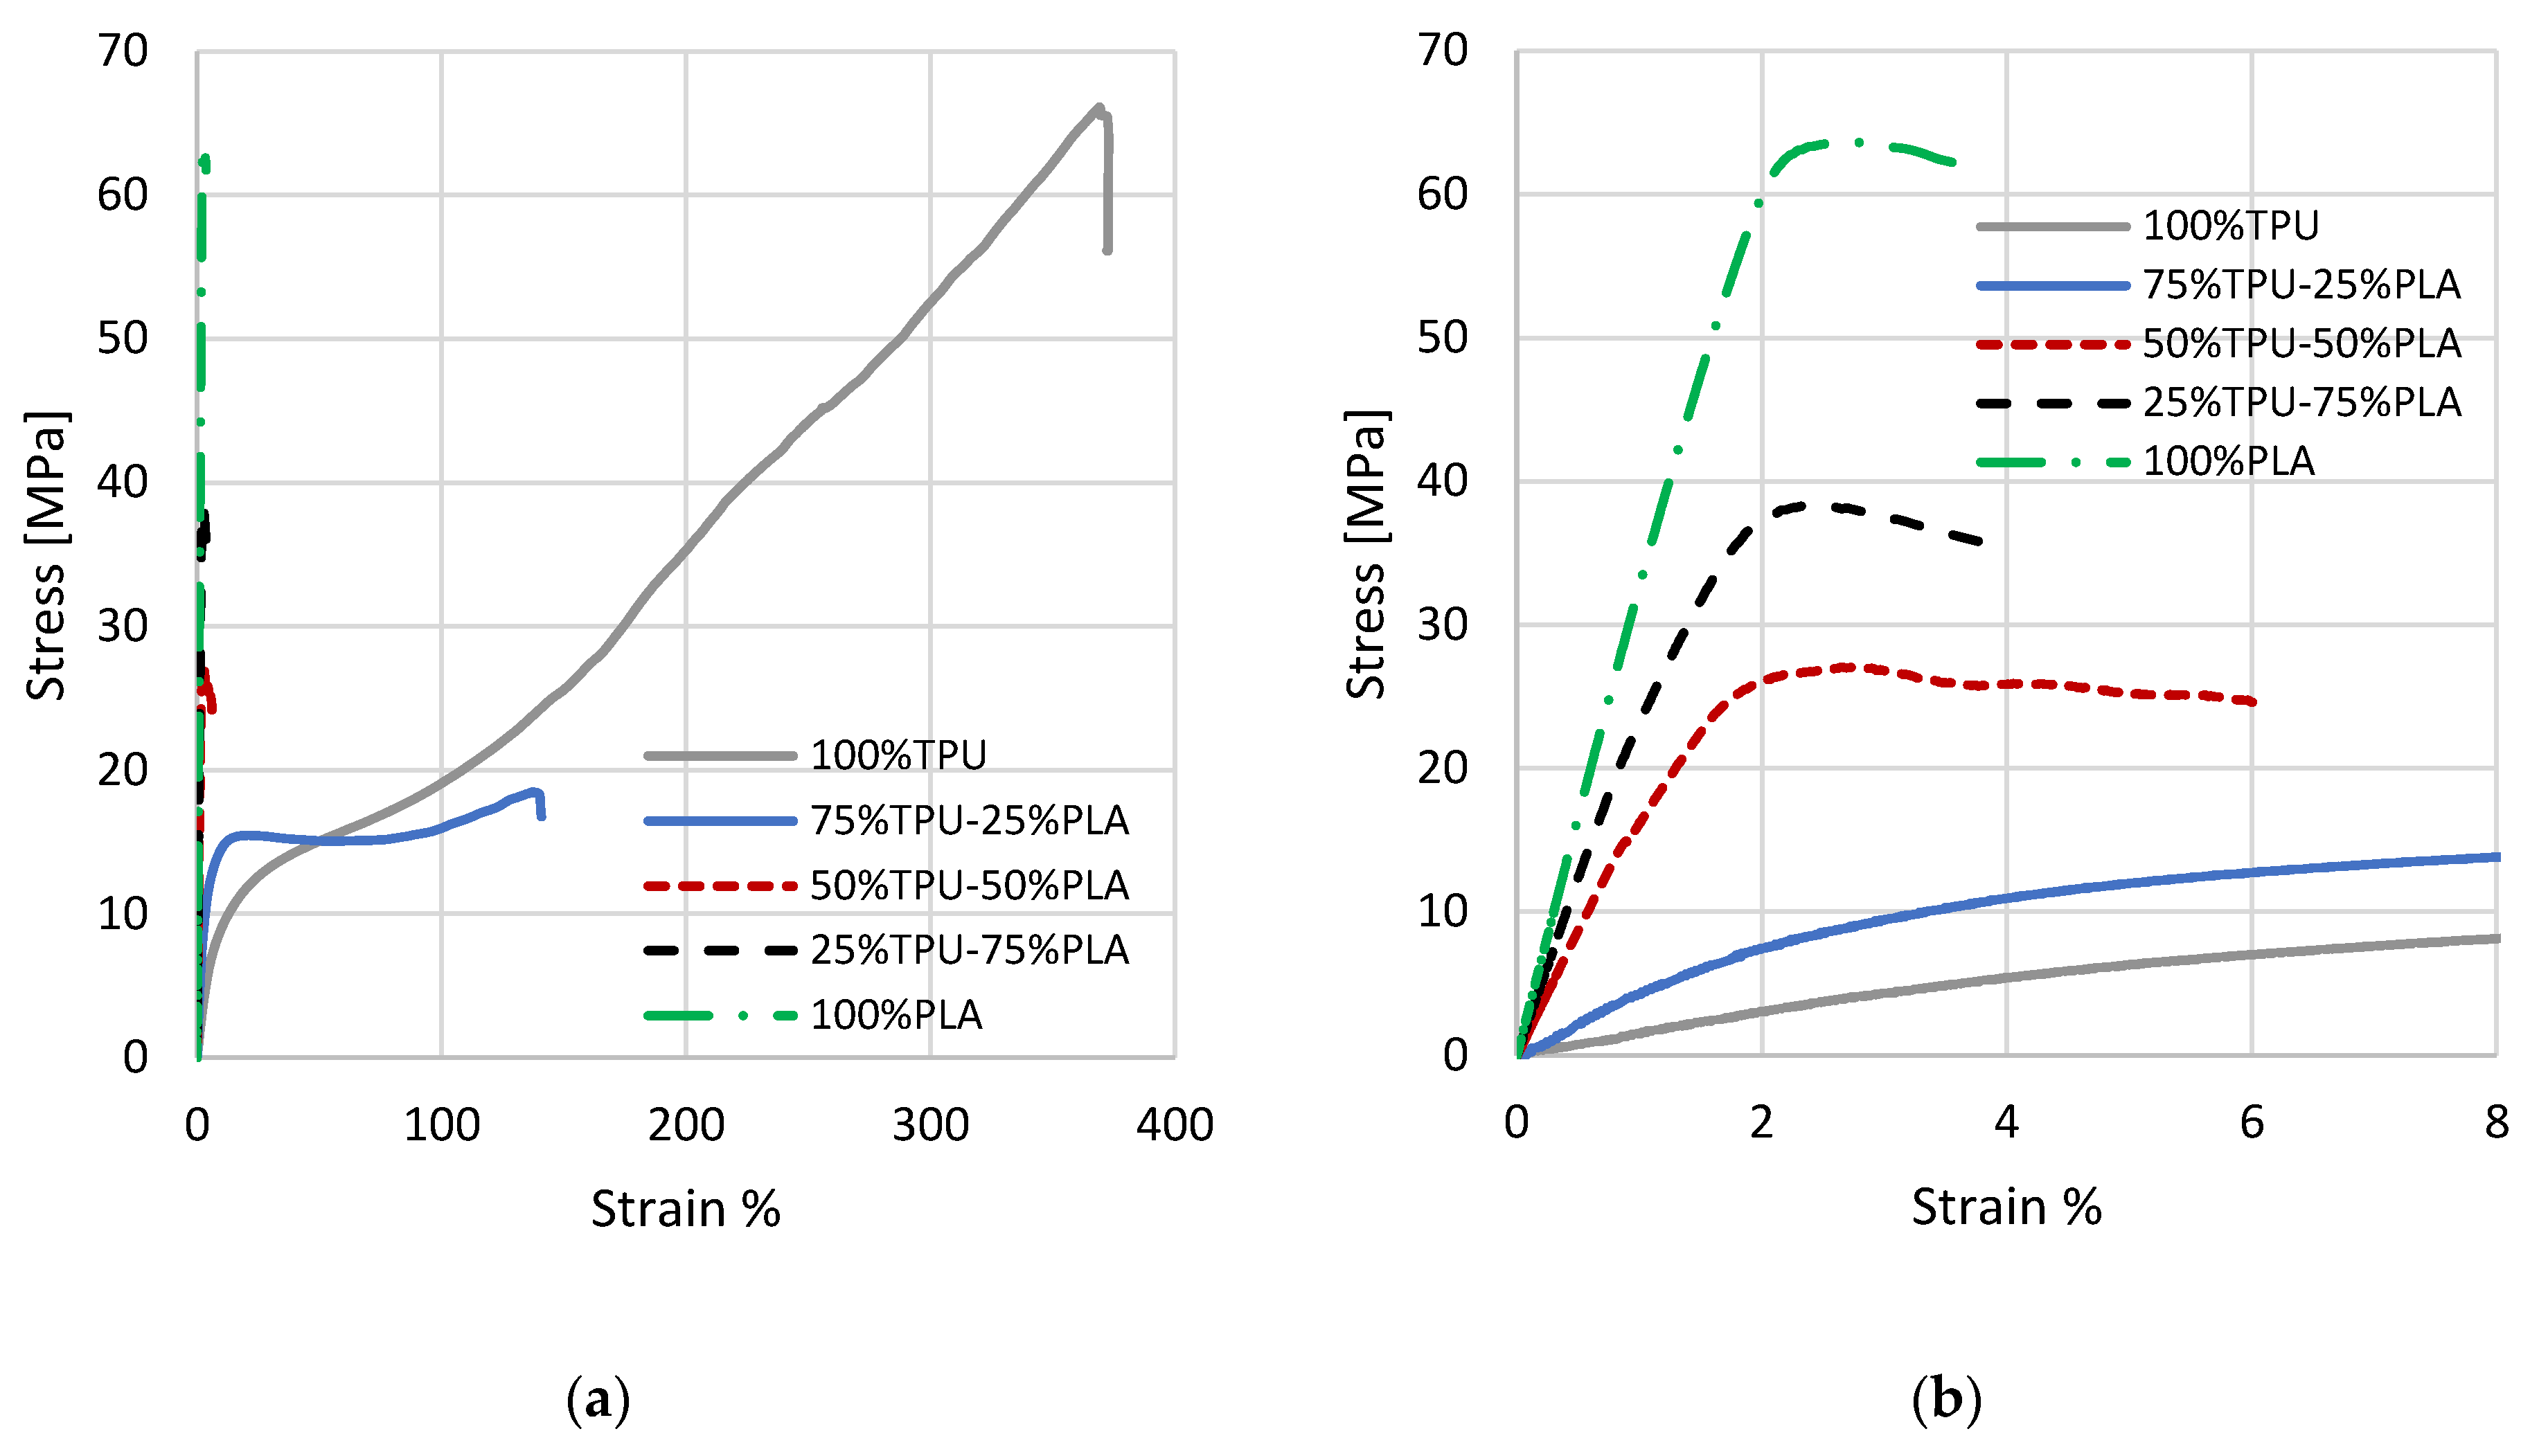
Figure 14 a shows representative stress–strain curves for the different mixing percentages of the PLA-TPU samples, with an enlargement in the first section of the curve (
Figure 14b) to better appreciate the different elastic behaviors.
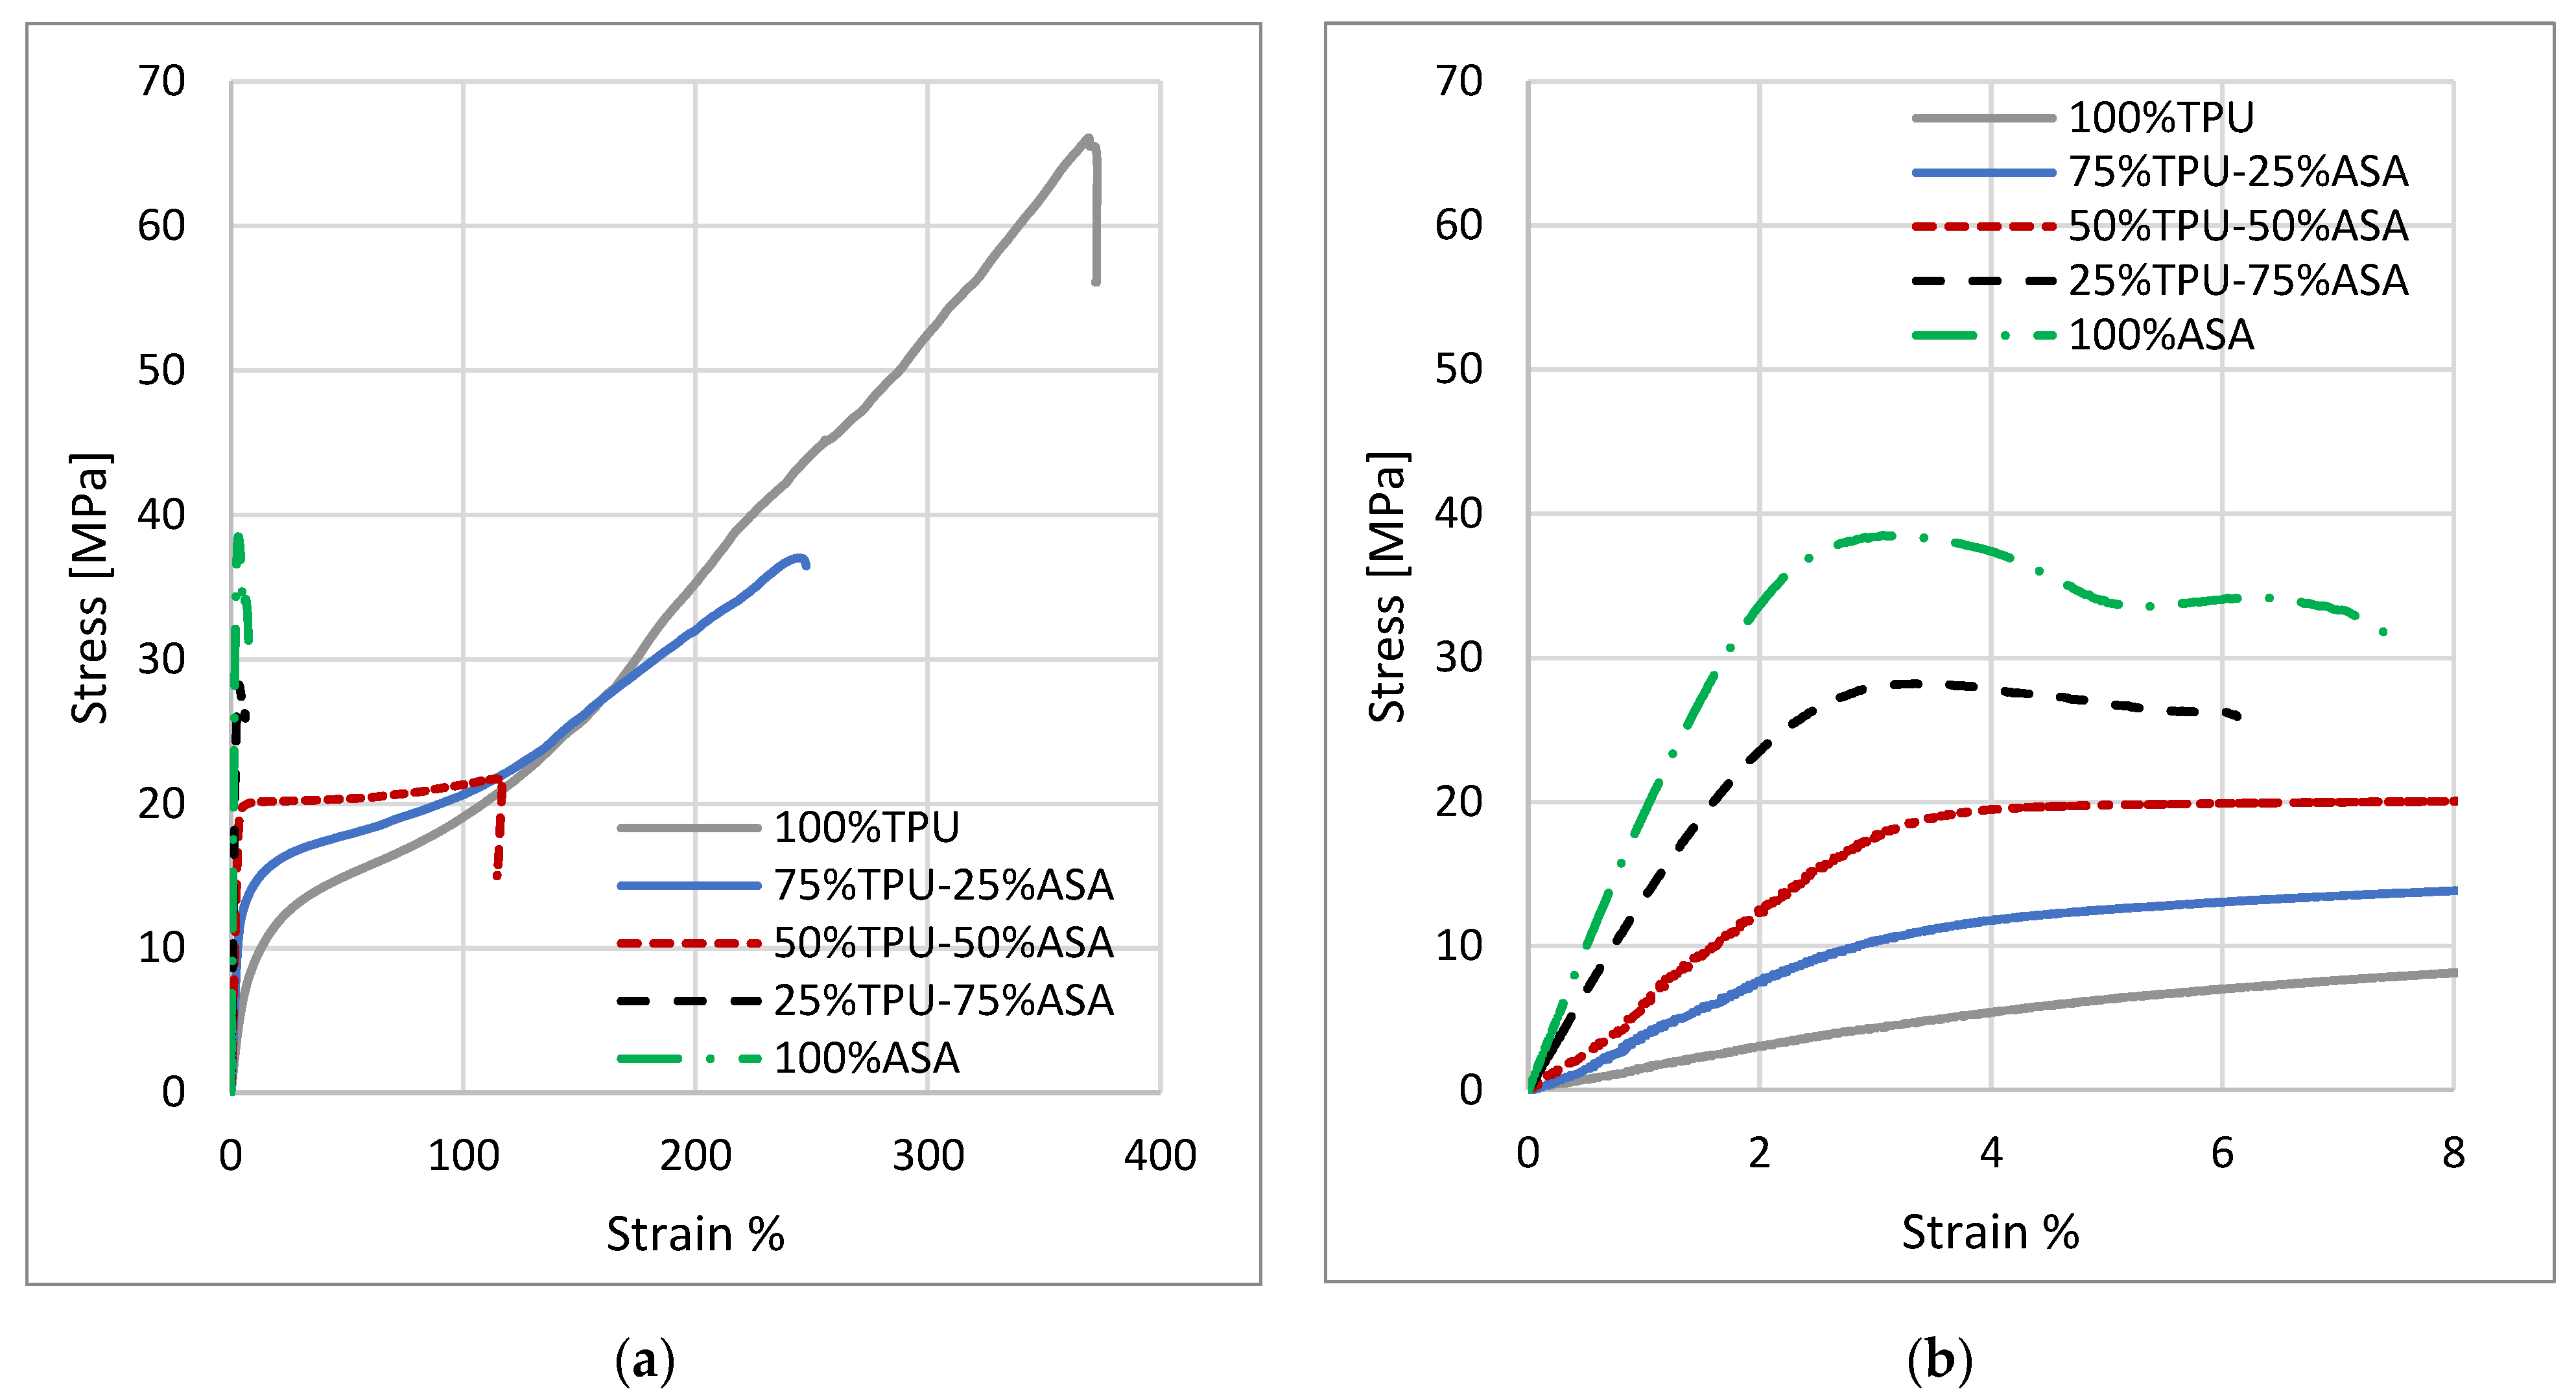
Similarly,
Figure 15 shows a representative stress–strain curve for each mixture of the ASA-TPU series.
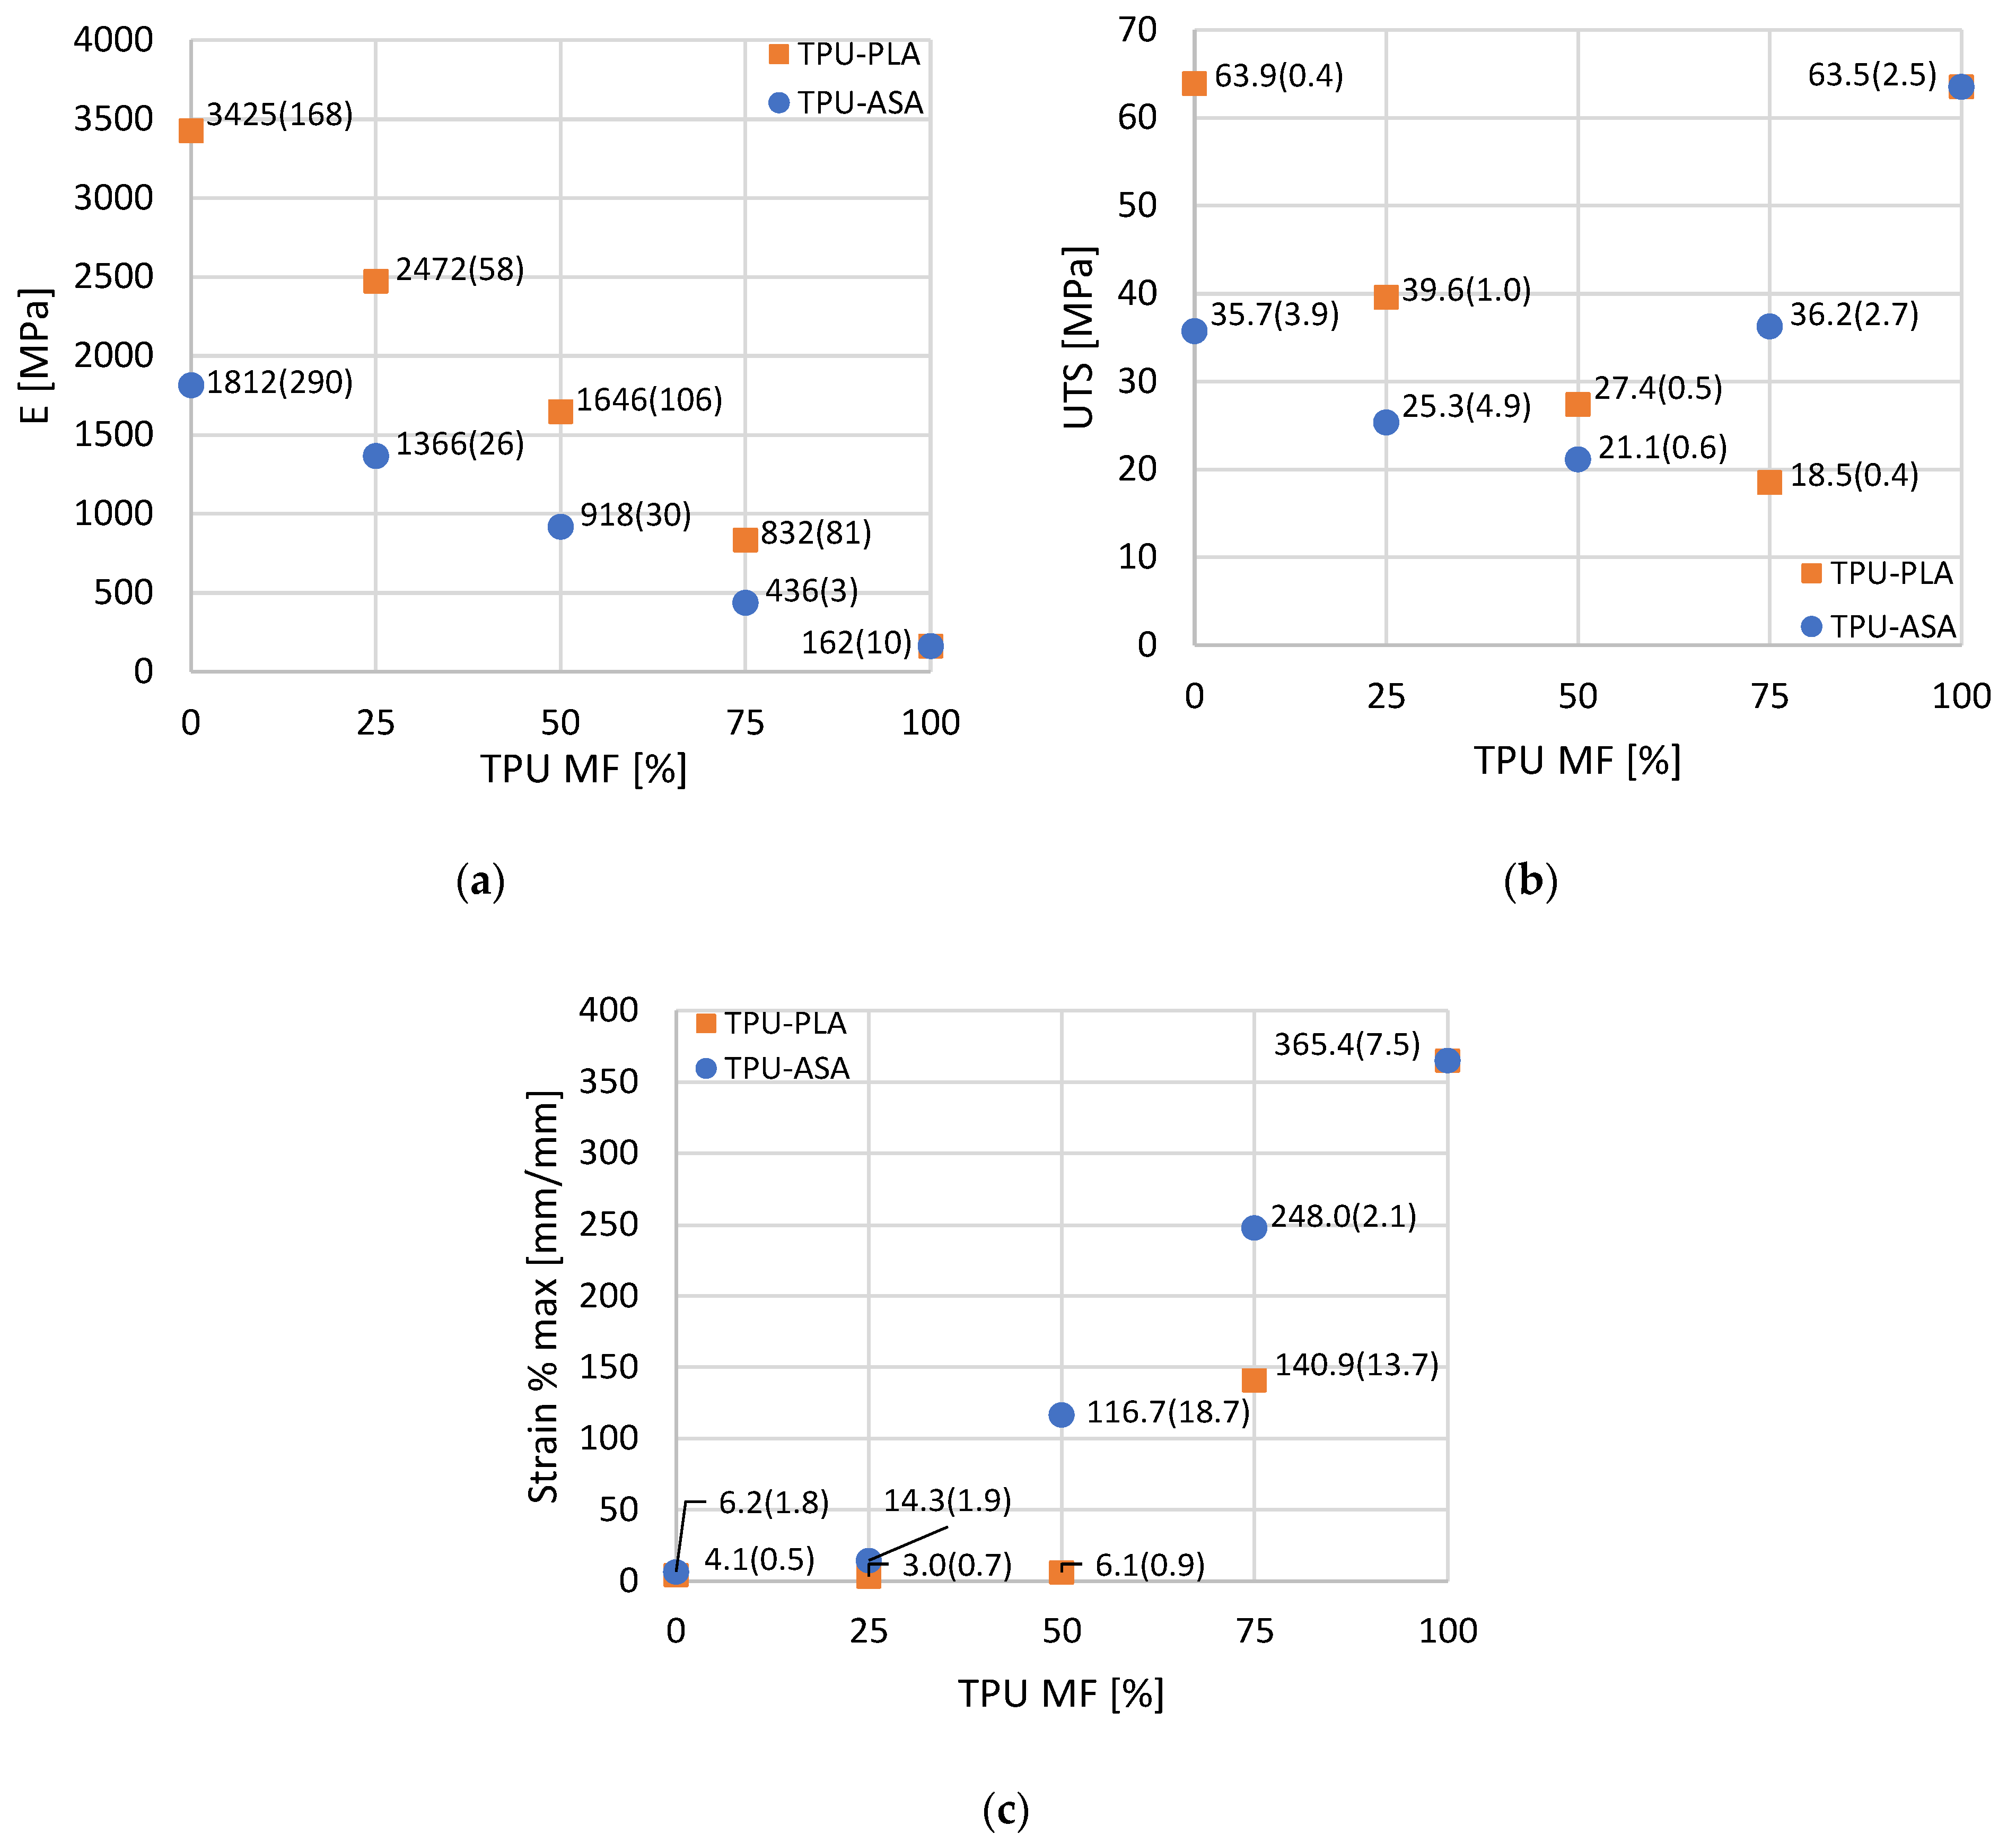
The results of the analysis of the Young’s modulus, UTS, and maximum strain for the PLA-TPU and ASA-TPU series are summarized in the plots in
Figure 16.
The results of the non-mixed materials, i.e., PLA, TPU, and ASA, are in agreement with the data declared by the filament producer [
27]. A mismatch was found for the maximum strain of the ASA samples, where the obtained mean value, 6.2%, differs from that of the datasheet, 35%. Nevertheless, similar maximum strain values of 6% can be found in the literature, for instance, Vazquez Martinez et al. [
50] obtained comparable results by additively manufacturing ASA specimens by testing several process parameter combinations. Moreover, in general, an agreement is found between the results of the mechanical characterization in the present study with those of other studies in the literature for PLA [
51,
52,
53], ASA [
50,
54], and TPU [
55].
Moving onto the mixed materials, the Young’s modulus at different percentages of TPU (
Figure 16a) shows a comparable trend for both the PLA-TPU and the ASA-TPU series: it monotonically decreases, thereby increasing the TPU percentages. Conversely, the strain at failure (
Figure 16c) increases at higher TPU percentages, apart from, however, the 75% PLA and 25% TPU mix combination that does not undermine the observed trend due to the close values with the surrounding mix combinations and cannot be considered to be significantly different from the previous data. Furthermore, at up to 50% PLA, the elongation at failure does not increase significantly. A different trend was observed for the UTS (
Figure 16b), in which the performance of the material mixes was worse than those of the single materials. In this case, the behavior is not monotonic: starting from the UTS values of pure PLA (63.9 MPa) and ASA (35.7 MPa), the UTS decreases for the intermediate mixes, reaching the lowest value at the 25% PLA and 75% TPU (18.5 MPa) and 50% ASA and 50% TPU (21.1 MPa) combinations, then it increasing again up to the pure TPU value (63.5 MPa). This is due to the higher stiffness of PLA and ASA, which tend to bear the load more than TPU does. Indeed, at the same level of deformation, the stress is higher in the stiffer material, i.e., PLA or ASA, which breaks at a lower value of strain. By increasing the percentages of TPU, the sectional area of PLA and ASA decreases, leading to the sudden failure of the samples. On the contrary, at higher material fractions of TPU, when the PLA and ASA stripes are broken, the UTS is related to the sectional area of TPU, and it consequently increases. Although the maximum UTS is reached when we were using a single material, and the other properties, such as elastic modulus, have a continuous variation according to the MF. This allows one to obtain a wide range of properties that the designer can use in a single component, and it helps to reduce the criticism at the interfaces between the different materials.
A comparison can be made with the work of Arifvianto et al. [
56], in which PLA and TPU samples produced by AM were compared to a 50/50 mix, and as in the present study, the mix presented an intermediate Young modulus, whereas the strain at break did not increase by adding TPU. It must be highlighted that in Arifvianto et al.’s study [
56], the samples were not obtained by coextrusion, but by adopting a so-called “sandwich structure”, where the PLA and TPU layers were deposited in an alternating manner, and the mechanical properties of the starting materials were different from the ones of the present work. More, the results of the UTS value of the 50% PLA and 50% TPU mix (27.4 MPa) are in the range of the ones obtained by Kennedy and Christ [
17] (17 MPa–38 MPa), who tested 50% PLA and 50% TPU blends obtained by “in situ active mixing” and manufactured tensile specimens both parallel and perpendicular to the applied test load. The elastic modulus of the present study for a 50/50 mix of PLA and TPU (1646 MPa) is higher than the ones of Kennedy and Christ (889 MPa maximum); this could be explained by the use of different materials, process parameters, and different material mixing approaches. Another comparison can be made with the work of Rahmatabadi et al. [
57]. In the study, compounds of PLA-TPU (90A) at different mixes were obtained by blending granules into a mixer and by further producing a filament; the tensile samples were manufactured by aligning them to the tensile loading direction. Even though the TPU used in the study, TPU 90A, and the one used in the present work, TPU 98A, slightly differ, and the material mixes were obtained adopting two different approaches, i.e., melt mixing method and coextrusion, the UTS values are in good agreement. Indeed, the two UTS trends show a monotonous decrease when the TPU percentage increases. Furthermore, the UTSs of the 50/50 mix of PLA and TPU are similar: 27.3 MPa in Rahmatabadi et al. and 27.4 MPa in the present work. Additionally, the UTS of the 70% PLA and 30% TPU mix in Rahmatabadi et al. (40.9 MPa) is close to that of the 75% PLA and 25% TPU mix obtained in the present study (39.6 MPa).
3.3. RVE Analysis, Analytical Model, and Elastic Modulus Comparison
The results of the numerical simulations according to the material fraction are reported in
Table 5 for PLA-TPU and in
Table 6 for ASA-TPU.
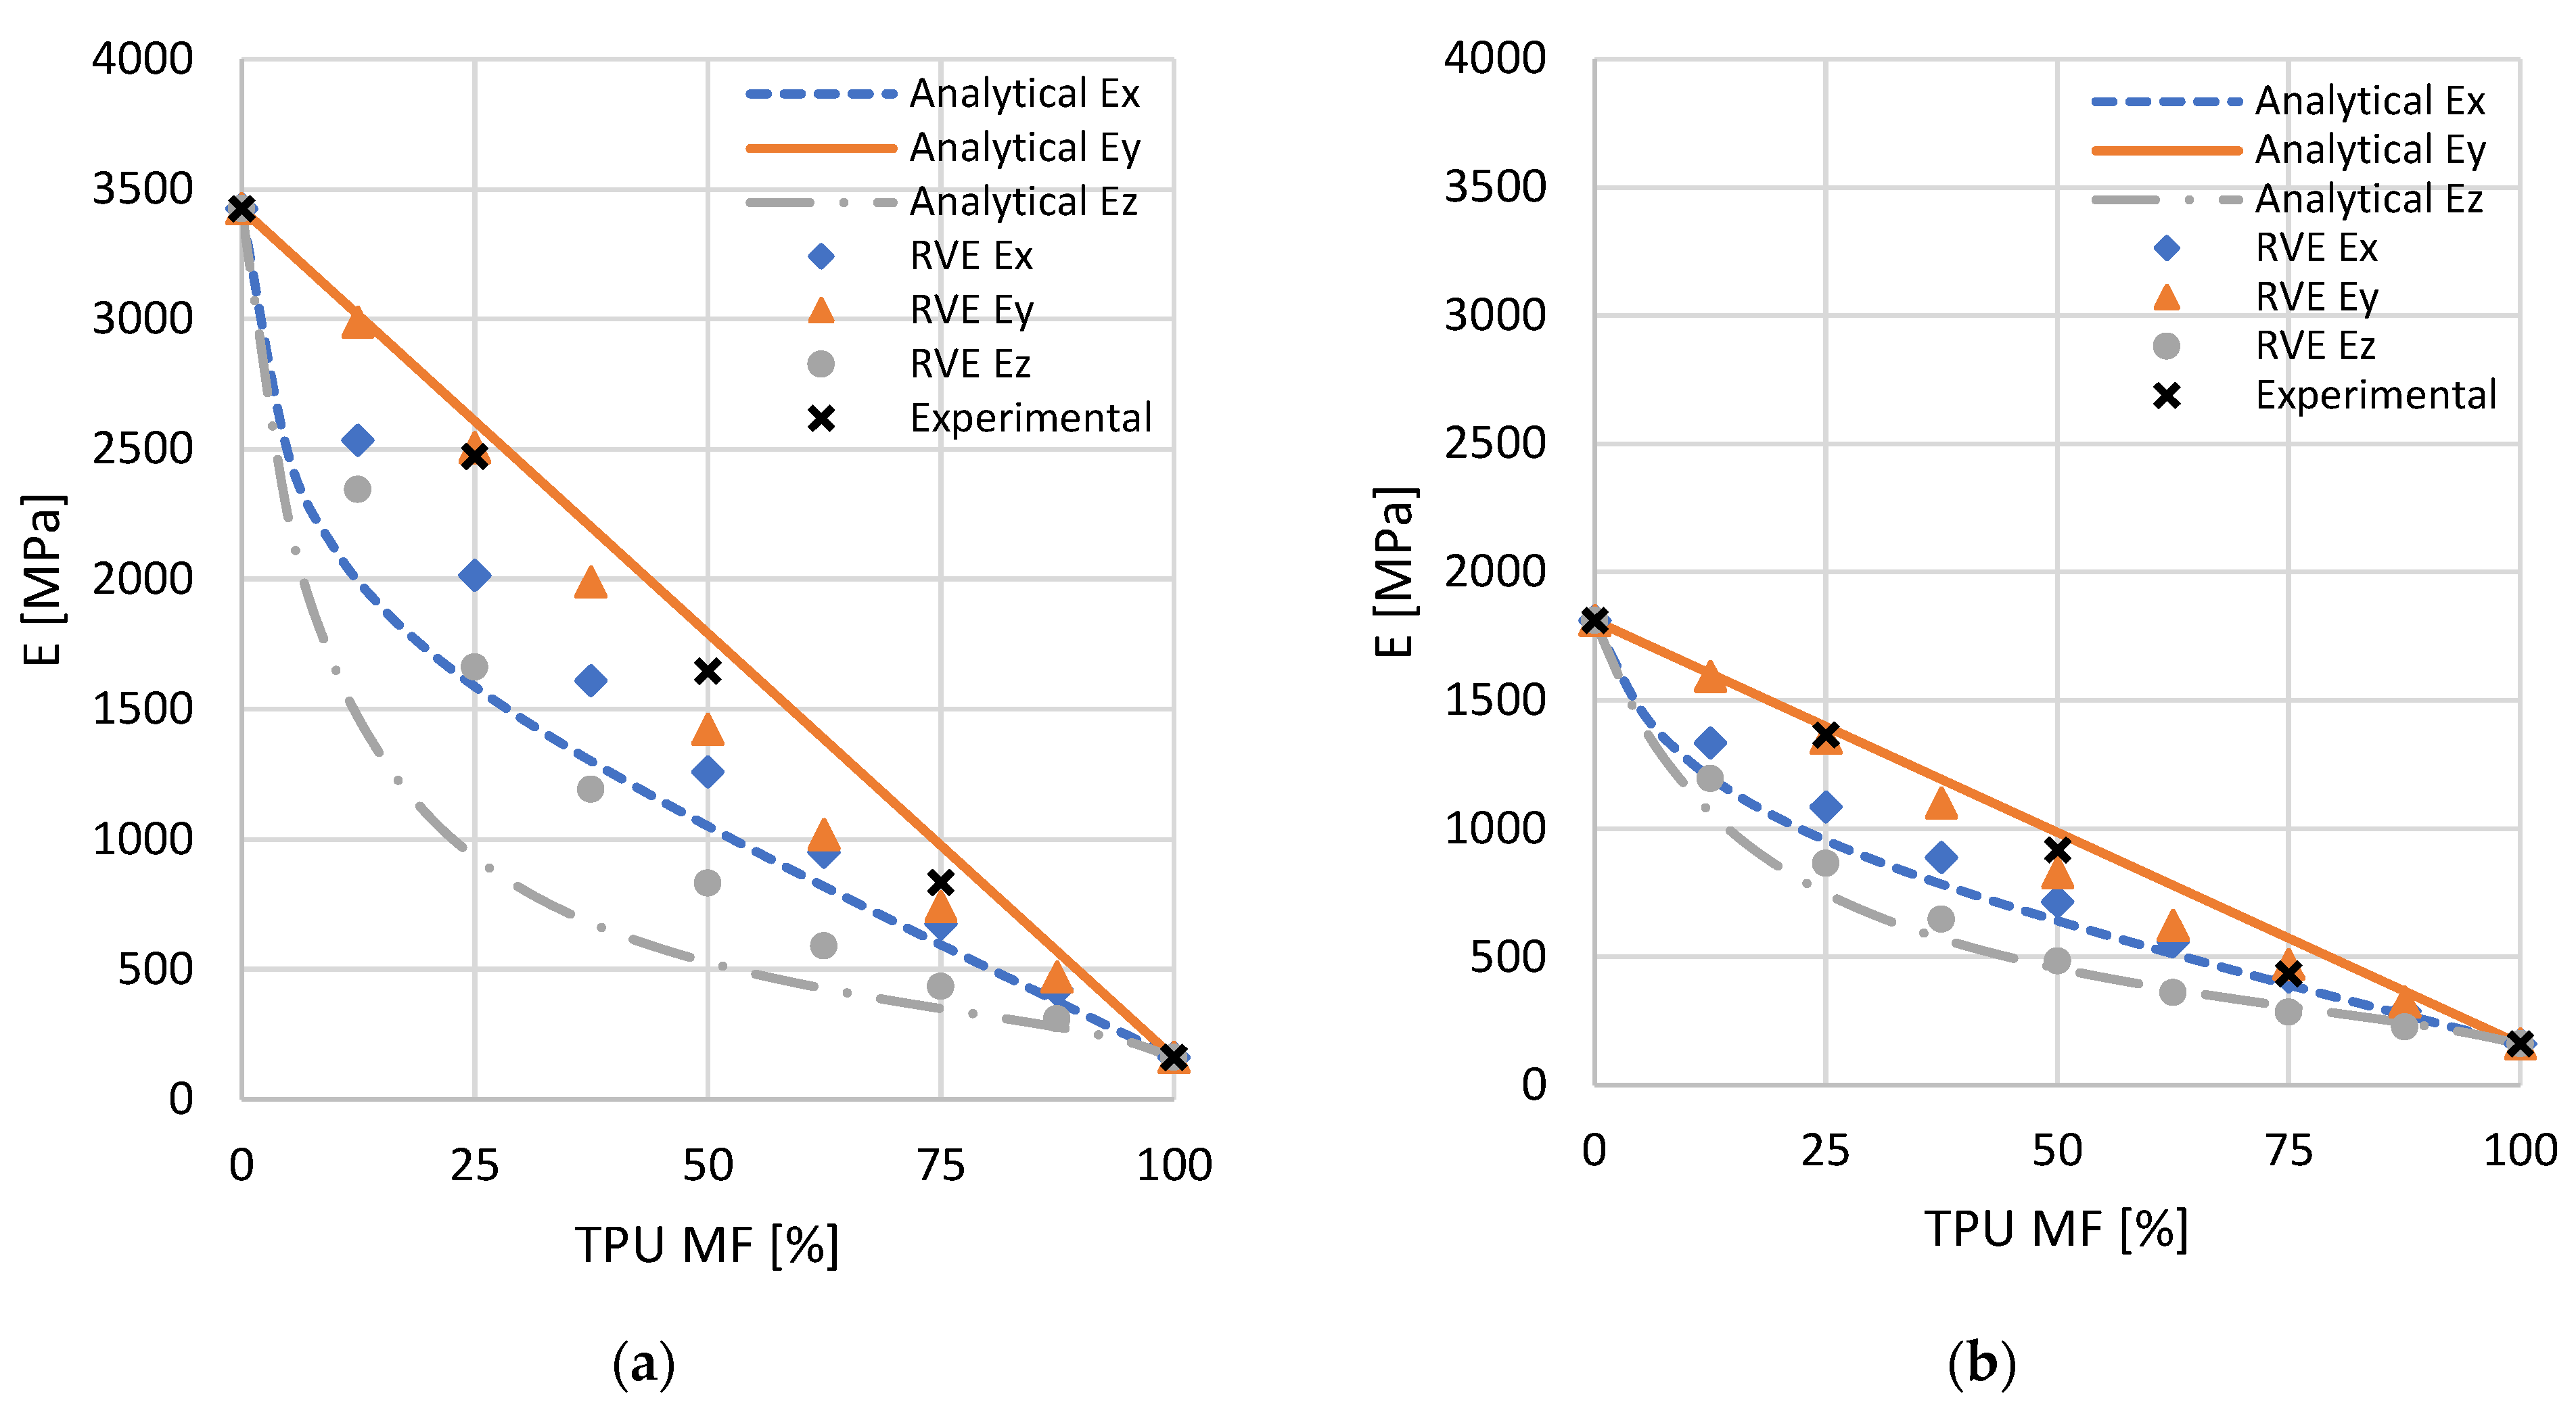
As expected, both the elastic modulus and the shear modulus monotonically decrease from the 100% PLA or 100% ASA value to the pure TPU value when the fraction of TPU increases. The decreasing E
y modulus follows a more linear trend, whereas the decreasing trend of the E
x and E
z moduli is initially greater (
Figure 17). The decreasing trends of the shear moduli are not linear, with G
zx being the farthest one from linearity, and with G
xy and G
yz presenting similar trends. The Poisson’s ratios present a continuous, but not monotonous, trend with the increasing of the percentage of TPU. In terms of the relative trends, the mechanical properties of the two mixes, i.e., PLA-TPU and ASA-TPU, present similar behavior when we are comparing the same parameter.
Figure 17 shows a comparison among the elastic moduli of the analytical model, RVE, and the tensile tests according to the MF. According to
Section 2.3.2, the curves of the analytical model were obtained by applying the equations in
Table 3 and using the elastic moduli of the pure materials, i.e., PLA, ASA, and TPU, from the results of the mechanical tests presented in the previous section. It is worth noting that the analytical model and RVE show a similar behavior for both of the pairs of materials, where the RVE data show a smaller range. Due to the more advanced model, it can be assumed that the RVE data show more realistic behavior, whereas the analytical model can be considered to be a simplified description that confirms the RVE results. Although the experimental data are obtained under different conditions (e.g., orientations in the building plate and contour patterns for the perimeters), the experimental elastic modulus shows a behavior that is in the range of the models and is close to the linearity. For a more accurate comparison between the finite element models and experimental tests, two specific RVE should be defined: one that is representative of the perimeters and one that is representative of the specific infill deposition orientation. The material properties computed by the RVE should be assigned to the specimen model, which should undergo a simulated traction force for the computation of stress and strain. Moreover, the simulation can include elastoplastic and porosity modeling.
3.4. Further Considerations
The proposed models can be useful in the design process of FGM, allowing researcher to establish MF and process parameters according to the functional requirements. Indeed, the model describing the mechanical properties depending on the nozzle path, other process parameters, and the MF can be integrated in a FGM/FGAM design framework [
58,
59], as the knowledge of the properties of combined materials and their relation to process parameters helps researcher to establish the better products and process configurations. Additionally, this knowledge can be introduced in the iterative design phases, which allows researchers to select the pairs of materials and their distributions. Depending on the continuous or discrete gradient, the proposed models can be integrated into the definition or the material composition function or in the location and size of sub-volume with specific MF and processes parameters.
In the literature, other pairs of materials were considered, such as ABS–TPU, PCL–TPU, PLA/NinjaFlex
®, and ABS/NinjaFlex
® [
2,
49,
60], which could be introduced in the design framework during the material selection phase. Instead of polymers, other materials such as ceramics and metals or a combination of them can be considered by integrating FDM with furnace sintering. To identify the possible compatible pairs, instead of the melting temperature, other aspects should be considered to obtain adhesion between the materials, and consequently, adequate mechanical properties. As highlighted in the literature [
2,
49,
60], the main adhesion mechanisms are related to Van der Waals forces, chemical bonds, wettability, diffusion, and impurities at the boundary. Additionally, the coefficients of thermal expansion play a key role in shape and dimensional accuracy, residual stress, and interface strength. This could lead to deformations of the manufactured parts, which can be reduced by tuning the temperatures and adopting symmetrical material distributions. Moreover, surface roughness and shape interface lead to mechanical adhesion due to microscopic and macroscopic interlocking. Regardless of the adhesion mechanisms, mechanical tests are the most common tools used to establish the interface strength and to confirm adhesion models.
4. Conclusions
The capability to combine different material fractions in an additive manufacturing process presents new opportunities in the design of components. To exploit this opportunity, the designer needs models which describe the behavior of the combined materials. This goal was achieved by proposing models which describe the material deposition and mechanical properties and testing two pairs of FDM coextruded materials, i.e., PLA-TPU and ASA-TPU.
The material deposition configuration was studied based on simple geometrical considerations by identifying a model that was superimposed onto the microscope images of the actual deposited material, thereby achieving a good agreement with the experimental tests. While the model can be improved considering the number of phenomena related to the rheological properties of the materials and their variation according to the temperature, the proposed approach is able to explain some of the evidence in an effective way, and it can be considered to be adequate as a basis for analytical and numerical models of the mechanical properties. On the other hand, the process parameters and dedicated slicing procedures should be developed. As an advantage, the selection of adequate pairs of materials can improve the product manufacturability and quality of the components, reducing the delamination and separation from the platform during the fabrication.
Based on the deposition model, an analytical, simplified model of the elastic modulus is proposed and compared to the homogenization approach investigated by a Representative Volume Element in an Ansys environment. The results show that the two approaches are consistent. After tuning the RVE analysis, other deposition conditions should be tested, and the typical morphology of FDM manufacturing, such as a rounded rectangle, and the porosity can be integrated into the volume element.
Experimental tensile tests were performed, and the actual elastic moduli are in the range of the numerical models, according to the MF. The tensile tests show Young’s moduli of 3425 MPa for PLA, 1812 MPa for ASA, and 162 MPa for TPU. At the intermediate material fraction, the Young’s modulus shows an almost linear trend between PLA and TPU and between ASA and TPU. The ultimate tensile strength values are 63.9 MPa for PLA, 35.7 MPa for ASA, and 63.5 MPa for TPU, whereas at intermediate material fraction, they assume lower values. Further tests should be performed to verify the effectiveness of the models, considering, also, different manufacturing directions.
In this preliminary work, the foundations for a methodological approach to modeling FDM coextrusion were laid out, leaving plenty of room for the improvement of the process and the investigation of other materials.

 ,
, 


