
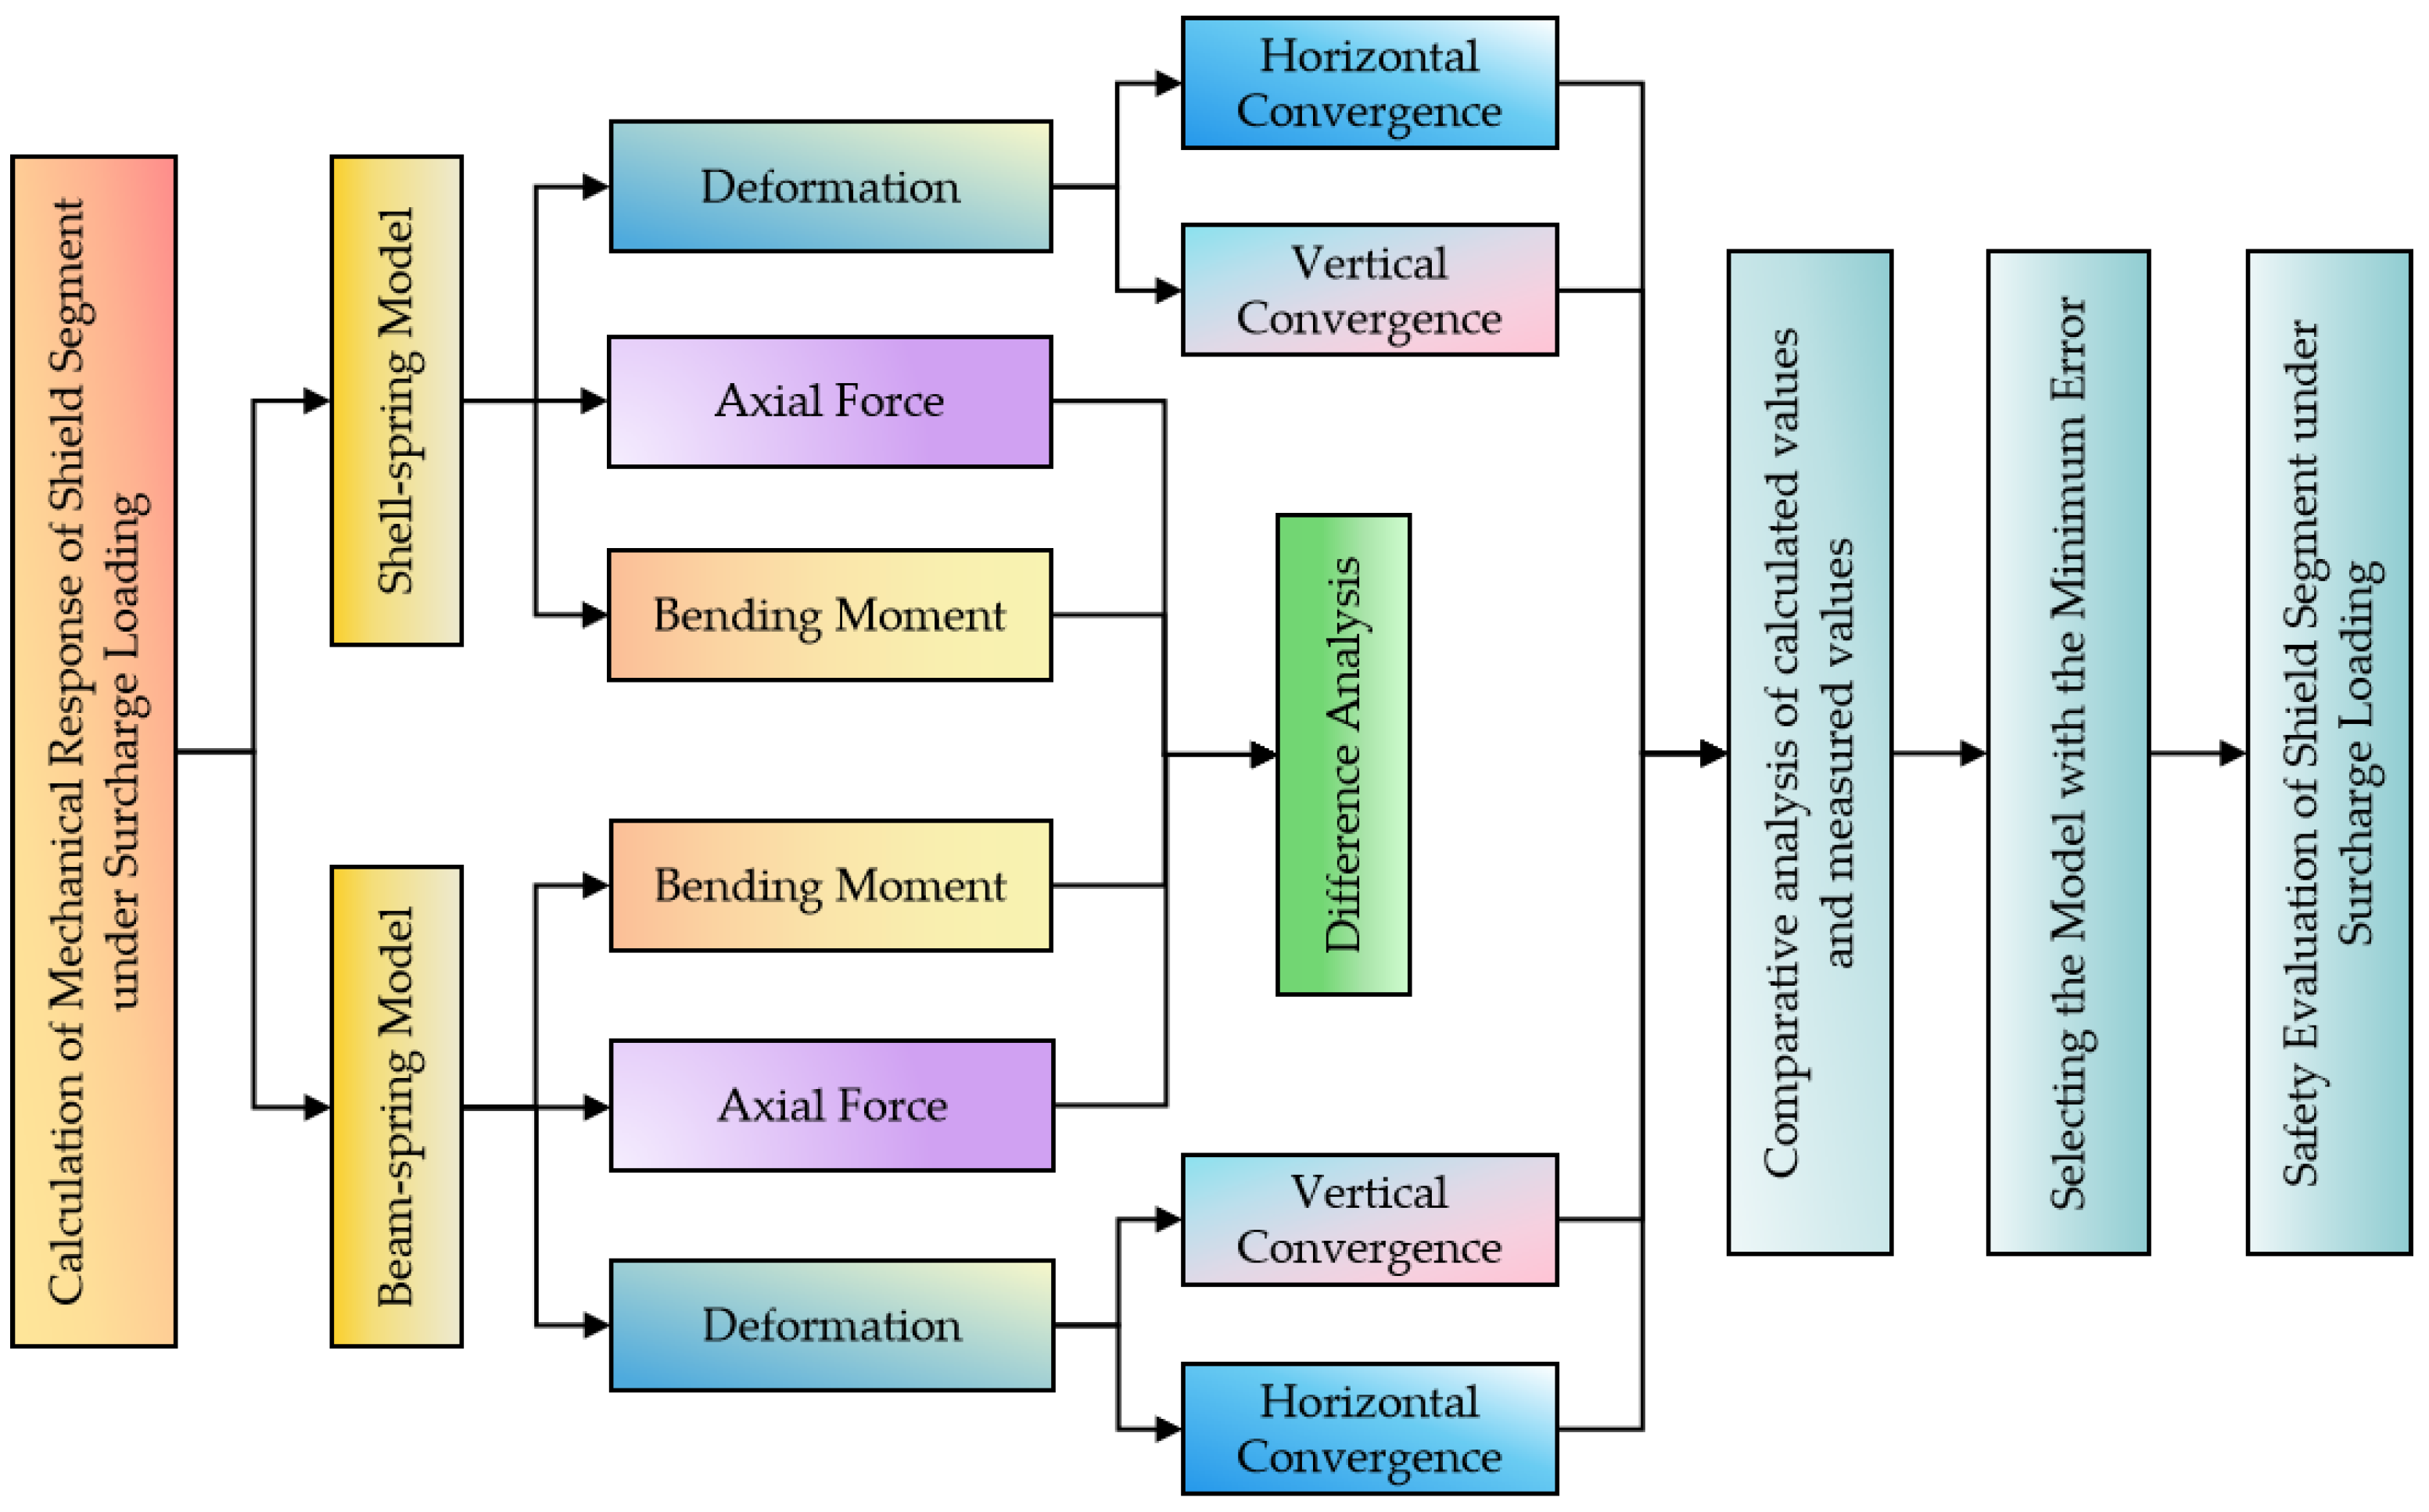
Comparative Analysis and Safety Evaluation of Shield Segment Structure Model under Surcharge Loading

Abstract
:1. Introduction
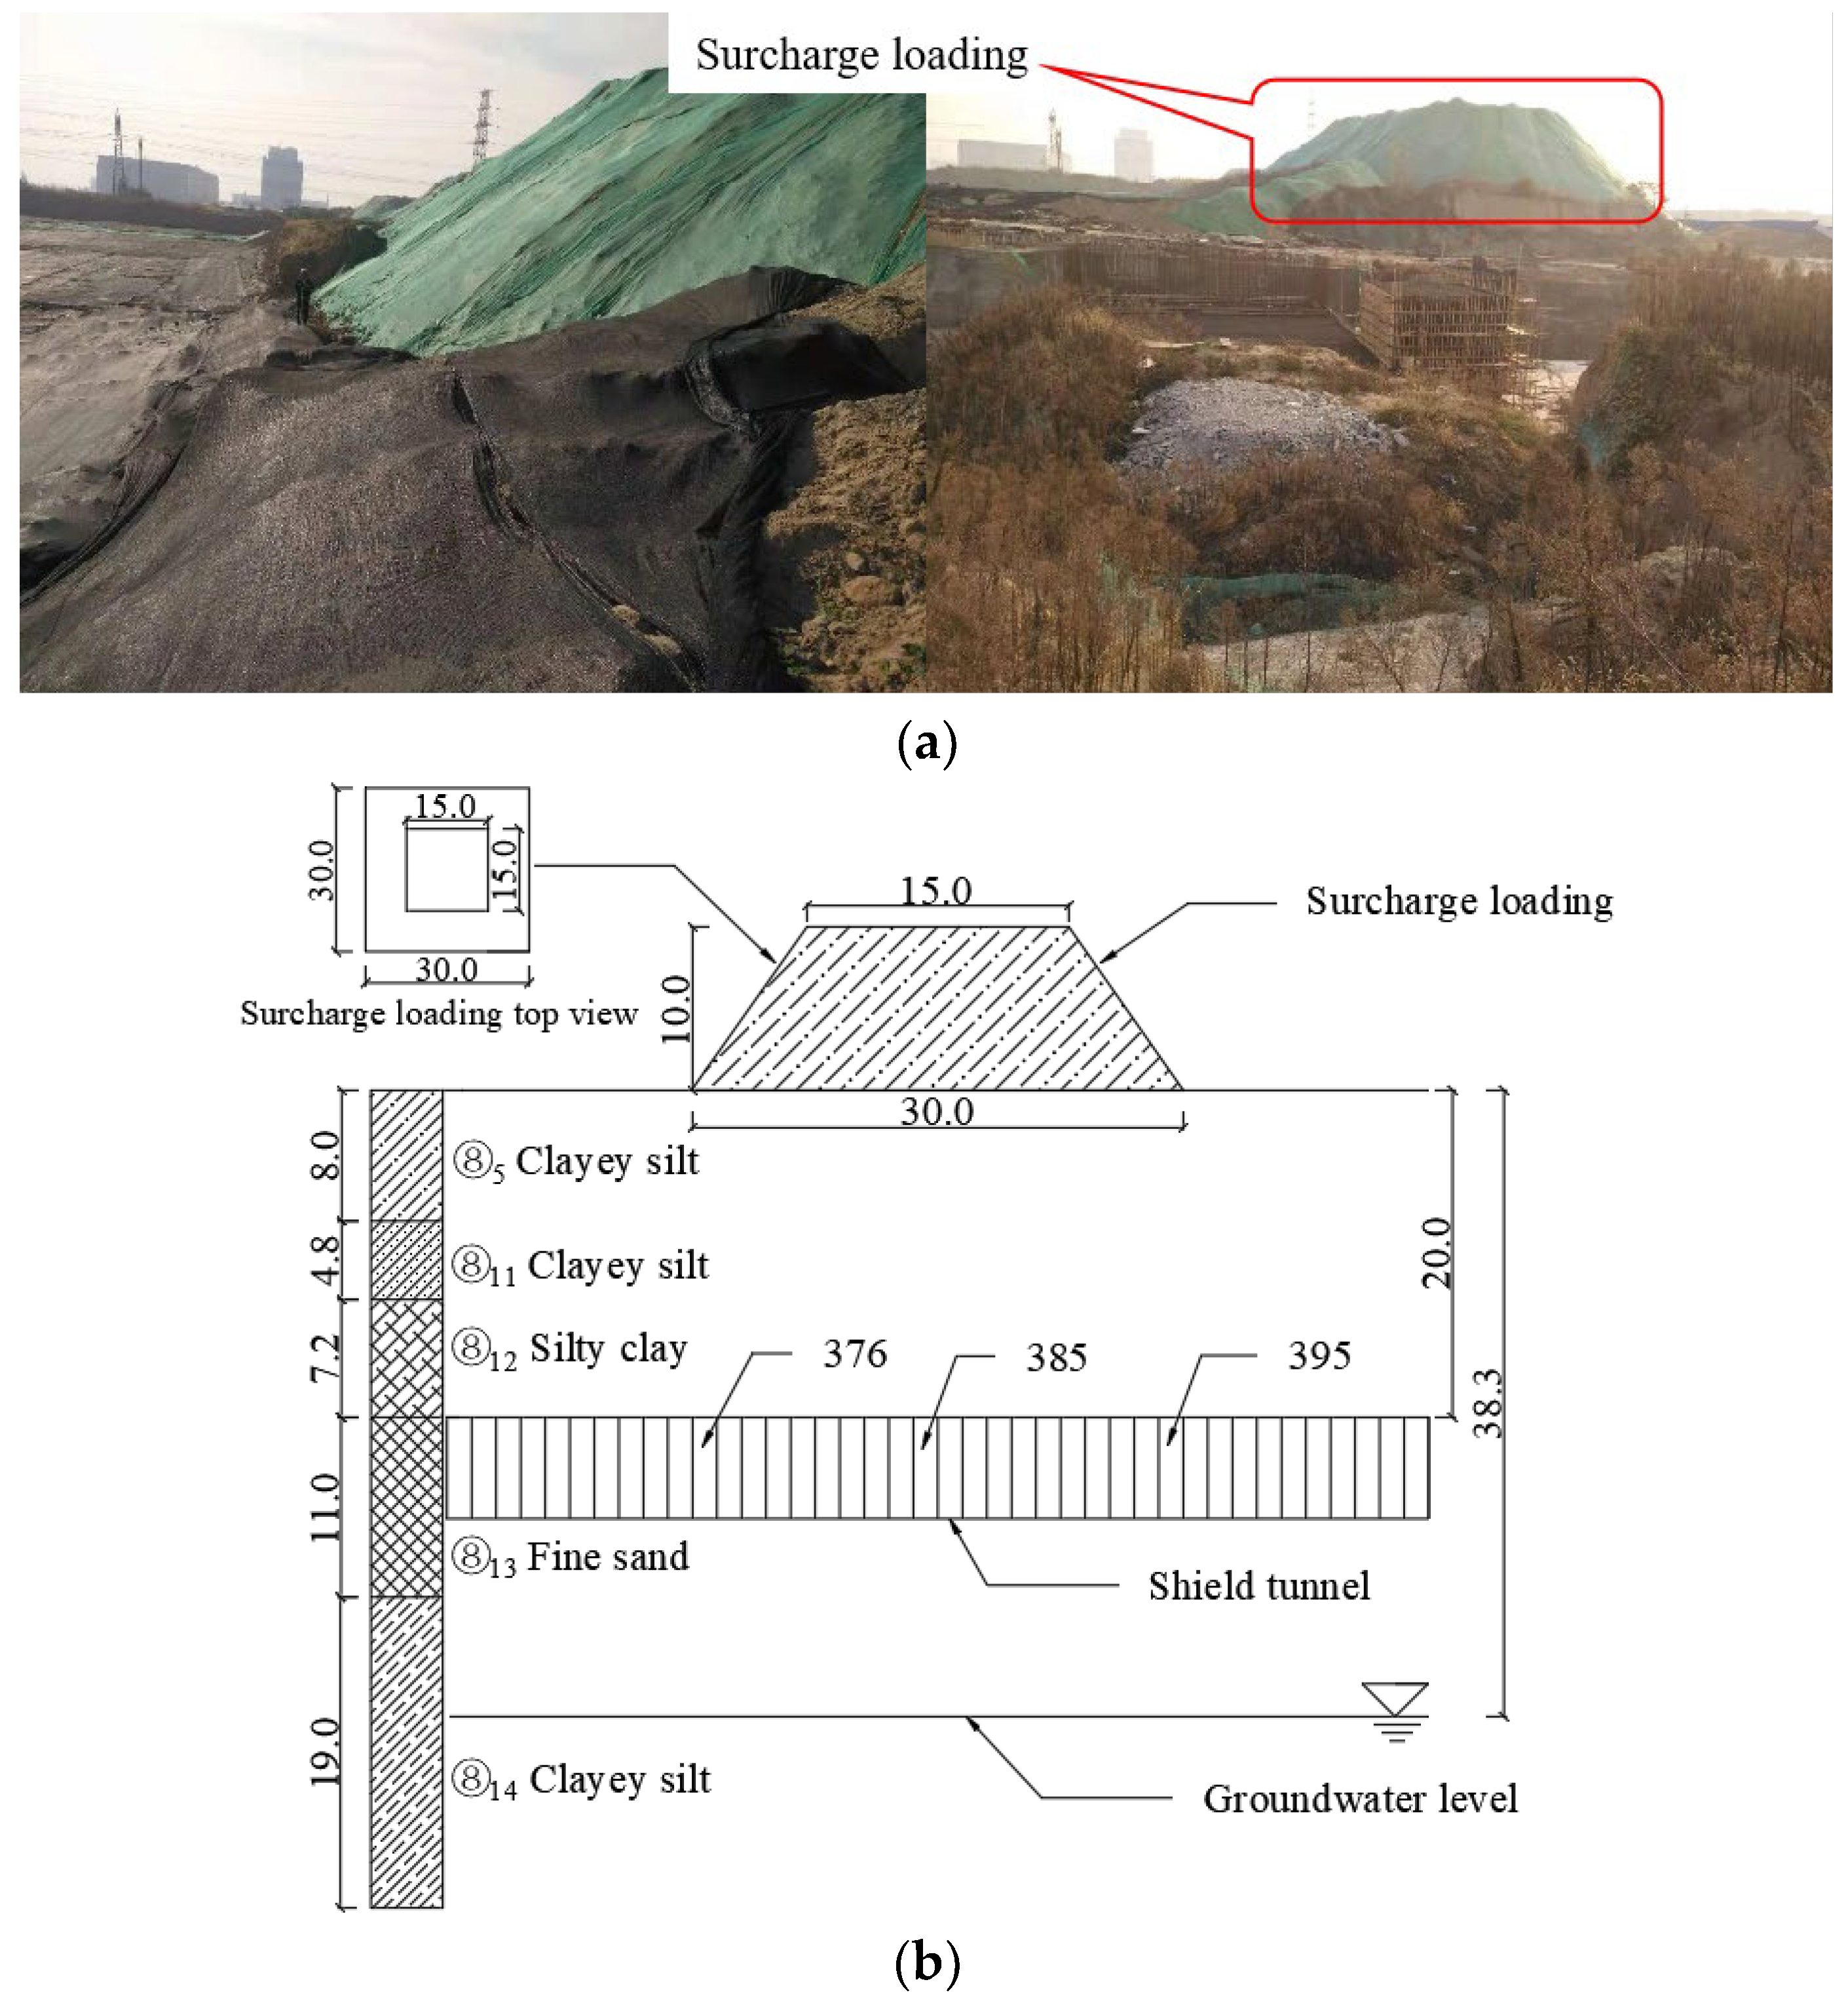
2. Project Overview
2.1. Engineering Geological Conditions
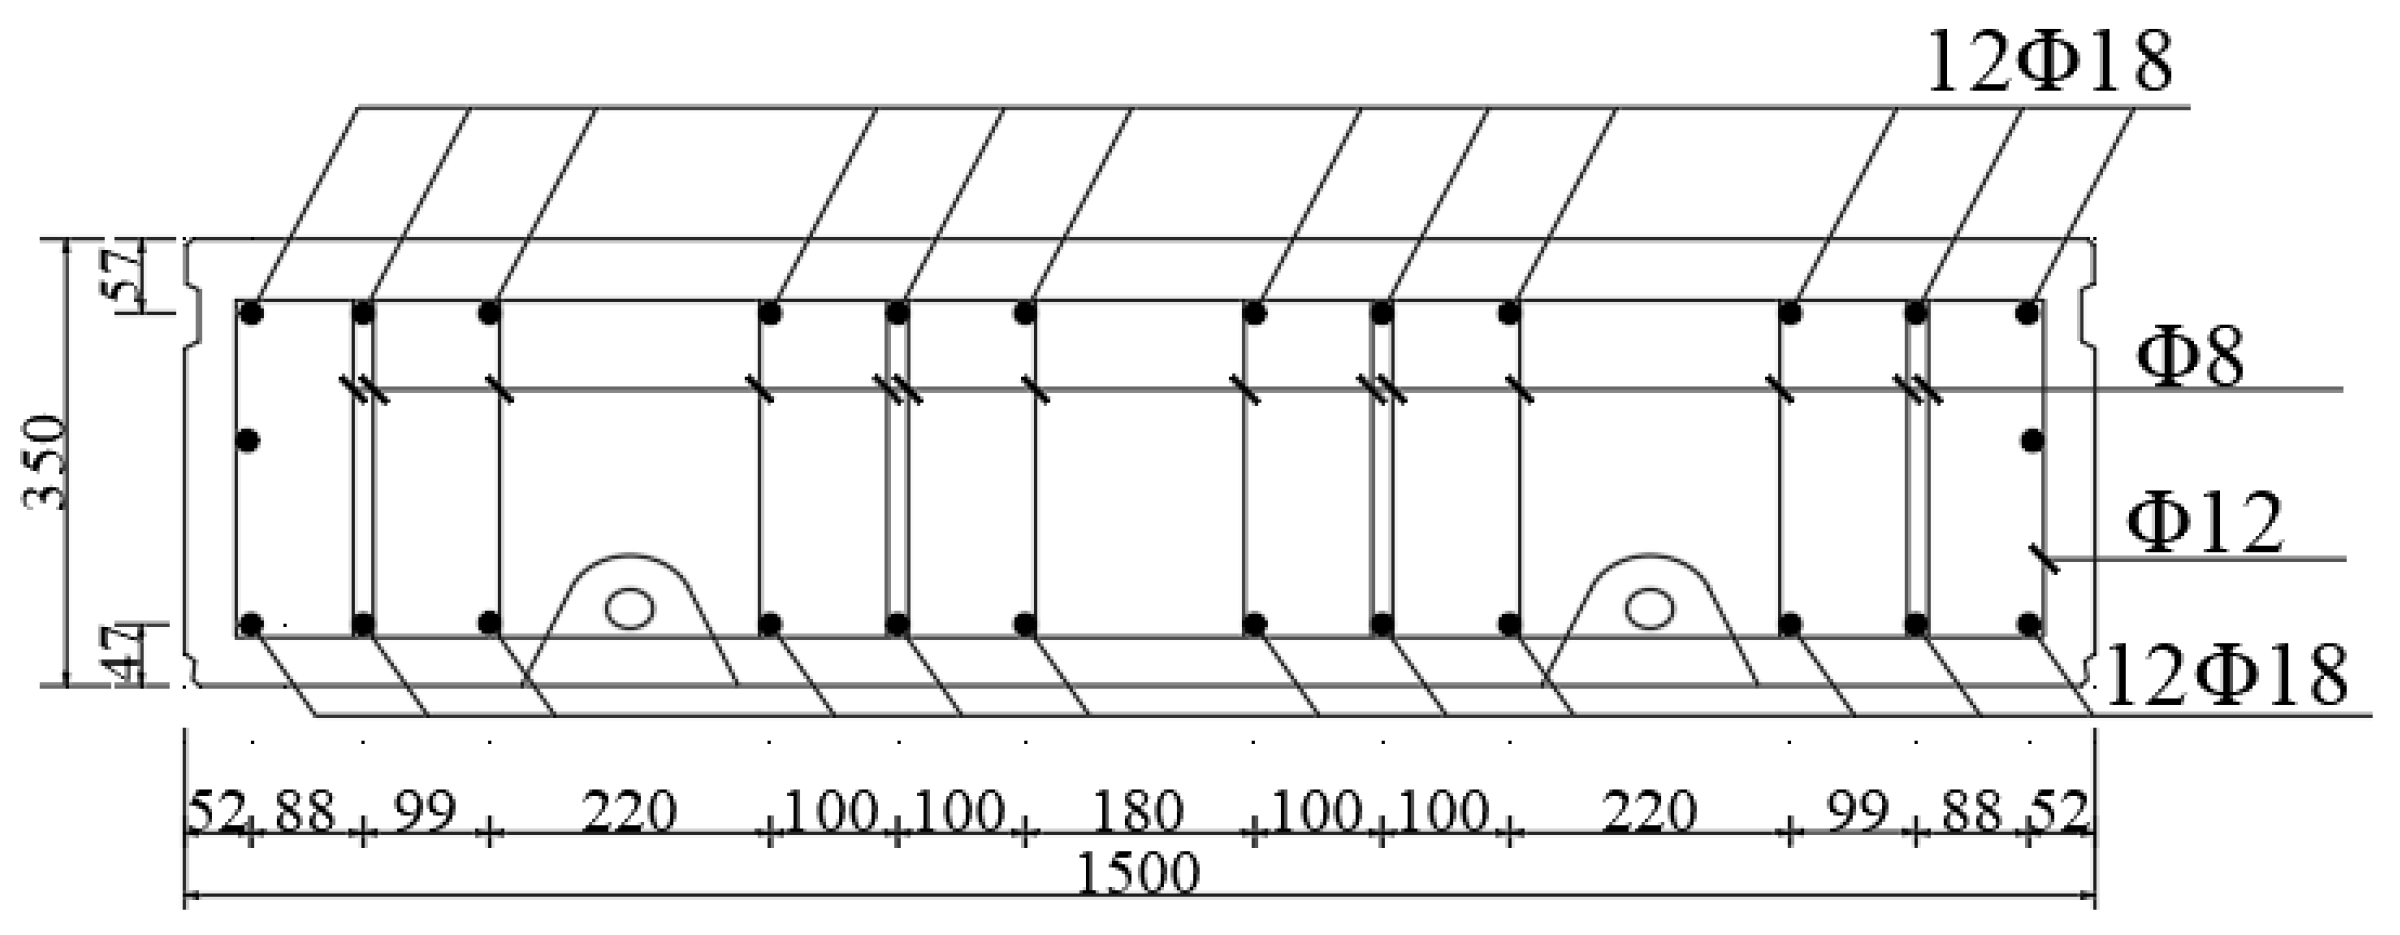
2.2. Parameters of Lining Structure
3. Calculation Equations of Load and Ultimate Bearing Capacity of Lining Segment
3.1. Load Calculation of Lining Segment
3.1.1. Vertical Earth Pressure
3.1.2. Lateral Earth Pressure
3.2. Calculation of the Normal Section Ultimate Bearing Capacity of Lining Segment
3.2.1. Determining Large or Small Eccentric Compression
3.2.2. Ultimate Bearing Capacity
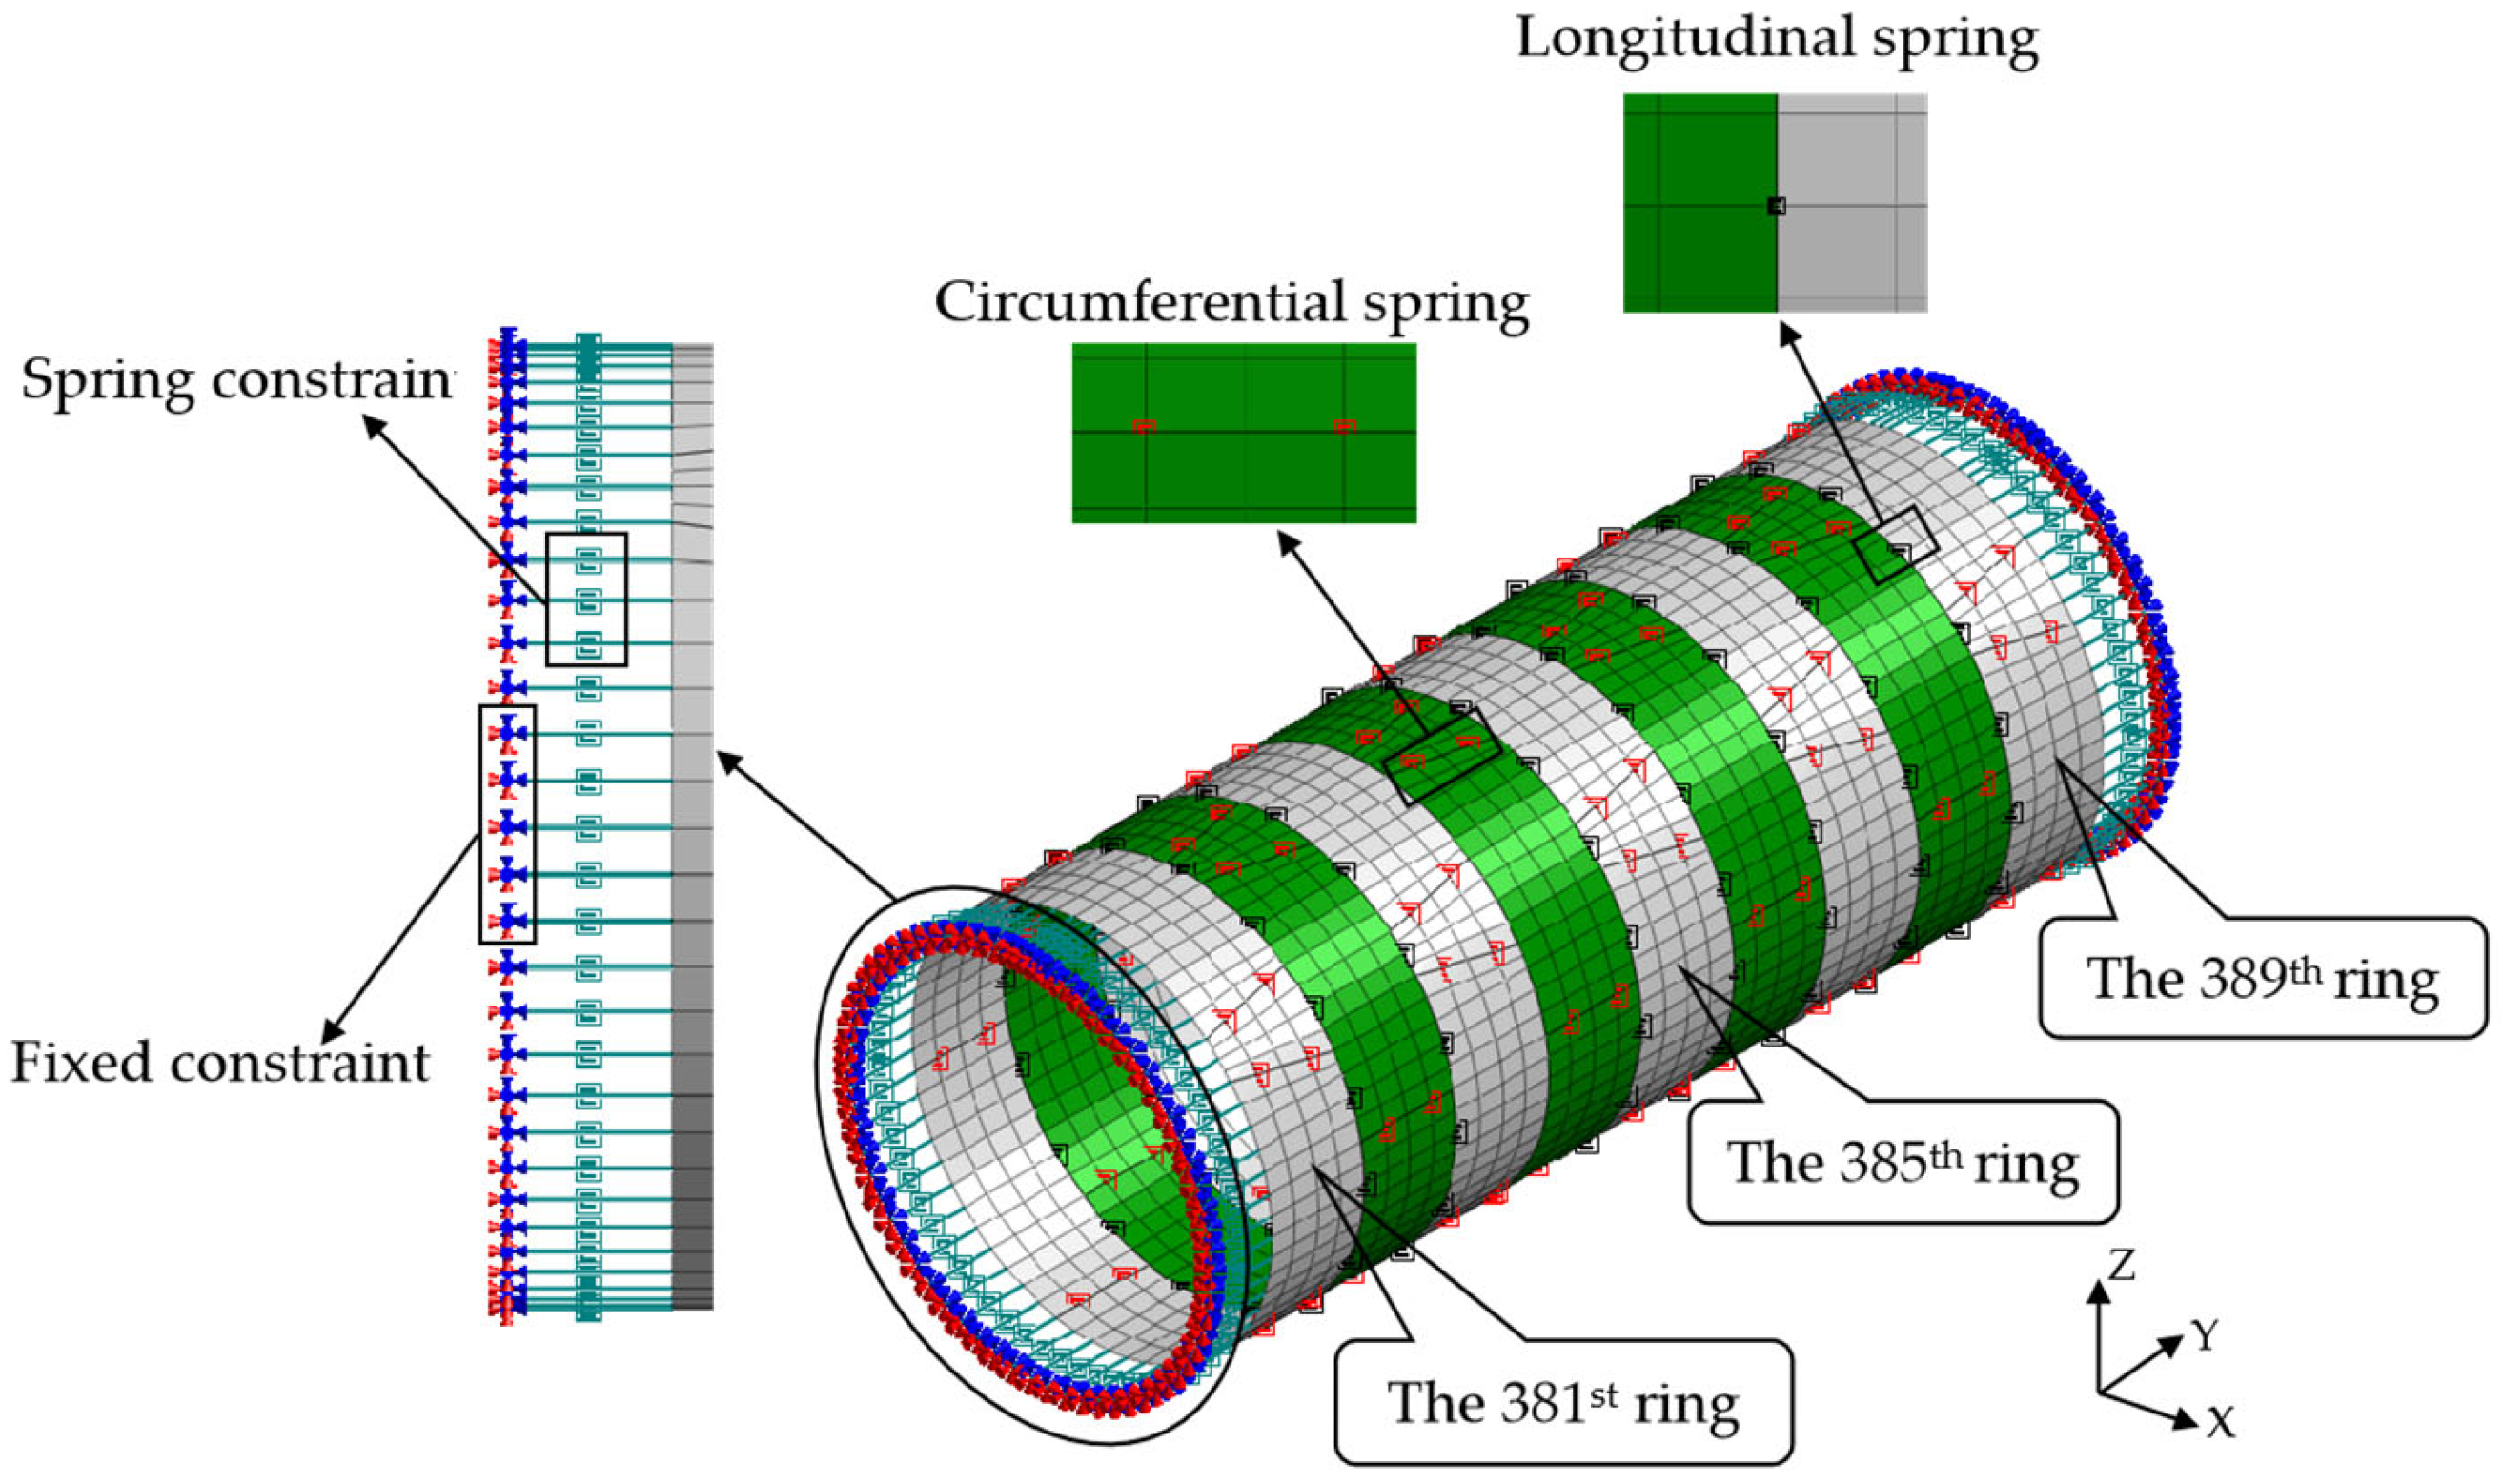
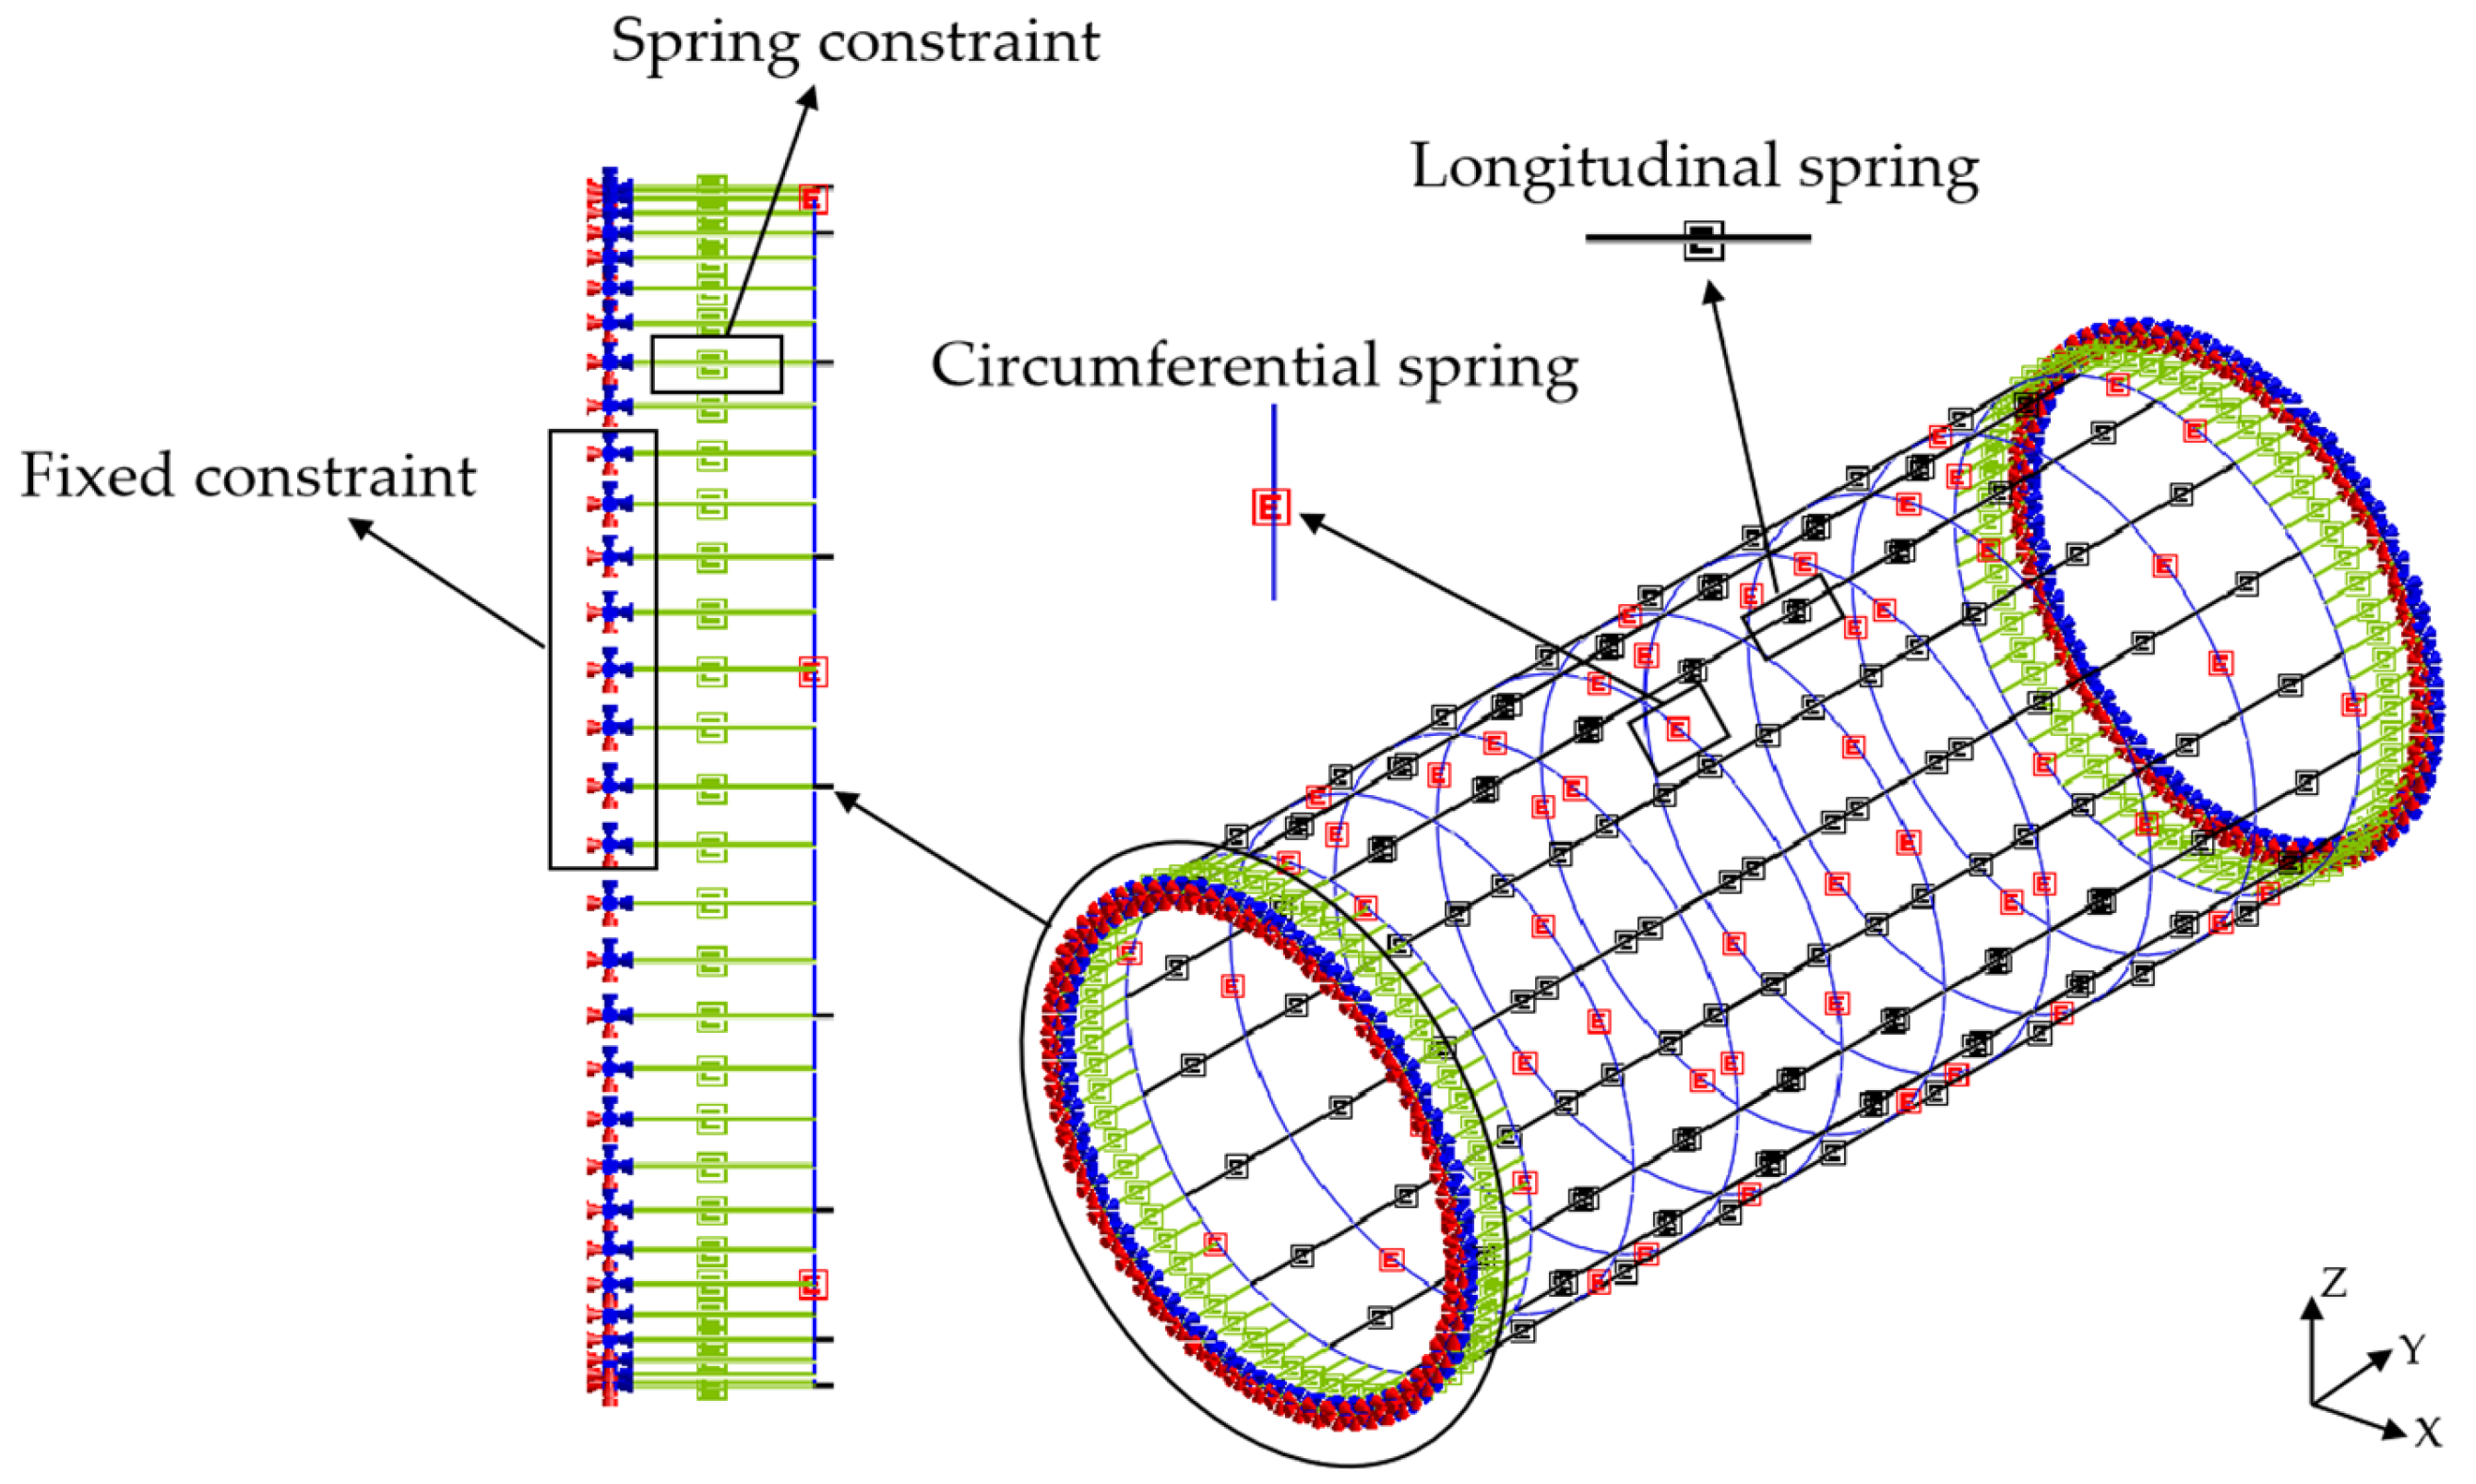
4. Shell–Spring Model and Beam–Spring Model
4.1. Model Establishment
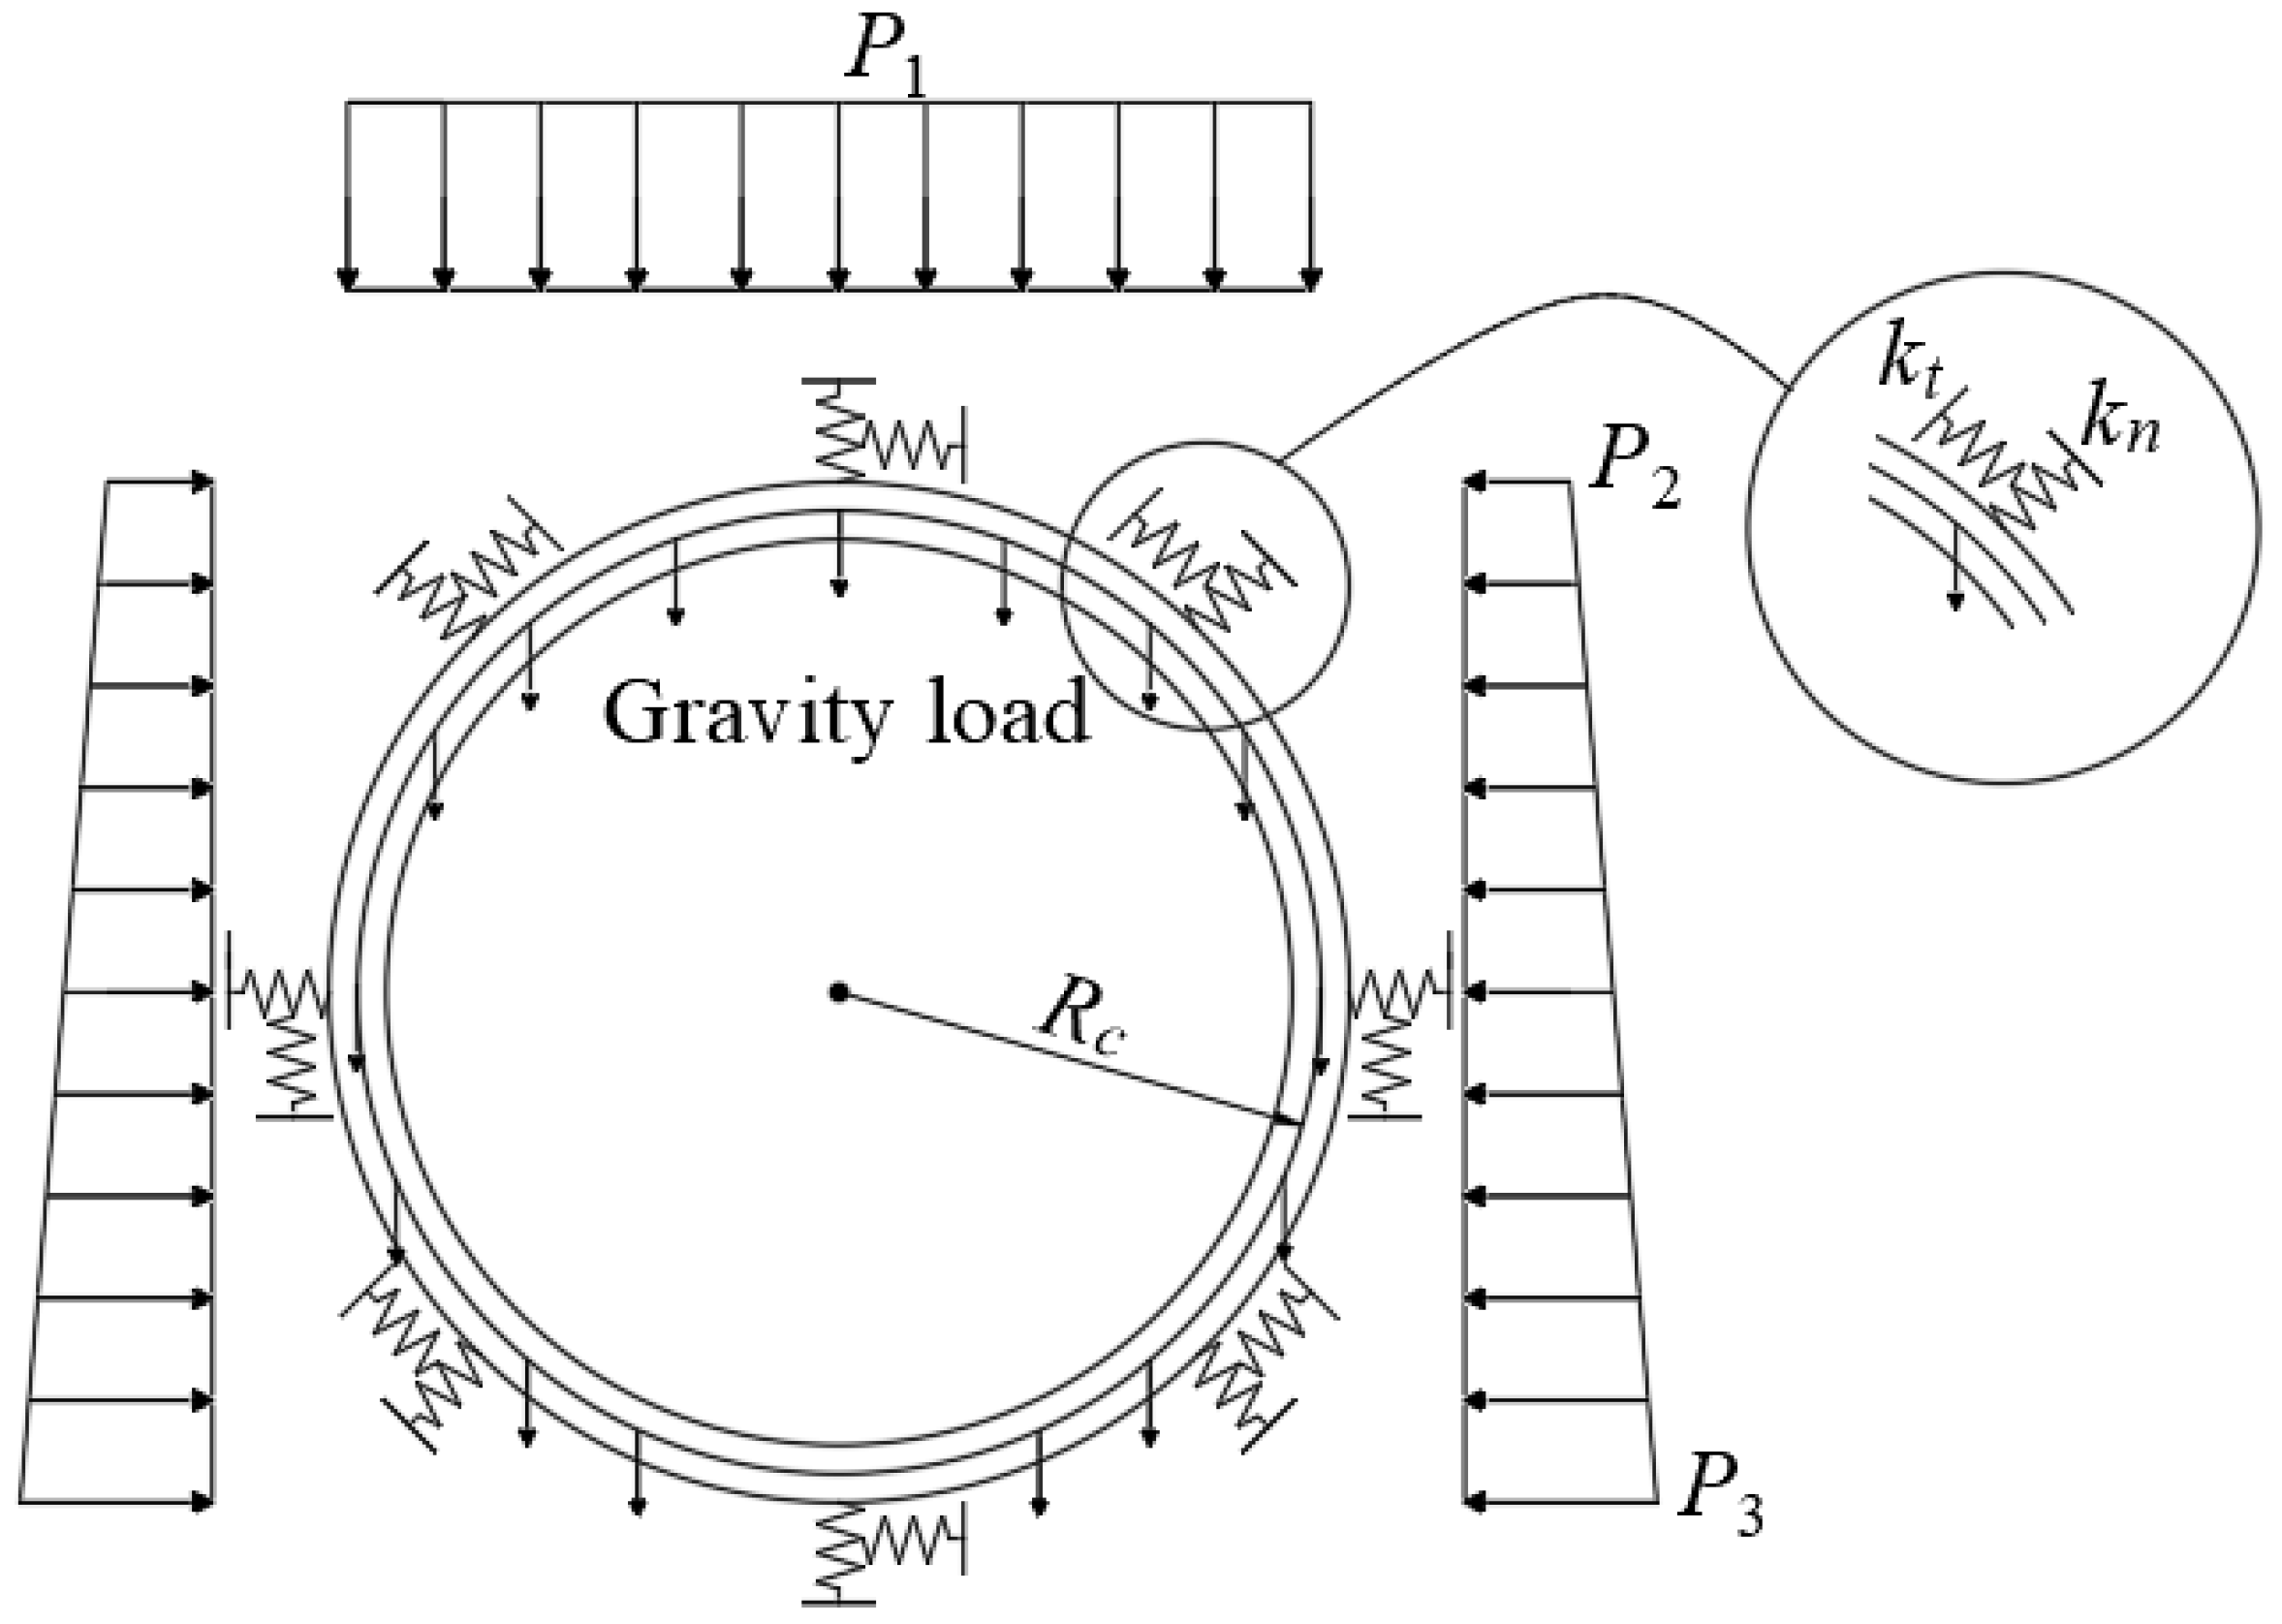
4.2. Load Simulation
4.3. Simulation of Bolt Segments
4.4. Shield Segment Simulation
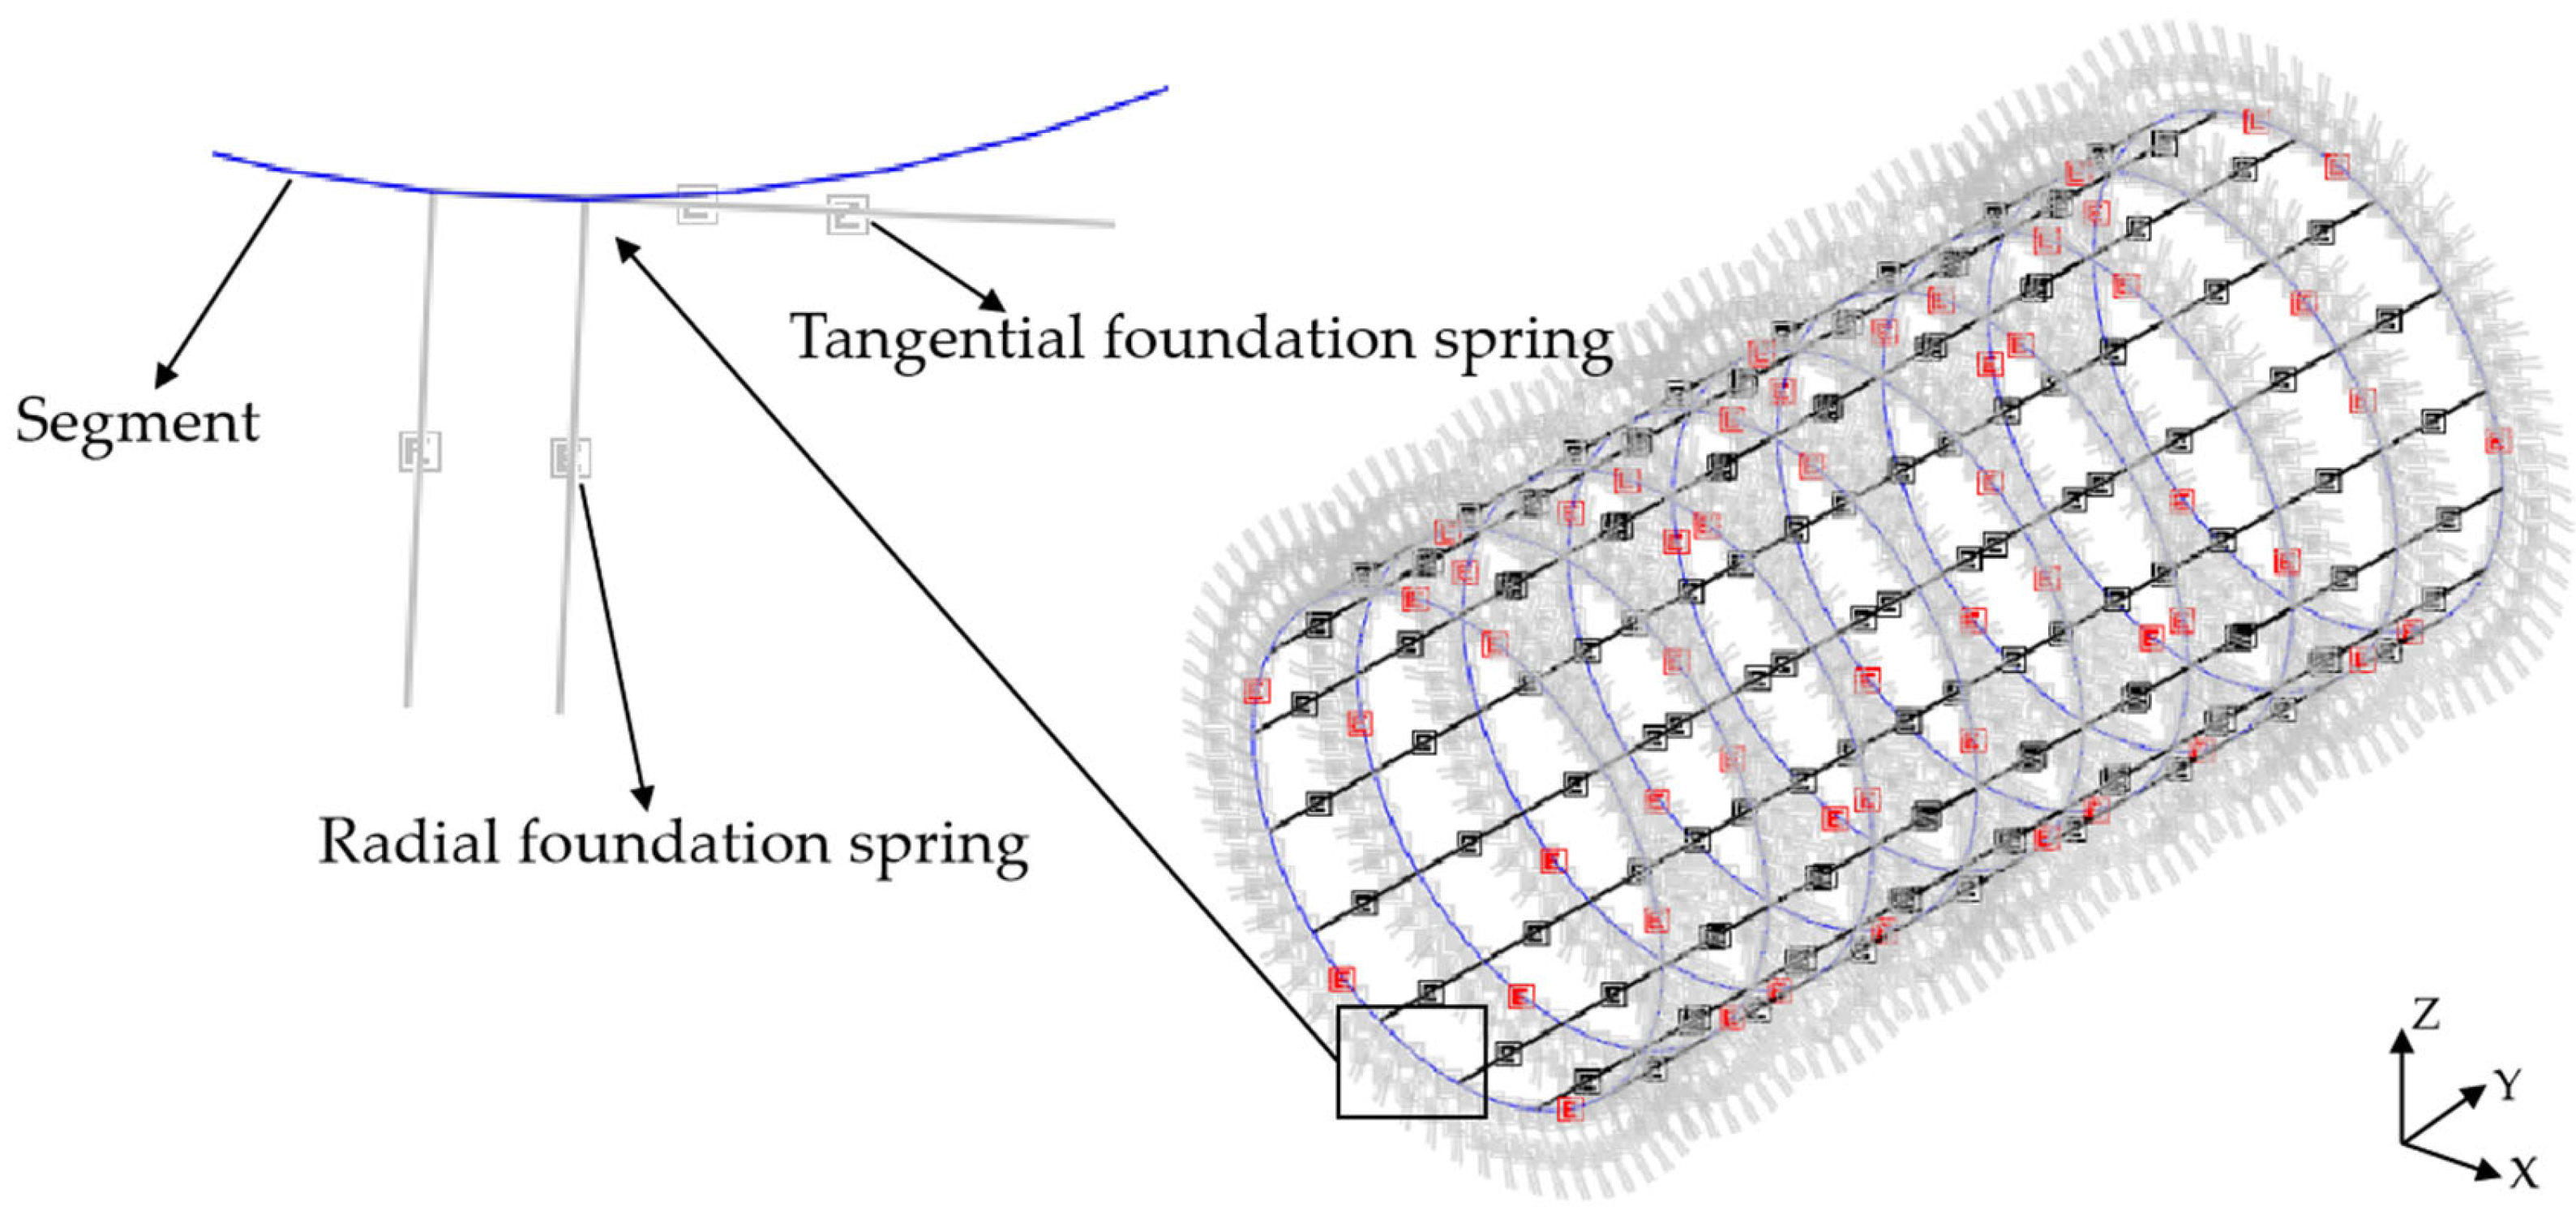
4.5. Contact Simulation between Segment and Stratum
5. Calculation Results and Comparative Analysis
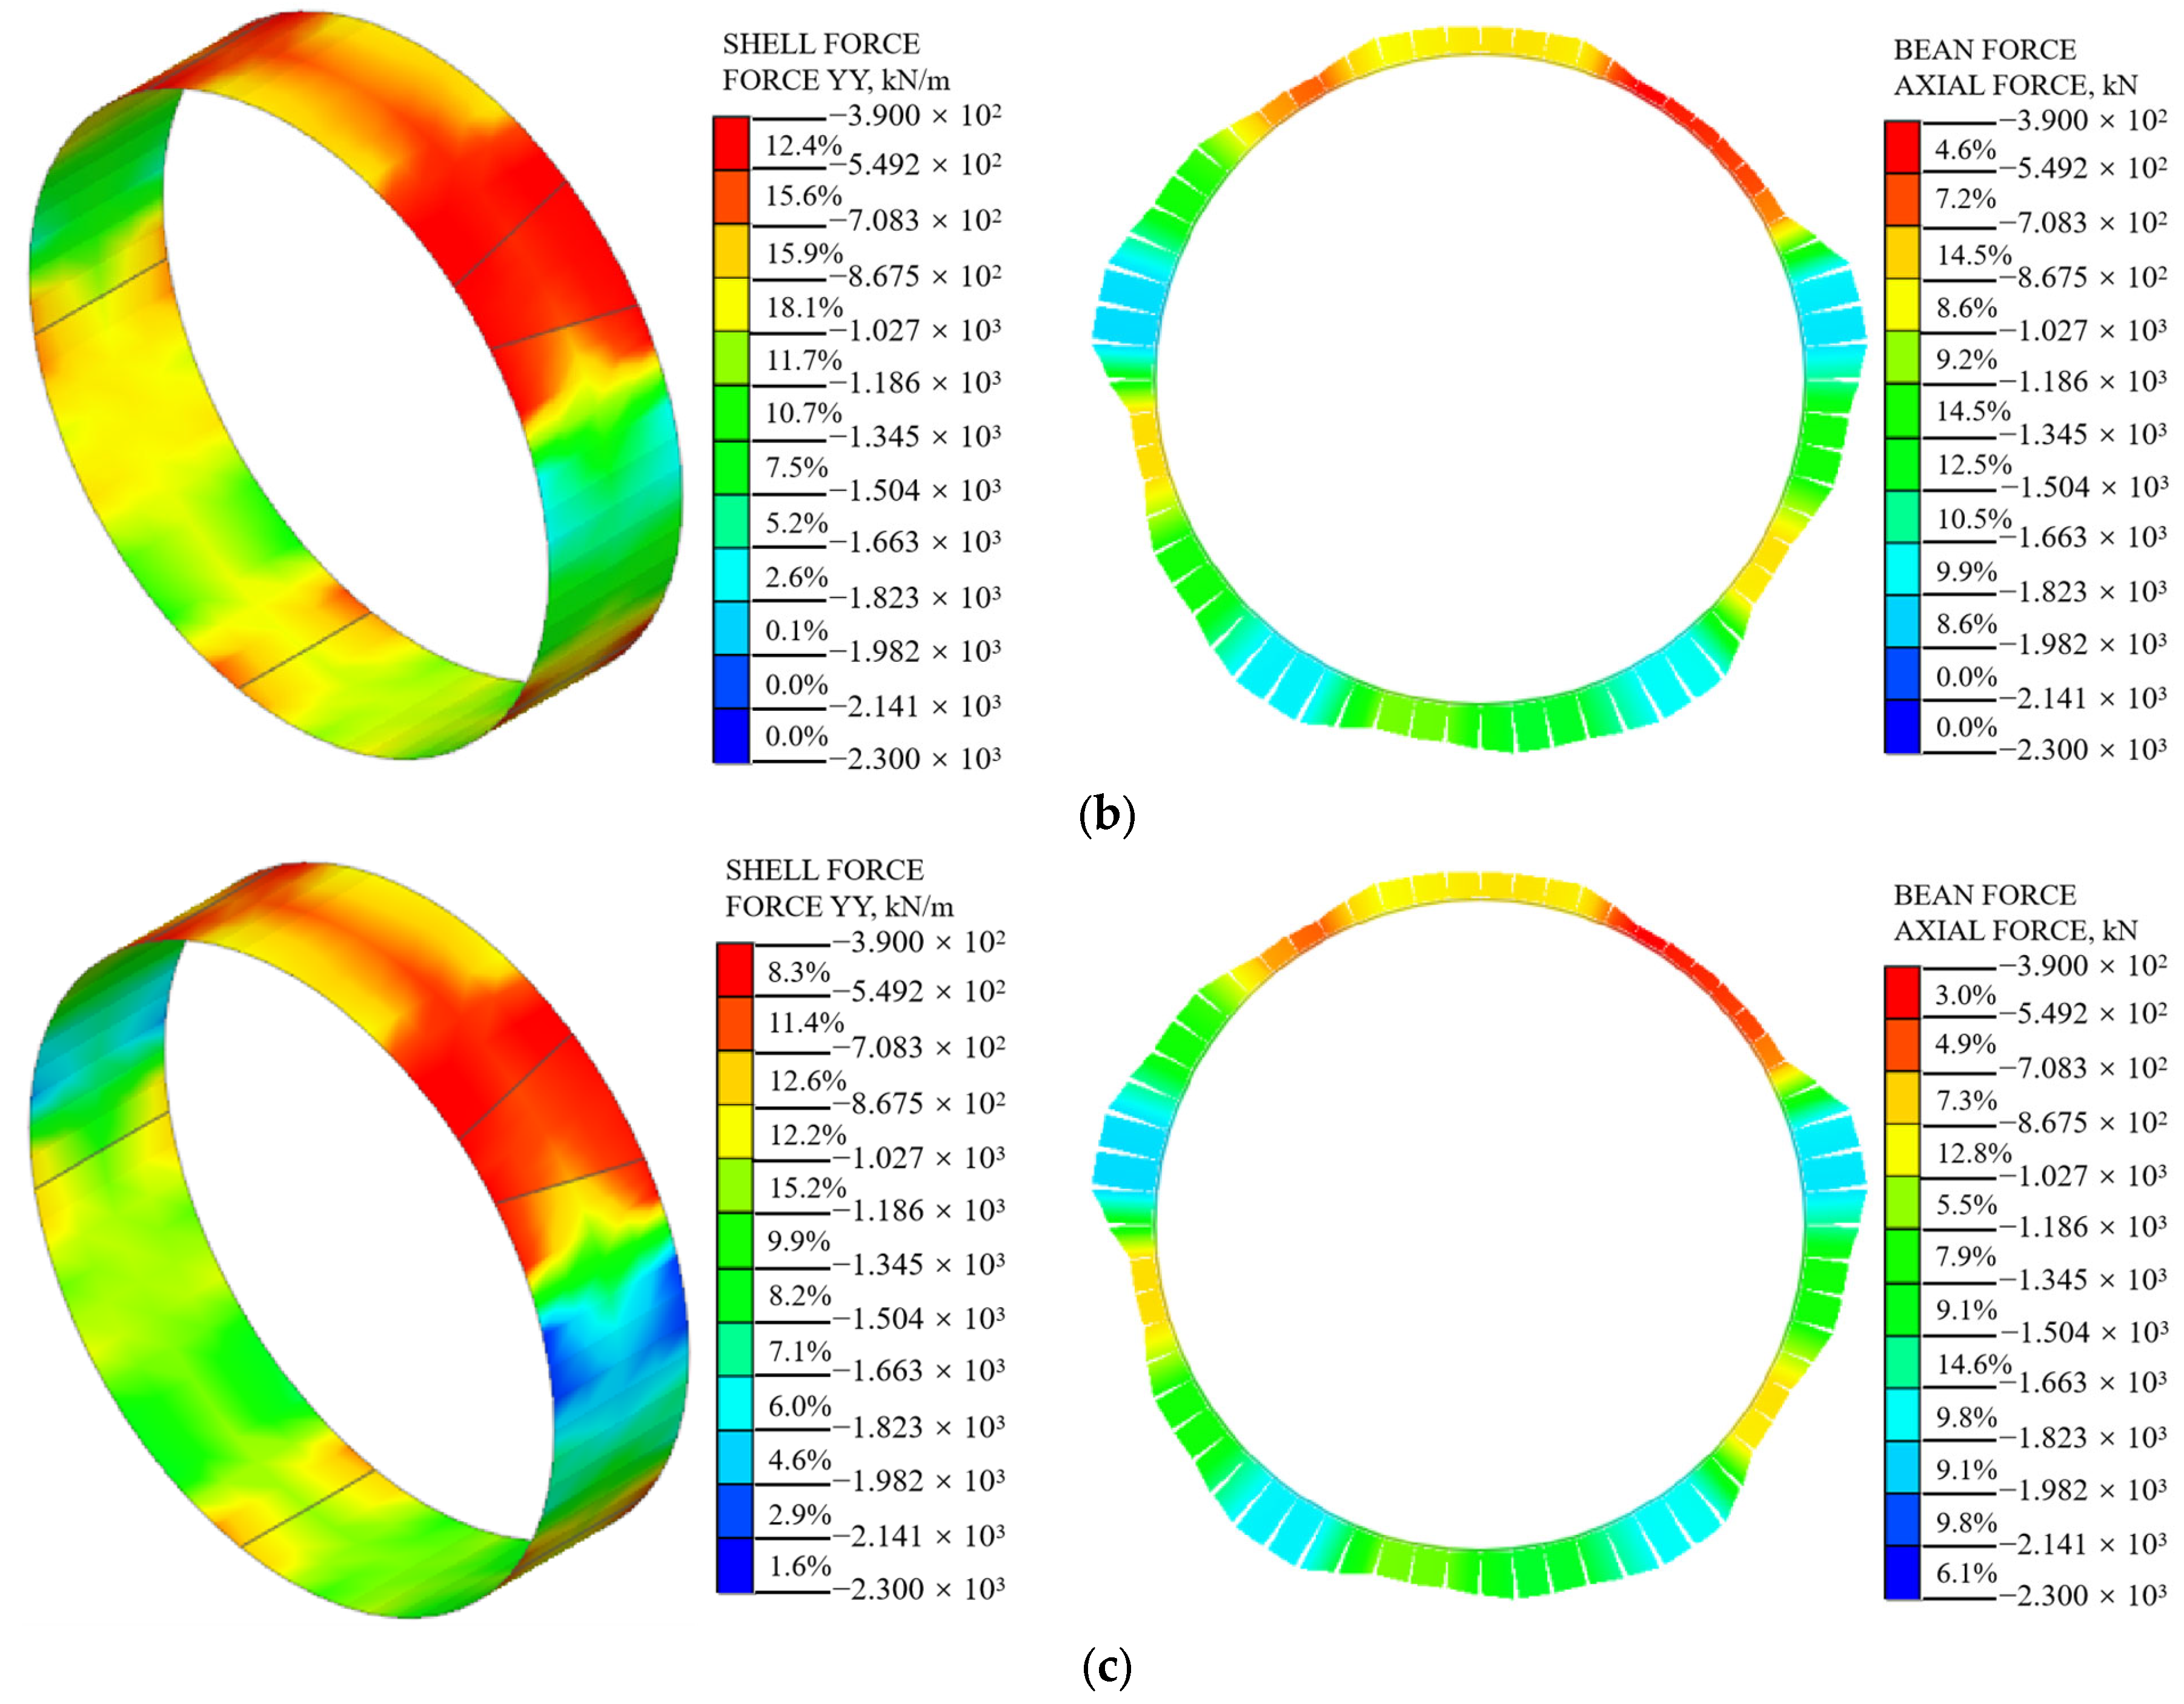
5.1. Internal Force of Shield Segments
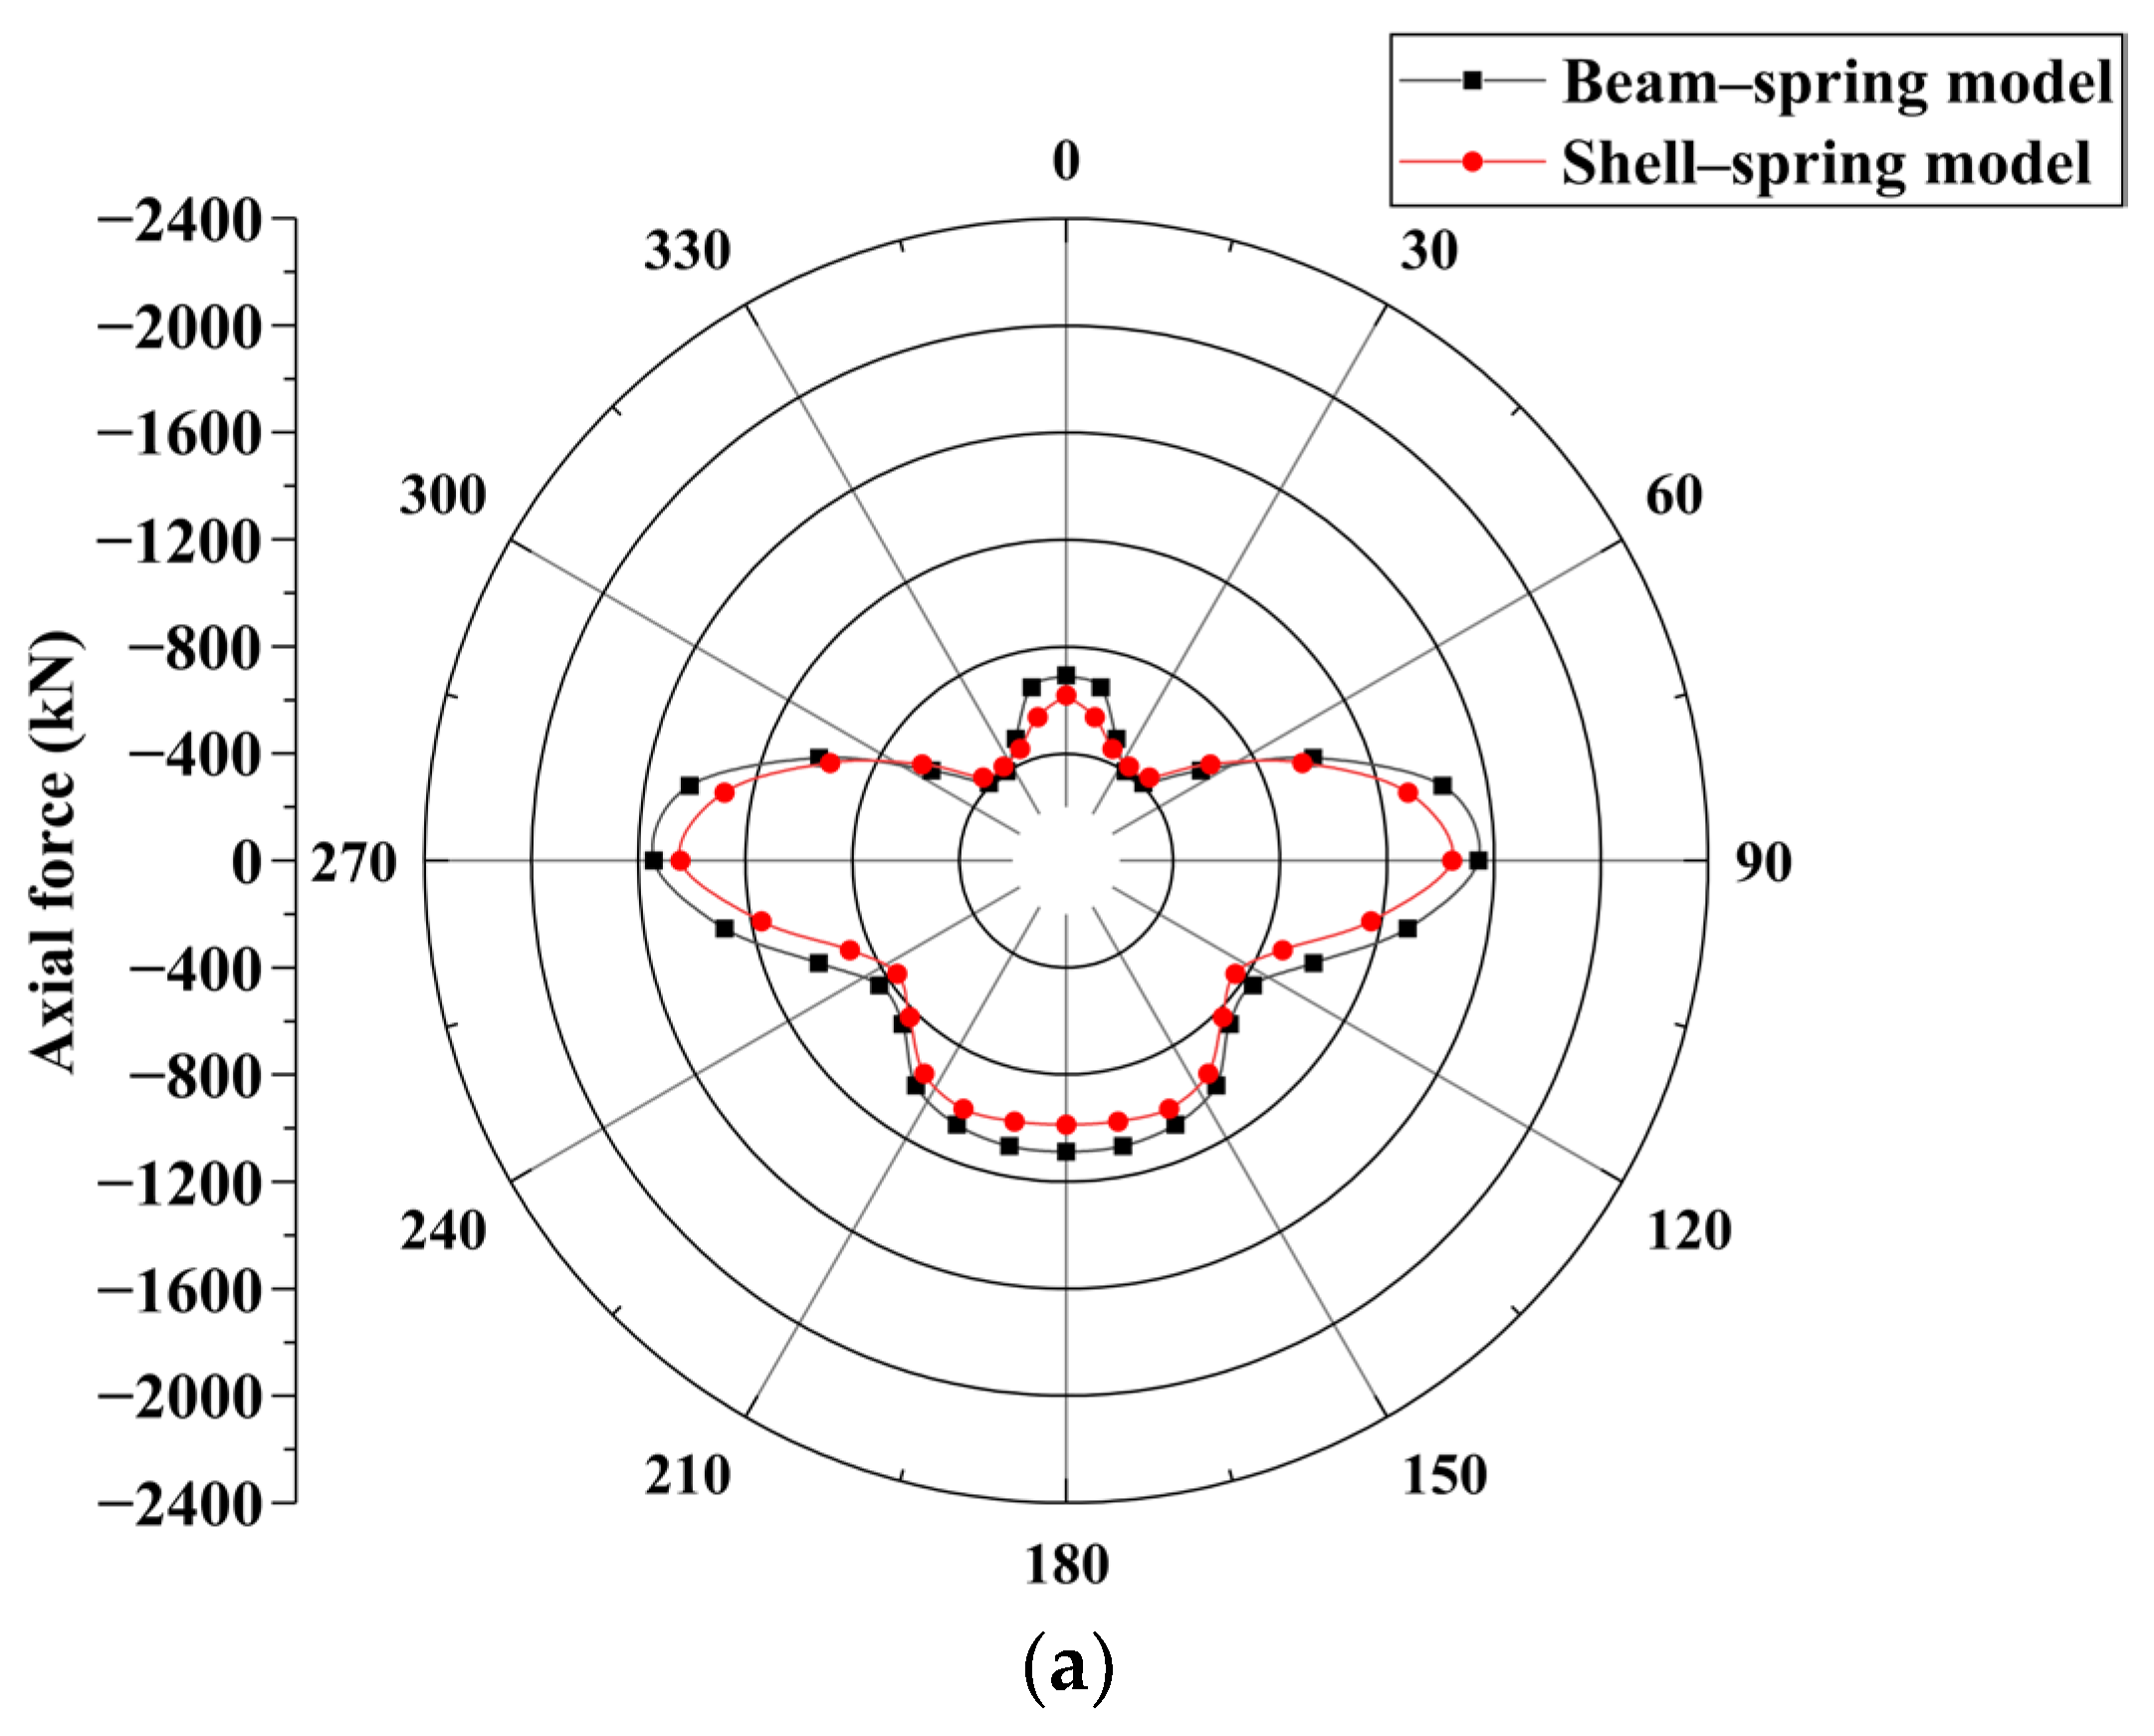
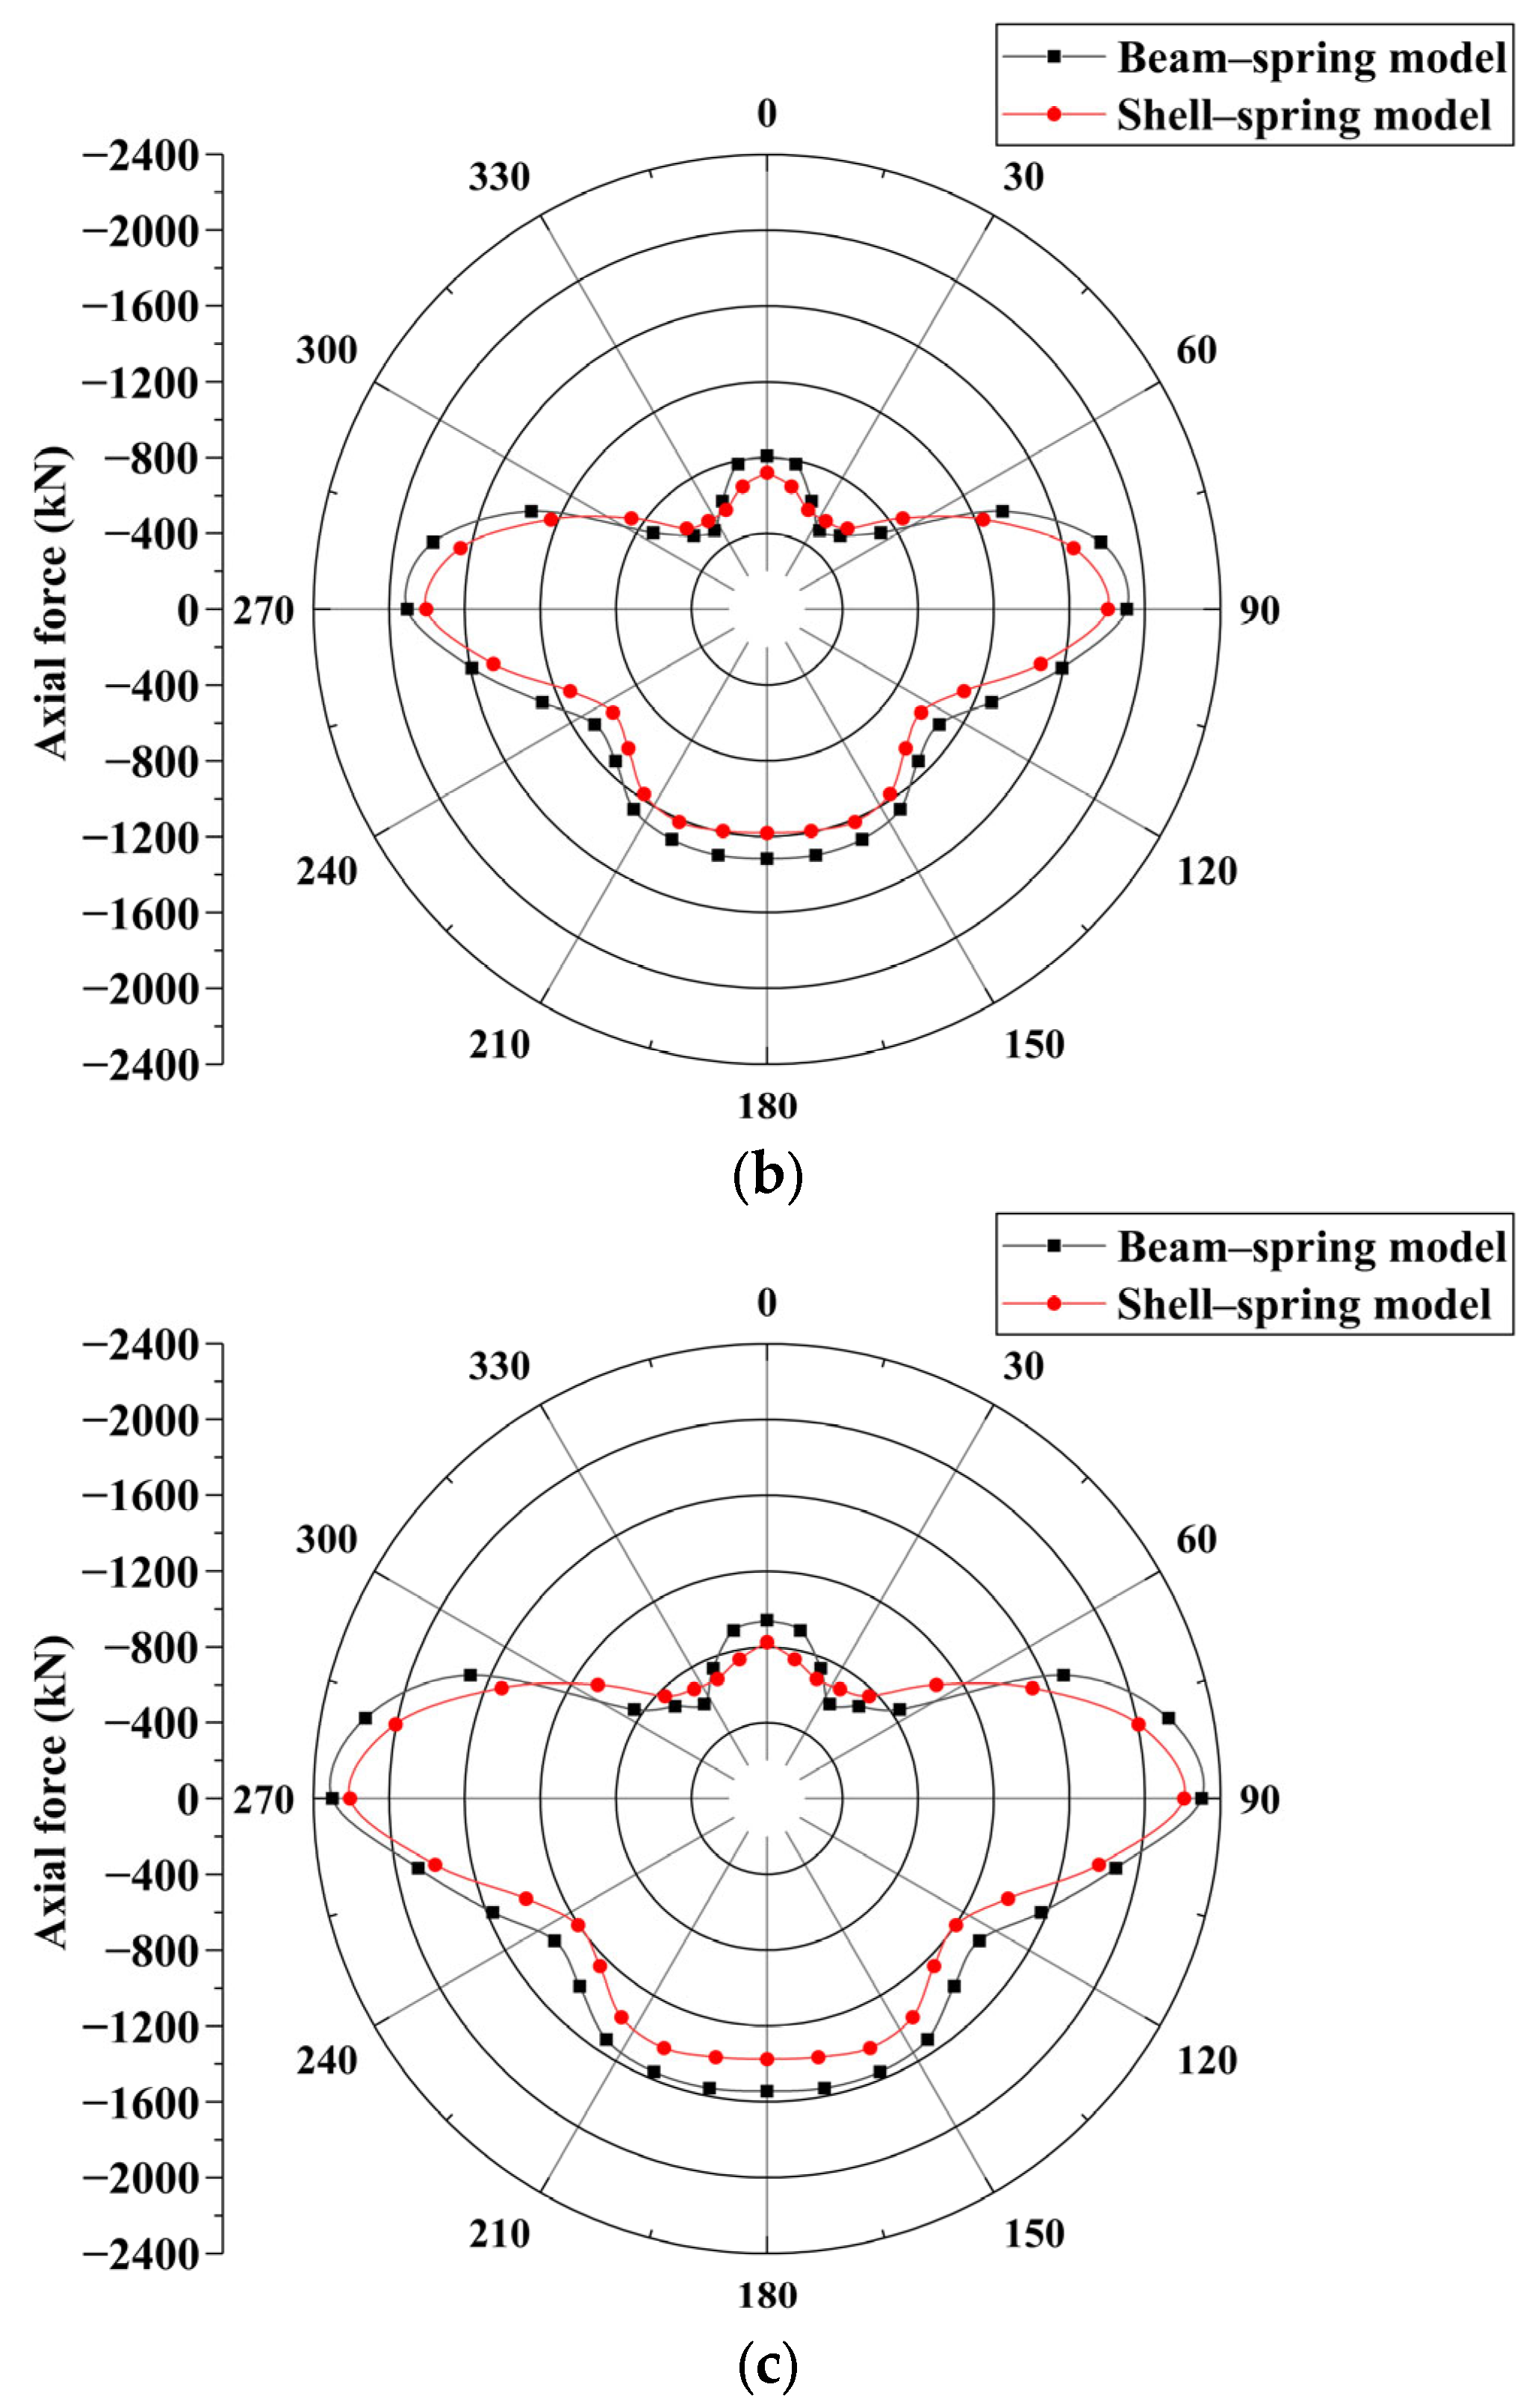
5.1.1. Axial Force
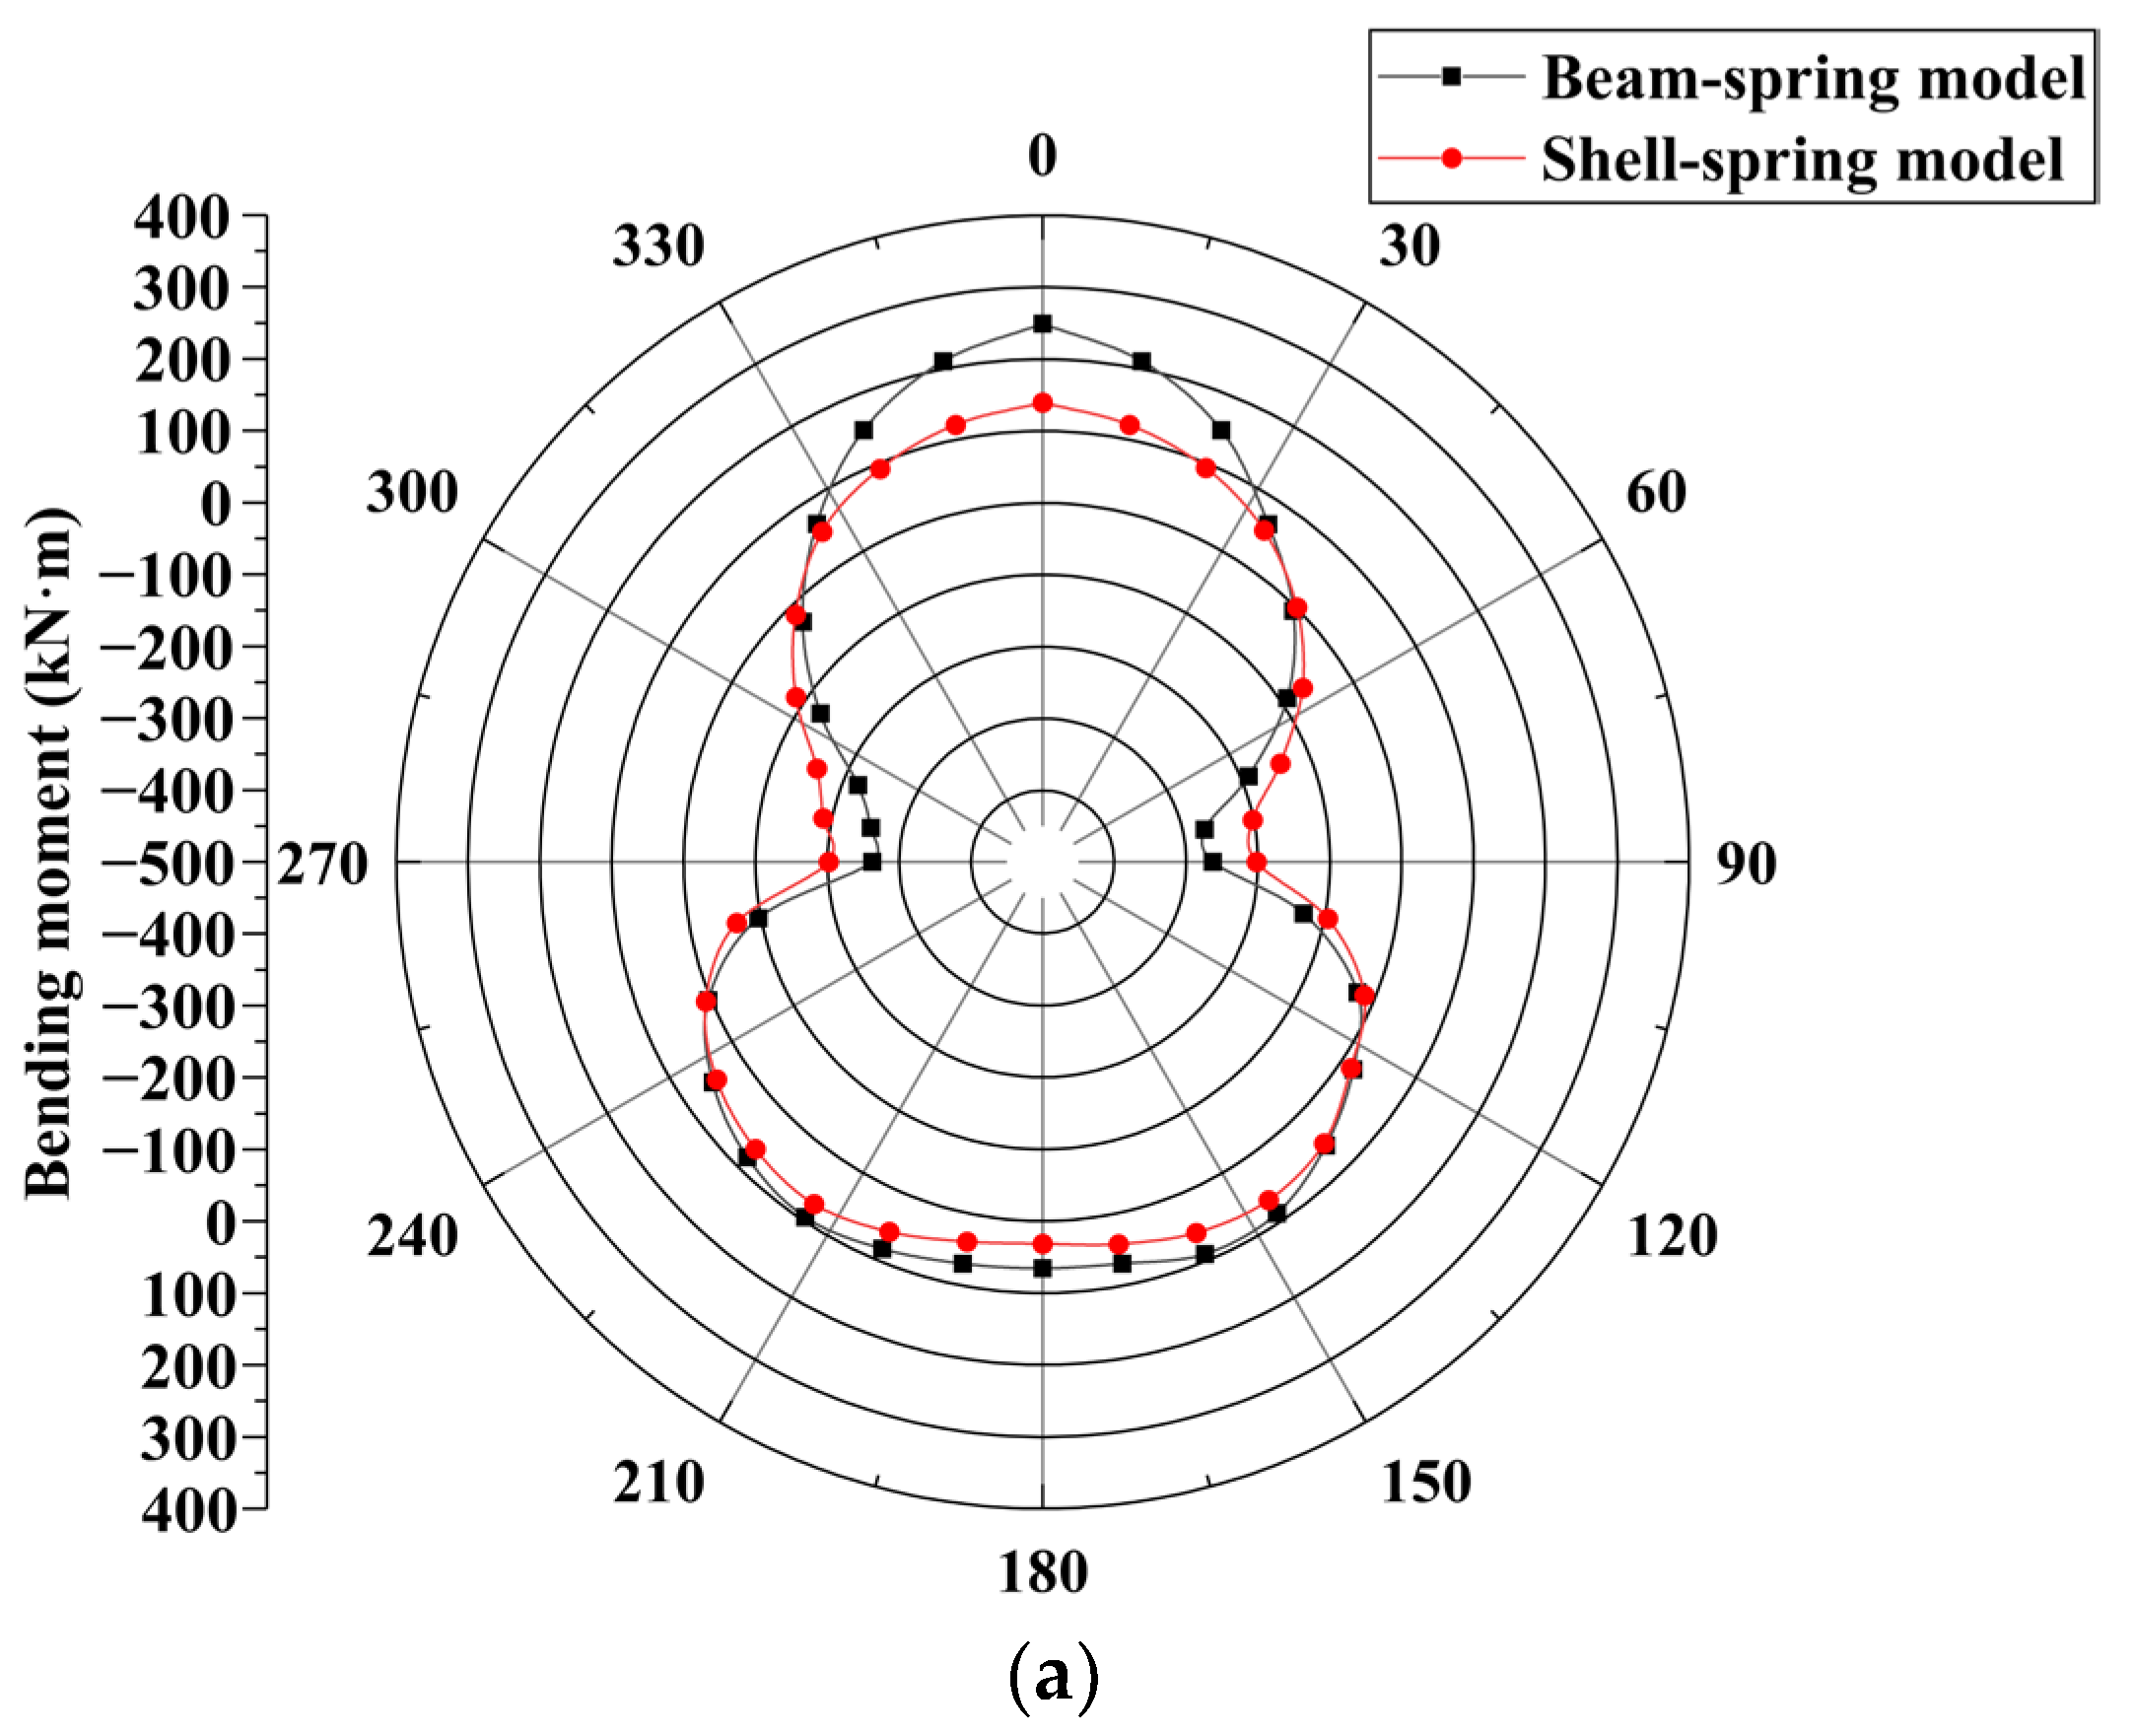
5.1.2. Bending Moment
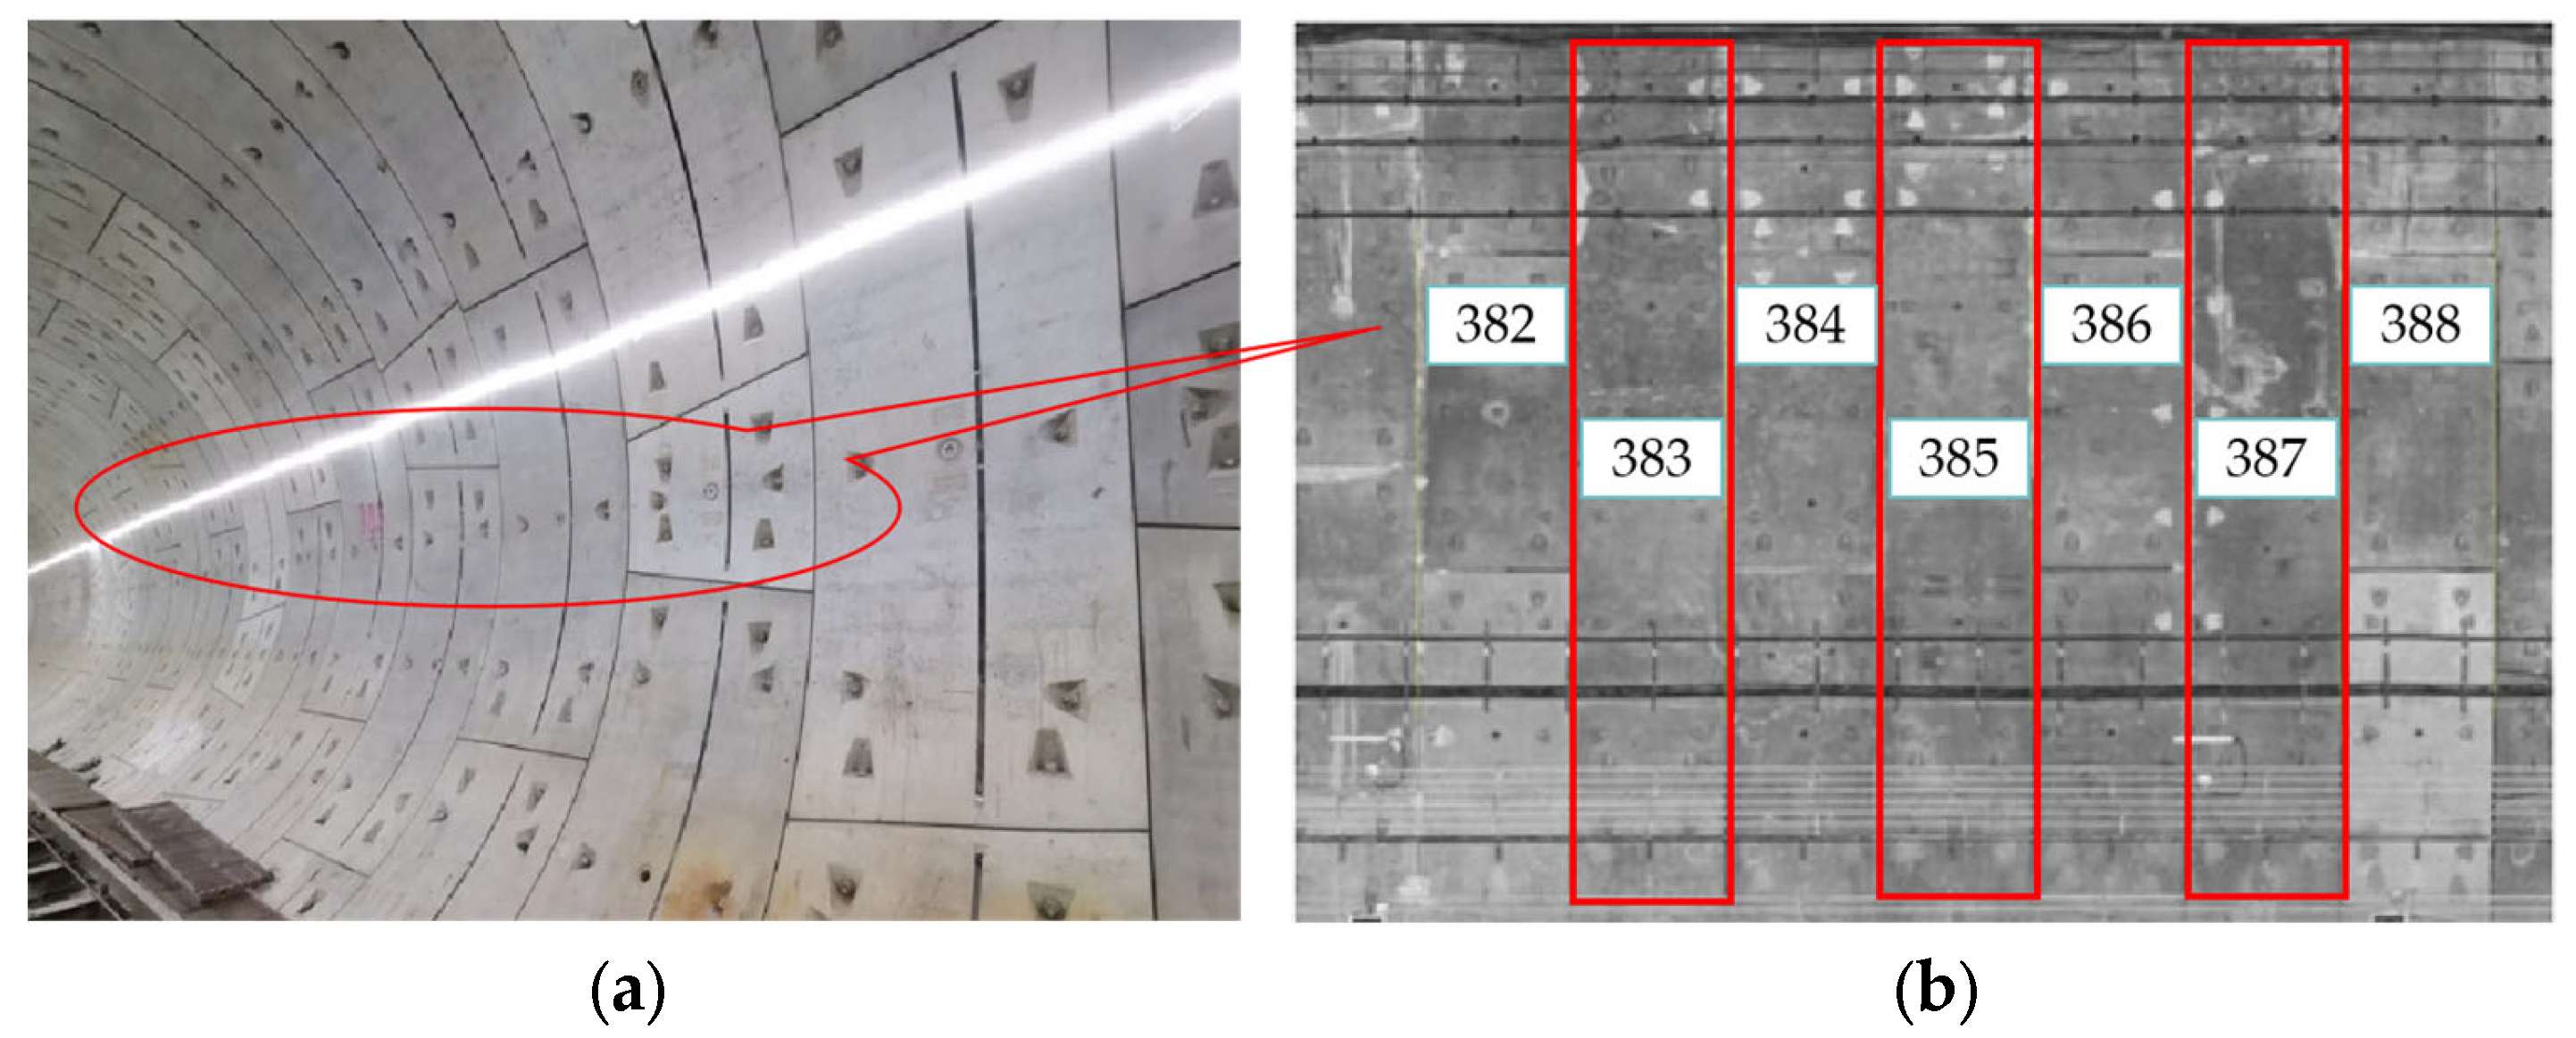
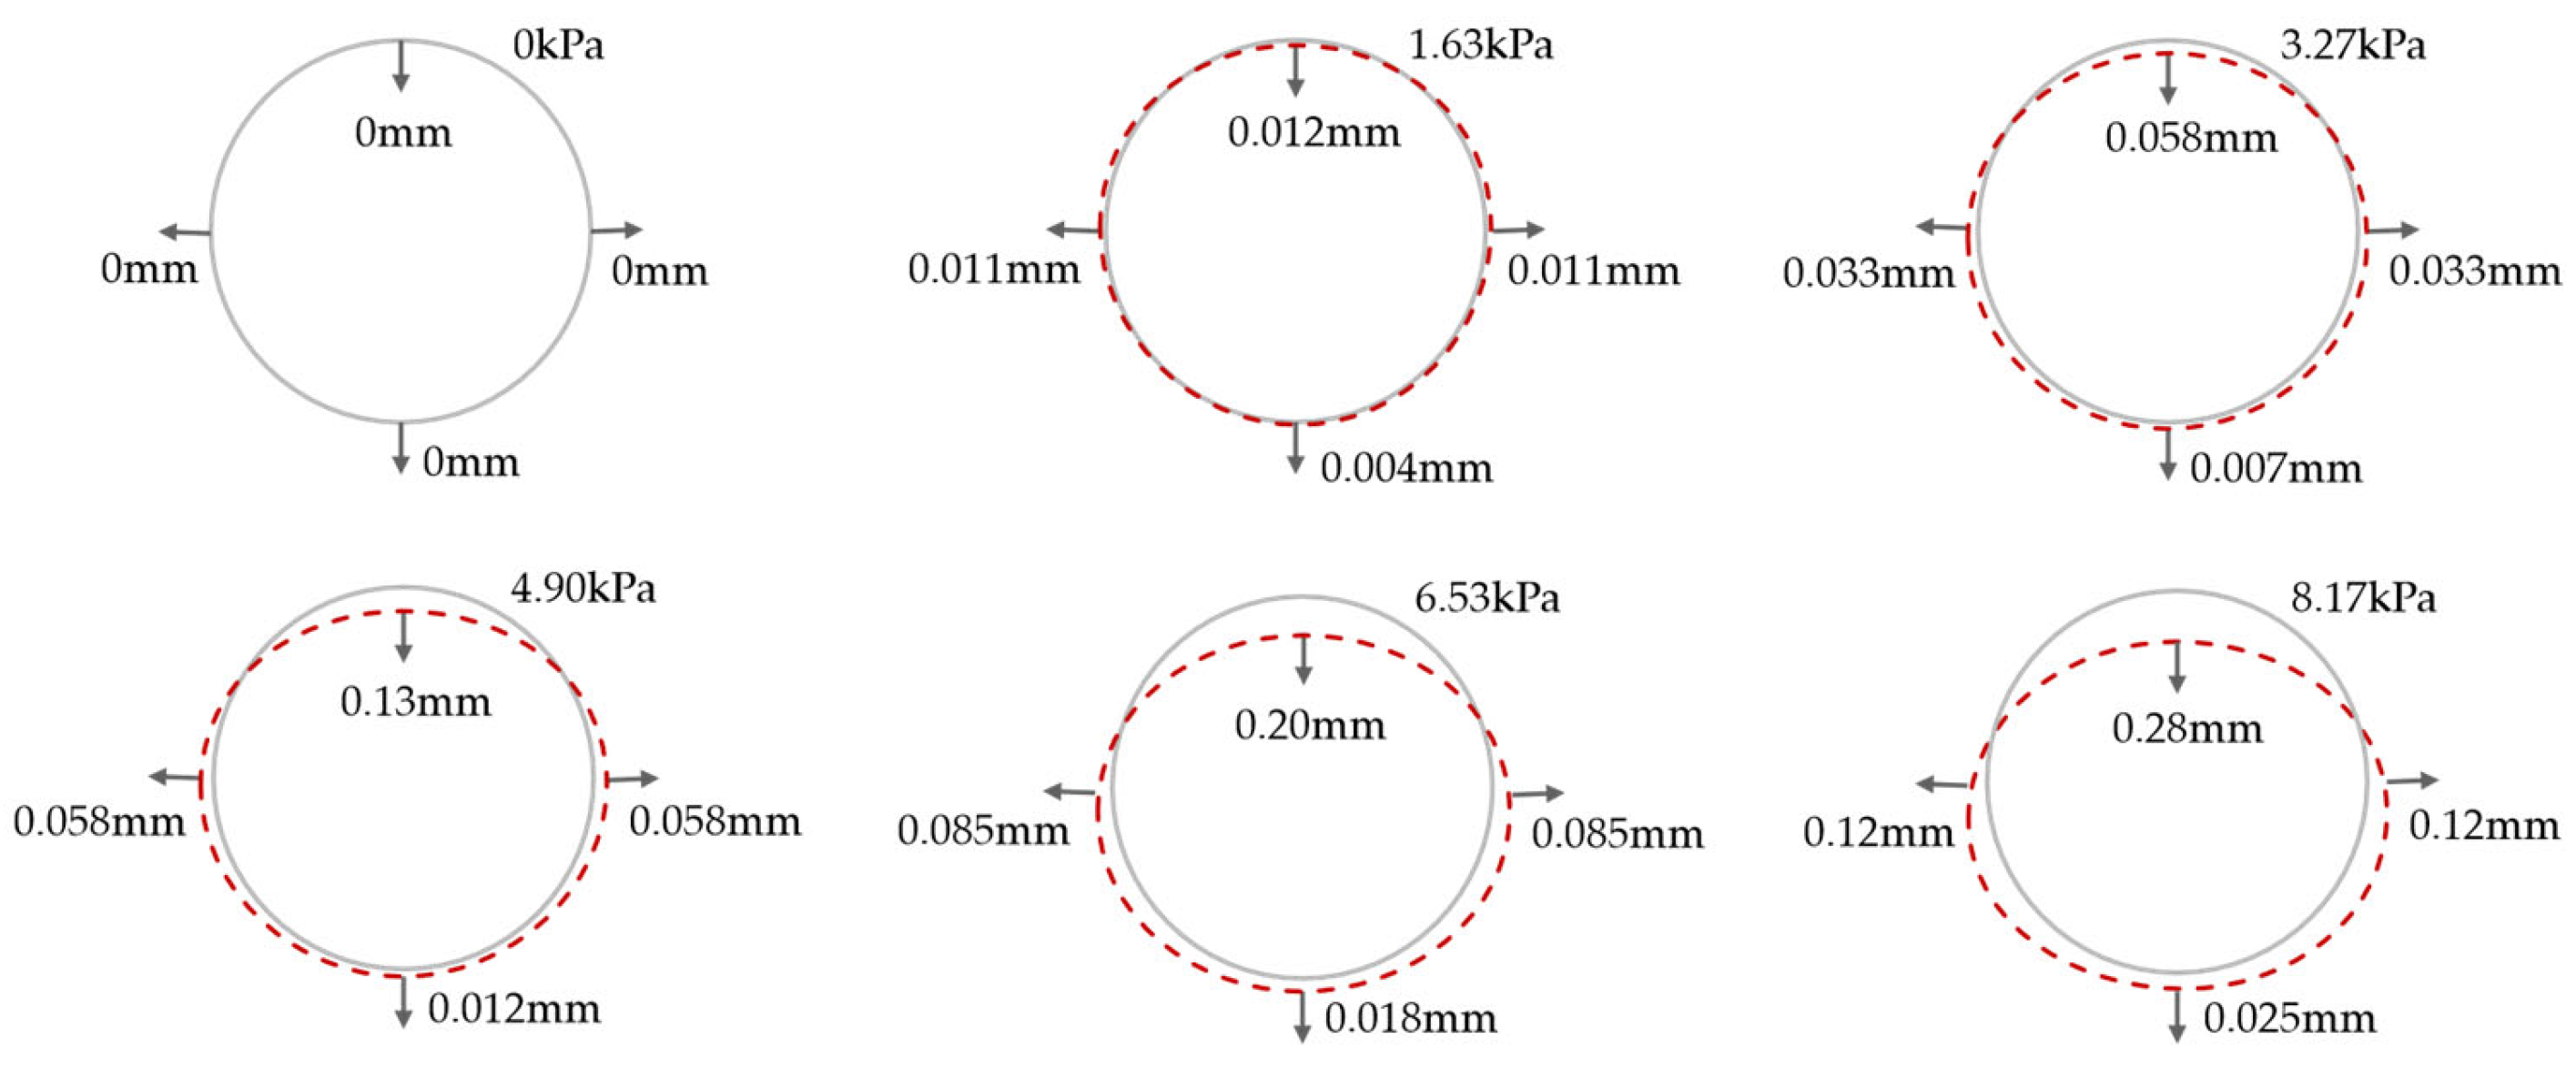
5.2. Comparative Analysis of Measured Deformation and Simulated Calculation of Shield Segment
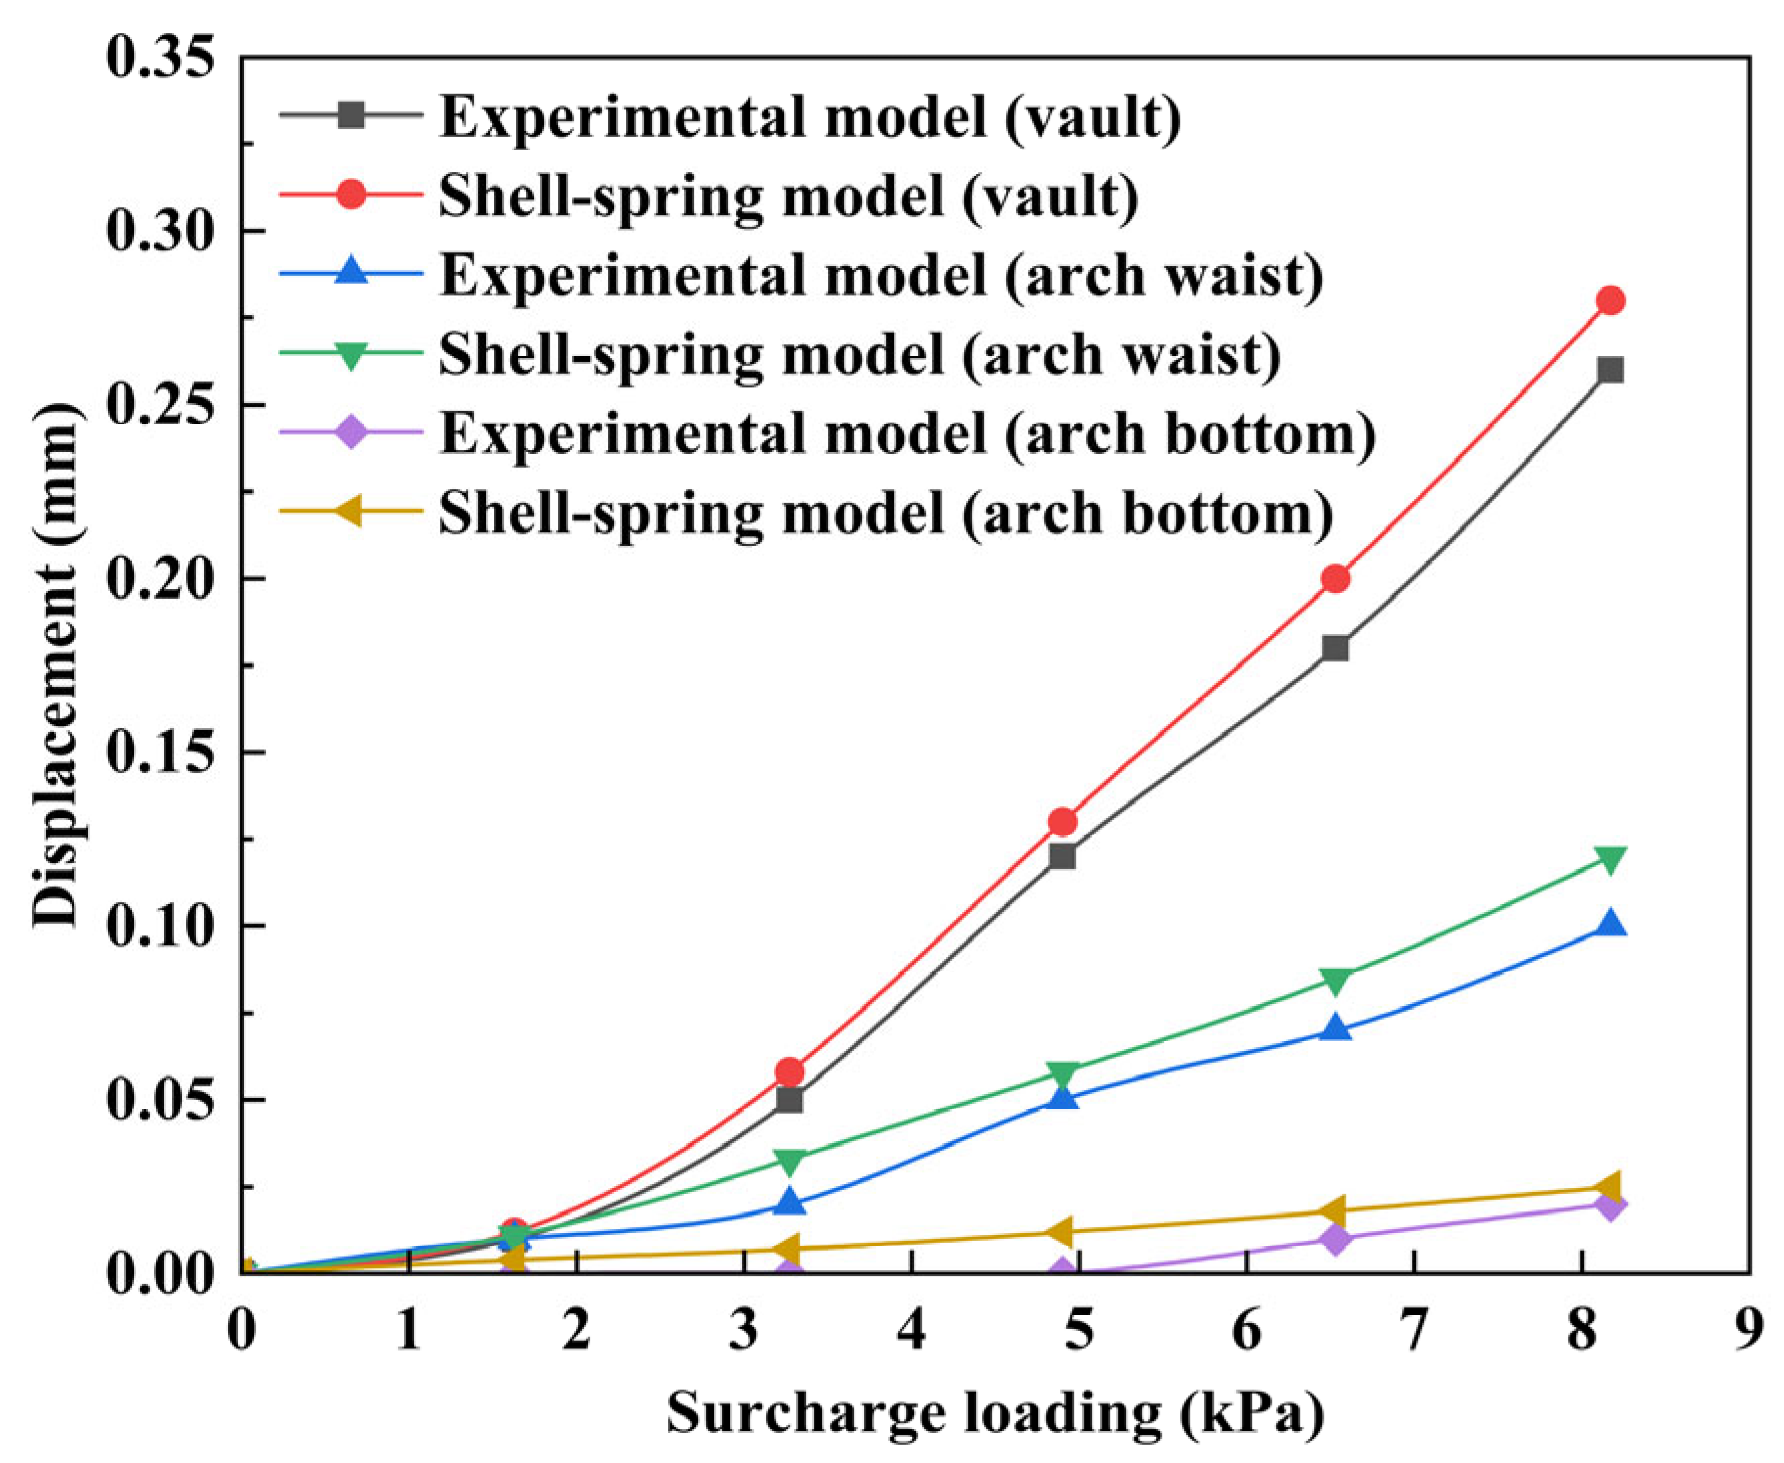
5.3. Shell–Spring Model Validation
5.4. Ultimate Bearing Capacity and Safety Evaluation of Segment Normal Section
6. Conclusions and Recommendations
- (1)
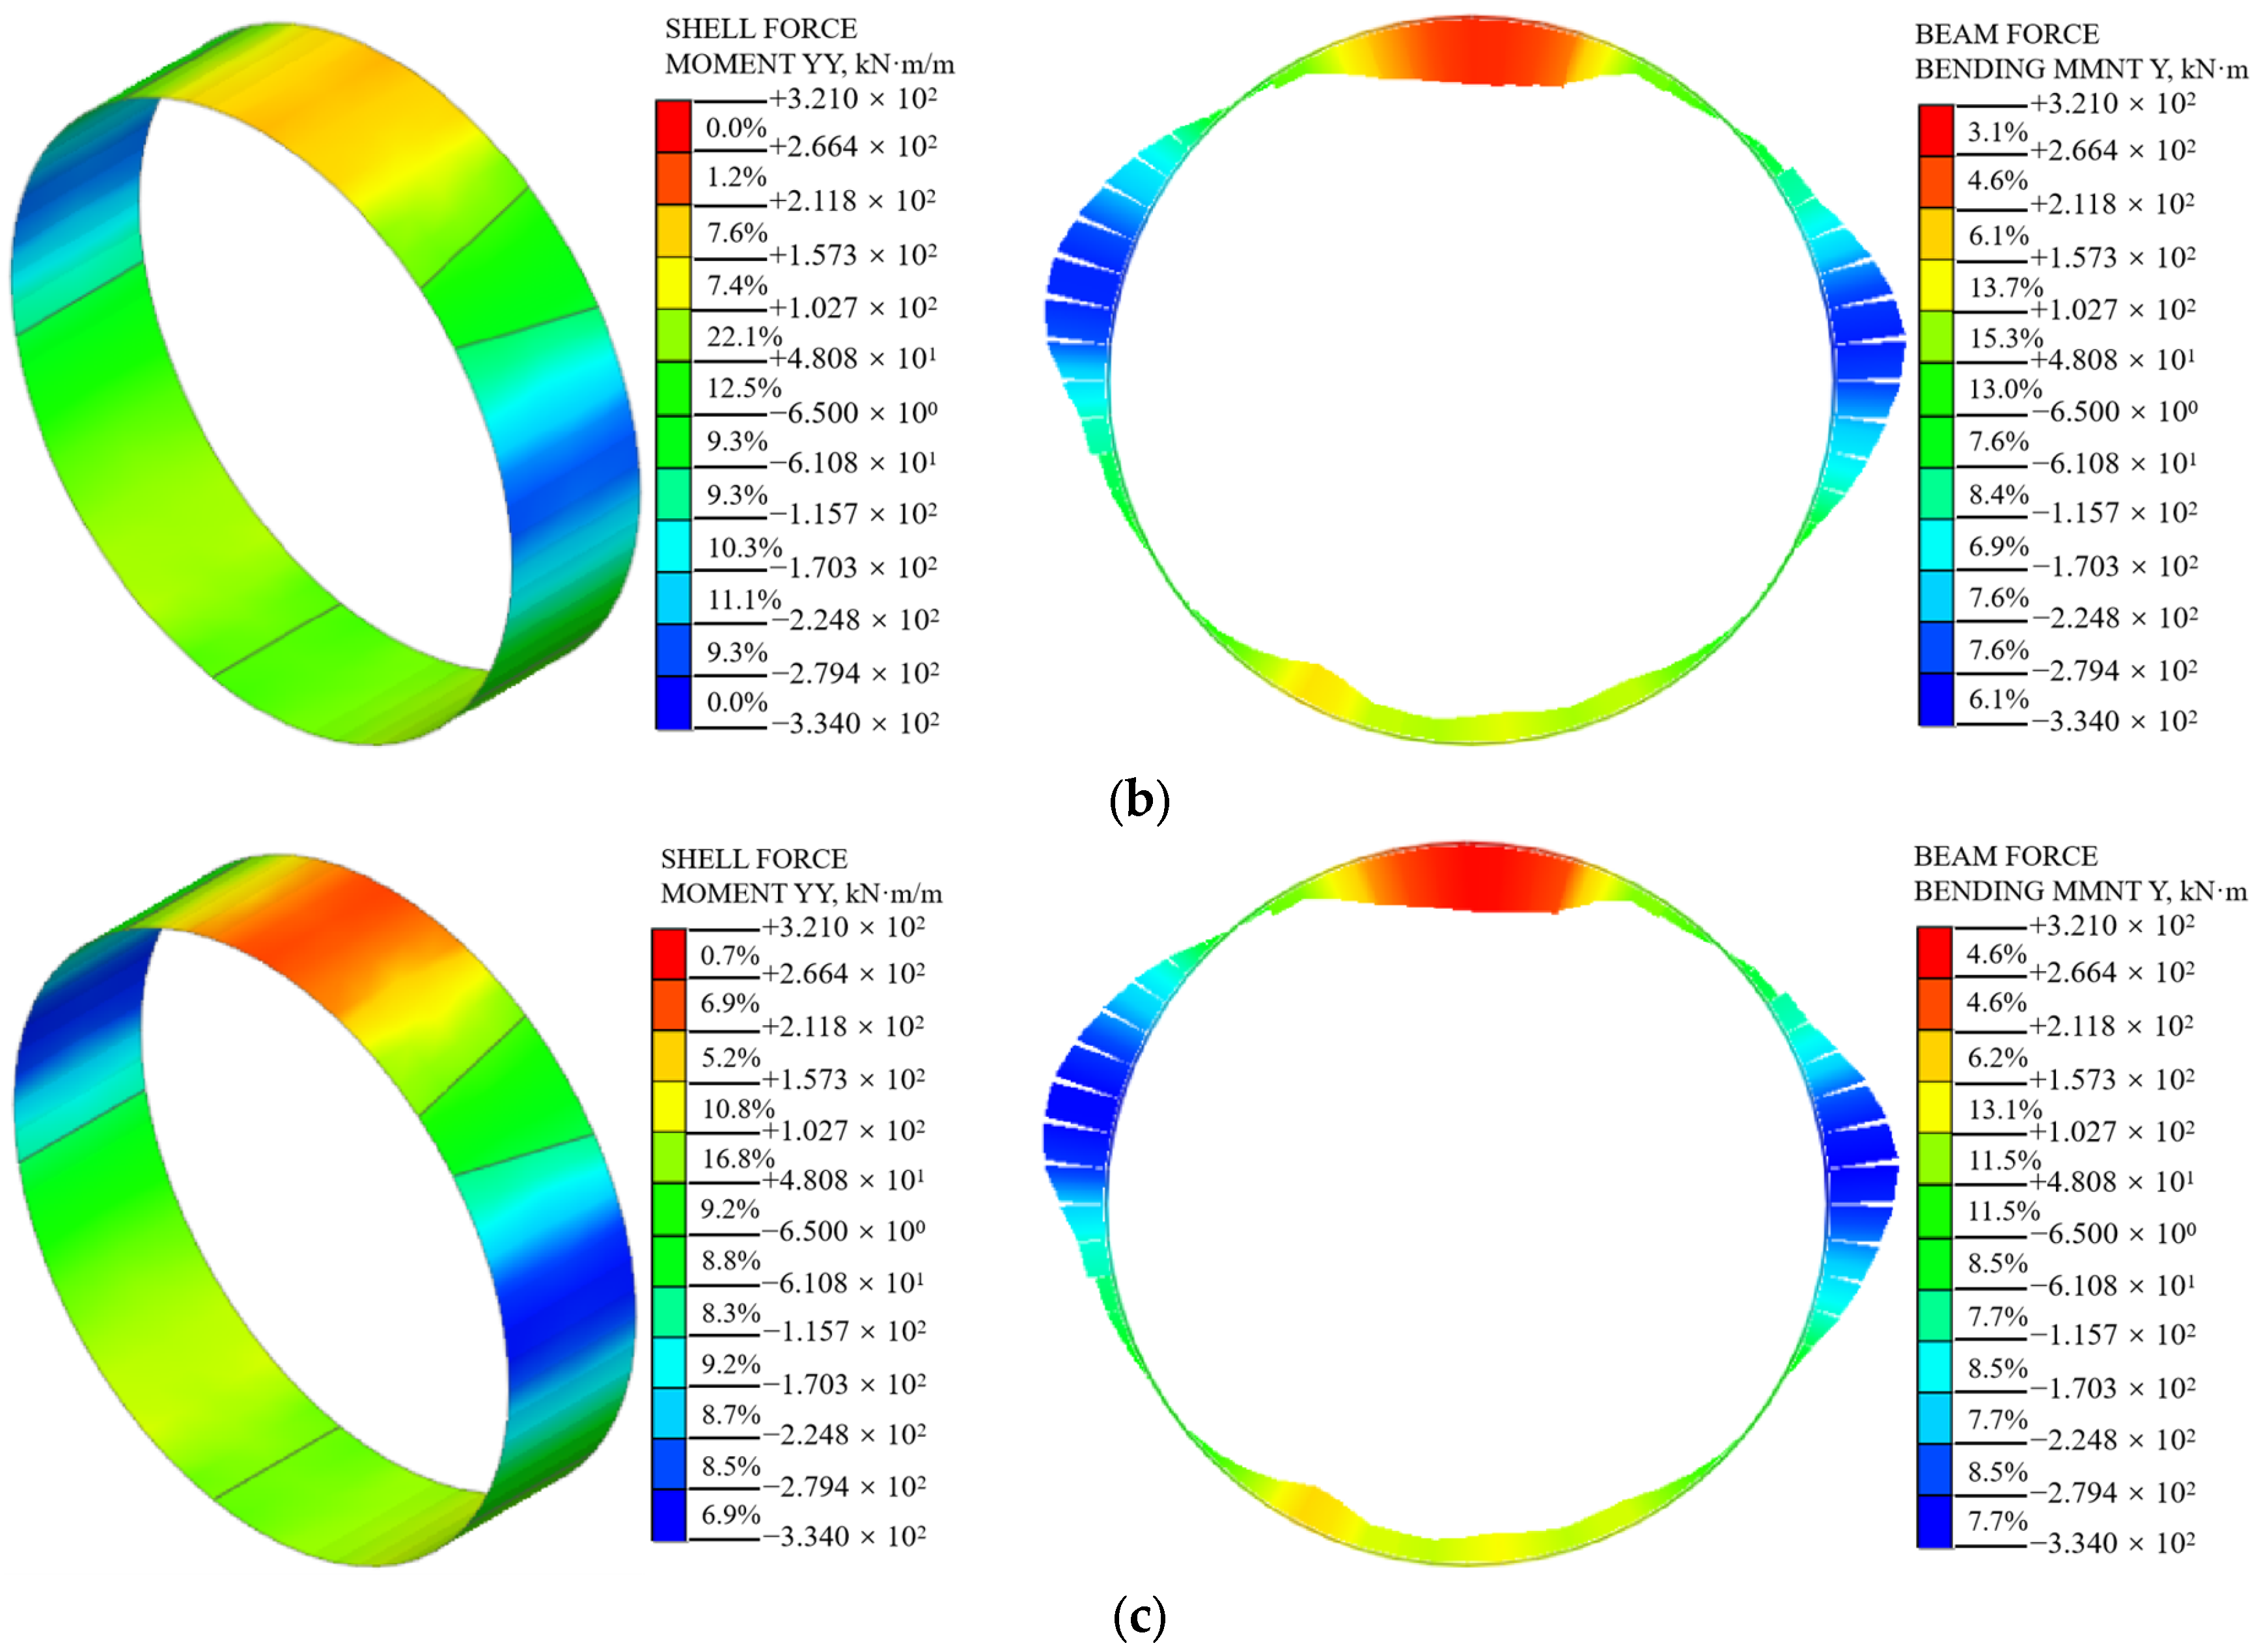
- With an increase in surcharge loading, the internal force of the segment structure increases gradually. In the shell–spring model, the internal force of the segment decreases gradually from the edge to the center of the segment width. The shield segment presents an obvious non-plane strain state. Especially at the joint spring connection, it shows obvious stress concentration. This is in good agreement with the actual stress state under the staggered assembly of shield segments;
- (2)
- The internal force calculation results of the beam–spring model and the shell–spring model were compared and analyzed. The internal force of the beam–spring model is greater than that of the shell–spring model. The difference in axial force calculated using the two models is small, and the difference in bending moment is large. Nevertheless, with an increase in surcharge loading, the internal force difference of the segment structure calculated using the two models decreases gradually;
- (3)
- The difference between the two models and the measured tunnel deformation was analyzed. The results show that the calculation results of the beam–spring model were larger than those of the shell–spring model and field measurement results. The calculated results of the shell–spring model are close to the measured values in the field, indicating that the shell–spring model truly reflects the actual deformation of the shield segment. The shell–spring model was used to calculate the segment ring deformation of the shield tunnel model test, and the calculated value agrees with the test value, which further verifies the accuracy and reliability of the shell–spring model. Therefore, it is more reasonable to use the shell–spring model to calculate the mechanical response of the segment structure. The shell–spring model should be selected for the mechanical response of the shield segment compared to the beam–spring model;
- (4)
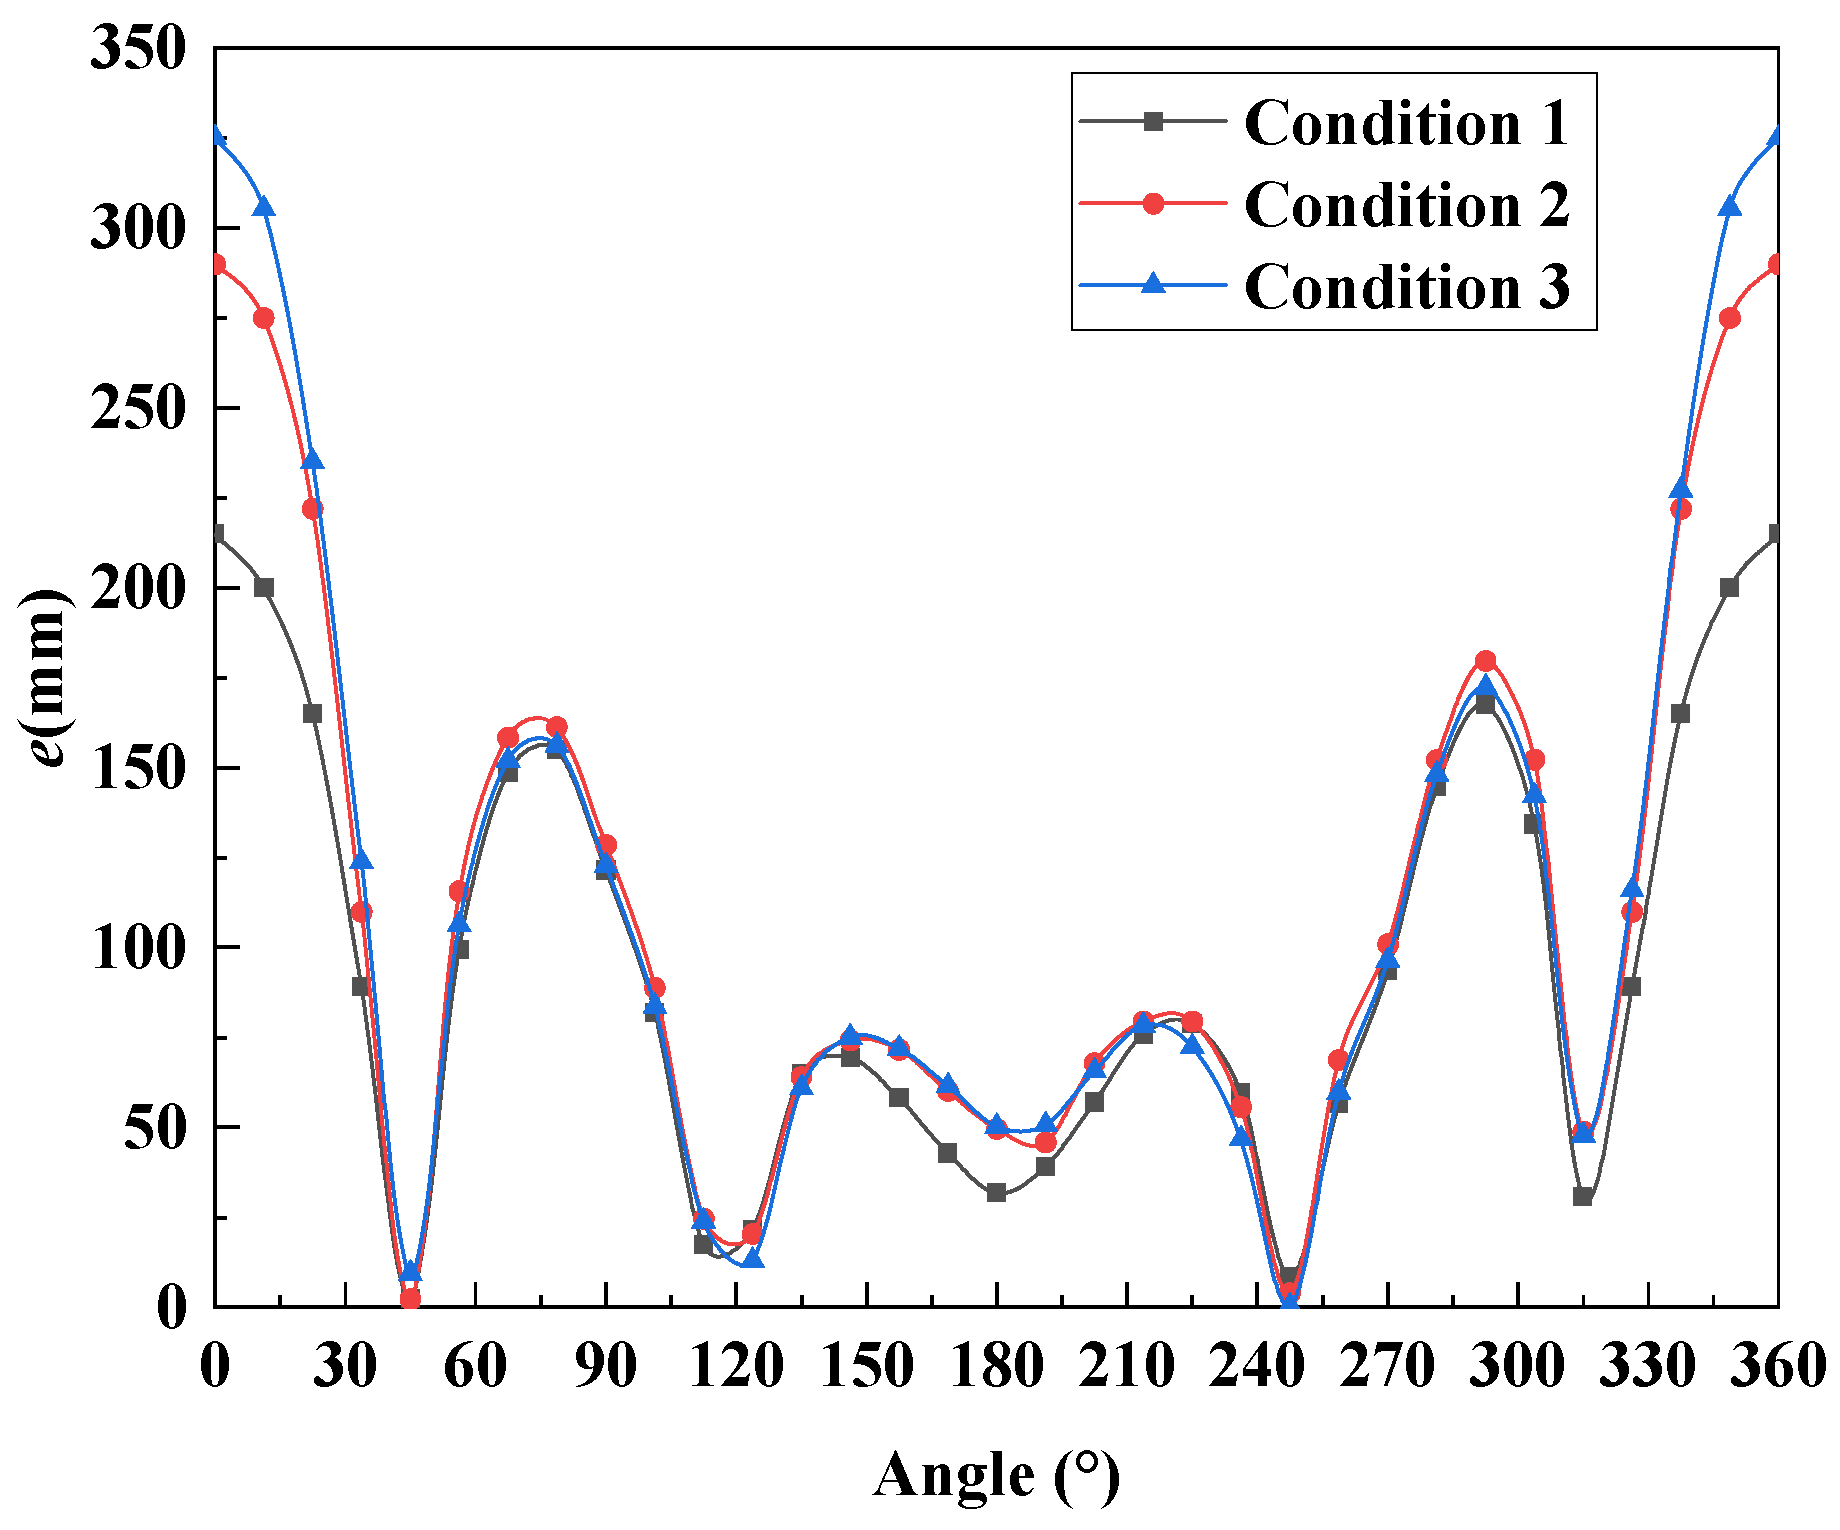
- Based on the conclusion (3), the shell–spring model is used to evaluate the safety of the shield segment. According to the eccentricity calculated using the shell–spring model, the most unfavorable normal section of the shield tunnel is located at the top of the tunnel. Therefore, under surcharge loading, the monitoring of the displacement at the top of the shield tunnel should be strengthened. When the displacement changes too much, the steel ring support is adopted in time to ensure the safety of the tunnel structure. With an increase in surcharge loading, the safety of the shield tunnel decreases gradually. Under the tunnel burial depth and stratum conditions described in this paper, the height of the piled soil above the shield tunnel should be controlled below 10 m. Surcharge loading above the shield tunnel should be reasonably controlled to meet the requirements of the normal use of a shield segment.
Author Contributions
Funding
Institutional Review Board Statement
Informed Consent Statement
Data Availability Statement
Acknowledgments
Conflicts of Interest
References
- Fraldi, M.; Cavuoto, R.; Cutolo, A.; Guarracino, F. Stability of tunnels according to depth and variability of rock mass parameters. Int. J. Rock Mech. Min. Sci. 2019, 119, 222–229. [Google Scholar] [CrossRef]
- Park, D.; Michalowski, R. Three-dimensional roof collapse analysis in circular tunnels in rock. Int. J. Rock Mech. Min. Sci. 2020, 128, 104275. [Google Scholar] [CrossRef]
- Kang, K.; Lee, S.; Song, K.; Liu, L.; Motamedi, S. Performance-Based Evaluation of a Double-Deck Tunnel and Design Optimization. Sustainability 2019, 11, 201. [Google Scholar] [CrossRef]
- Zhang, J.; Duan, X.; Zhang, D.; Zhai, W.; Huang, H. Probabilistic performance assessment of shield tunnels subjected to accidental surcharges. Struct. Infrastruct. Eng. 2019, 15, 1500–1509. [Google Scholar] [CrossRef]
- Zeng, G.; Wang, H.; Jiang, M. Analytical solutions of noncircular tunnels in viscoelastic semi-infinite ground subjected to surcharge loadings. Appl. Math. Model. 2022, 102, 492–510. [Google Scholar] [CrossRef]
- Wang, H.; Chen, X.; Jiang, M.; Song, F.; Wu, L. The analytical predictions on displacement and stress around shallow tunnels subjected to surcharge loadings. Tunn. Undergr. Space Technol. 2018, 71, 403–427. [Google Scholar] [CrossRef]
- Zhang, M.; Zhou, S.; Huang, D.; Wang, X.; Liu, H. Analysis of influence of surface surcharge on subway shield tunnel under. Rock Soil Mech. 2016, 37, 2271–2278. [Google Scholar]
- Zhang, R.; Xiao, Y.; Zhao, M.; Zhao, H. Stability of dual circular tunnels in a rock mass subjected to surcharge loading. Comput. Geotech. 2019, 108, 257–268. [Google Scholar] [CrossRef]
- Huang, Z.; Zhang, H.; Fu, H.; Ma, S.; Liu, Y. Deformation Response Induced by Surcharge Loading above Shallow Shield Tunnels in Soft Soil. KSCE J. Civ. Eng. 2020, 24, 2533–2545. [Google Scholar] [CrossRef]
- Zhang, J.; Huang, H.; Zhang, D.; Zhou, M.; Tang, C.; Liu, D. Effect of ground surface surcharge on deformational performance of tunnel in spatially variable soil. Comput. Geotech. 2021, 136, 104229. [Google Scholar] [CrossRef]
- Huang, H.; Shao, H.; Zhang, D.; Wang, F. Deformational responses of operated shield tunnel to extreme surcharge: A case study. Struct. Infrastruct. Eng. 2017, 13, 345–360. [Google Scholar] [CrossRef]
- Liang, R.; Cao, S.; Xiang, L.; Kang, C.; Chen, F.; Li, Z.; Ke, Z.; Cuo, Y. Experimental investigation on longitudinal mechanical mechanism of shield tunnels subjected to ground surface surcharge. Chin. J. Rock Mech. Eng. 2023, 42, 736–747. [Google Scholar]
- Zhang, J.; Huang, H.; Zhang, D.; Phoon, K. Experimental study of the coupling effect on segmental shield tunnel lining under surcharge loading and excavation unloading. Tunn. Undergr. Space Technol. 2023, 140, 105199. [Google Scholar] [CrossRef]
- Huang, F.; Wu, C.; Jang, B.A.; Hong, Y.; Guo, N.; Guo, W. Instability mechanism of shallow tunnel in soft rock subjected to surcharge loads. Tunn. Undergr. Space Technol. 2020, 99, 103350. [Google Scholar] [CrossRef]
- Wei, G.; Huang, S.; Feng, F.; Zhou, X.; Wang, X. Full-Scale Experimental Study on the Effect of Ground Surcharge on the Stress and Deformation of Shield Tunnels. Int. J. Civ. Eng. 2023, 21, 1403–1422. [Google Scholar] [CrossRef]
- Molins, C.; Arnau, O. Experimental and analytical study of the structural response of segmental tunnel linings based on an in situ loading test. Part 1: Test configuration and execution. Tunn. Undergr. Space Technol. 2011, 26, 764–777. [Google Scholar] [CrossRef]
- Feng, G.; Chen, Q.; Xu, C.; Wan, P.; Sun, F.; Li, Y.; Sun, Z. Improved Theoretical Solutions for Estimating the Tunnel Response Induced by Overlying Excavation. Sustainability 2023, 15, 2589. [Google Scholar] [CrossRef]
- Chaipanna, P.; Jongpradist, P. 3D response analysis of a shield tunnel segmental lining during construction and a parametric study using the ground-spring model. Tunn. Undergr. Space Technol. 2019, 90, 369–382. [Google Scholar] [CrossRef]
- Chen, R.-P.; Chen, S.; Wu, H.-N.; Liu, Y.; Meng, F.-Y. Investigation on deformation behavior and failure mechanism of a segmental ring in shield tunnels based on elaborate numerical simulation. Eng. Fail. Anal. 2020, 117, 104960. [Google Scholar] [CrossRef]
- Jiang, Y.; Yang, G.; Chen, F.; Xu, C.; Zhang, Y. Force determination and monitoring feedback analysis of typical sections of lining structure of cross-sea shield tunnel under high head in Zhanjiang bay. Rock Soil Mech. 2018, 39, 275–286. [Google Scholar]
- Arnau, O.C.; Molins, C. Experimental and analytical study of the structural response of segmental tunnel linings based on an in situ loading test. Part 2: Numerical simulation. Tunn. Undergr. Space Technol. 2011, 26, 778–788. [Google Scholar] [CrossRef]
- Rashiddel, A.; Hajihassani, M.; Kharghani, M.; Valizadeh, H.; Rahmannejad, R.; Dias, D. Numerical analysis of segmental tunnel linings—Use of the beam-spring and solid-interface methods. Geomech. Eng. 2022, 29, 471–486. [Google Scholar] [CrossRef]
- Yang, F.; Liu, G.; Wang, Y.; Yu, S. Numerical Investigation of the Segmental Lining Performance for a Shield Tunnel. KSCE J. Civ. Eng. 2022, 26, 2443–2455. [Google Scholar] [CrossRef]
- Huang, D.; Jiang, H.; Luo, W.; Xiong, H.; Tang, B.; Xu, J. Algorithm for an Effective Ratio of the Transverse Bending Rigidity Based on the Segment Joint Bending Stiffness. Appl. Sci. 2022, 12, 1901. [Google Scholar] [CrossRef]
- Zhu, H.; Zhou, L.; Zhu, J. Beam-spring generalized model for segmental lining and simulation of its nonlinear rotation. Chin. J. Geotech. Eng. 2019, 41, 1581–1590. [Google Scholar]
- Zhu, W.; Huang, Z.; Liang, J. Studies on shell-spring design model for segment of shield tunnels. Chin. J. Geotech. Eng. 2006, 28, 940–947. [Google Scholar]
- Pham, A.; Sugimoto, M. The Effects of Tangential Ground-Lining Interaction on Segmental Lining Behavior Using the Beam-Spring Model. Appl. Sci. 2020, 10, 1084. [Google Scholar] [CrossRef]
- Sun, J.; Guo, H. Shell-spring Calculation Model for Segment Lining of Shield Tunnels. Chin. J. Undergr. Space Eng. 2019, 15, 1048–1054. [Google Scholar]
- Wen, H.; Tang, B.; Xu, Z.Z.; Zhang, K.J.; Zeng, Y.W. The Sensitivity Analysis of Beam-Spring Model for Shield Tunnel Segment. Appl. Mech. Mater. 2013, 256–259, 1263–1269. [Google Scholar] [CrossRef]
- Liu, F.; Ding, W.; Gong, Y.; Wei, Y. Three Dimensional Numerical Simulation of Shell-Joint Model for Open Caisson Precast Assembly Structure. Tunn. Constr. 2018, 38, 190–201. [Google Scholar]
- Kim, J.; Kim, M.; Jung, S. Two-dimensional numerical tunnel model using a Winkler-based beam element and its application into tunnel monitoring systems. Clust. Comput. 2015, 18, 707–719. [Google Scholar] [CrossRef]
- Saito, J.; Asakura, T.; Tamura, T. Development of the Stability Analysis of Tunnel Lining by Means of Beam-spring Model and Discrete Element Method. J. Tunn. Eng. JSCE 2008, 18, 91–98. [Google Scholar]
- Li, Z.; Soga, K.; Wang, F.; Wright, P.; Tsuno, K. Behaviour of cast-iron tunnel segmental joint from the 3D FE analyses and development of a new bolt-spring model. Tunn. Undergr. Space Technol. 2014, 41, 176–192. [Google Scholar] [CrossRef]
- Zhou, H.; Bu, C.; Jiang, M. Study on Mechanical Behavior of Lining Segment of Shell-matrix-spring Model. Chin. J. Undergr. Space Eng. 2016, 12, 640–645. [Google Scholar]
- Guan, Z.; Deng, T.; Wang, G.; Jiang, Y. Studies on the key parameters in segmental lining design. J. Rock Mech. Geotech. Eng. 2015, 7, 674–683. [Google Scholar] [CrossRef]
- Vitali, O.P.; Celestino, T.B.; Bobet, A. 3D finite element modelling optimization for deep tunnels with material nonlinearity. Undergr. Space 2017, 3, 125–139. [Google Scholar] [CrossRef]
- Wang, F.; Huang, H.; Soga, K.; Li, Z. 3D modelling of concrete tunnel segmental joints and the development of a new bolt-spring model. Tunn. Undergr. Space Technol. 2021, 110, 103835. [Google Scholar] [CrossRef]
- Do, N.; Dias, D.; Oreste, P.; Djeran-Maigre, I. 2D numerical investigation of segmental tunnel lining behavior. Tunn. Undergr. Space Technol. 2013, 37, 115–127. [Google Scholar] [CrossRef]
- Zheng, J.; He, S.; Li, Y.; He, J.; He, J. Longitudinal Deformation of Deep Shield Tunnels Caused by Upper Load Reduction. Materials 2021, 14, 3629. [Google Scholar] [CrossRef]
- Li, S.; Li, P.; Zhang, M. Analysis of additional stress for a curved shield tunnel. Tunn. Undergr. Space Technol. 2021, 107, 103675. [Google Scholar] [CrossRef]
- Sugimoto, M.; Chen, J.; Sramoon, A. Frame structure analysis model of tunnel lining using nonlinear ground reaction curve. Tunn. Undergr. Space Technol. 2019, 94, 103135. [Google Scholar] [CrossRef]
- Teachavorasinskun, S.; Chub-uppakarn, T. Influence of segmental joints on tunnel lining. Tunn. Undergr. Space Technol. 2010, 25, 490–494. [Google Scholar] [CrossRef]
- Gong, C.; Ding, W.; Mosalam, K.M.; Günay, S.; Soga, K. Comparison of the structural behavior of reinforced concrete and steel fiber reinforced concrete tunnel segmental joints. Tunn. Undergr. Space Technol. 2017, 68, 38–57. [Google Scholar] [CrossRef]
- Wang, F.; Shi, J.; Huang, H.; Zhang, D. Modified analytical solution of shield tunnel lining considering nonlinear bending stiffness of longitudinal joint. Tunn. Undergr. Space Technol. 2020, 106, 103625. [Google Scholar] [CrossRef]
- Ai, Q.; Yuan, Y.; Mahadevan, S.; Jiang, X. Probabilistic degradation modelling of circular tunnels assembled from segmental linings. Struct. Concr. 2016, 17, 257–273. [Google Scholar] [CrossRef]
- Xiao, Z.; Wang, J. A Three-Dimensional Model of Shield Tunnel considering Interaction of Soil and Lining. Math. Probl. Eng. 2022, 2022, 4245384. [Google Scholar] [CrossRef]
- Chen, K.H.; Peng, F.L. An improved method to calculate the vertical earth pressure for deep shield tunnel in Shanghai soil layers. Tunn. Undergr. Space Technol. 2018, 75, 43–66. [Google Scholar] [CrossRef]
- Zhou, H.; Li, L.; Chen, T. Experiments and calculation method for bearing capacity of the lining segment of metro shield tunneling. J. Shandong Univ. Eng. Sci. 2010, 40, 84–87. [Google Scholar]
- GB/T 22082-2017; Reinforced Concrete Segments. National Standard of People’s Republic of China: Beijing, China, 2017.
- Li, H.; Zhou, A.; Wu, Y.; Deng, L.; Zhu, K.; Lu, F. Research and Development of Self-Waterproofing Concrete for Tunnel Lining Structure and Its Impermeability and Crack Resistance Characteristics. Materials 2023, 16, 5557. [Google Scholar] [CrossRef]


| Name of Soil Layer | Soil Thickness (m) | Unit Weight (kN/m3) | Internal Friction Angle (°) | Cohesion (kPa) | Poisson Ratio |
|---|---|---|---|---|---|
| ⑧5 Clay silt | 5.0 | 19.3 | 15 | 23.2 | 0.34 |
| ⑧11 Clay silt | 4.8 | 19.5 | 16 | 18.1 | 0.38 |
| ⑧12 Silty clay | 7.2 | 19.6 | 16 | 18.2 | 0.38 |
| ⑧13 Fine sand | 11.0 | 19.8 | 18 | 18.6 | 0.38 |
| ⑧14 Clay silt | 19.0 | 19.8 | 22 | 24.3 | 0.35 |
| Condition No. | Ground Heap Soil Height (m) | Vertical Earth Pressure (kPa) | Top Lateral Earth Pressure (kPa) | Bottom Lateral Earth Pressure (kPa) |
|---|---|---|---|---|
| 1 | 0 | 258.9 | 116.5 | 167.1 |
| 2 | 5 | 305.7 | 137.6 | 188.1 |
| 3 | 10 | 352.5 | 158.6 | 209.2 |
| kx | ky | kz | krz | |
|---|---|---|---|---|
| Axial tension and compression | Radial shear | Tangential shear | Positive rotation | Negative rotation |
| (108 kN/m) | (106 kN/m) | (106 kN/m) | (105 kN·m/rad) | (105 kN·m/rad) |
| 8.25 | 3.5 | 3.5 | 3.0 | 2.0 |
| Segment Ring | Condition No. | Horizontal Convergence Value (mm) | Vertical Convergence Value (mm) | Ellipticity (‰) |
|---|---|---|---|---|
| 383rd | Measured value | 13.7 | 18.8 | 5.24 |
| Shell–spring model | 13.8 | 19.0 | 5.29 | |
| Beam–spring model | 14.8 | 20.2 | 5.65 | |
| 385th | Measured value | 13.8 | 19.0 | 5.29 |
| Shell–spring model | 14.1 | 19.2 | 5.37 | |
| Beam–spring model | 15.1 | 20.3 | 5.71 | |
| 387th | Measured value | 13.6 | 18.6 | 5.19 |
| Shell–spring model | 13.8 | 18.7 | 5.24 | |
| Beam–spring model | 15.0 | 20.2 | 5.68 |
| Condition No. | Bending Moment (kN·m) | Axial Force (kN) | Ultimate Bearing Capacity (kN) |
|---|---|---|---|
| 1 | 139 | 650 | 2220 |
| 2 | 215 | 745 | 1991 |
| 3 | 268 | 825 | 1715 |
| Safety Grade | Follow-Up Use Requirements | Service Condition |
|---|---|---|
| As | Normal | |
| Bs | Degeneration | |
| Cs | Pauperization | |
| Ds | Deterioration |
Disclaimer/Publisher’s Note: The statements, opinions and data contained in all publications are solely those of the individual author(s) and contributor(s) and not of MDPI and/or the editor(s). MDPI and/or the editor(s) disclaim responsibility for any injury to people or property resulting from any ideas, methods, instructions or products referred to in the content. |
© 2023 by the authors. Licensee MDPI, Basel, Switzerland. This article is an open access article distributed under the terms and conditions of the Creative Commons Attribution (CC BY) license (https://creativecommons.org/licenses/by/4.0/).
Share and Cite
Liu, X.; Jiang, Y.; Li, X.; Zang, Q.; Yue, J. Comparative Analysis and Safety Evaluation of Shield Segment Structure Model under Surcharge Loading. Materials 2023, 16, 6806. https://doi.org/10.3390/ma16206806
Liu X, Jiang Y, Li X, Zang Q, Yue J. Comparative Analysis and Safety Evaluation of Shield Segment Structure Model under Surcharge Loading. Materials. 2023; 16(20):6806. https://doi.org/10.3390/ma16206806
Chicago/Turabian StyleLiu, Xiaofeng, Yan Jiang, Xiaolong Li, Quansheng Zang, and Jinchao Yue. 2023. "Comparative Analysis and Safety Evaluation of Shield Segment Structure Model under Surcharge Loading" Materials 16, no. 20: 6806. https://doi.org/10.3390/ma16206806