
Determining the Role of Acicular Ferrite Carbides in Cleavage Fracture Crack Initiation for Two Medium Carbon Microalloyed Steels
 , , ,
, , ,
Abstract
:
1. Introduction
2. Materials and Methods
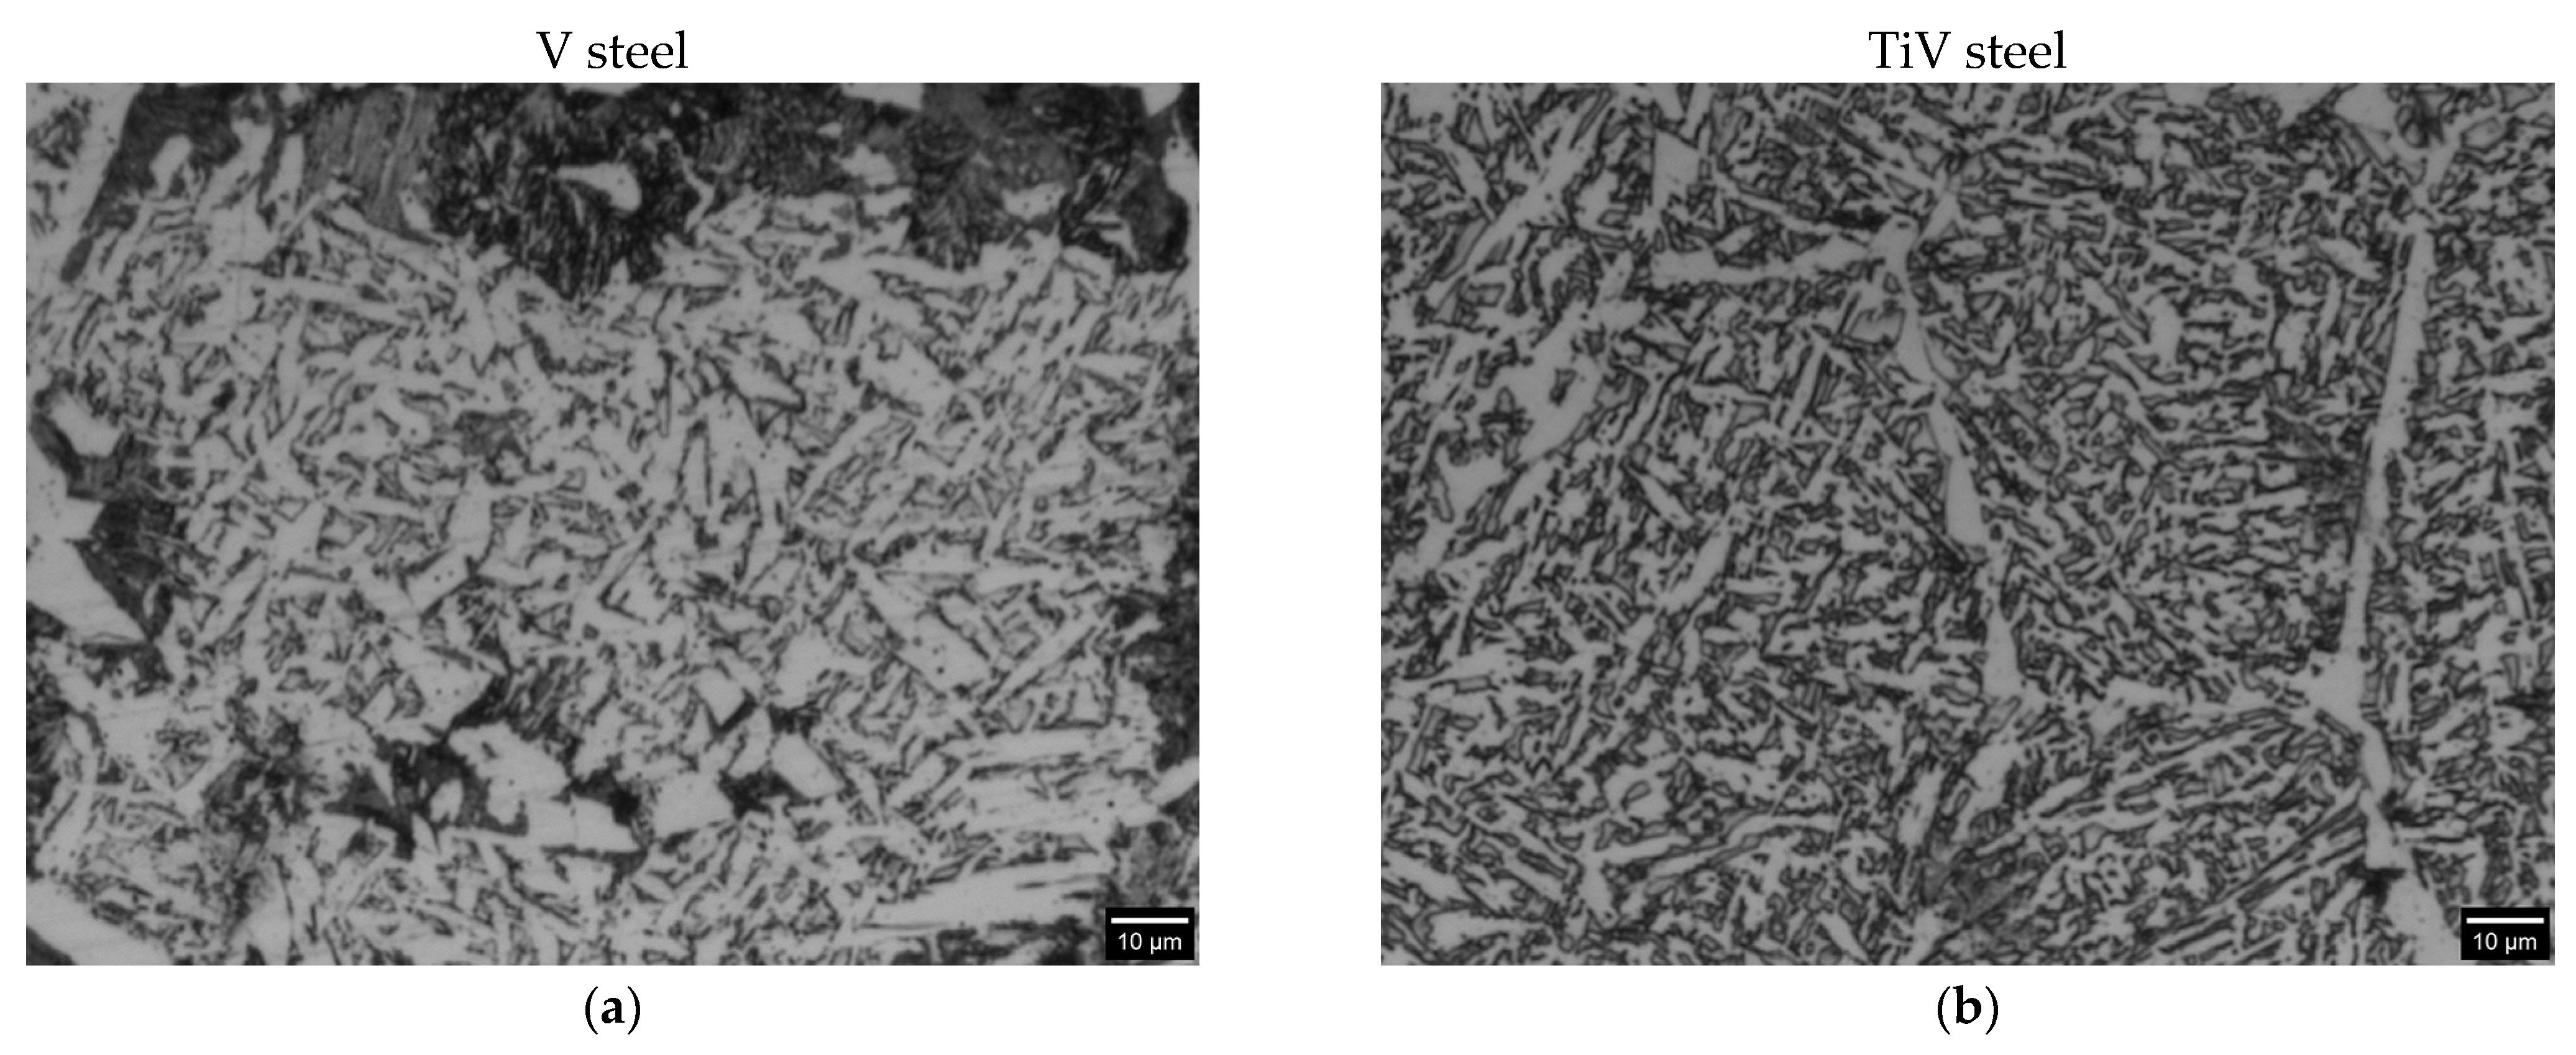
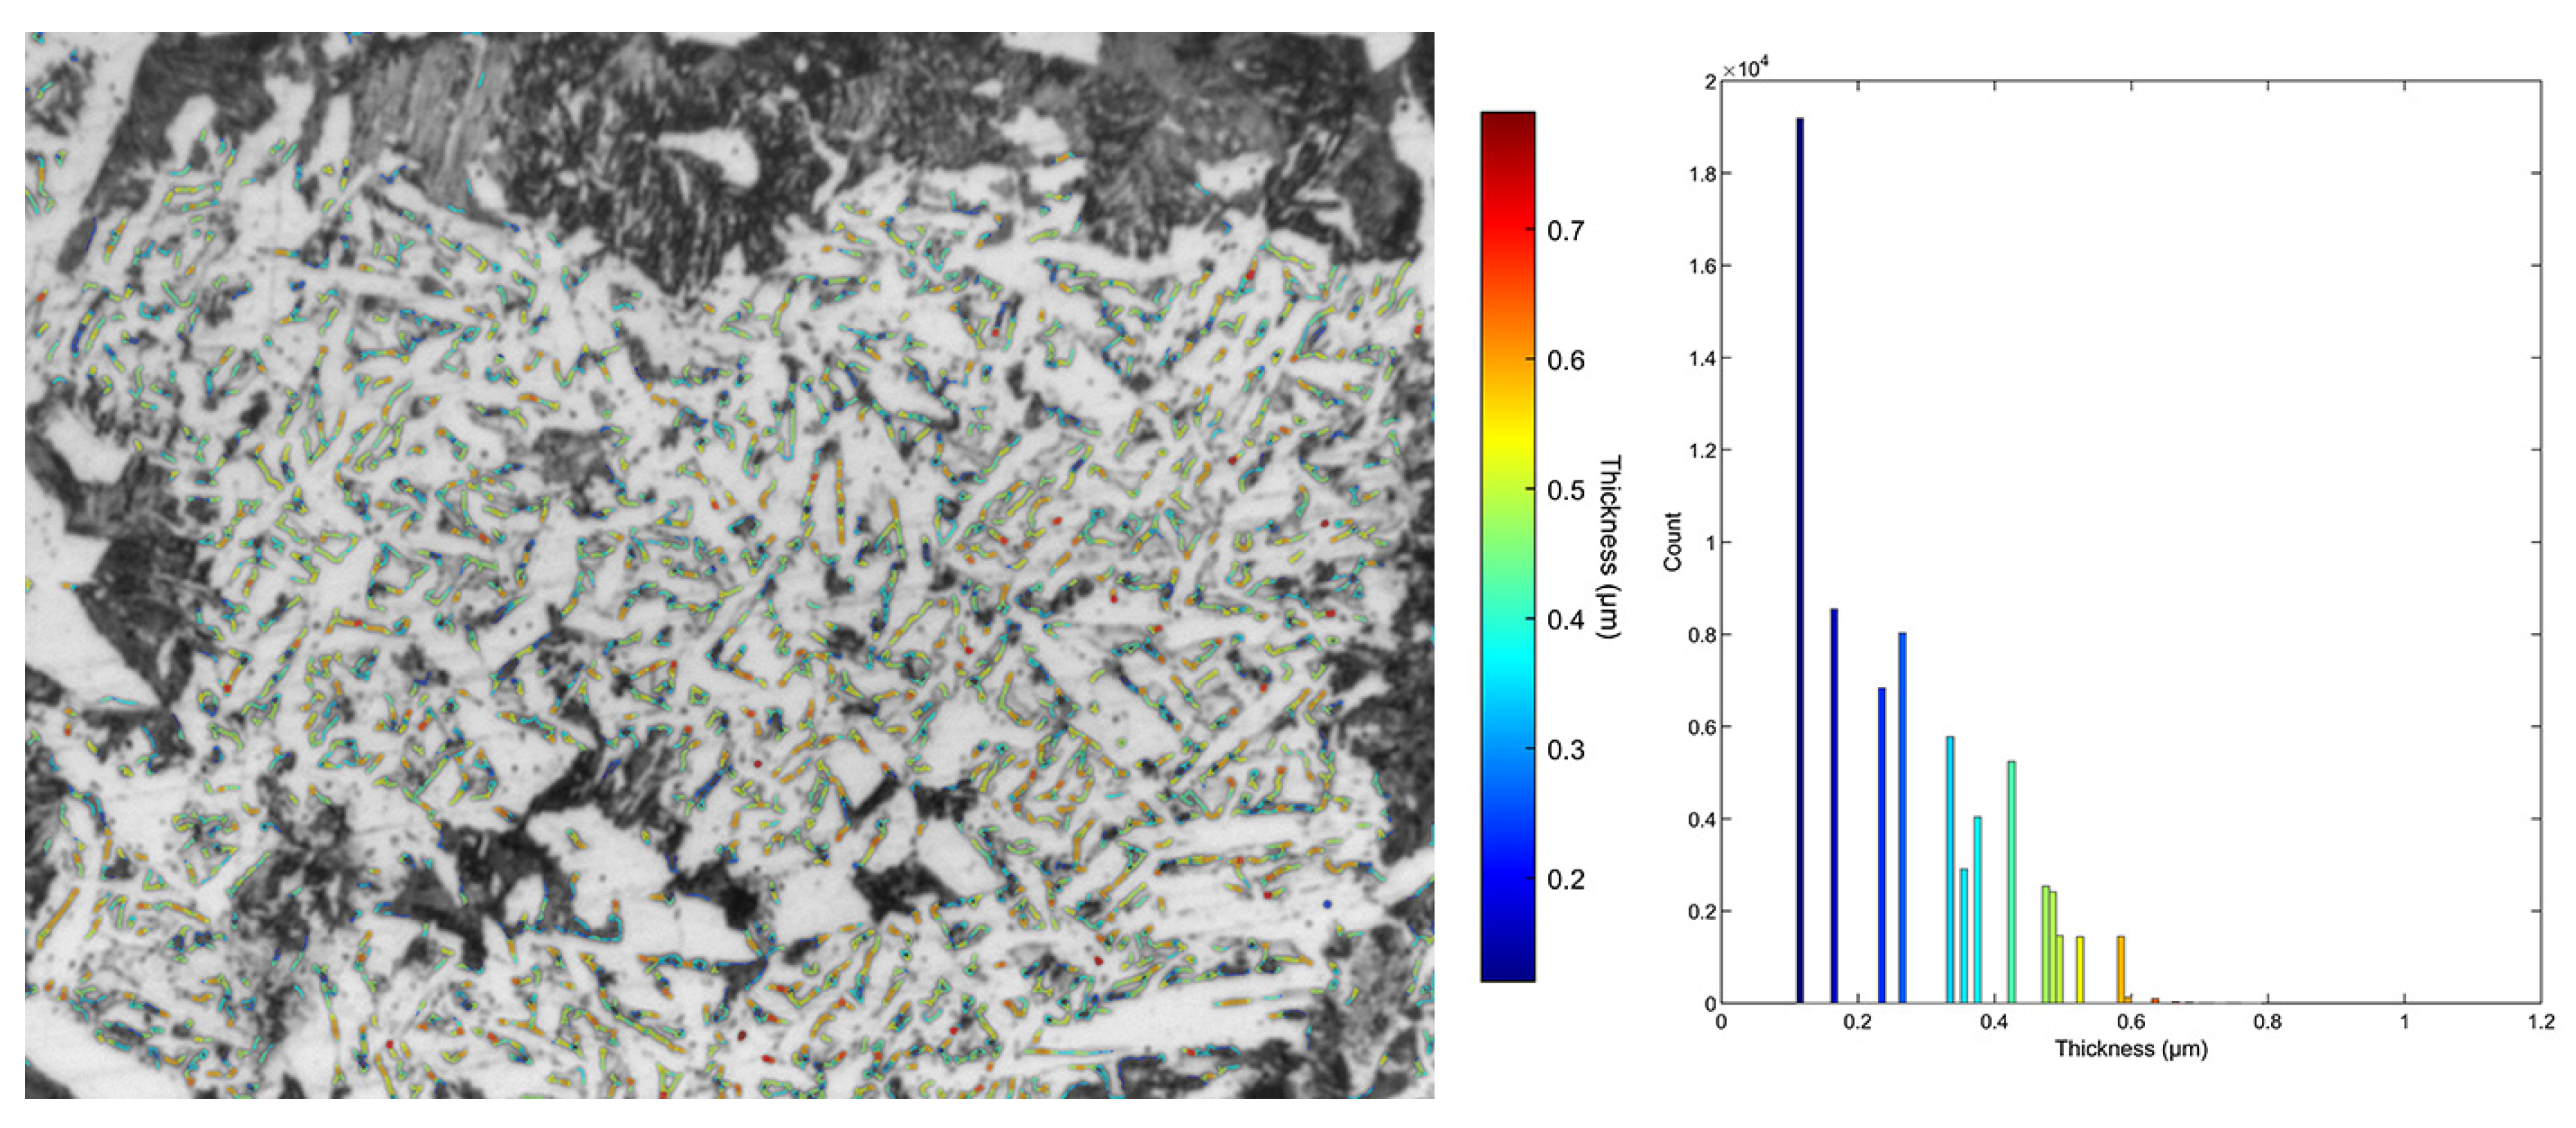
2.1. Image Analysis
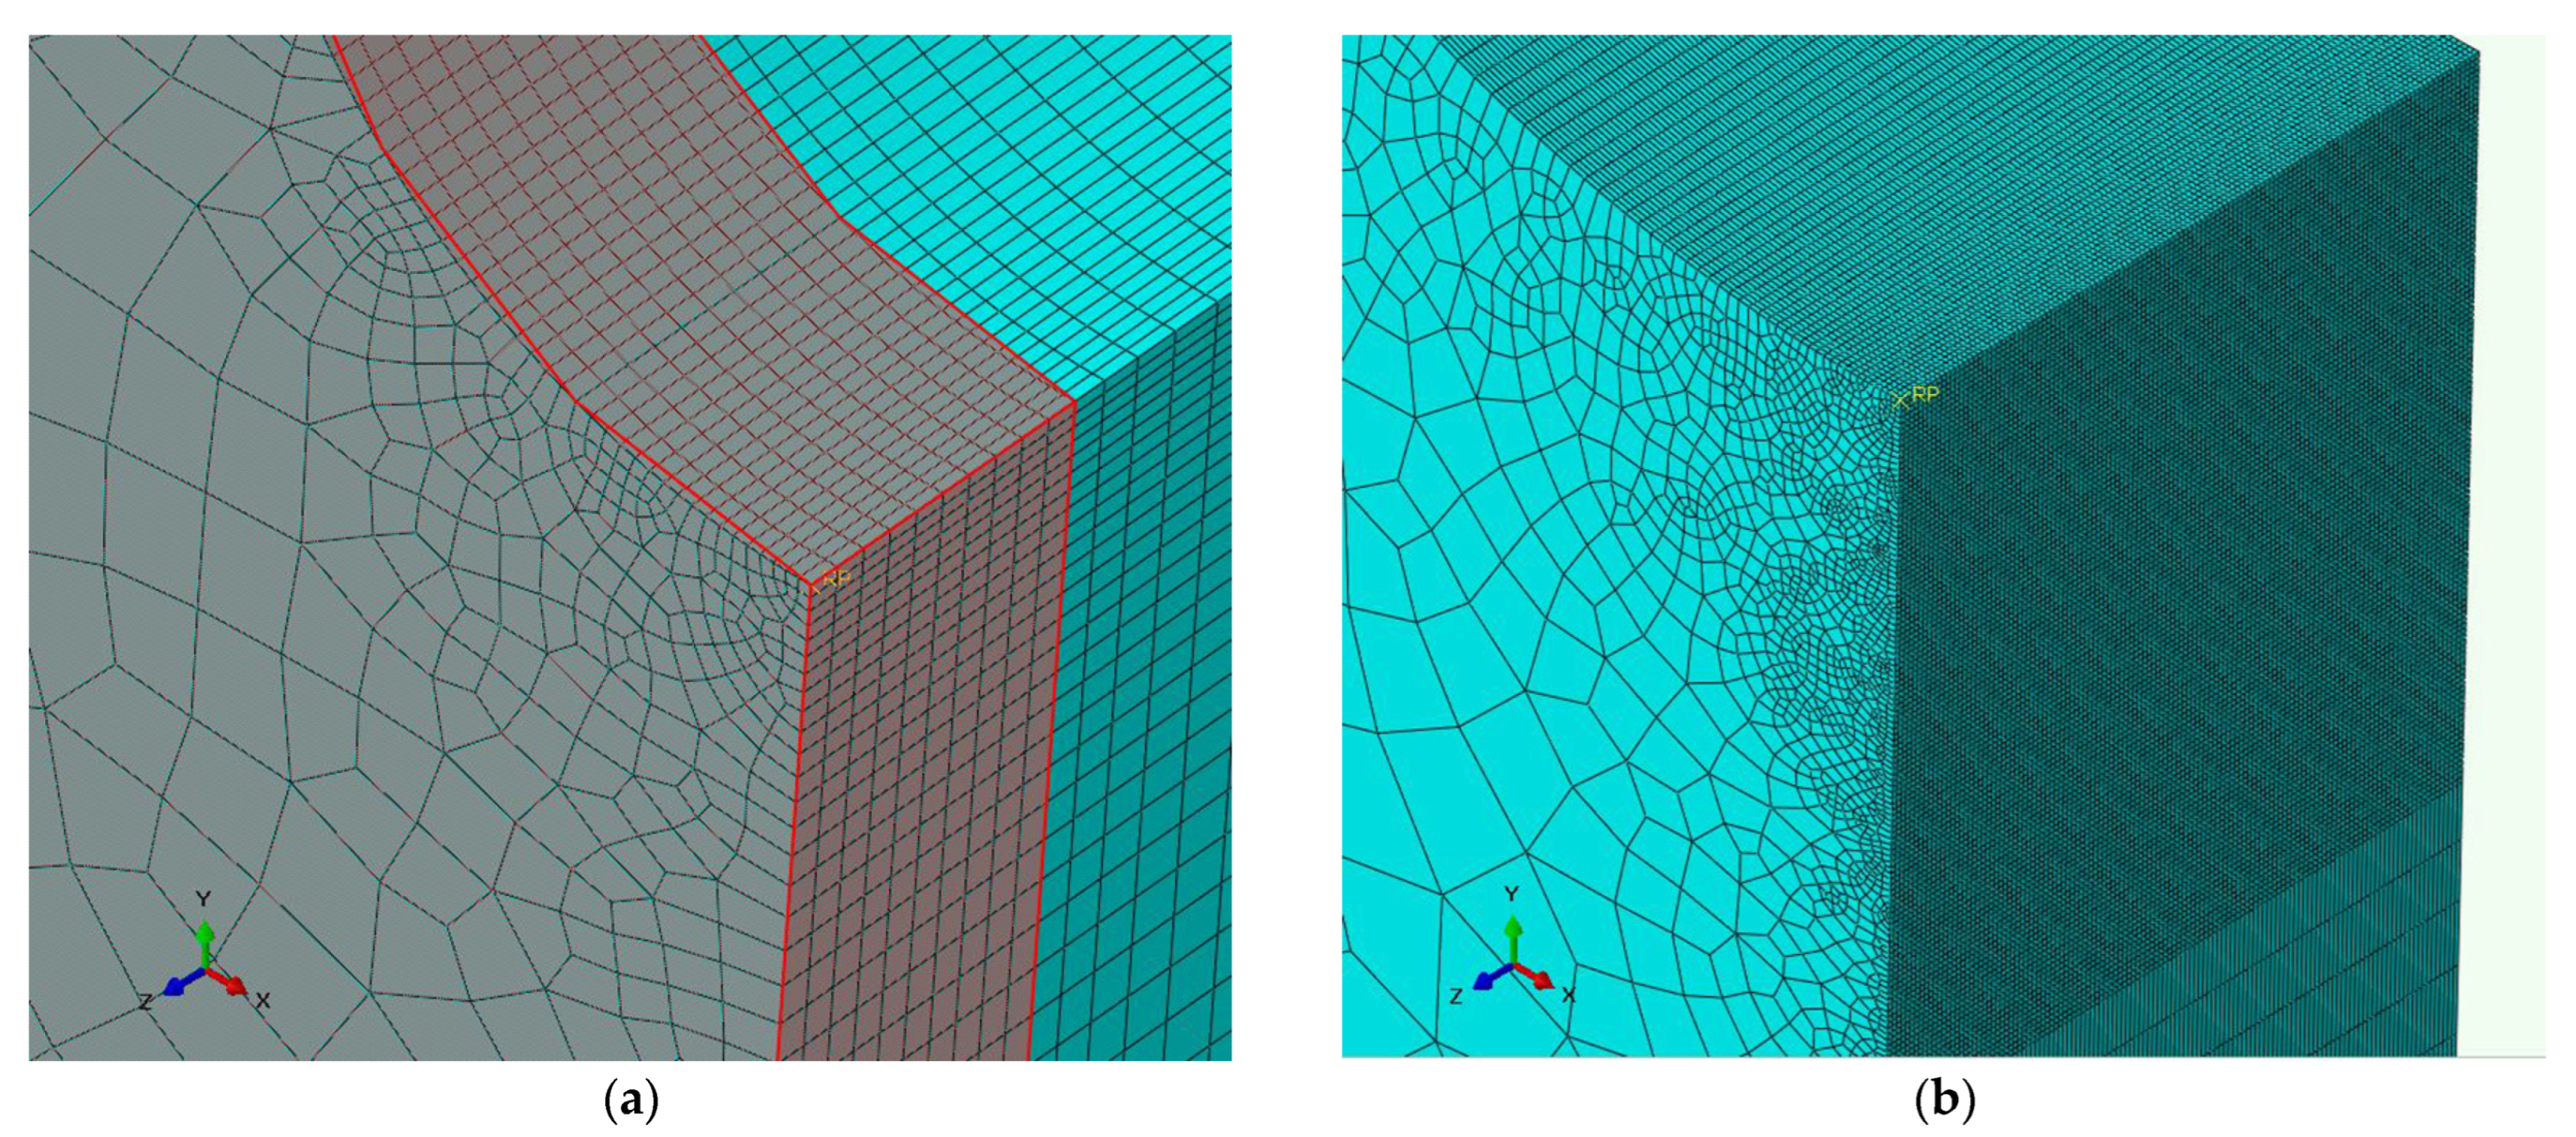
2.2. Finite Element Analysis
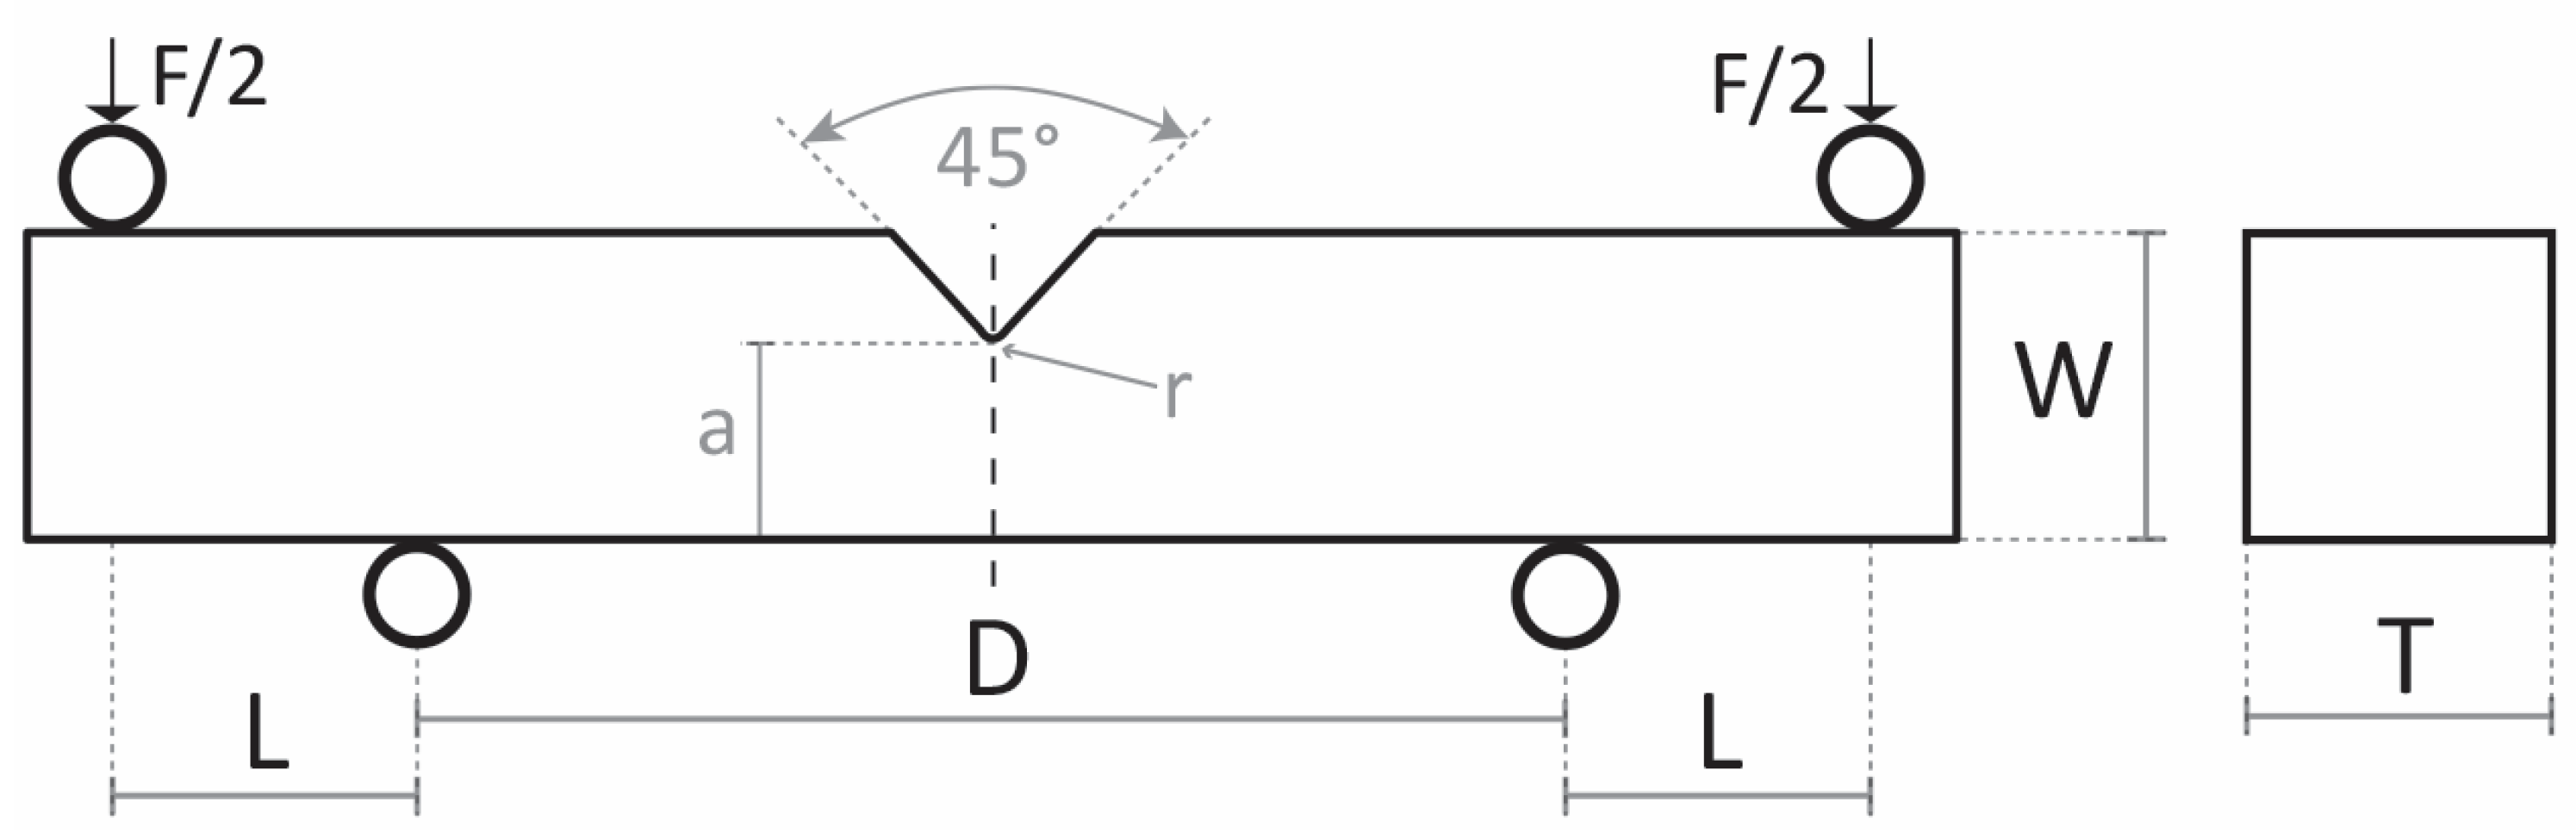
2.3. Cleavage Fracture Calculation
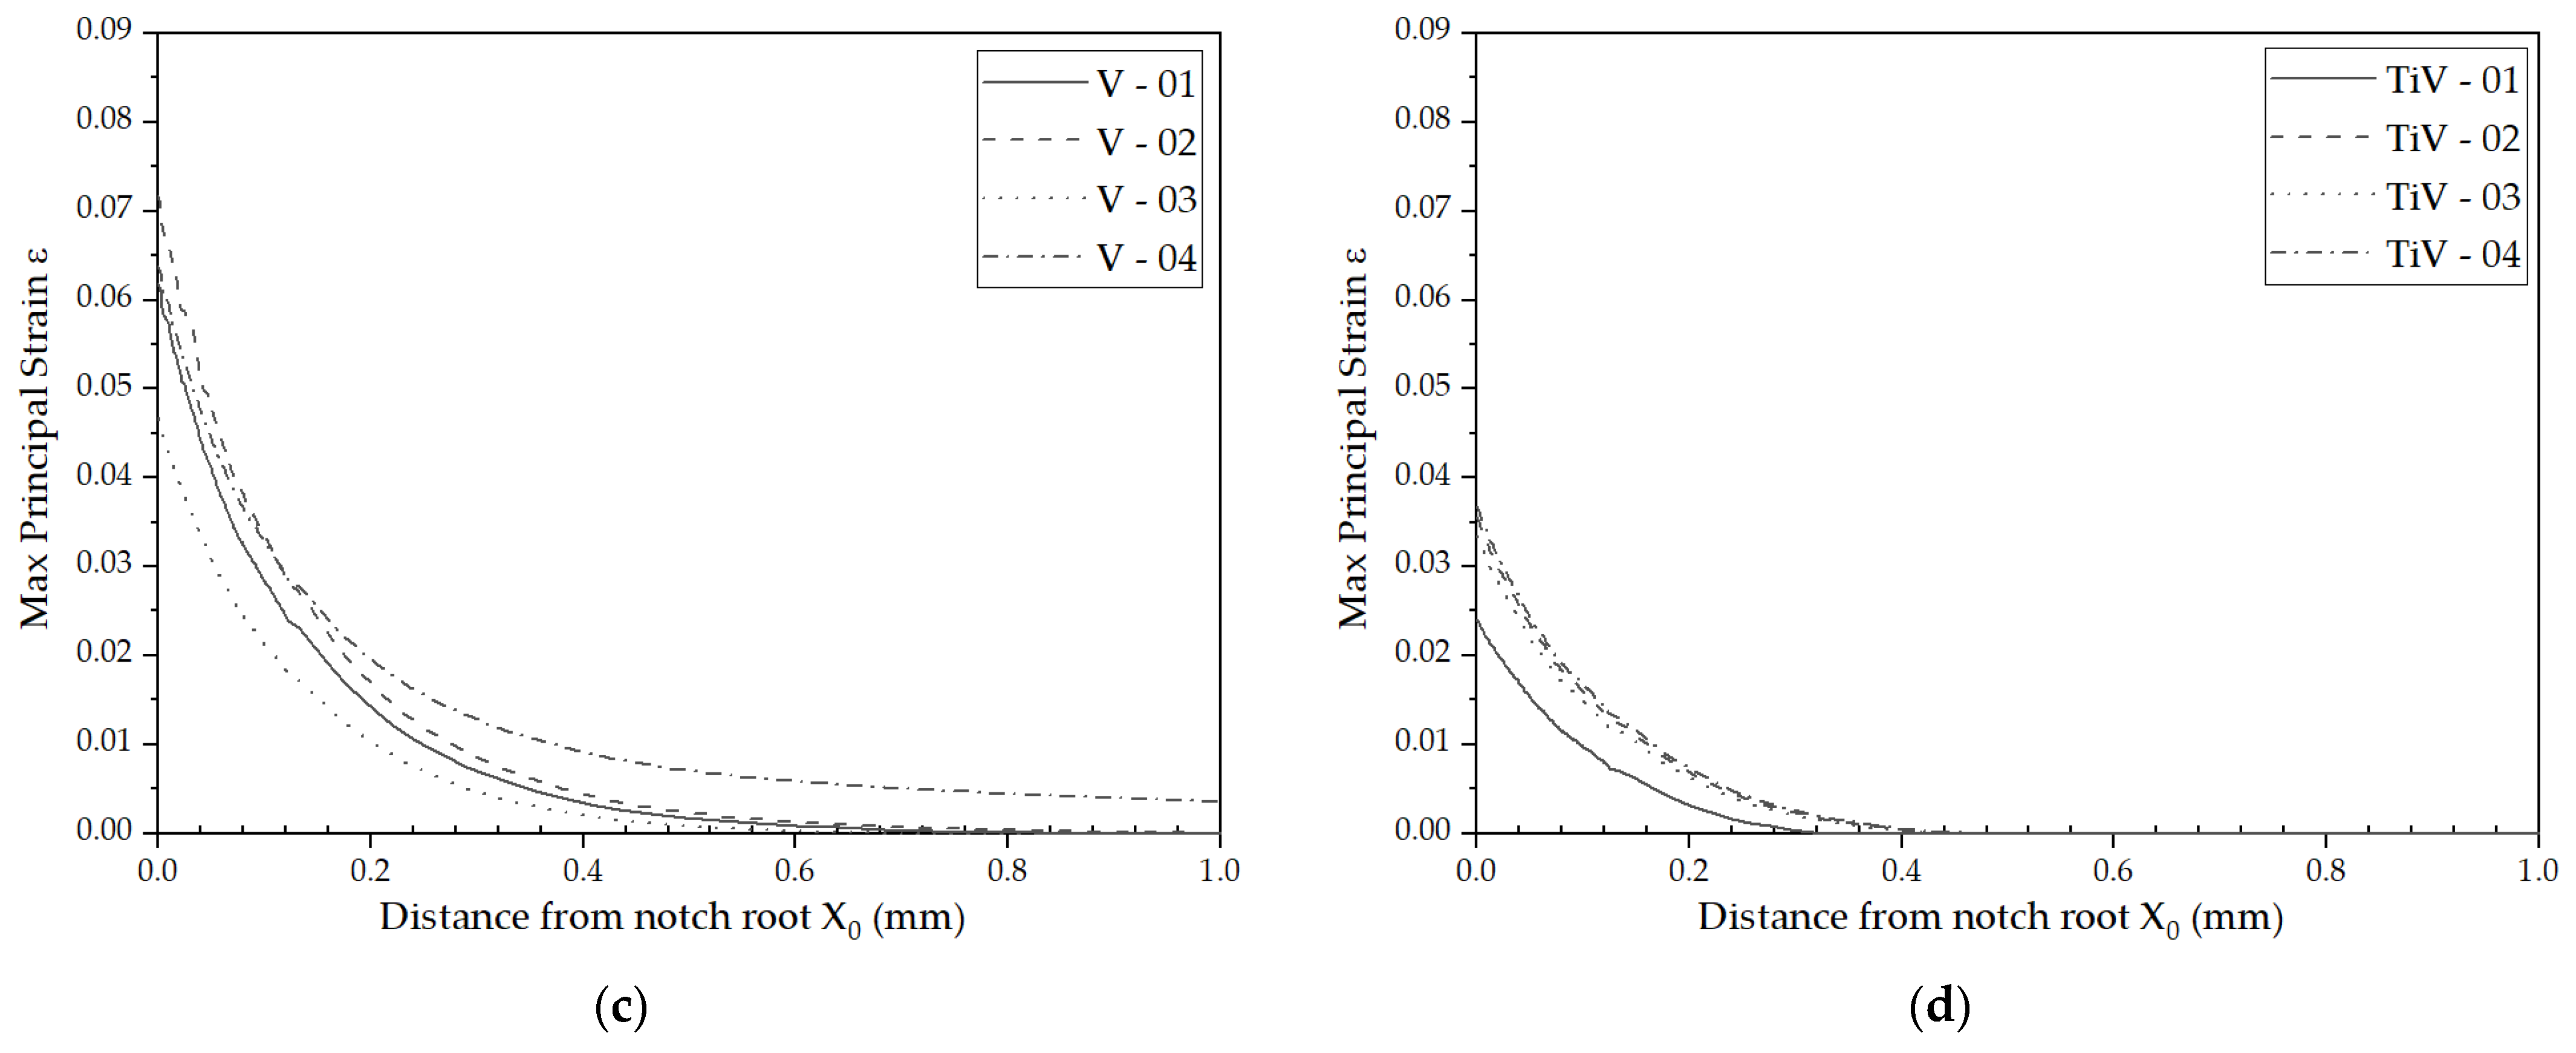
3. Results
4. Conclusions
- The fracture of pearlite nodules during plastic deformation at the notch root of the four-point bending specimen initiates cleavage fracture of air-cooled medium-carbon microalloyed steels with primarily acicular ferrite microstructure. The cleavage fracture initiation procedure in this example did not involve the fracturing of coarse second-phase particles or thick cementite plates within AF;
- Peak stress in front of the notch root is insufficient for the cleavage fracture initiation by fracture of coarse TiN particles in the microstructure consisting primarily of acicular ferrite due to its fine-grained structure with a high density of high-angle boundaries, as compared to the ferritic–pearlitic structures;
- The average maximal thickness of cementite plates placed at AF plate boundaries was 0.7984 µm and 0.9656 µm, for V and TiV steel, respectively. The corresponding stress values required for their fracture according to Griffith’s equation are 1970 MPa and 1791 MPa, respectively, which is well below the stress levels at the cleavage initiation sites near the notch root. Therefore, the fracture of coarse cementite plates is not responsible for the cleavage fracture initiation;
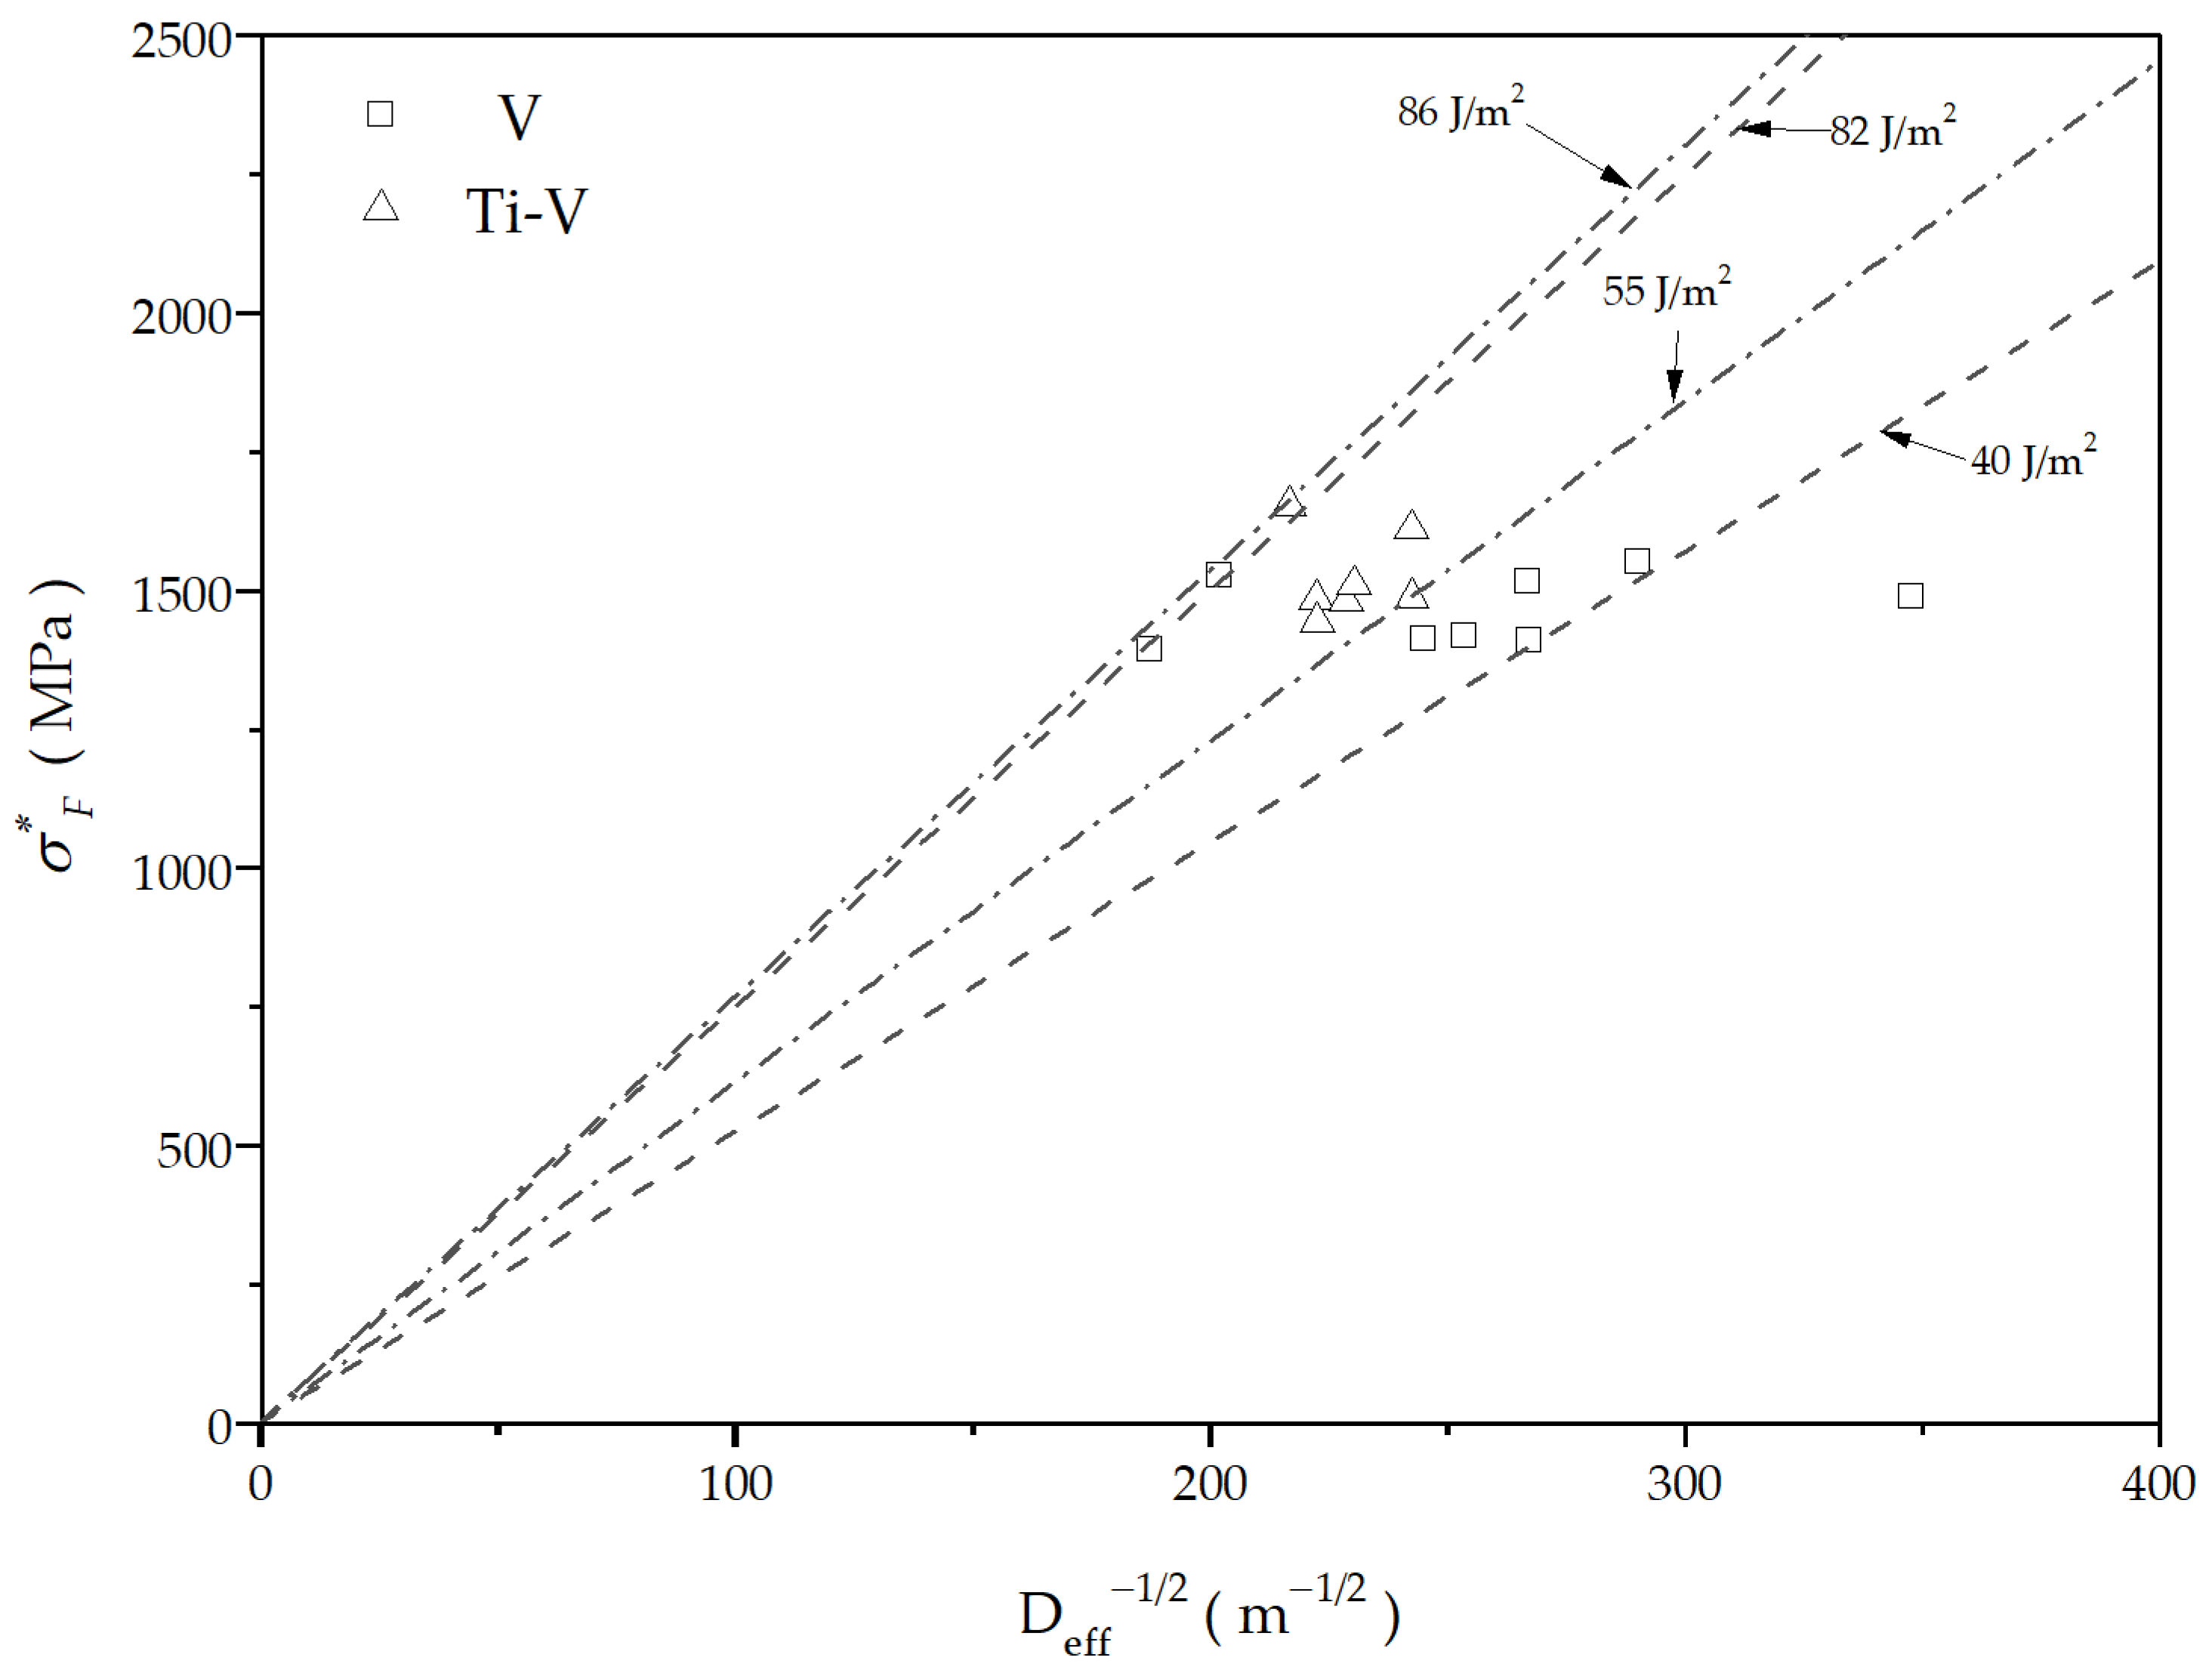
- Estimated values of the effective surface energy for the V steel ranges from 40 Jm−2 to 86 Jm−2, and for the TiV steel from 55 Jm−2 to 82 Jm−2. These values correspond to the energy required for cleavage crack propagation through the grain boundaries, and therefore reflect the effect of the interlocking structure of acicular ferrite;
- The critical cleavage fracture stress in V and TiV microalloyed medium carbon steels with predominantly AF structures corresponds to the stress for crack propagation through the matrix;
- The critical stage in the cleavage fracture process of continuously cooled V and TiV microalloyed medium carbon steels with predominantly AF structures, together with proeutectoid ferrite and pearlite, is the initial microcrack formation.
Author Contributions
Funding
Institutional Review Board Statement
Informed Consent Statement
Data Availability Statement
Conflicts of Interest
References
- Ishikavaa, F.; Takahashi, T. The Formation of Intragranular Steels for Hot-torging Plates in Medium-carbon and Its Effect on the Toughness. ISIJ Int. 1995, 35, 1128–1133. [Google Scholar] [CrossRef]
- Babu, S.S. The Mechanism of Acicular Ferrite in Weld Deposits. Curr. Opin. Solid State Mater. Sci. 2004, 8, 267–278. [Google Scholar] [CrossRef]
- He, K.; Edmonds, D.V. Formation of Acicular Ferrite and Influence of Vanadium Alloying. Mater. Sci. Technol. 2002, 18, 289–296. [Google Scholar] [CrossRef]
- Dong, J.; Liu, C.; Liu, Y.; Zhou, X.; Guo, Q.; Li, H. Isochronal Phase Transformation of Nb–V–Ti Microalloyed Ultra-high Strength Steel upon Cooling. Fusion Eng. Des. 2017, 125, 423–430. [Google Scholar] [CrossRef]
- Xiong, Z.; Liu, S.; Wang, X.; Shang, C.; Li, X.; Misra, R.D.K. The Contribution of Intragranular Acicular Ferrite Microstructural Constituent on Impact Toughness and Impeding Crack Initiation and Propagation in the Heat-Affected Zone (HAZ) of Low-Carbon Steels. Mater. Sci. Eng. A 2015, 636, 117–123. [Google Scholar] [CrossRef]
- Sacks, M.D.; Moss, R.L. Laser-Excited Acoustic Waves in Layered Media: Finite-Element Solution and Numerical Experiments. J. Comput. Phys. 1993, 104, 209–222. [Google Scholar] [CrossRef]
- Lee, K.H.; Bhadeshia, H.K.D.H. Measurement of the Non-linear Strain-dependent Properties of Acicular Ferrite in HSLA Steels. Acta Mater. 2003, 51, 1085–1098. [Google Scholar]
- Sarma, D.S.; Karasev, A.V.; Jönsson, P.G. On the role of non-metallic inclusions in the nucleation of acicular ferrite in steels. ISIJ Int. 2009, 49, 1063–1074. [Google Scholar] [CrossRef]
- Williamson, G.K.; Smallma, R.E., III. Dislocation Densities in Some Annealed and Cold-worked Metals from Measurements on the X-ray Debye-Scherrer Spectrum. Philos. Mag. 1956, 1, 34–46. [Google Scholar] [CrossRef]
- Smith, G.S.; Little, E.A.; Mills, M.J. The Deformation of Sub-structure in Some Copper Alloys. Philos. Mag. 1979, 39, 631–648. [Google Scholar]
- Zhang, H.; Bhadeshia, H.K.D.H. Acicular Ferrite Formation in Undercooled Austenite: Part II. Mechanical Stability. Acta Mater. 2000, 48, 3267–3276. [Google Scholar]
- Strang, G. Introduction to Linear Algebra, 5th ed.; Wellesley-Cambridge Press: Wellesley, MA, USA, 2016. [Google Scholar]
- Jiménez-Mena, N.; Reyes-Melo, M.E.; Gutiérrez-Salazar, J.G.; Rodríguez-Martínez, R. Acicular Ferrite Transformation and Microstructural Control in Low Carbon Steels. Metall. Mater. Trans. A 2018, 49, 2746–2755. [Google Scholar]
- Chen, L.; Xia, M.; Wang, J.; Li, Y.; Xie, R.; Rong, Y. Formation and Transformation Behavior of Acicular Ferrite in the Intercritical Heat-affected Zone of Ultra-low Carbon Bainitic Steels. J. Mater. Sci. 2019, 54, 7756–7771. [Google Scholar]
- Liu, Q.; Li, Z.; Chen, S.; Dong, H.; Li, Y.; Xie, Z. Acicular Ferrite Transformation Behavior in Low-carbon Bainitic Steels Treated with Thermo-mechanical Control Process. Mater. Sci. Eng. A 2019, 742, 81–91. [Google Scholar]
- Cao, W.; Yang, C.; Du, X.; Ren, Y. Modeling of Acicular Ferrite Precipitation Kinetics in Microalloyed Steels during Continuous Cooling. Mater. Sci. Eng. A 2014, 608, 46–54. [Google Scholar] [CrossRef]
- Liu, J.; Huang, F.; Wang, C.; Ding, H.; Liang, W.; Li, L. Evolution Behavior of Microstructure and Mechanical Properties during Austenite Decomposition of a Medium Carbon Nb-Ti Microalloyed Steel. Mater. Sci. Eng. A 2021, 821, 141450. [Google Scholar]
- Azushima, A.; Ohmori, Y.; Suzuki, K.; Itsumi, M. Effects of Microstructural Features on Toughness of Low Carbon Bainite. ISIJ Int. 1999, 39, 1253–1260. [Google Scholar]
- Hui, W.; Li, L.; Bai, B.; Gao, H.; Liu, Z.; Ma, J. Acicular Ferrite Formation Kinetics in a Medium Carbon Low Alloy Steel during Continuous Cooling Process. J. Mater. Eng. Perform. 2016, 25, 487–494. [Google Scholar] [CrossRef]
- Ni, T.; Zaccariotto, M.; Zhu, Q.; Galvanetto, U. Static solution of crack propagation problems in Peridynamics. Comput. Methods Appl. Mech. Eng. 2019, 346, 126–151. [Google Scholar] [CrossRef]
- Ni, T.; Pesavento, F.; Zaccariotto, M.; Galvanetto, U.; Zhu, Q.; Schrefler, B.A. Hybrid FEM and peridynamic simulation of hydraulic fracture propagation in saturated porous media. Comput. Methods Appl. Mech. Eng. 2020, 366, 113101. [Google Scholar] [CrossRef]
- Yang, H.; Yang, Y.; Li, X.; Zuo, M.; Li, C.; Wu, D. Microstructure Evolution and Mechanical Properties of Acicular Ferrite in Low Carbon Microalloyed Steel. Mater. Sci. Eng. A 2016, 674, 358–367. [Google Scholar] [CrossRef]
- Huang, X.; Yang, Y.; Yang, H.; Li, X.; Wu, D. Characteristics of Acicular Ferrite in Low Carbon Microalloyed Steel: Effect of Cooling Rate. Mater. Sci. Eng. A 2018, 729, 315–324. [Google Scholar] [CrossRef]
- Shibanuma, K.; Aihara, S.; Suzuki, K. Prediction model on cleavage fracture initiation in steels having ferrite–cementite microstructures–Part II: Model validation and discussions. Eng. Fract. Mech. 2016, 151, 181–202. [Google Scholar] [CrossRef]
- Teshima, T.; Kosaka, M.; Ushioda, K.; Koga, N.; Nakada, N. Local cementite cracking induced by heterogeneous plastic deformation in lamellar pearlite. Mater. Sci. Eng. A 2017, 679, 223–229. [Google Scholar] [CrossRef]
- Madariaga, I.; Gutierrez, I.; Bhadeshia, H. Acicular ferrite morphologies in a medium-carbon microalloyed steel. Metall. Mater. Trans. A 2001, 32, 2187–2197. [Google Scholar] [CrossRef]
- Linaza, M.A.; Romero, J.L.; Rodriguez-Ibabe, J.M.; Urcola, J.J. Influence of the microstructure on the ductile-brittle behavior of engineering steels containing brittle particles. In Mechanical Working and Steel Processing; Association for Iron & Steel Technology: Warrendale, PA, USA, 1995; pp. 483–494. [Google Scholar]
- Jovanović, G.; Glišić, D.; Dikić, S.; Radović, N.; Patarić, A. Cleavage Fracture of the Air Cooled Medium Carbon Microalloyed Forging Steels with Heterogeneous Microstructures. Materials 2022, 15, 1760. [Google Scholar] [CrossRef]
- Echeverría, A.; Rodriguez-Ibabe, J.M. The role of grain size in brittle particle induced fracture of steels. Mater. Sci. Eng. A 2003, 346, 149–158. [Google Scholar] [CrossRef]
- ASM Handbook Committee. ASM Handbook, Metallography and Micro Structures; American Society for Metals: Detroit, MI, USA, 1989; Volume 9. [Google Scholar]
- Sosa, J.M.; Kalluri, S.R.; Sturcken, A.N.; Gjersing, A.L.; Mayes, K.R.; Hoyt, W.D. Development and application of MIPAR™: A novel software package for two-and three-dimensional microstructural characterization. Integr. Mater. Manuf. 2014, 3, 123–140. [Google Scholar] [CrossRef]
- Griffiths, J.R.; Owen, D.R. An Elastic-Plastic Stress Analysis for a Notched Bar in Plane Strain Bending. J. Mech. Phys. Solids 1971, 19, 419–431. [Google Scholar] [CrossRef]
- Smith, M. ABAQUS/Standard User’s Manual, Version 6.9; English; Dassault Systèmes Simulia Corp: Providence, RI, USA, 2009. [Google Scholar]
- Díaz-Fuentes, M.; Gutiérrez, I. Analysis of different acicular ferrite microstructures generated in a medium-carbon molybdenum steel. Mater. Sci. Eng. A 2003, 363, 316–324. [Google Scholar] [CrossRef]
- Garcia-Mateo, C.; Capdevila, C.; Caballero, F.G.; de Andrés, C.G. Influence of V precipitates on acicular ferrite transformation part 1: The role of nitrogen. ISIJ Int. 2008, 48, 1270–1275. [Google Scholar] [CrossRef]
- Fadel, A.; Glišić, D.; Radović, N.; Drobnjak, D. Intragranular ferrite morphologies in medium carbon vanadium-microalloyed steel. J. Min. Metall. Sect. B Metall. 2013, 49, 237–244. [Google Scholar] [CrossRef]
- Ghosh, A.; Ray, A.; Chakrabarti, D.; Davis, C.L. Cleavage initiation in steel: Competition between large grains and large particles. Mater. Sci. Eng. A 2013, 561, 126–135. [Google Scholar] [CrossRef]
- Balart, M.J.; Davis, C.L.; Strangwood, M. Cleavage initiation in Ti–V–N and V–N microalloyed ferritic–pearlitic forging steels. Mater. Sci. Eng. A 2000, 284, 1–13. [Google Scholar] [CrossRef]
- Strangwood, M.; Bhadeshia, H.K.D.H. Advances in Welding Technology and Science; David, S.A., Ed.; ASM: Metals Park, OH, USA, 1987; pp. 209–213. [Google Scholar]
- Bhadeshia, H.K.D.H. Bainite in Steels, 2nd ed.; The Institute of Materials: London, UK, 2001. [Google Scholar]
- Rodriguez-Ibabe, J.M. The role of microstructure in toughness behavior of microalloyed steels. Mater. Sci. Forum. 1998, 284, 51–62. [Google Scholar] [CrossRef]
- Liu, A.F. Mechanics and Mechanisms of Fracture: An Introduction; ASM International: Materials Park, OH, USA, 2005. [Google Scholar]
- Becker, W.T.; Shipley, R.J.; Lampman, S.; Sanders, B.R.; Henry, S.D.; Anton, G.J.; Hrivnak, N.; Kinson, J.; Terman, C. (Eds.) ASM Handbook: Failure Analysis and Prevention; ASM International: Materials Park, OH, USA, 2002. [Google Scholar]
- Linaza, M.A.; Rodriguez-Ibabe, J.M.; Urcola, J.J. Determination of the energetic parameters controlling cleavage fracture initiation in steels. Fatigue Fract. Eng. Mater. Struct. 1997, 20, 619–632. [Google Scholar] [CrossRef]
- Linaza, M.A.; Romero, J.L.; Rodriguez-Ibabe, J.M.; Urcola, J.J. Cleavage fracture of microalloyed forging steels. Scr. Met. Mater. 1995, 32, 395–400. [Google Scholar] [CrossRef]
- Lewandowski, J.J.; Thompson, A.W. Microstructural effects on the cleavage fracture stress of fully pearlitic eutectoid steel. Met. Trans. A 1986, 17, 1769–1786. [Google Scholar] [CrossRef]
- Martin, J.I.S.; Rodriguez-Ibabe, J.M. Determination of energetic parameters controlling cleavage fracture in a Ti-V microalloyed ferrite-pearlite steel. Scr. Mater. 1999, 40, 459–464. [Google Scholar] [CrossRef]
- Umemoto, M.; Ohtsuka, H. Mechanical Properties of Cementite. ISIJ Int. 2022, 62, 1313–1333. [Google Scholar] [CrossRef]
- Curry, D.A.; Knott, J.F. Effects of Microstructure on Cleavage Fracture Stress in Steel. Metal Sci. 1978, 12, 511–514. [Google Scholar] [CrossRef]
- Knott, J.F. Micromechanisms of fracture: The role of microstructure, Reliability and Structural Integrity of Advanced Materials. In Proceedings of the 9th Biennial European Conference on Fracture (ECF9), Varna, Bulgaria, 21–25 September 1992; p. 1375. [Google Scholar]
- McMahon, C.J.; Cohen, M. Initiation of Cleavage in Polycrytalline Iron. Acta Met. 1965, 13, 591–604. [Google Scholar] [CrossRef]
- Linaza, M.A.; Romero, J.L.; Rodriguez-Ibabe, J.M.; Urcola, J.J. Improvement of Fracture Toughness of Forging Steels Microalloyed with Titanium by Accelerated Cooling After Hot Working. Scr. Met. Mater. 1993, 29, 1217–1222. [Google Scholar] [CrossRef]
- Dikić, S.; Glišić, D.; Fadel, A.H.; Jovanović, G.; Radović, N. Physical simulation of finish rolling of microalloyed steels in isothermal conditions. Hem. Ind. (Chem. Ind.) 2022, 76, 227–236. [Google Scholar] [CrossRef]


| Steel | C | Si | Mn | P | S | Cr | Ni | Mo | V | Ti | Al | Nb | N |
|---|---|---|---|---|---|---|---|---|---|---|---|---|---|
| V | 0.256 | 0.416 | 1.451 | 0.0113 | 0.0112 | 0.201 | 0.149 | 0.023 | 0.099 | 0.002 | 0.038 | 0.002 | 0.0229 |
| TiV | 0.309 | 0.485 | 1.531 | 0.0077 | 0.0101 | 0.265 | 0.200 | 0.041 | 0.123 | 0.011 | 0.017 | 0.003 | 0.0228 |
| Sample Series | σf (MPa) | Experiment Load Fmax (N) | Modeled Displacement U2 (mm) | Sample Series | σf (MPa) | Experiment Load Fmax (N) | Modeled Displacement U2 (mm) |
|---|---|---|---|---|---|---|---|
| V-01 | 11,927 | 28,425.84 | −0.2234 | TiV-01 | 758.7 | 18,152.24 | −0.1382 |
| V-02 | 1267.8 | 30,319.96 | −0.239 | TiV-02 | 934.1 | 22,335.16 | −0.1699 |
| V-03 | 1049.0 | 25,083.64 | −0.1952 | TiV-03 | 904.3 | 21,659.12 | −0.1647 |
| V-04 | 1152.5 | 27,652.4 | −0.2167 | TiV-04 | 950.3 | 22,755.56 | −0.1732 |
| Steel | Phase | Mean Area Fraction (%) | Min Area Fraction (%) | Max Area Fraction (%) | Median Area Fraction (%) | Std. Dev. Area Fraction (%) |
|---|---|---|---|---|---|---|
| V | Ferrite | 41.83 | 29.24 | 63.85 | 41.67 | 5.26 |
| Pearlite | 54.16 | 28.51 | 69.14 | 54.29 | 6.44 | |
| Cementite | 3.78 | 1.06 | 9.21 | 3.66 | 1.34 | |
| TiV | Ferrite | 69.93 | 62.15 | 74.76 | 70.28 | 2.27 |
| Pearlite | 10.56 | 3.36 | 23.32 | 9.81 | 3.66 | |
| Cementite | 18.30 | 11.95 | 22.38 | 18.43 | 1.81 |
| Sample Series | Measurement | Mean Local Thickness (μm) | Minimum Local Thickness (μm) | Maximum Local Thickness (μm) | Median Local Thickness (μm) | Std. Dev. Local Thickness (μm) |
|---|---|---|---|---|---|---|
| V | Average | 0.2644 | 0.1176 | 0.7984 | 0.2476 | 0.1361 |
| Min | 0.2464 | 0.1176 | 0.7435 | 0.2351 | 0.1289 | |
| Max | 0.2829 | 0.1176 | 0.9478 | 0.2629 | 0.1423 | |
| TiV | Average | 0.3738 | 0.1176 | 0.9656 | 0.3741 | 0.1362 |
| Min | 0.3369 | 0.1176 | 0.8477 | 0.3527 | 0.1296 | |
| Max | 0.4124 | 0.1176 | 1.1090 | 0.4239 | 0.1456 |
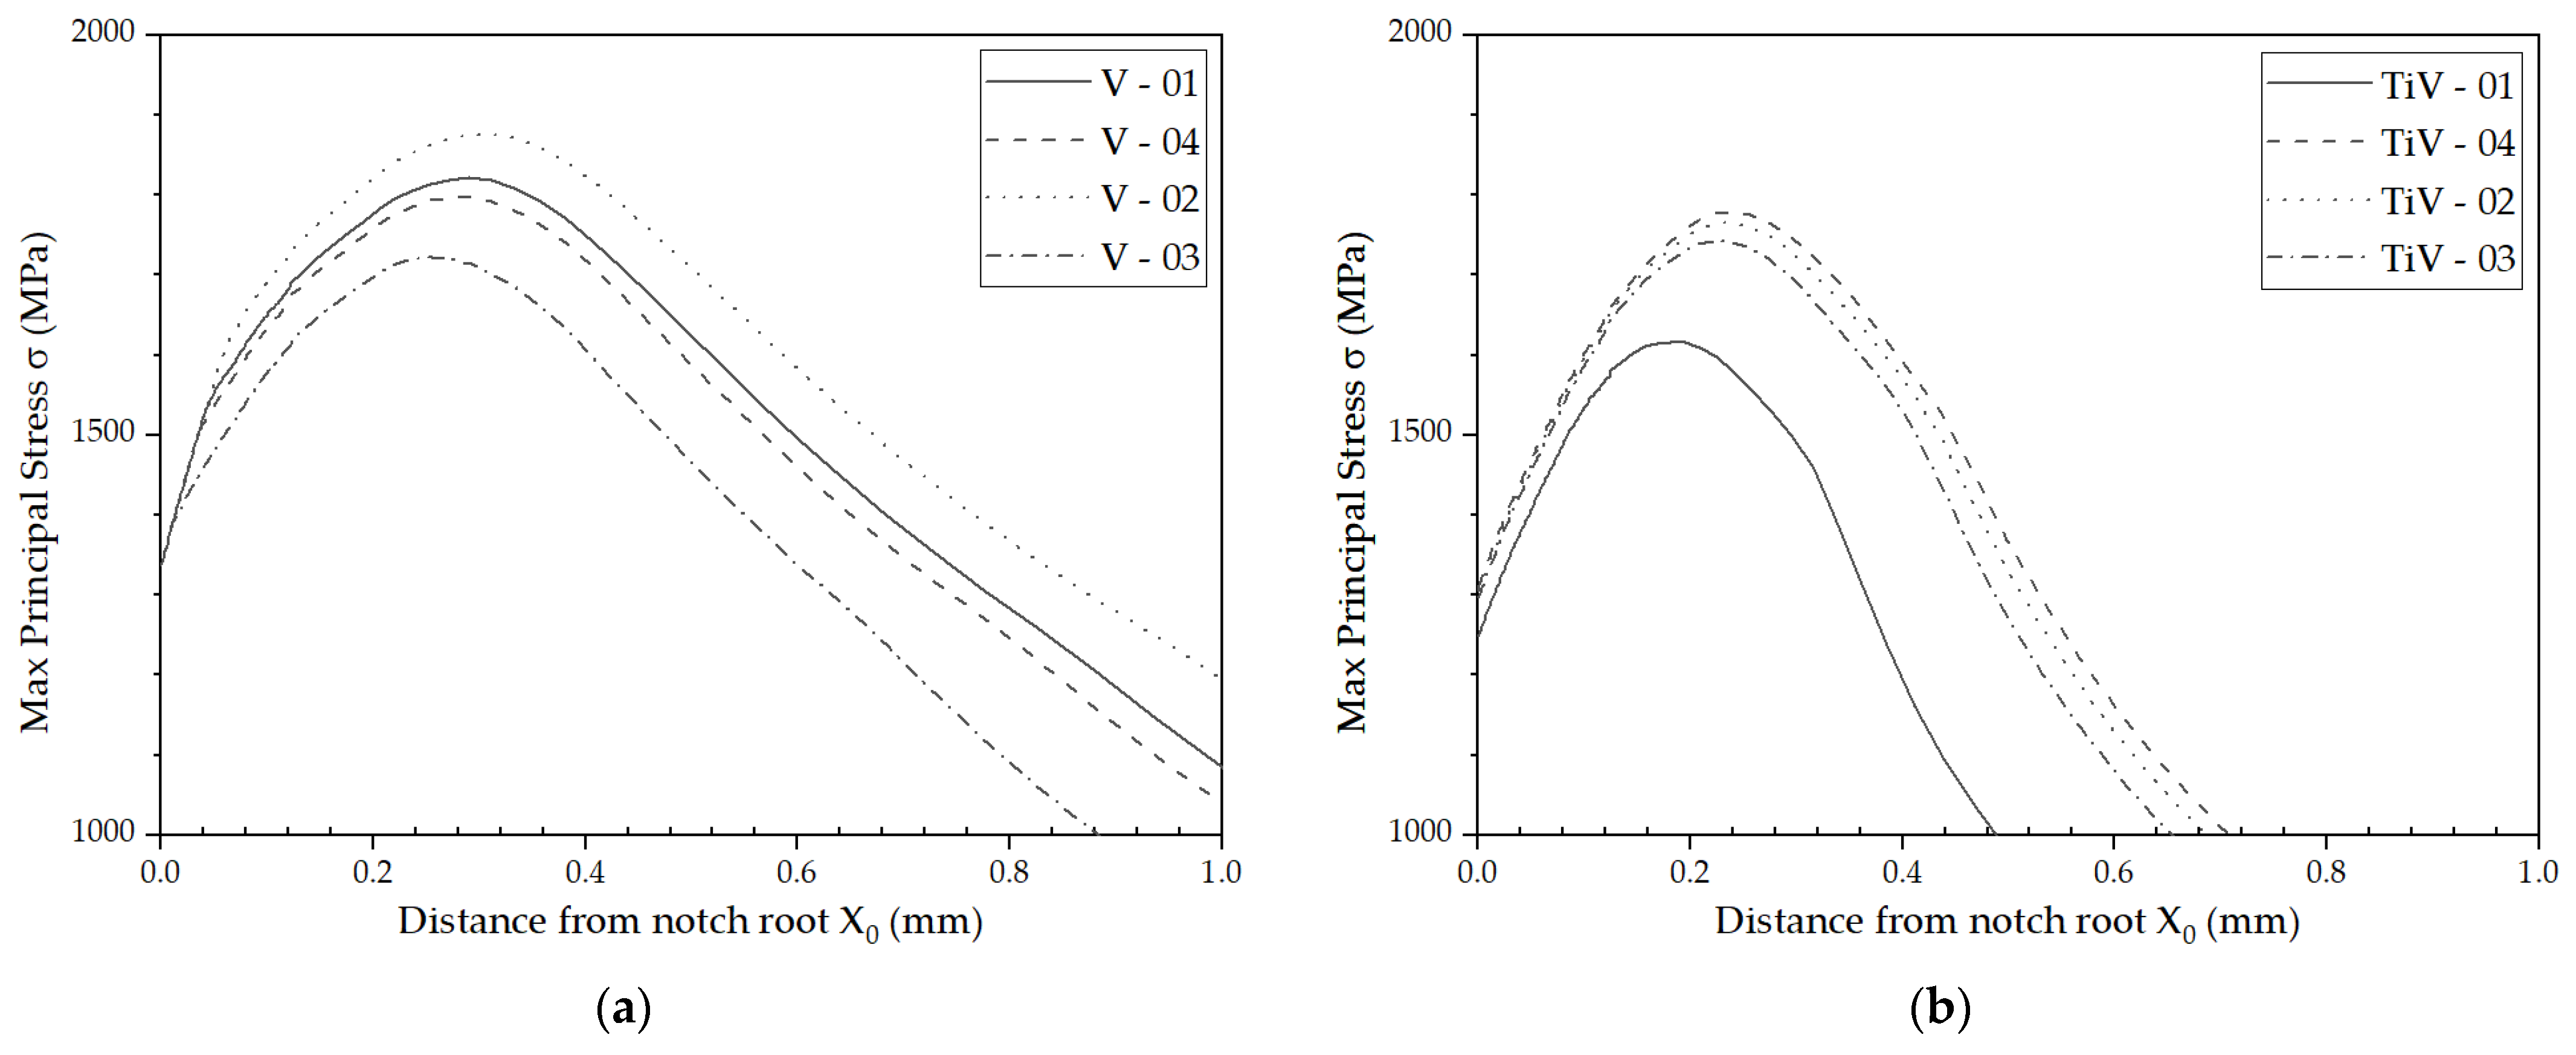
| Sample Series | X0 (μm) | σ1max (MPa) | σF* (MPa) | εpc | Dmax × Dmin (μm) | Deff (μm) | γ (Jm−2) |
|---|---|---|---|---|---|---|---|
| V-01 | 41.1 | 1822 | 1527 | 0.04383 | 36.8 × 15.5 | 24.5 | 84.0 |
| 49.7 | 1552 | 0.04107 | 12.8 × 17.3 | 11.9 | 42.0 | ||
| V-02 | 17.4 | 1876 | 1419 | 0.06200 | 23.7 × 9.8 | 15.6 | 46.0 |
| 16.0 | 1413 | 0.06287 | 21.0 × 11.3 | 16.7 | 48.9 | ||
| 12.2 | 1396 | 0.06483 | 29.3 × 24.1 | 28.5 | 81.5 | ||
| V-03 | 19.4 | 1722 | 1411 | 0.03969 | 41.0 × 8.1 | 14.0 | 41.0 |
| 54.0 | 1489 | 0.02992 | 8.6 × 6.8 | 8.3 | 26.9 | ||
| V-04 | 40.8 | 1798 | 1516 | 0.04732 | 34.7 × 8.2 | 14.0 | 47.4 |
| Ti–V-01 | 78.7 | 1617 | 1485 | 0.01164 | 20.4 × 18.3 | 20.2 | 65.4 |
| Ti–V-02 | 58.6 | 1765 | 1488 | 0.02183 | 18.8 × 12.7 | 17.0 | 55.2 |
| 55.8 | 1480 | 0.02234 | 22.3 × 13.6 | 19.1 | 61.5 | ||
| Ti–V-03 | 112.1 | 1744 | 1612 | 0.01351 | 17.2 × 15.3 | 17.0 | 64.9 |
| 130.7 | 1654 | 0.01165 | 22.1 × 17.6 | 21.3 | 85.5 | ||
| Ti–V-04 | 40.8 | 1779 | 1443 | 0.02639 | 35.4 × 12.3 | 20.2 | 61.7 |
| 65 | 1511 | 0.02164 | 29.1 × 11.8 | 18.8 | 63.1 |
Disclaimer/Publisher’s Note: The statements, opinions and data contained in all publications are solely those of the individual author(s) and contributor(s) and not of MDPI and/or the editor(s). MDPI and/or the editor(s) disclaim responsibility for any injury to people or property resulting from any ideas, methods, instructions or products referred to in the content. |
© 2023 by the authors. Licensee MDPI, Basel, Switzerland. This article is an open access article distributed under the terms and conditions of the Creative Commons Attribution (CC BY) license (https://creativecommons.org/licenses/by/4.0/).
Share and Cite
Jovanović, G.; Glišić, D.; Dikić, S.; Međo, B.; Marković, B.; Vuković, N.; Radović, N. Determining the Role of Acicular Ferrite Carbides in Cleavage Fracture Crack Initiation for Two Medium Carbon Microalloyed Steels. Materials 2023, 16, 7192. https://doi.org/10.3390/ma16227192
Jovanović G, Glišić D, Dikić S, Međo B, Marković B, Vuković N, Radović N. Determining the Role of Acicular Ferrite Carbides in Cleavage Fracture Crack Initiation for Two Medium Carbon Microalloyed Steels. Materials. 2023; 16(22):7192. https://doi.org/10.3390/ma16227192
Chicago/Turabian StyleJovanović, Gvozden, Dragomir Glišić, Stefan Dikić, Bojan Međo, Branislav Marković, Nikola Vuković, and Nenad Radović. 2023. "Determining the Role of Acicular Ferrite Carbides in Cleavage Fracture Crack Initiation for Two Medium Carbon Microalloyed Steels" Materials 16, no. 22: 7192. https://doi.org/10.3390/ma16227192