Article

Lattice Thermal Conductivity in XMg2Sb2(X = Ca or Mg) Compounds: Temperature and High-Order Anharmonicity Effect

1
College of Materials and Chemical Engineering, MinJiang University, Fuzhou 350108, China
2
Fujian Key Laboratory of Functional Marine Sensing Materials, Minjiang University, Fuzhou 350108, China
3
Department of Physics, Southern University of Science and Technology, Shenzhen 518055, China
*
Author to whom correspondence should be addressed.
Materials 2023, 16(23), 7349; https://doi.org/10.3390/ma16237349
Submission received: 9 October 2023 / Revised: 8 November 2023 / Accepted: 9 November 2023 / Published: 25 November 2023
(This article belongs to the Section Energy Materials)

Abstract

:
The binary compound Mg3Sb2 (also written as MgMg2Sb2) exhibits a much lower lattice thermal conductivity ( κ L ) than its ternary analog CaMg2Sb2, despite its relatively low mass density and simple crystalline structure. Here, we perform a comparative first-principles study of the lattice dynamics in MgMg2Sb2 and CaMg2Sb2 based on the density functional theory, together with the self-consistent phonon theory and the Boltzmann transport theory. We show that the modest anharmonicity of CaMg2Sb2 renders the three-phonon processes dominant, and the temperature dependence of κL approximately follows the T 1 relationship. In contrast, the strong quartic anharmonicity of MgMg2Sb2 leads to the ultralow κL and weak temperature dependence, in agreement with the experimental observations. A comprehensive analysis reveals that the κ L s in the two compounds are mainly carried by the acoustic phonons associated with the Sb atoms, and the different behaviors of κ L result from the chemical bond changes around Sb atoms, which bond more covalently with the Mg atoms than the Ca atoms and thus lead to high-order anharmonicity in MgMg2Sb2. These results give us insights into the understanding of the anomalous thermal transport in thermoelectric materials.

1. Introduction

Crystalline solids with inherently low thermal conductivity are technologically important for many fundamental applications, such as thermal barrier coatings, data storage devices, and especially thermoelectrics (TE) [1,2,3]. Indeed, almost all hitherto known thermoelectric materials with high energy conversion efficiency possess low lattice thermal conductivity ( k L ). The k L s in crystalline materials are generally explained by various phonon scattering mechanisms [4,5]. Usually, the physical origin of low k L is ascribed to the unconventional phonon-scattering processes induced by strong lattice anharmonicity or phonon–phonon couplings. Several rules of thumb, such as compounds with heavy elements (e.g., Bi2Te3 [6] and PbTe [7]), soft bonds (e.g., Tl3VSe3 [8], TlInTe2 [9]), and complex atomic structures (e.g., K2Bi8Se13 [10], Yb14MnSb11 [11], Ba8Ga16Ge30 [12], LaFeSb12 [13]), have been applied to screen materials with inherently low k L s, since these features lead to low phonon velocities or high rates of phonon-phonon scattering [5]. A common practice for estimating the anharmonicity of solids is to obtain the Grüneisen parameter. The larger the Grüneisen parameter is, the stronger the anharmonicity, and so the lower the k L   i s . Although the past decades have witnessed impressive progress in the understanding of thermal transport of crystalline materials, the underlying origin of the anomalously low k L s present in some simple compounds still remains elusive.
The binary compound MgMg2Sb2, which crystallizes in the CaAl2Si2 structure type, has recently emerged as a promising TE material at intermediate temperatures [14,15,16,17,18]. Besides the excellent electronic transport properties, the unusually low k L in this simple crystalline phase also plays an equally important role in leading to the high TE performance. Despite its much lighter density than traditional TE compounds PbTe and Bi2Te3, MgMg2Sb2 exhibits a comparable k L at room temperature (1–1.5 W/mK). As one of the lightest compounds in the Zintl-type family, the surprisingly low k L of binary MgMg2Sb2 is anomalous compared with its isostructural ternary counterparts [19]. For example, the k L increases three times when replacing Mg at the octahedral site with heavier Ca or Yb [19], which is contrary to the common expectations that k L should be suppressed in compounds with more complex compositions and higher mass densities. It was also puzzling to note that the temperature dependence of k L in crystalline MgMg2Sb2 follows a relationship of T−0.57 [20], much weaker than the typical T−1 behavior above the Debye temperatures, which is usually expected if only taking the three phonon processes into consideration. Both the counterintuitive decrease and weak temperature dependence of k L s in MgMg2Sb2 suggest that higher-order anharmonic interactions and temperature-dependent phonon frequency shifts should be included to understand the physics of the abnormal thermal conductivity in such simple and lightweight crystalline compounds.
In this work, we perform a comparative first-principles study of the lattice dynamics in MgMg2Sb2 and CaMg2Sb2 based on the density functional theory (DFT), together with the self-consistent phonon theory and the Boltzmann transport theory. We show that the modest anharmonicity of CaMg2Sb2 renders the three-phonon processes dominant, and the temperature dependence of k L approximately follows the T 1 relationship. In contrast, the strong quartic anharmonicity of MgMg2Sb2 leads to an ultralow k L and a weak temperature dependence. In-depth analyses reveal that the k L s in the two compounds are mainly carried by the acoustic phonons associated with the Sb atoms, and the origin of the unusual k L behaviors lies in the chemical bond changes of Sb atoms, which bond more covalently with the Mg atoms than the Ca atoms, and thus lead to strong high-order anharmonicity in MgMg2Sb2.
The paper is organized as follows: In Section 2, the details of our computational methods are presented. The lattice dynamics-related properties, such as elastic constants, phonon dispersions, lattice thermal conductivities, and chemical bond analysis are discussed in Section 3. Section 4 is the summary of our work.

2. Computational Methods

DFT calculations: All the first-principles calculations are performed using the projector augmented-wave (PAW) method as implemented in the Vienna ab initio Simulation Package (VASP) [21]. The exchange–correlation interaction is treated in the generalized gradient approximation (GGA) of Perdew, Burke, and Ernzerhof (PBE) [22]. The energy cutoff is set to 500 eV for the plane-wave basis sets. A Monkhorst-Pack k -point mesh of 6 × 6 × 4 has been used to sample the Brillouin zone for the primitive cell, while only Γ point is used for the supercell calculations. The criterion for the relaxation is set to the minimum atomic force of less than 0.01 eV/Å. A 4 × 4 × 3 supercell containing 240 atoms is constructed to obtain the required force constants with a total energy convergence criterion of 10−8 eV. The maximally localized Wannier functions (MLWF) have been obtained using the Wannier90 Code [23,24] to understand the chemical bonding in the two compounds.
Molecular dynamics (MD) simulations: Ab initio MD simulations are conducted to investigate the lattice dynamics properties at finite temperatures. All the MD simulations are carried out with an NVT ensemble. Only the cases at temperatures of 400 K and 700 K have been investigated. The MD simulations last for at least for 30 ps with a time step of 2 fs, after the equilibration steps. The plane-wave energy cutoff and energy convergence criterion are set as 300 eV and 10−4 eV, respectively, to accelerate the calculations for the MD simulations.
Phonon and κ L calculations: Different methods have been used to calculate the required force constants. The second and third force constants at 0 K are calculated using the finite-displacement methods. We consider up to the seventh-nearest neighbors (7-NN) for the calculations of the third-order force constants, which leads to more than 700 configurations to be calculated. These configurations are constructed by displacing an atom from its equilibrium position by 0.01 Å. The second and third force constants can then be extracted by solving a least-square problem after obtaining the atomic forces from the DFT calculations for each configuration. At finite temperatures, we extract the force constants up to the fourth order by a state-of-the-art Compressing Sensor (CS) method. More information about this method can be found in reference [25]. We uniformly sampled 230 snapshots from the MD trajectory. In each sampled snapshot, we further displace all atoms by 0.1 Å in random directions to decrease the cross-correlations between the sampled configurations. All the harmonic and anharmonic force constants are obtained using the ALAMODE code [26].
Phonon dispersions are obtained via direct diagonalization of the dynamic matrix constructed from the second force constants and the k L s are calculated using the Boltzmann transport equation (BTE) within the relaxation-time approximation
κ L μ ν ( T ) = 1 N V q c q ( T ) v q u ( T ) τ q ( T )
where N is the number of atoms and V is the volume of the unit cell, c q ( T ) is the mode-specific heat, v q ( T ) the group velocity, and τ q ( T ) the lifetime of phonon q. The phonon lifetime τ is evaluated from the imaginary part of the bubble self-energy, which only takes the third force constants into consideration. At finite temperatures, the renormalization of the vibrational frequency by the quartic anharmonicity is considered using the self-consistent phonon (SCP) method implemented in the ANPHON code [27]. The phonon dispersions and the corresponding quartic anharmonicity corrected k L s at different temperatures are then obtained using the corresponding force constants at finite temperatures. For all our k L   thermal conductivity calculations, the q-mesh is set to 30 × 30 × 20, which is dense enough to obtain the convergent result.

3. Results and Discussion

3.1. Crystal-Structure and Elastic Properties

As shown in Figure 1, the layered CaAl2Si2-type compounds XMg2Sb2 (X = Mg1 or Ca) belong to the Zintl family with a trigonal lattice of the D 3 d 3 ( P 3 ¯ m 1 ) symmorphic space group. The structure is commonly characterized by the alternating covalently bounded anionic [Mg2Sb2]2− layers and loosely bounded two-dimensional cationic X2+ (Ca or Mg1) ion layers. In the following, we refer to Mg at the highly distorted octahedral X site as Mg1. The Mg-Sb bond lengths differ significantly between the two sites. Table 1 collects the equilibrium lattice constants of XMg2Sb2 compounds, which are all in good agreement with the experimental values. It can be seen that the average atomic volume and the ratio c/a is larger in CaMg2Sb2 than in MgMg2Sb2, which indicates that CaMg2Sb2 has a more loosely packed structure than MgMg2Sb2. A larger average atomic volume generally can afford more dynamic freedom for the atomic movement, and so has a greater tendency to induce lattice dynamic abnormality. Also, considering the higher mass density and more complex compositions of the ternary compound CaMg2Sb2 than the binary MgMg2Sb2, one may expect that the former should have a lower k L than the latter. However, contrary to common intuitions, recent experiments observed that the k L of MgMg2Sb2 is three-times lower than that of CaMg2Sb2 [14].
The elastic properties of solids are the macroscopic reflection of the intrinsic atomic lattice dynamics and can be used to evaluate the κ L [30]. Here, using the first-principle-based perturbation theory, the elastic constants of these compounds are calculated and listed in Table 1, and then, the Hill average of the bulk (B), shear (G), and Young moduli (E) are further evaluated [31]. As shown in Table 1, unlike the typical layered thermoelectric materials, such as SnSe and Bi2Te3, the anisotropy of the elastic properties of XMg2Sb2 compounds are quite small (C11/C33 ≈ 1.2 for CaMg2Sb2 and 0.9 for MgMg2Sb2), indicating that the two compounds actually are more akin to the bulk materials than the layered materials. We note that the calculated elastic constants of Mg3Sb2 are a little bit smaller than that of CaMg2Sb2, consistent with the situation of k L .
Thermal conductivity ingredients, such as the longitudinal (vL) and transversal (vT) sound velocity, and Debye temperature (ΘD) can be further derived using the following equations:
ρ v L 2 = B + 4 3 G ,   ρ v T 2 = G ,   Θ D = v A ( 6 π 2 n ) 1 / 3 k B
where ρ is the density, n is the atomic number per volume, and vA is the average sound velocity ( 3 v A 3 = 2 v L 3 + 1 v T 3 ). These results are also presented in Table 1. After comparing these parameters with other low- κ L compounds, such as PbX(X = Se, Te) [32], BiCuXO(X = S, Se and Te) [33], SnSe [34], Cu2Se [35], TlXTe2(X = Ga, In) [9], and Tl3VSe4 [8], one can find that these values for XMg2Sb2 compounds are at a low level, hinting that the κ L of XMg2Sb2 (X = Mg1 or Ca) compounds is small, especially for MgMg2Sb2.

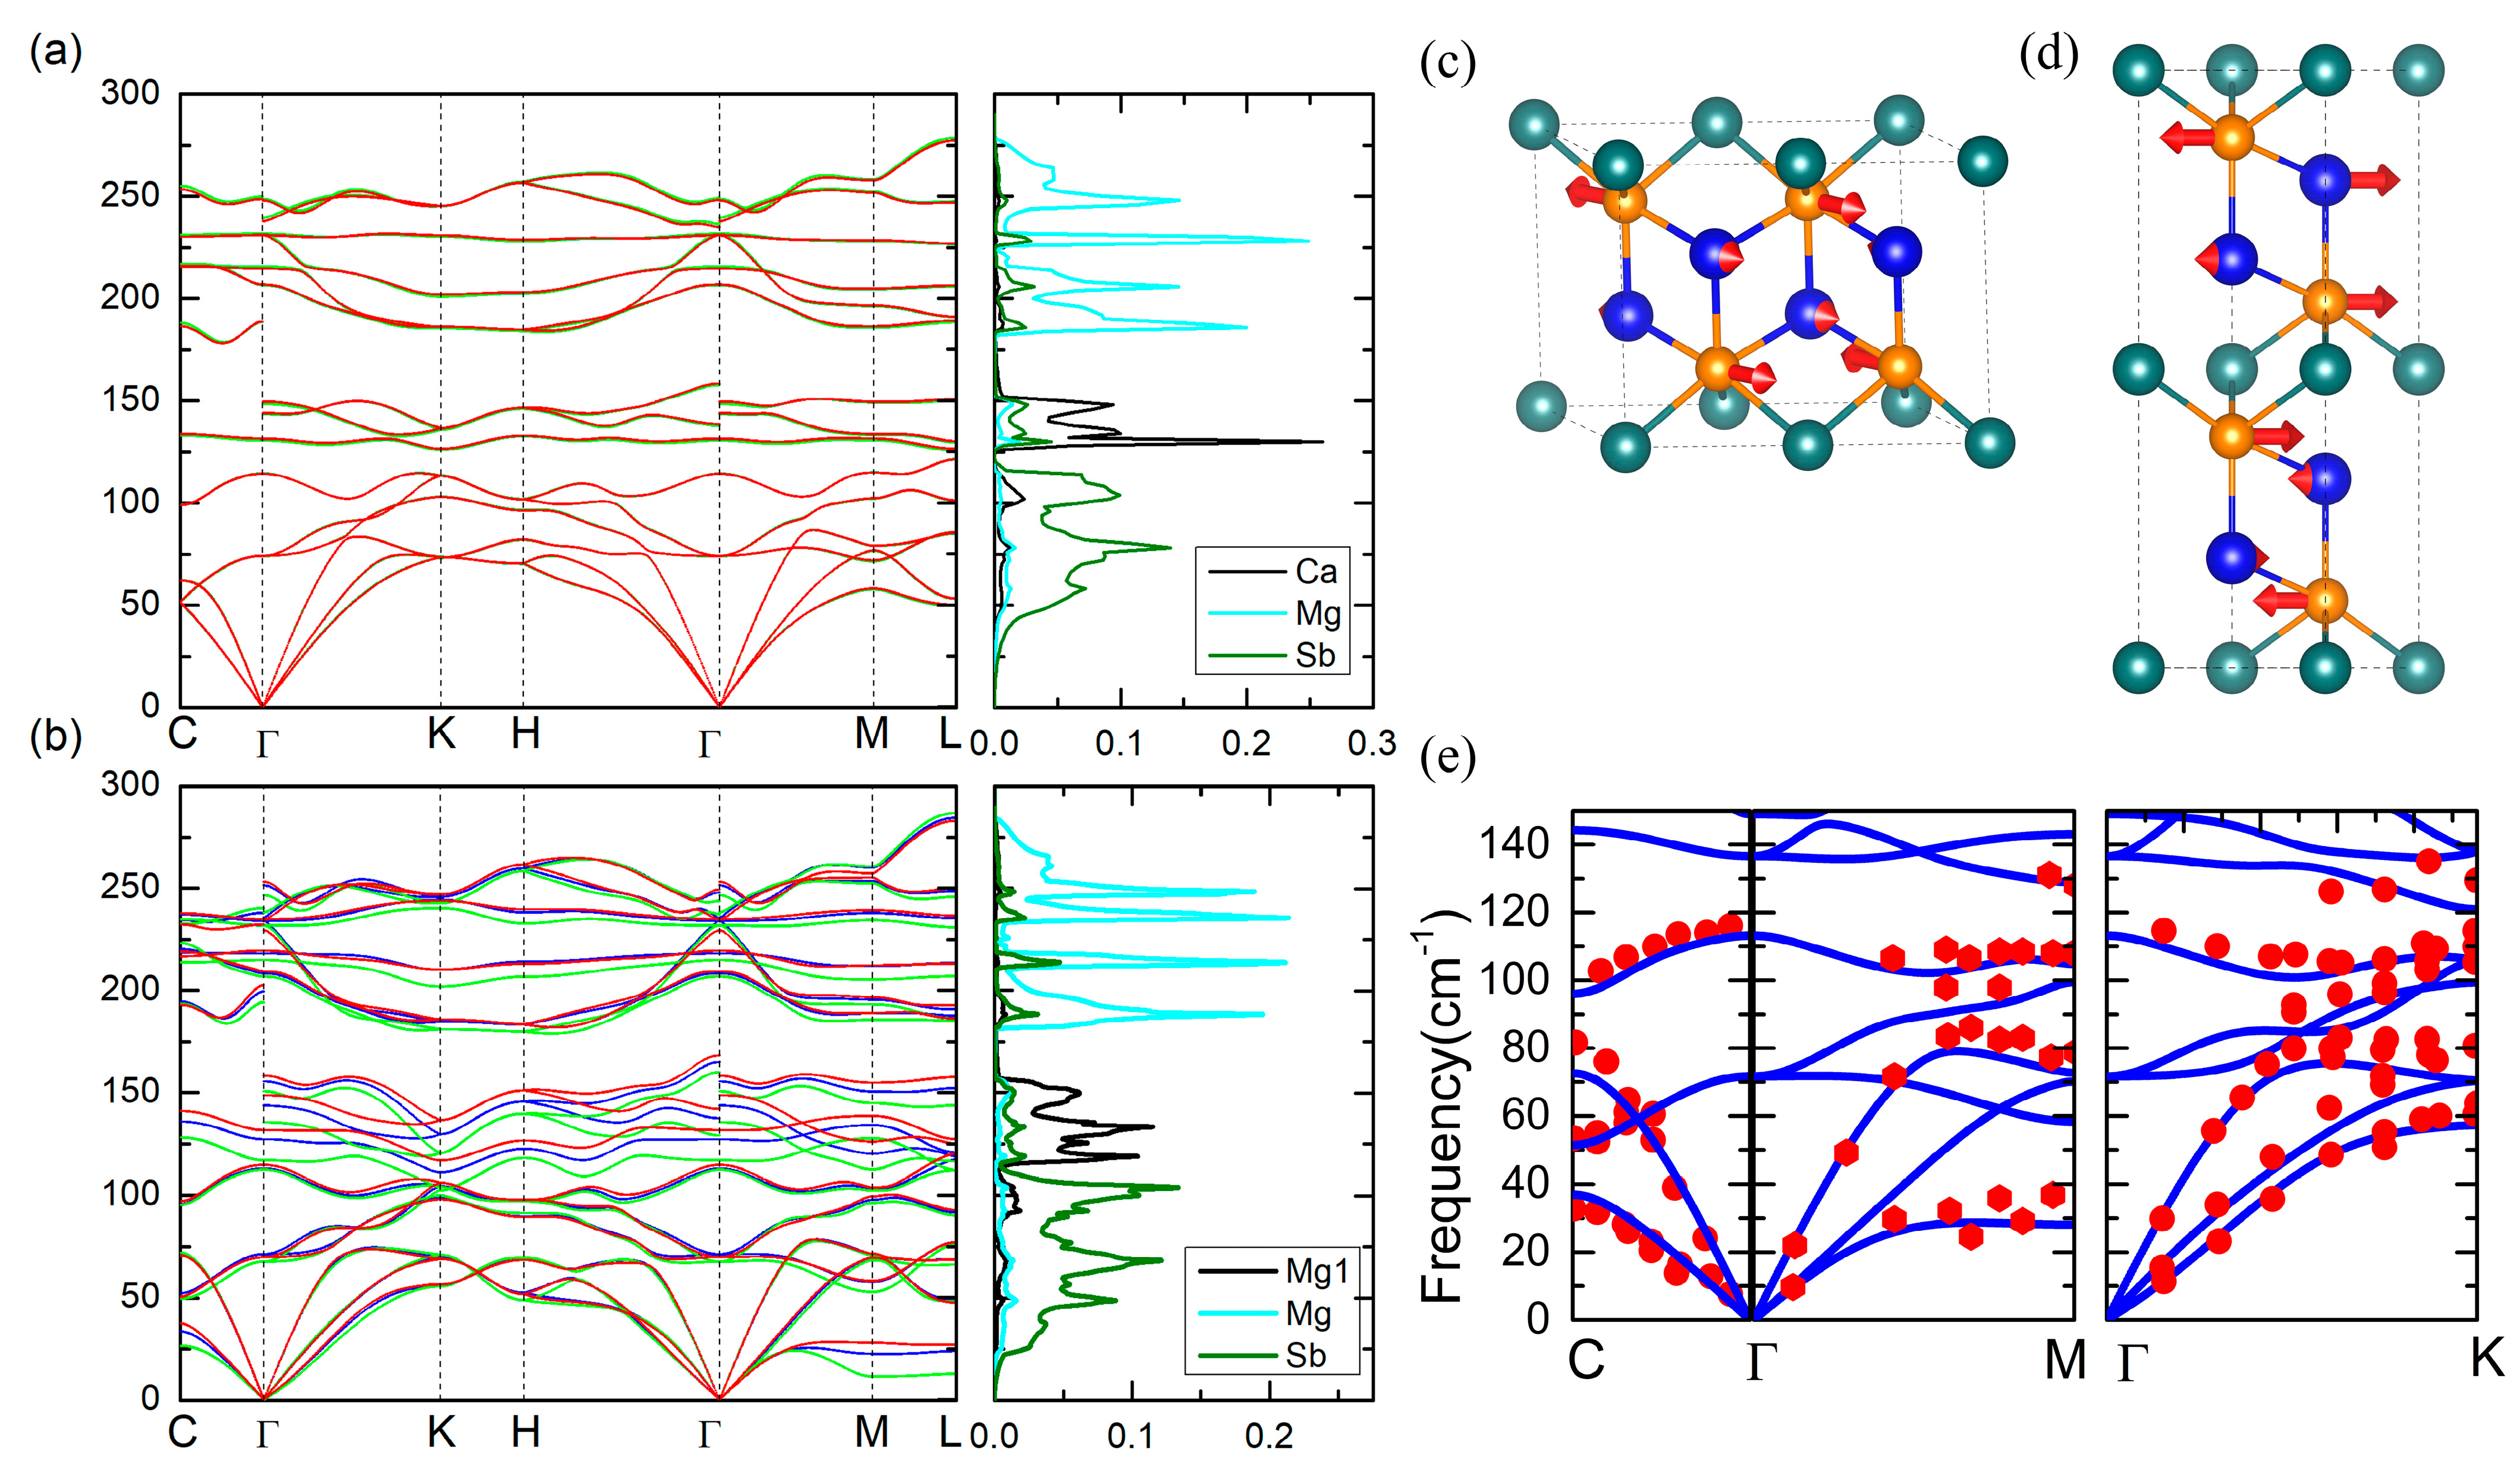
3.2. Phonon Dispersion

The calculated phonon dispersions at different temperatures along the high-symmetry lines in the first Brillion Zone (BZ) are plotted in Figure 2. The primitive cell of XMg2Sb2 consists of one formula (five atoms) having a total of 15 phonon branches, among which 3 are acoustic and 12 are optical modes. At the high-symmetry Γ point, the factor group analysis yields
D 3 d = E u A 2 u   ( acoustic ) 2 E g 2 A 1 g 2 E u A 2 u A 2 u   ( optic ) .
Except for the three acoustic modes, the optical modes can be further classified into two categories: Raman active (R) modes and inferred (IR) active modes. In Table 2, we present the calculated results for different temperatures with a detailed description of the eigen displacements and participating atoms for each mode in order to facilitate the comparison with experimental results. Based on the eigen displacement information, one can qualitatively evaluate the effect of either the point defects or doping to these modes. We find that the defects or doping at X sites would strongly affect the IR active modes, while the effect of defects or doping related to the [Mg2Sb2]2− layer can be experimentally observed in the Raman Spectra. The influence of temperature on these R or IR active modes of these two materials is different. As can be seen in Table 2, most of these modes are blueshift as temperature increases, and much larger changes with temperature can be observed in MgMg2Sb2 compared to CaMg2Sb2, indicating a stronger anharmonicity of MgMg2Sb2.
We note that there exists splitting between the longitudinal and transverse optical modes (LO-TO splitting) at the Γ point in the two compounds. The magnitude of the LO-TO splitting depends on the Born effective charge (BEC) and the dielectric screening function of the Coulomb interaction determined by the electronic part of the dielectric constants. The BEC tensor, described as the static and dynamic polarization, is diagonal and reduced into two independent values, Z a a * = Z b b * = Z X * and Z c c * = Z X * , which are listed in Table 3, along with the nominal charges obtained by the Bader analysis method for each element in the two compounds. One can see that the overall chemical bonding in MgMg2Sb2 is less ionic than that in CaMg2Sb2. Particularly, the electronic dynamics polarization effect on Sb atoms in MgMg2Sb2 is a little larger than that in CaMg2Sb2, especially along the in-plane direction, indicating covalent chemical bonds around Sb atoms in MgMg2Sb2 are a little bit stronger. The obtained BEC and dielectric constants show small differences along the c and a/b axis indicating that these two compound are fairly isotropic, in accordance with the elastic properties. We also note that the lattice contribution to the dielectric response (ε0–ε) in MgMg2Sb2 is almost twice as large as that in CaMg2Sb2, again indicating the presence of lower-frequency phonon modes in MgMg2Sb2 compared to CaMg2Sb2.
The phonon dispersions at different temperatures (T = 0, 400, 700 K) and the atom-projected phonon density of states (pDOS) at 400 K for the two compounds are shown in Figure 2. It can be seen that the contributions from different atoms are spectrally well separated. For both compounds, the vibrations of Mg atoms in the [Mg2Sb2]2− layer mainly occupy the high optical frequency range and decouple from other atoms with a large gap of more than 50 cm−1, Mg1 or Ca contributes the intermediate frequency modes, and Sb dominates the lowest frequency region, indicating that the Sb atoms play a critical role in the thermal conductivity. One can also note that there exist significant differences between the phonon spectra of these two compounds: (i) compared with CaMg2Sb2, the acoustic phonon modes in MgMg2Sb2, which are mainly contributed by Sb atoms, become softer at the Brillouin zone boundary M -, L -, and C -point; and (ii) the pDOS of Mg1 contributes more to the lower energy side and is substantially broader than that of Ca, and a small gap of 10 cm−1 appearing between the pDOS of Ca and Sb in CaMg2Sb2 phonon spectra disappears in MgMg2Sb2. These differences suggest that the interactions between Mg1-Sb are much weaker than Ca-Sb, which was also reported in earlier studies [37].
A further scrutinization of the temperature response of the phonon dispersions in the two compounds also reveals different behavior. As can be seen in Figure 2b, most phonon modes of MgMg2Sb2 generally stiffen with increasing temperature. Specifically, the transverse acoustic phonons become significantly stiffer upon warming, especially at the Brillouin zone boundary C-, M-, and L-point. However, the phonon spectra of CaMg2Sb2 only show negligible changes with temperature, as displayed in Figure 2a. The sound velocities derived from the slopes of the acoustic branches of the phonon dispersions at the Γ point are also listed in Table 3, which are consistent with the those obtained by the elastic parameters (Table 1). It is thus not surprising to see that the sound velocities of MgMg2Sb2 are smaller than the counterparts of CaMg2Sb2. In Figure 2e, we compare the phonon dispersions of MgMg2Sb2 at 300 K obtained by the self-consistent phonon method and the corresponding experimental results from the inelastic X-ray scattering (IXS) [36]. A very good agreement can be observed between the calculated and experimental results, and the small deviation might be due to other factors such as lattice expansions and defects inherent in the experimental samples, which are not considered here.

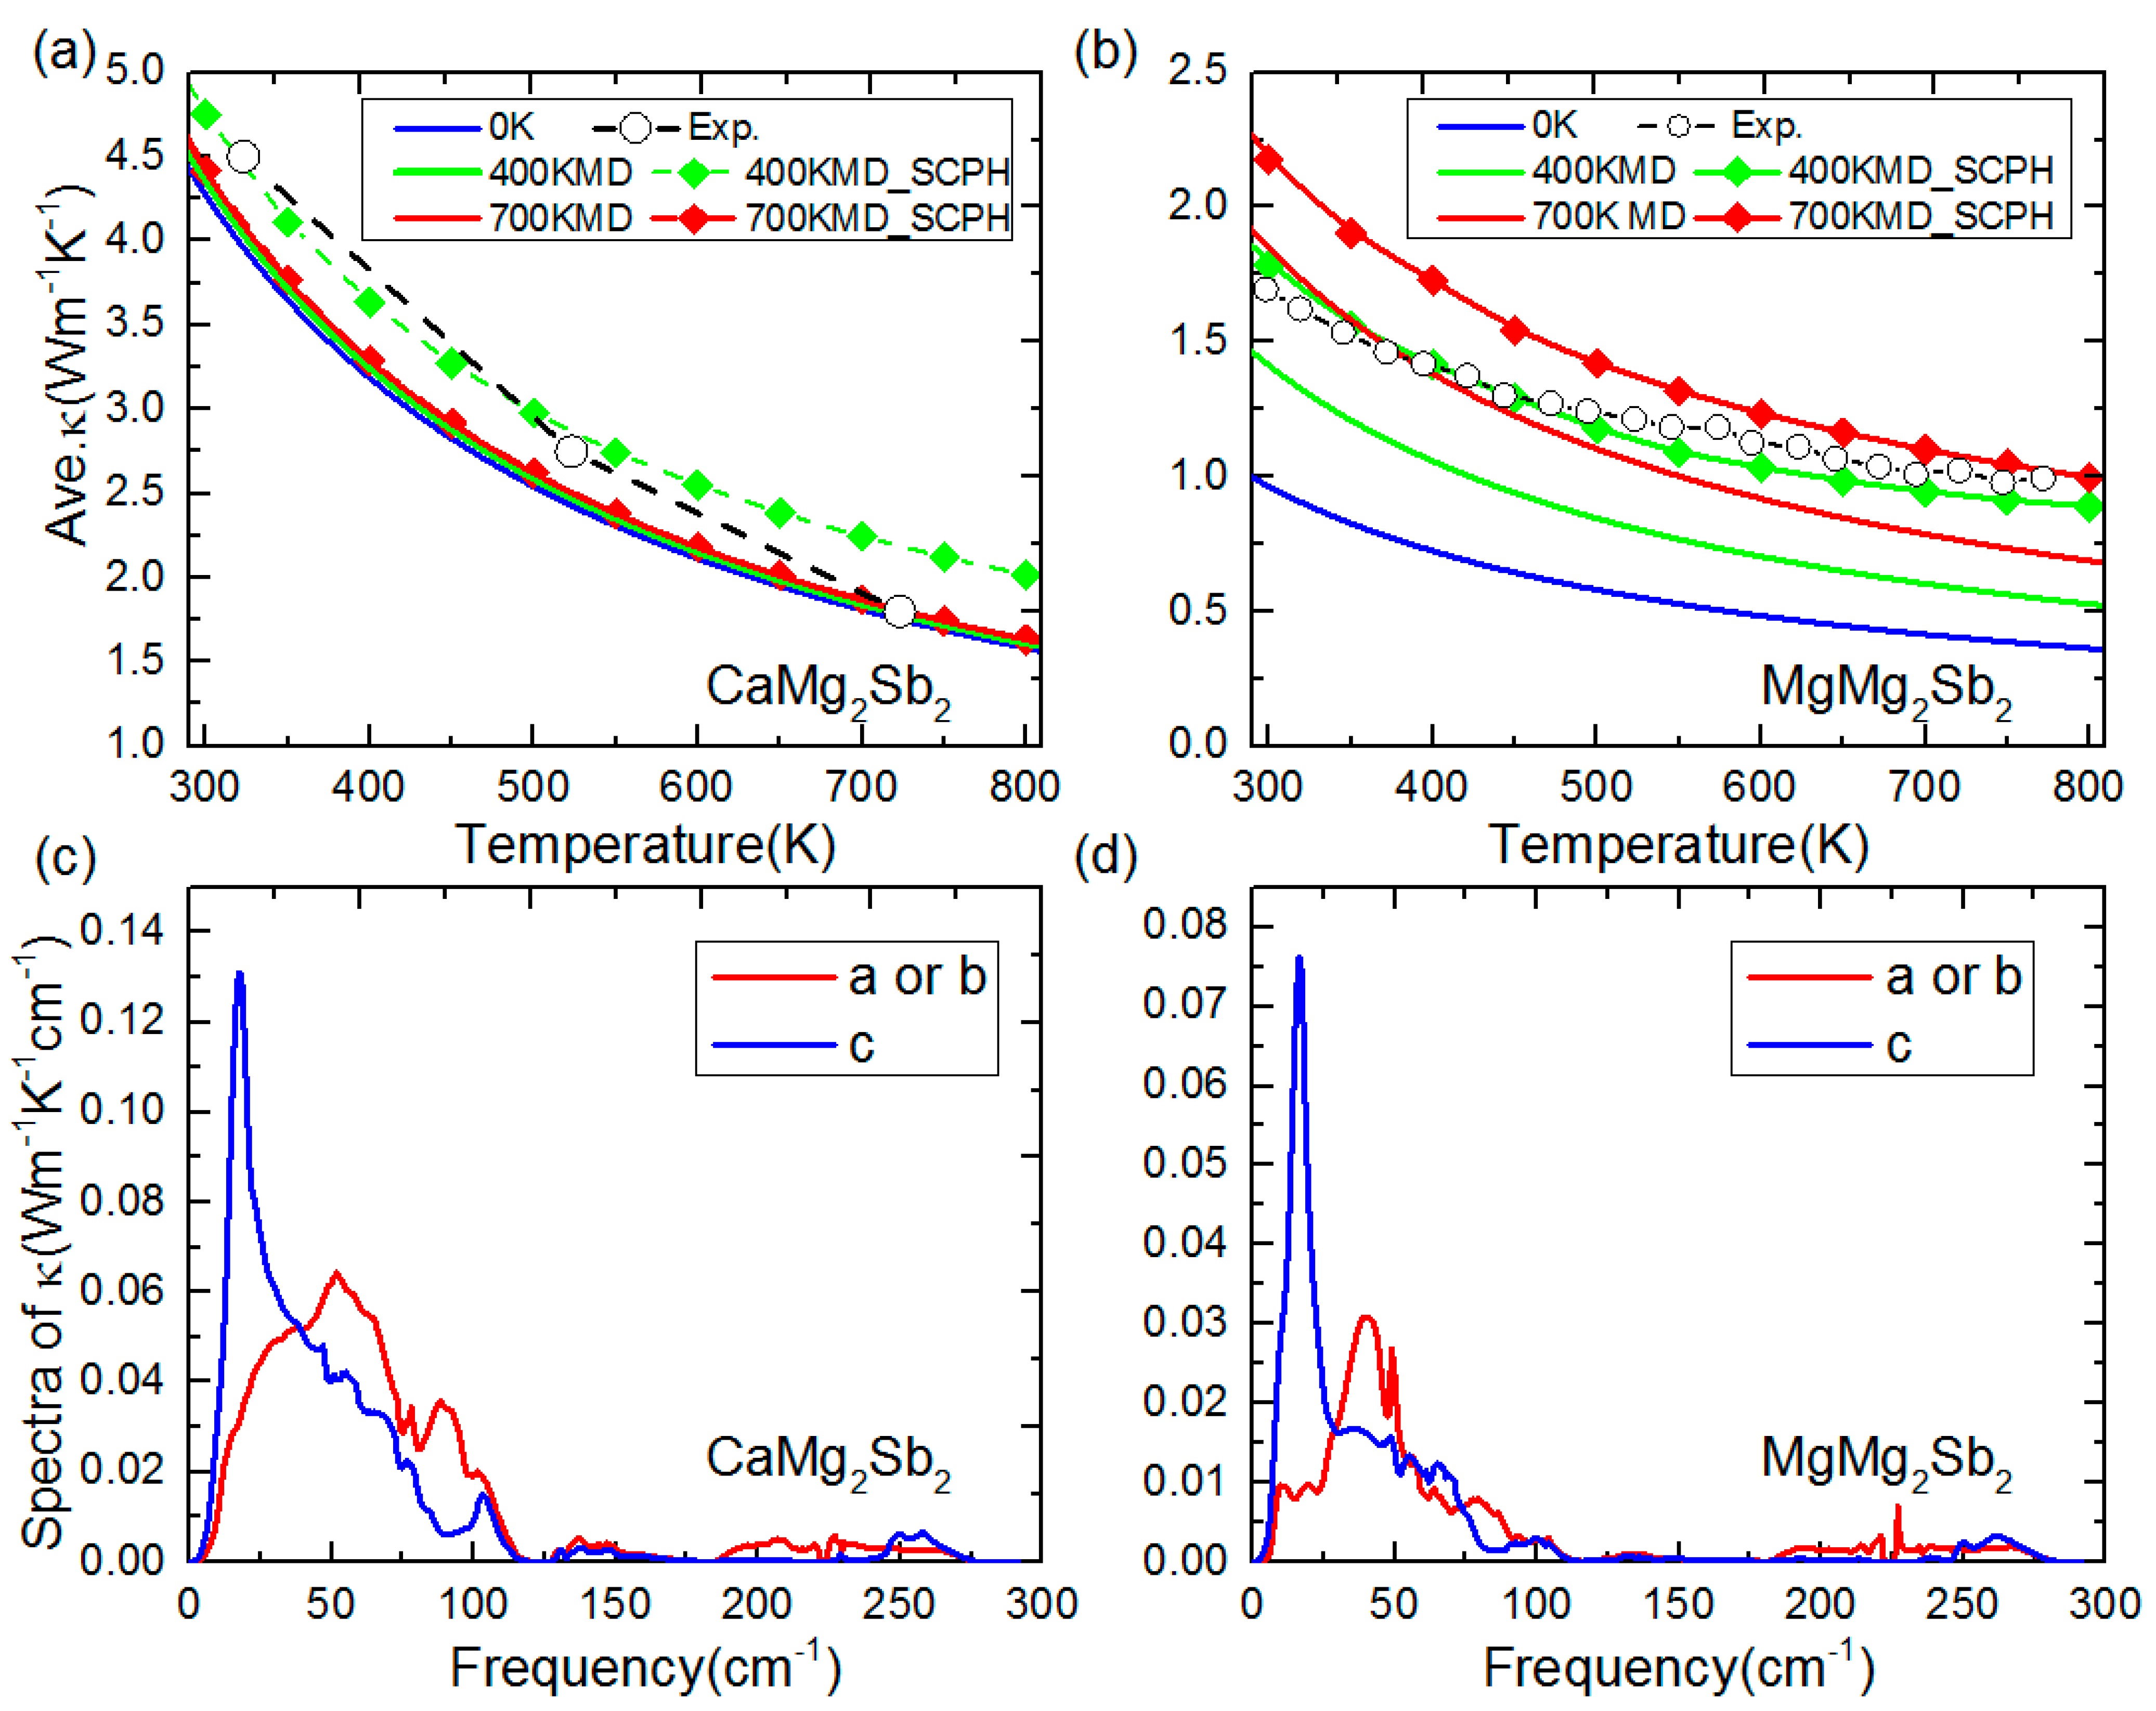
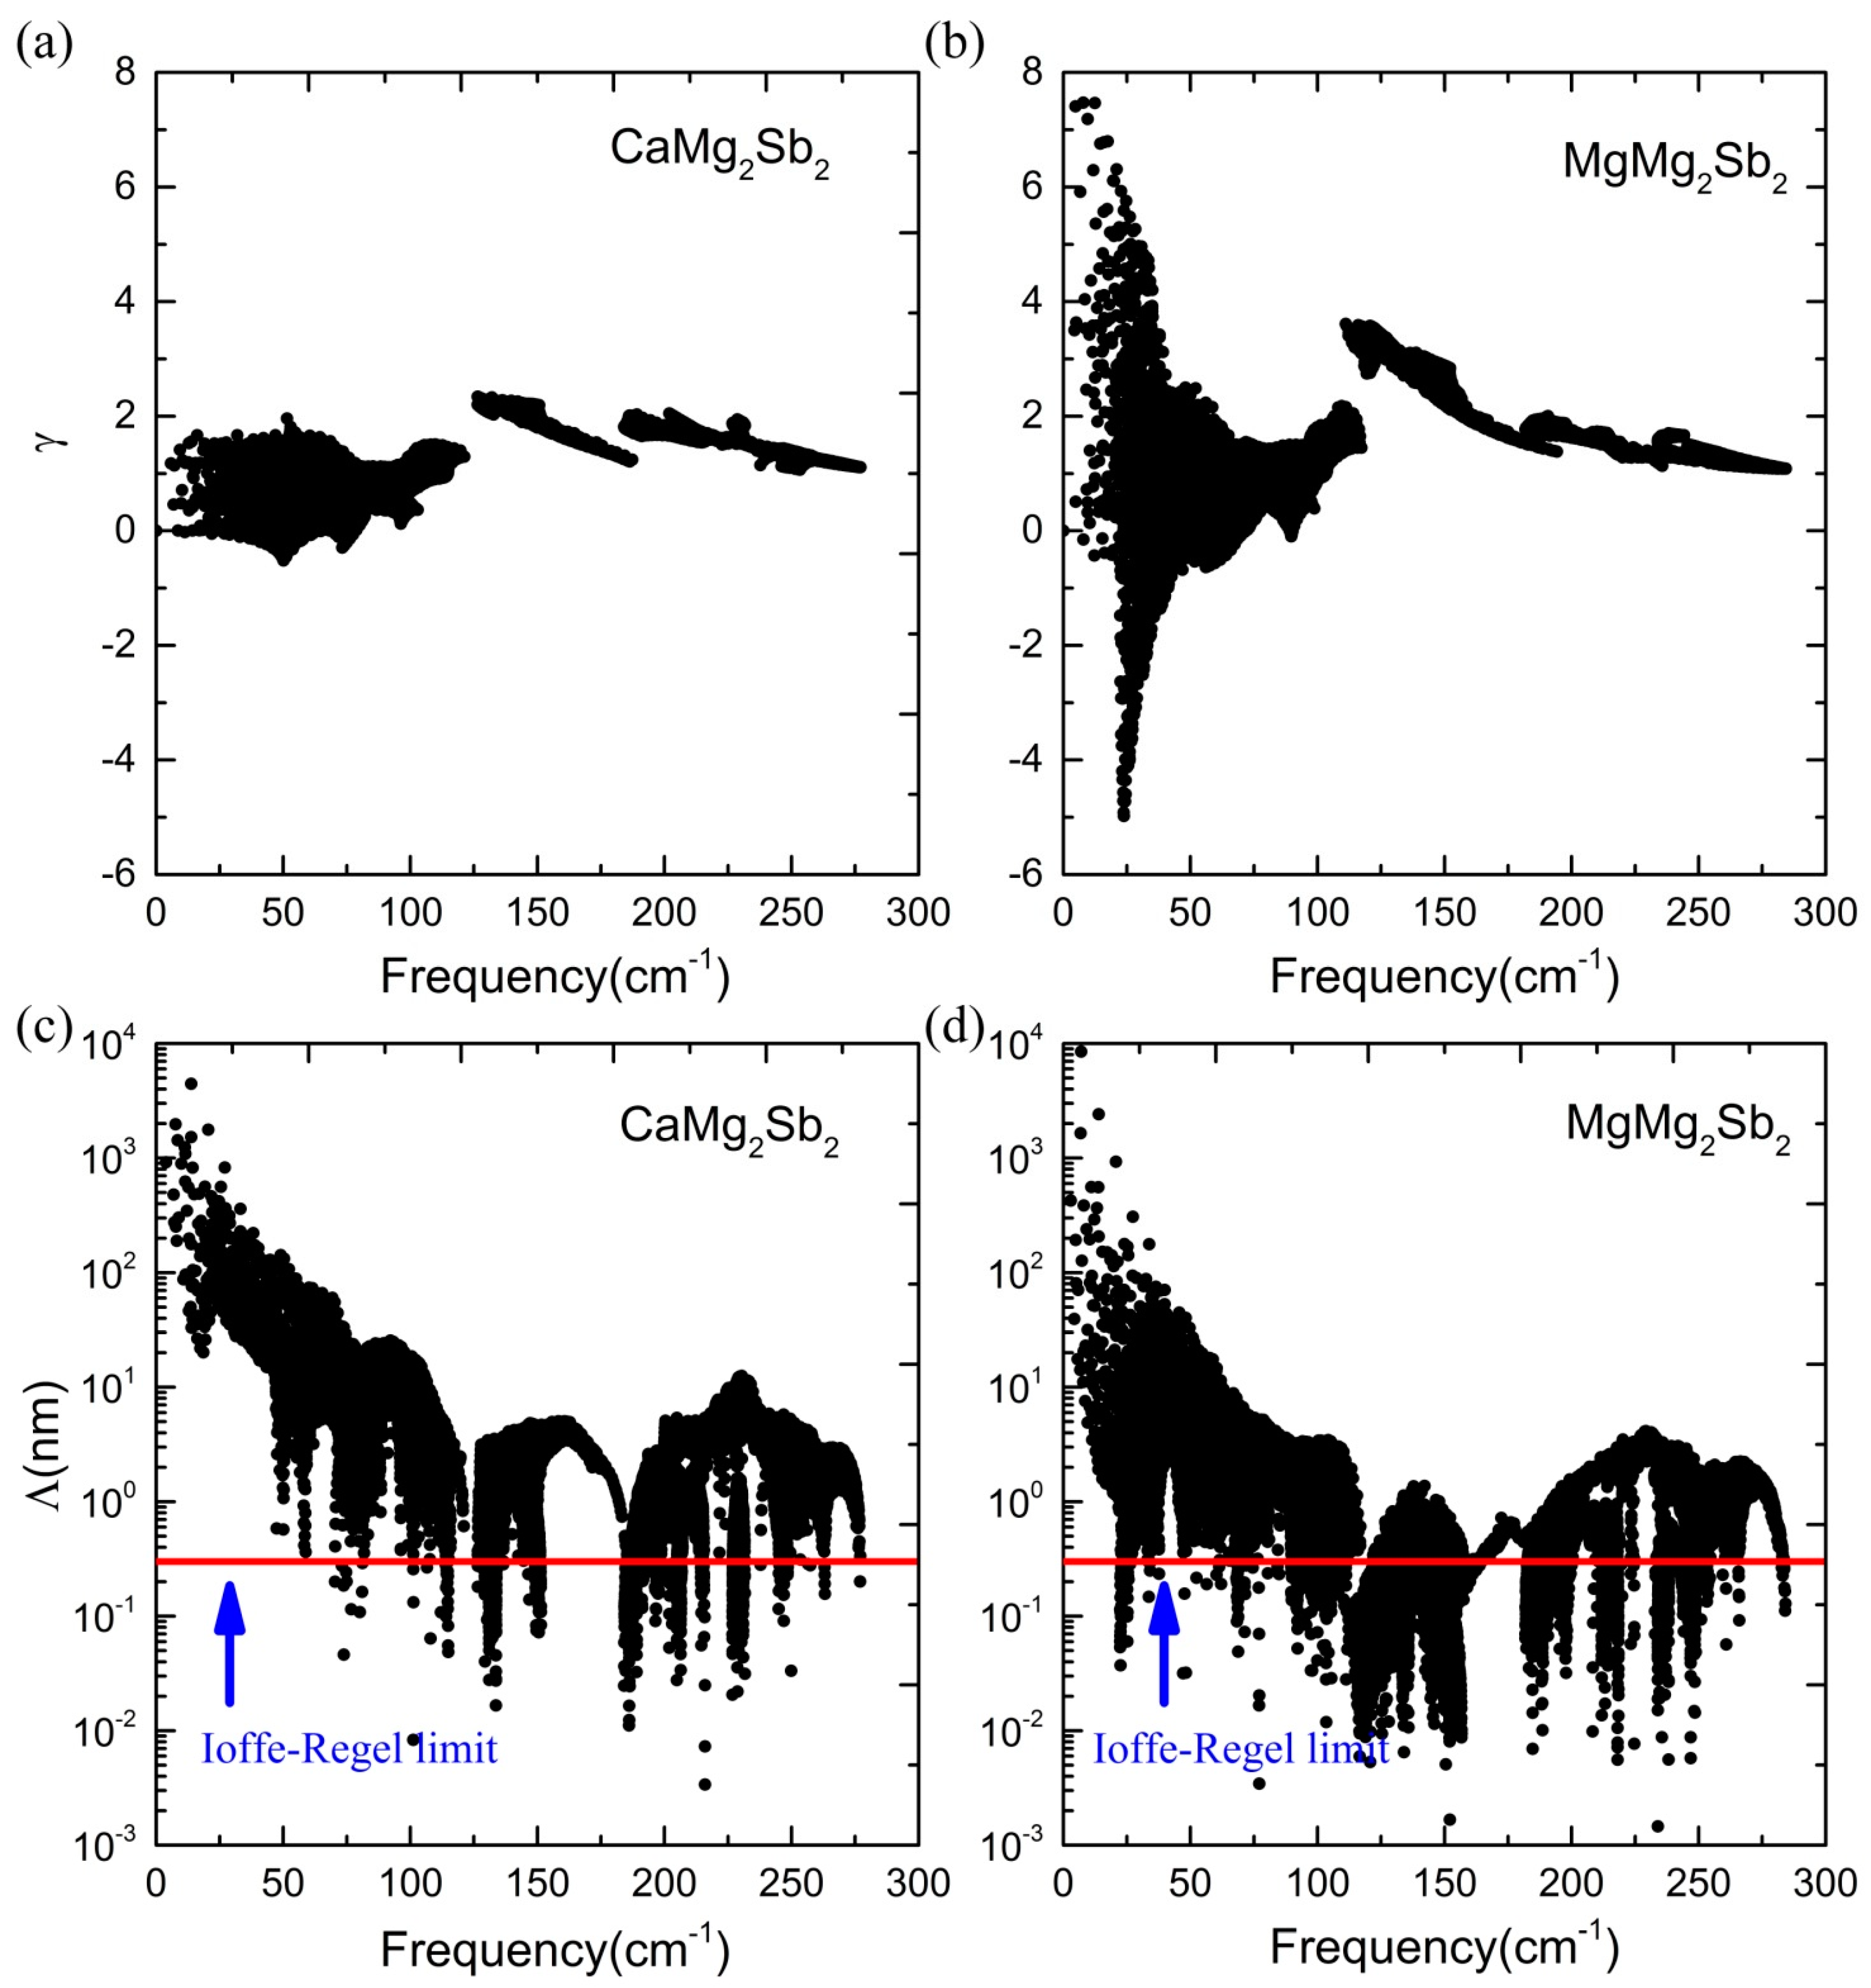
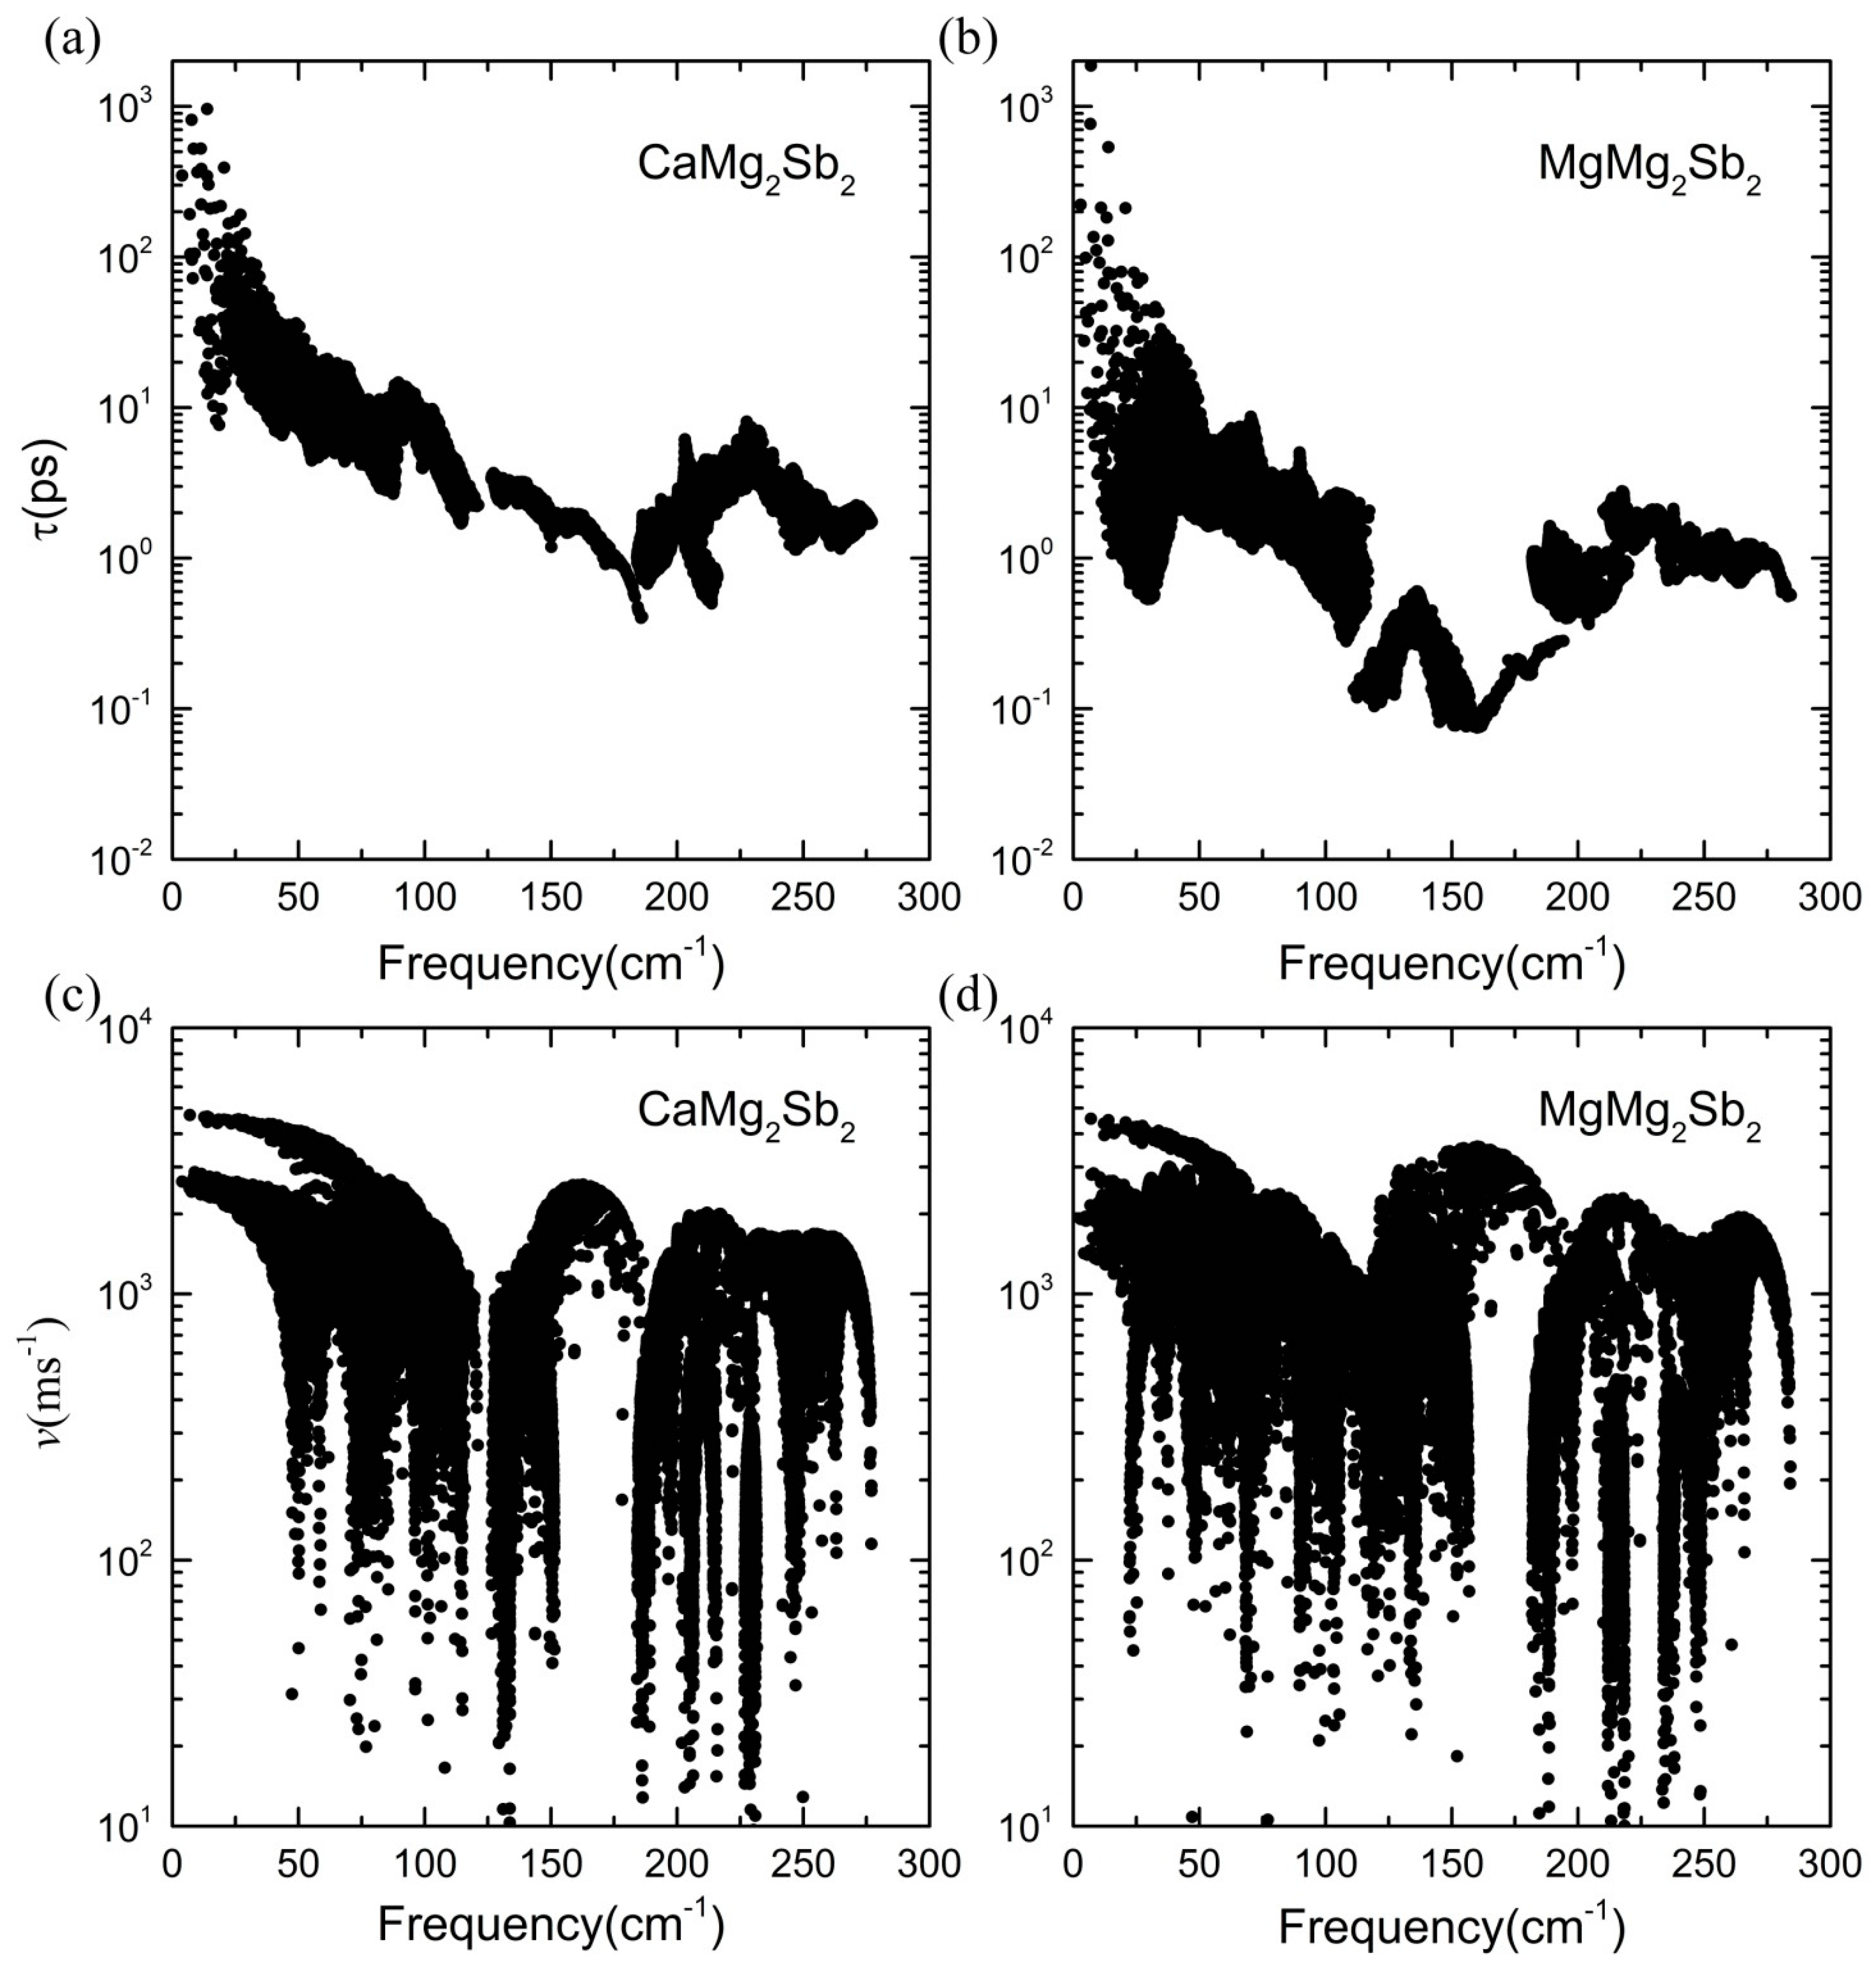
3.3. Lattice Thermal Conductivity

We now move on to investigate the physics behind the anomalously low κ L of MgMg2Sb2, compared with that of CaMg2Sb2. Figure 3 plots the calculated κ L s for the two compounds in the temperature range of 300 to 800 K. The force constants (FCs) used in the calculations are obtained at three different temperatures (0 K, 400 K, and 700 K), and the lattice dynamical effects of the fourth-order anharmonicity have also been considered. As seen in Figure 3a, the predicted κ L s for CaMg2Sb2 using 0 K force constants (harmonic description of the phonon energy and lifetime considering only three-phonon interactions) are quite close to the experimental data, and the temperature dependence of κ L largely follows the typical T−1 relationship, indicating that the dominant phonon scattering mechanism in this compound is the three-phonon scattering process. The calculated κ L s using the FCs extracted from AIMD at 400 K and 700 K, respectively, are almost the same as those obtained using the FCs at 0 K. To probe the anharmonic renormalization arising from high-order (or particularly quartic) anharmonicity in this compound, the κ L s are also obtained based on the self-consistent phonon (SCPH) theory including both three- and fourth-phonon interactions. The resulting κ L s show an even better agreement with the experimentally measured values. As for MgMg2Sb2, we note that calculations using the FCs at 0 K seriously underestimate the κ L s [see Figure 3b]. For example, the predicted κ L at 300 K is 1.0 Wm−1K−1, much less than the experimental value of 1.8 Wm−1K−1. Similar phenomena have also been reported in other simple crystalline compounds, such as Tl3VSe4 [8] and TlGaTe2 [9]. The calculated κ L s can be enhanced using the FCs extracted from AIMD at 400 K, but still much smaller than the experimentally measured ones. A significantly improved agreement with the experiments in both the magnitude and temperature dependence of κ L can be achieved by further including fourth-phonon processes [see 400 KMD_SCPH line in Figure 3b], indicating that the quartic anharmonicity should be taken into consideration to account for the unusual κ L of MgMg2Sb2. Again, we note that the calculated κ L shows a very small anisotropy for the two compounds considered here, with the out-of-plane κ L (along the c axis direction) marginally larger than the in-plane o n e (along the a or b axis direction), as shown in Figures S1 and S2 in the Supplemental Materials.
The spectra κ L s of the two compounds at 400 K and 700 K are displayed in Figure 3c,d and Figure S4, respectively. It can be seen that the overall κ L s are dominated by the phonons with frequencies of less than 100 cm−1 in both compounds. As seen from the calculated pDOS shown in Figure 2, the low-frequency phonons are mainly contributed to by Sb atoms in the two compounds. Furthermore, we note that, despite an almost isotropic κ L present in both compounds, the distribution of the spectrally decomposed κ L ω along the c axis is quite different from that in the ab plane. The κ L ω along the c axis shows a sharp peak at the low frequency side, corresponding to the lowest transverse acoustic branches at the M- and C-point (see Figure 2a,b). The corresponding vibration modes at the two points are illustrated in Figure 2c and Figure 2d, respectively, which clearly show that the displacement of Sb atoms dominates the soft vibrational modes at these q points.
To better understand the unusually low κ L of MgMg2Sb2, especially compared with the isostructural CaMg2Sb2, we further calculate the mode Grüneisen parameters ( γ q ) in the two compounds, which are defined as γ q = ln ω q / ln V and commonly used to characterize the extent of anharmonicity. Here, we use the FCs from the AIMD at 400 K and 700 K to calculate all γ q s, respectively. The resulting γ q s as a function of frequency at 400 K are shown in Figure 4a for the two compounds. It can be seen that MgMg2Sb2 has the largest absolute values of γ q in the low-frequency acoustic regime (≤75 cm−1), and the corresponding phonon modes contribute strongly to phonon–phonon scattering. In contrast, the large values of γ q for CaMg2Sb2 appear in the optical frequency range from 125 to 150 cm−1. The overall γ q s have a much larger absolute value in MgMg2Sb2 than in CaMg2Sb2 in the low- and medium-frequency range, while the values in the high-frequency region are close to each other. The similar features of γ q ω are also observed at 700 K, as displayed in Figure S5a,b. Considering that the phonon modes in the low- and medium-frequency regime are almost exclusively contributed by Sb and Mg1 or Ca atoms (see Figure 2a), one can infer that the anharmonicity of the Mg1-Sb interaction in MgMg2Sb2 is much stronger than that of Ca-Sb in CaMg2Sb2, which thus significantly suppress the κ L of MgMg2Sb2 relative to that of CaMg2Sb2, overcoming the expected mass trends between Mg and heavier Ca.
The distributions of the mean free path (MFP, Λ) at 400 K and 700 K are shown in Figure 4c,d and Figure S5c,d, respectively. It can be seen that the low-frequency phonons have the longest MFPs at both temperatures in the two compounds, and the overall MFP in MgMg2Sb2 is relatively shorter than that in CaMg2Sb2, but it is still much larger than the so-called Ioffe–Regel limit in the low-frequency regime (≤100 cm−1). Since the MFP depends on the combined effects of phonon velocity and lifetime, we also compare the phonon velocity and lifetime of the two compounds at 400 K and 700 K in Figure 5 and Figure S6, respectively. It can be found that the phonon group velocities of MgMg2Sb2 are very close to the counterparts of CaMg2Sb2 in the whole frequency range, while the overall phonon lifetime in MgMg2Sb2 is smaller than that in CaMg2Sb2.

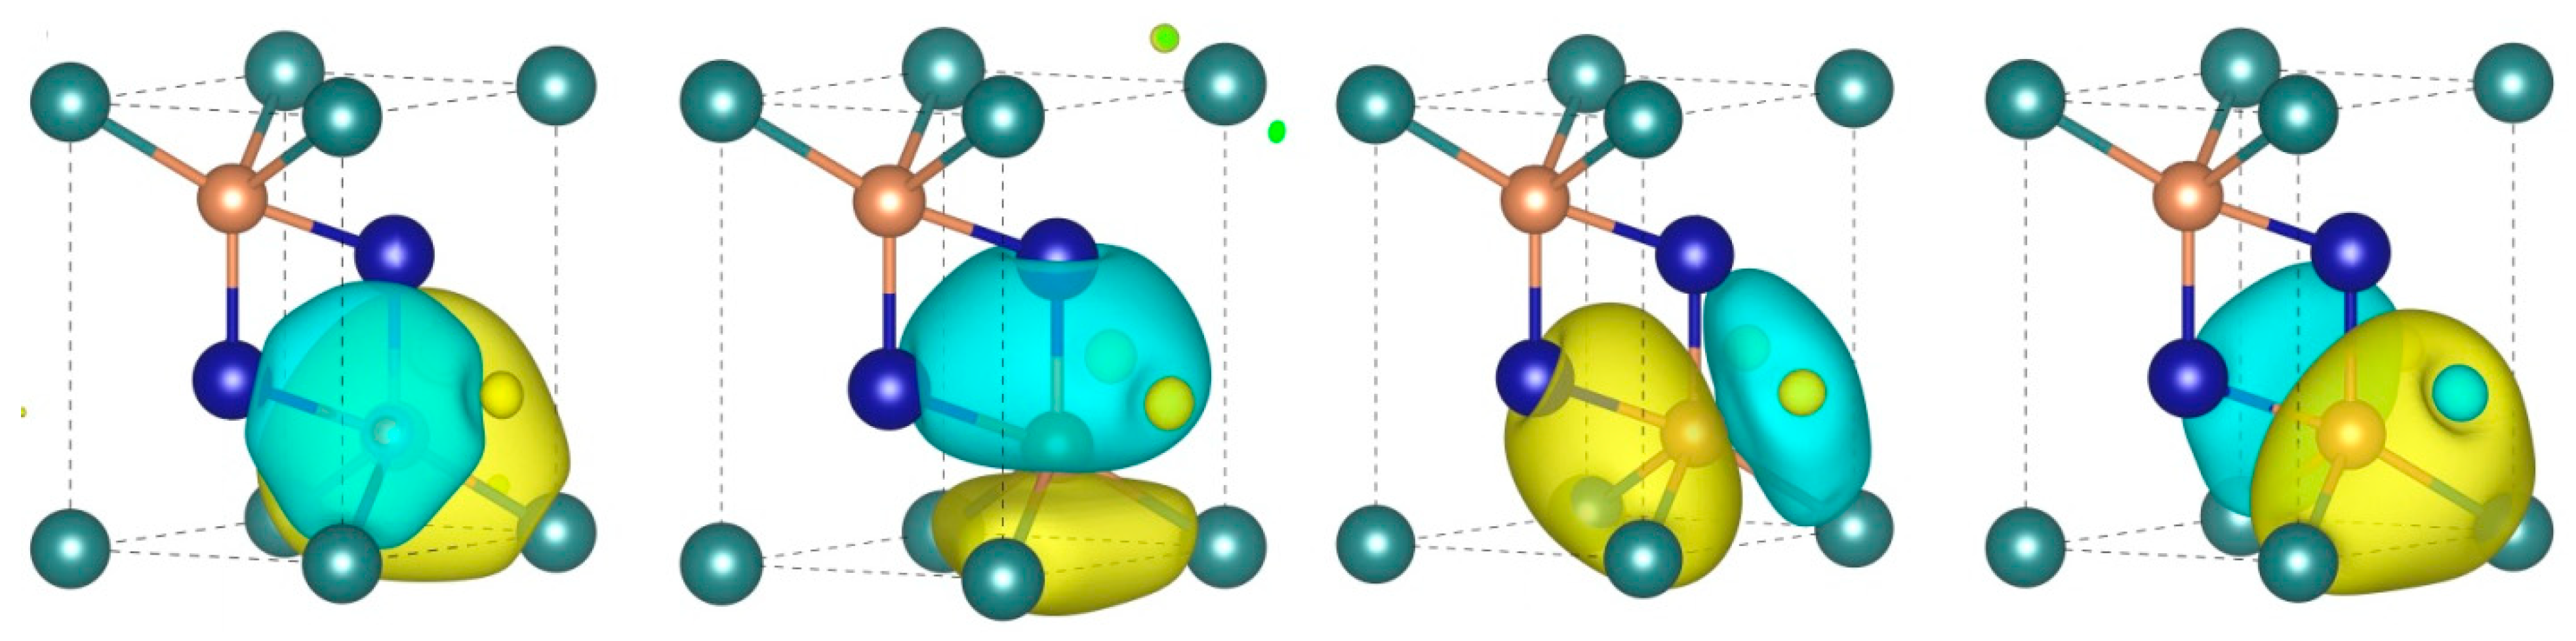
3.4. Chemical Bonding

The above analyses show that κ L s of XMg2Sb2 compounds are mainly contributed by the low-frequency phonon modes, which are dominated by the vibrations of Sb atoms. It is thus unexpected that replacing X-site Mg1 with Ca can dramatically affect the phonon transport and yield a threefold increase in the κ L in CaMg2Sb2. To provide further insight into the anomalous behavior of κ L in XMg2Sb2, we first explore the direct bonding character in the two compounds. As shown in Figure 1, the three nonequivalent atoms X, Mg, and Sb have quite different coordination environments: the X-site is coordinated by six equivalent Sb atoms, and Mg in the anionic [Mg2Sb2]2− layer is coordinated by four Sb atoms forming vertical bonds (parallel to the c axis) d Mg - Sb 1 and tilt bonds d Mg - Sb 2 . So intuitively, it may be thought that the anionic [Mg2Sb2]2− layer and the cationic X ions layer are bridged by the Sb atoms. Detailed information on these bonds is presented in Table 1. It can be found that the bond lengths of d Mg - Sb 1 in the two compounds are almost the same despite the fact sthat the cell volume of MgMg2Sb2 has contracted about 9.6% in comparison with CaMg2Sb2, implying that the chemical bond difference of these two compounds mainly comes from d X - Sb and d Mg - Sb 2 . To further understand the nature of the chemical bond formed in these two compounds, we turn to the maximally localized Wannier functions (MLWFs).
The obtained MLWFs around one Sb atom are plotted in Figure 6, and the other MLWFs can be found in Figure S7. The ingredients, MLWF centers (WFC) offset distance (dWFC-X et al.), and spreads (Ω) featured in the MLWFs are listed in Table 1. All of the MLWFs show s-p electron hybridization, consistent with the valence configuration of Ca, Mg, and Sb species. For both of our considered compounds, the WFCs are located quite nearby the atom site (See Figure S8), indicating that the chemical bonding of these two compounds is almost ionic, consistent with the more sophisticated topological electron density analysis [38]. However, a subtle difference still exists for these two compounds. Compared with the Sb atoms, the MLWFs of X and Mg atoms are more localized indicating that the iconicity of these atoms is stronger. The MLWFs around the Sb atoms definitely indicate that the Sb atoms bridge the X and Mg atoms. For the X ions layer, compared with MgMg2Sb2, d WFC - X and Ω X of the Ca atoms are much larger than for the Mg1 atom, since the Ca atoms have a large radius. For the [Mg2Sb2]2− layer, MLWFs ( d WFC - X and Ω X , Table 1) of Mg atoms do not show any difference in these two compounds, while the difference of these two compounds mainly originates from the Sb atoms. The WFC-atom distance and spread of MLWF for the Sb atom (Table 1) show that the Sb atom in MgMg2Sb2 is a little more covalent than Sb in the CaMg2Sb2 compound. This assertion is in agreement with the discussion of the Born effective charge and Bader charge.

4. Summary and Conclusions

To summarize, the lattice dynamics-related properties of the layer-like zintl compounds XMg2Sb2 (X = Mg1 or Ca) have been investigated using the first-principle-based phonon self-consistent and Boltzmann transport theory method. Contrary to intuition, the anisotropy of lattice dynamics-related properties of these two compounds turns out to be very small, suggesting that XMg2Sb2 (X = Mg1 or Ca) are intrinsically more bulk-like materials. The anharmonicity of MgMg2Sb2 is much larger than that of CaMg2Sb2. The modest anharmonicity of CaMg2Sb2 renders the three-phonon process dominant, leading to its intrinsic lattice thermal conductivity ( κ L ) of approximately T−1 trend and faint temperature dependence. The strong anharmonicity of MgMg2Sb2 results in fierce temperature dependence of its atomic interaction and the significance of the high-order (fourth order) phonon process to accurately predicate its κ L . The mollification of MgMg2Sb2  κ L form T−1 trend is caused by a combination effect of temperature and high-order anharmonicity. The κ L for both of our compounds are mainly carried by low-frequency acoustic phonon modes, dominantly occupied by the vibration of Sb atoms. The chemical bond analysis shows that, contrary to the other atoms, the chemical bonds around Sb atoms are a little bit more covalent. We conclude that although the vibration of X atoms does not directly contribute to the κ L , its electronegativity can tune the ionicity (covalency) of the chemical bond around the Sb atoms. Compared with Ca, Mg disturbs the bonds around Sb atoms by adding a little more covalency to it, leading to MgMg2Sb2 having more anharmonicity.

Supplementary Materials

The following supporting information can be downloaded at: https://www.mdpi.com/article/10.3390/ma16237349/s1. Figure S1: Lattice thermal conductivity of MgMg2Sb2 calculated using the force constant obtained at 0 K (a), 400 K (b) and 700 K (c). Figure S2: Lattice thermal conductivity of CaMg2Sb2 calculated using the force constant obtained at 0 K (a), 400 K (b) and 700 K (c). Figure S3: Non-normalized eigenvector representations for XMg2Sb2 (X=Mg or Ca) compounds at Γ point. The remaining modes are acoustic modes. Figure S4: Spectra of thermal conductivity at 700 K temperature for CaMg2Sb2 (a) and MgMg2Sb2 (b). Figure S5: Grüneisen parameters, and mean free path vs. frequency obtained from the data calculated using the 700 K ab initio MD calculated force constants. (a) Grüneisen parameters for CaMg2Sb2, (b) Grüneisen parameters for MgMg2Sb2, (c) mean free path for CaMg2Sb2, and (d) mean free path for MgMg2Sb2. Figure S6: Lifetime, and phonon group velocity vs. frequency obtained from the data calculated using the 700 K ab initio MD calculated force constants. (a) lifetime for CaMg2Sb2, (b) lifetime for MgMg2Sb2, (c) velocity for CaMg2Sb2, and (d) velocity for MgMg2Sb2. Figure S7: The MLWFs of XMg2Sb2 compound. Due to the symmetry and the similarity of the MLWFs contour for both of our considered compounds, we only shown the MLWFs around of one X (a), Mg (b) and Sb (c) atoms. Figure S8: MLWF center (WFC) distribution for XMg2Sb2 (X=Mg or Ca) compounds. The small red ball denotes the site of the WFC.

Author Contributions

Conceptualization, M.W.; Methodology, M.W.; Formal analysis, M.W. and L.H.; Data curation, H.Y. and F.X.; Writing—original draft, M.W.; Writing—review & editing, L.H. All authors have read and agreed to the published version of the manuscript.

Funding

This work was funded by the National Natural Science Foundation of China (Grant Nos. 12004152 and 11774142), the key Program of Natural Science Foundation of Fujian Province, China (Grant No. 2020J02047), the Guangdong Provincial key Lab program (No. 2019B030301001), and the Shenzhen Basic Research Fund under Grant. No. JCYJ20180504165817769. The computer time was partially supported by the Center for Computational Science and Engineering of Southern University of Science and Technology.

Institutional Review Board Statement

Not applicable.

Informed Consent Statement

Not applicable.

Data Availability Statement

The data will be supplied if asked for.

Conflicts of Interest

The authors declare no conflict of interest.

References

  1. Cahill, D.G.; Ford, W.K.; Goodson, K.E.; Mahan, G.D.; Majumdar, A.; Maris, H.J.; Merlin, R.; Phillpot, S.R. Nanoscale thermal transport. J. Appl. Phys. 2002, 93, 793–818. [Google Scholar] [CrossRef]
  2. Snyder, G.J.; Toberer, E.S. Complex thermoelectric materials. Nat. Mater. 2008, 7, 105–114. [Google Scholar] [CrossRef] [PubMed]
  3. Bell, L.E. Cooling, Heating, Generating Power, and Recovering Waste Heat with Thermoelectric Systems. Science 2008, 321, 1457–1461. [Google Scholar] [CrossRef] [PubMed]
  4. Ziman, J.M. Electrons and Phonons: The Theory of Transport Phenomena in Solids; Oxford University Press: Oxford, UK, 1960. [Google Scholar]
  5. Qian, X.; Zhou, J.; Chen, G. Phonon-engineered extreme thermal conductivity materials. Nat. Mater. 2021, 20, 1188–1202. [Google Scholar] [CrossRef]
  6. Poudel, B.; Hao, Q.; Ma, Y.; Lan, Y.; Minnich, A.; Yu, B.; Yan, X.; Wang, D.; Muto, A.; Vashaee, D. High-thermoelectric perfor-mance of nanostructured bismuth antimony telluride bulk alloys. Science 2008, 320, 634–638. [Google Scholar] [CrossRef]
  7. Heremans, J.P.; Jovovic, V.; Toberer, E.S.; Saramat, A.; Kurosaki, K.; Charoenphakdee, A.; Yamanaka, S.; Snyder, G.J. Enhancement of thermoelectric efficiency in PbTe by distortion of the electronic density of states. Science 2008, 321, 554–557. [Google Scholar] [CrossRef]
  8. Mukhopadhyay, S.; Parker, D.S.; Sales, B.C.; Puretzky, A.A.; McGuire, M.A.; Lindsay, L. Two-channel model for ultralow thermal conductivity of crystalline Tl3VSe4. Science 2018, 360, 1455. [Google Scholar] [CrossRef]
  9. Wu, M.; Huang, L.E. Unusual lattice thermal conductivity in the simple crystalline compounds TlXTe2 (X=Ga,In). Phys. Rev. B 2019, 100, 075207. [Google Scholar] [CrossRef]
  10. Pei, Y.; Chang, C.; Wang, Z.; Yin, M.; Wu, M.; Tan, G.; Wu, H.; Chen, Y.; Zheng, L.; Gong, S. Multiple converged conduction bands in K2Bi8Se13: A promising thermoelectric material with extremely low thermal conductivity. J. Am. Chem. Soc. 2016, 138, 16364–16371. [Google Scholar] [CrossRef]
  11. Brown, S.R.; Kauzlarich, S.M.; Gascoin, F.; Snyder, G.J. Yb14MnSb11: New high efficiency thermoelectric material for power generation. Chem. Mater. 2006, 18, 1873–1877. [Google Scholar] [CrossRef]
  12. Christensen, M.; Abrahamsen, A.B.; Christensen, N.B.; Juranyi, F.; Andersen, N.H.; Lefmann, K.; Andreasson, J.; Bahl, C.R.H.; Iversen, B.B. Avoided crossing of rattler modes in thermoelectric materials. Nat. Mater. 2008, 7, 811–815. [Google Scholar] [CrossRef] [PubMed]
  13. Sales, B.C.; Mandrus, D.; Williams, R.K. Filled Skutterudite Antimonides: A New Class of Thermoelectric Materials. Science 1996, 272, 1325–1328. [Google Scholar] [CrossRef] [PubMed]
  14. Condron, C.L.; Kauzlarich, S.M.; Gascoin, F.; Snyder, G.J. Thermoelectric properties and microstructure of Mg3Sb2. J. Solid State Chem. 2006, 179, 2252–2257. [Google Scholar] [CrossRef]
  15. Mao, J.; Shuai, J.; Song, S.; Wu, Y.; Dally, R.; Zhou, J.; Liu, Z.; Sun, J.; Zhang, Q.; Cruz, C.D.; et al. Manipulation of ionized impurity scattering for achieving high thermoelectric performance in n-type Mg3Sb2-based materials. Proc. Natl. Acad. Sci. USA 2017, 114, 10548–10553. [Google Scholar] [CrossRef] [PubMed]
  16. Zhang, J.; Song, L.; Iversen, B.B. Insights into the design of thermoelectric Mg3Sb2 and its analogs by combining theory and experiment. Npj Comput. Mater. 2019, 5, 76. [Google Scholar] [CrossRef]
  17. Toberer, E.S.; May, A.F.; Snyder, G.J. Zintl Chemistry for Designing High Efficiency Thermoelectric Materials. Chem. Mater. 2010, 22, 624–634. [Google Scholar] [CrossRef]
  18. Bhardwaj, A.; Rajput, A.; Shukla, A.K.; Pulikkotil, J.J.; Srivastava, A.K.; Dhar, A.; Gupta, G.; Auluck, S.; Misra, D.K.; Budhani, R.C. Mg3Sb2-based Zintl compound: A non-toxic, inexpensive and abundant thermoelectric material for power generation. RSC Adv. 2013, 3, 8504–8516. [Google Scholar] [CrossRef]
  19. Peng, W.; Petretto, G.; Rignanese, G.-M.; Hautier, G.; Zevalkink, A. An Unlikely Route to Low Lattice Thermal Conductivity: Small Atoms in a Simple Layered Structure. Joule 2018, 2, 1879–1893. [Google Scholar] [CrossRef]
  20. Zhu, Y.; Xia, Y.; Wang, Y.; Sheng, Y.; Yang, J.; Fu, C.; Li, A.; Zhu, T.; Luo, J.; Wolverton, C. Violation of the T−1 Relationship in the Lattice Thermal Conductivity of Mg3Sb2 with Locally Asymmetric Vibrations. Research 2020, 2020, 4589786. [Google Scholar] [CrossRef]
  21. Hafner, J. Ab-initio simulations of materials using VASP: Density-functional theory and beyond. J. Comput. Chem. 2008, 29, 2044. [Google Scholar] [CrossRef]
  22. Perdew, J.P.; Wang, Y. Accurate and simple analytic representation of the electron-gas correlation energy. Phys. Rev. B 1992, 45, 13244–13249. [Google Scholar] [CrossRef] [PubMed]
  23. Marzari, N.; Mostofi, A.A.; Yates, J.R.; Souza, I.; Vanderbilt, D. Maximally localized Wannier functions: Theory and applications. Rev. Mod. Phys. 2012, 84, 1419. [Google Scholar] [CrossRef]
  24. Mostofi, A.A.; Yates, J.R.; Lee, Y.-S.; Souza, I.; Vanderbilt, D.; Marzari, N. wannier90: A tool for obtaining maximally-localised Wannier functions. Comput. Phys. Commun. 2008, 178, 685–699. [Google Scholar] [CrossRef]
  25. Zhou, F.; Nielson, W.; Xia, Y.; Ozoliņš, V. Lattice Anharmonicity and Thermal Conductivity from Compressive Sensing of First-Principles Calculations. Phys. Rev. Lett. 2014, 113, 185501. [Google Scholar] [CrossRef] [PubMed]
  26. Tadano, T.; Gohda, Y.; Tsuneyuki, S. Anharmonic force constants extracted from first-principles molecular dynamics: Ap-plications to heat transfer simulations. J. Phys. Condens. Mattter. 2014, 26, 225402. [Google Scholar] [CrossRef]
  27. Tadano, T.; Tsuneyuki, S. Self-consistent phonon calculations of lattice dynamical properties in cubic SrTiO3 with first-principles anharmonic force constants. Phys. Rev. B 2015, 92, 054301. [Google Scholar] [CrossRef]
  28. Wood, M.; Aydemir, U.; Ohno, S.; Snyder, G.J. Observation of valence band crossing: The thermoelectric properties of CaZn2Sb2–CaMg2Sb2 solid solution. J. Mater. Chem. A 2018, 6, 9437–9444. [Google Scholar] [CrossRef]
  29. Martinez-Ripoll, M.; Haase, A.; Brauer, G. The crystal structure of α-Mg3Sb2. Acta Crystallogr. Sect. B Struct. Crystallogr. Cryst. Chem. 1974, 30, 2006–2009. [Google Scholar] [CrossRef]
  30. Jia, T.; Chen, G.; Zhang, Y. Lattice thermal conductivity evaluated using elastic properties. Phys. Rev. B 2017, 95, 155206. [Google Scholar] [CrossRef]
  31. Golesorkhtabar, R.; Pavone, P.; Spitaler, J.; Puschnig, P.; Draxl, C. ElaStic: A tool for calculating second-order elastic constants from first principles. Comput. Phys. Commun. 2013, 184, 1861–1873. [Google Scholar] [CrossRef]
  32. Tian, Z.; Garg, J.; Esfarjani, K.; Shiga, T.; Shiomi, J.; Chen, G. Phonon conduction in PbSe, PbTe, and PbTe1-xSex from first-principles calculations. Phys. Rev. B 2012, 85, 184303. [Google Scholar] [CrossRef]
  33. Ji, H.S.; Togo, A.; Kaviany, M.; Tanaka, I.; Shim, J.H. Low phonon conductivity of layered BiCuOS, BiCuOSe, and BiCuOTe from first principles. Phys. Rev. B 2016, 94, 115203. [Google Scholar] [CrossRef]
  34. Xiao, Y.; Chang, C.; Pei, Y.; Wu, D.; Peng, K.; Zhou, X.; Gong, S.; He, J.; Zhang, Y.; Zeng, Z.; et al. Origin of low thermal conductivity in SnSe. Phys. Rev. B 2016, 94, 125203. [Google Scholar] [CrossRef]
  35. Chi, H.; Kim, H.; Thomas, J.C.; Shi, G.; Sun, K.; Abeykoon, M.; Bozin, E.S.; Shi, X.; Li, Q.; Shi, X.; et al. Low-temperature structural and transport anomalies in Cu2Se. Phys. Rev. B 2014, 89, 195209. [Google Scholar] [CrossRef]
  36. Kanno, T.; Tamaki, H.; Yoshiya, M.; Uchiyama, H.; Maki, S.; Takata, M.; Miyazaki, Y. High-Density Frenkel Defects as Origin of N-Type Thermoelectric Performance and Low Thermal Conductivity in Mg3Sb2-Based Materials. Adv. Funct. Mater. 2021, 31, 2008469. [Google Scholar] [CrossRef]
  37. Ding, J.; Lanigan-Atkins, T.; Calderón-Cueva, M.; Banerjee, A.; Abernathy, D.L.; Said, A.; Zevalkink, A.; Delaire, O. Soft an-harmonic phonons and ultralow thermal conductivity in Mg3(Sb, Bi)2 thermoelectrics. Sci. Adv. 2021, 7, eabg1449. [Google Scholar] [CrossRef] [PubMed]
  38. Zhang, J.; Song, L.; Sist, M.; Tolborg, K.; Iversen, B.B. Chemical bonding origin of the unexpected isotropic physical properties in thermoelectric Mg3Sb2 and related materials. Nat. Commun. 2018, 9, 4716. [Google Scholar] [CrossRef]
Figure 1. (a) Supercell (4 × 4 × 3 of the unit cell) of XMg2Sb2 (X = Mg1, Ca) compounds. Please note that we added a superscript to the Mg atom at the X position. (b) The primitive cell and (c) the symmetric point of the first Brillion Zone.
Materials 16 07349 g001
Figure 2. Phonon dispersions and atomic project density of phonon state (pod’s) of CaMg2Sb2 (a) and MgMg2Sb2 (b). For phonon dispersion, the green line denotes the result of 0 K, the blue line 400 K, and the red line 700 K. The pDOS are obtained from the phonon dispersion of the result at 0 K. Please note that the color of the pDos line is not related to the temperature. (c,d) Vibration modes of the lowest acoustic mode at M and C points. In (e), the blue line is the phonon dispersion at 300 K obtained by the self-consistent phonon method and the red points are the experimental results obtained from ref. [36].
Materials 16 07349 g002
Figure 3. Thermal conductivity vs. temperature for CaMg2Sb2 (a) and MgMg2Sb2 (b). The experimental results are obtained from reference [20,28]. Spectra of thermal conductivity at 400 K temperature for CaMg2Sb2 (c) and MgMg2Sb2 (d). The 700 K MD results for spectra shown in Figure S4.
Materials 16 07349 g003
Figure 4. Grüneisen parameters and mean free path vs. frequency obtained from the data calculated using the 400 K ab initio MD calculated force constants. The red line denotes the Ioffe–Regel limit. The 700 K MD results are shown in Figure S5. (a) Grüneisen parameters for CaMg2Sb2, (b) Grüneisen parameters MgMg2Sb2, (c) mean free path for CaMg2Sb2, and (d) mean free path for MgMg2Sb2.
Materials 16 07349 g004
Figure 5. Phonon lifetime and group velocity vs. frequency obtained from the data calculated using the 400 K ab initio MD calculated force constants. The 700 K MD results are shown in Figure S6. (a) lifetime for CaMg2Sb2, (b) lifetime MgMg2Sb2, (c) group velocity for CaMg2Sb2, and (d) group velocity for MgMg2Sb2.
Materials 16 07349 g005
Figure 6. The MLWFs of one Sb atom in MgMg2Sb2 compound. We only show one of the Sb atoms since the MLWFs for the other Sb atom are the same due to symmetry. As the MLWFs contour for both of our considered compounds are alike, we only show the case of MgMg2Sb2. However, the reader can find all of the MLWFs in Figure S7. We also show the distribution of the MLWF center in Figure S8.
Materials 16 07349 g006
Table 1. Lattice parameters, direct chemical bond distance ( d X - Sb , d Mg - Sb 1 and d Mg - Sb 2 in Å), Wannier Function center (WFC) offset distance (dWFC-Sb, dWFC-Mg, and dWFC-X in Å) and Spread (Ω, Å2), elastic constants Cij, bulk (B), shear (G), and Yang (E) moduli (in GPa), elastic constants derived longitudinal, transversal, and average sound velocity (vl vt  v ¯ in m/s) as well as Debye temperature (ΘD in K) for XMg2Sb2 (X = Mg1, Ca) compounds.
CompoundLattice Constant Direct Chemical BondMLWF
A (Å)c/a d X - Sb d Mg - Sb 1 d Mg - Sb 2 dWFC-SbdWFC-MgdWFC-XΩMgΩXΩSb
CaMg2Sb24.69
4.65 a
1.62
1.63 a
3.282.942.870.75, 0.82 * 0.180.320.140.432.91, 3.34 *
MgMg2Sb24.60
4.58 b
1.58
1.58 b
3.112.932.820.72, 0.88 *0.180.180.140.143.15, 3.50 *
Elastic properties
C11C12C13C33C44C23C55BGE v L v T v ¯ ΘD
CaMg2Sb277.927.020.966.125.420.926.740.026.064.04423
4330 a
2610
2716 a
353634.1
MgMg2Sb271.037.021.776.017.021.714.042.118.247.740992147296028.8
a Ref. [28], b ref. [29]. * denote the corresponding MLWF stretched along the c direction.
Table 2. The calculated optical phonon frequency at the high-symmetry point Γ along with the mode symmetries, characters, and description of involved atoms in the eigen displacements (Figure S3 in Supplemental Materials) at different temperatures. The direction of atom vibrations a, b and c refer to Figure 1a. Δω = ω (T, SCPH) − ω (T). ω (T, SCPH) means the phonon frequency calculated using phonon self-consistent method.
ModeT(K)CaMg2Sb2MgMg2Sb2
ϖ (cm−1)Involved Atoms: Directionϖ (cm−1)Involved Atoms: Direction
DFTΔωDFTΔω
Eg
(R, 1)
074.0-Mg, mainly Sb: One Mg, Sb pair a (b), One Mg, Sb pair minus a (b)67.6-Mg, mainly Sb: One Mg, Sb pair a (b), One Mg, Sb pair minus a (b)
30074.10.471.20.2
70074.60.269.81.9
A1g
(R)
0114.3-Sb: One Sb c, One Sb minus c112.3-Sb: One Sb c, One Sb minus c
300114.21.1112.91.1
700114.12.2114.61.3
Eu
(IR, TO)
0130.6-mainly Ca, Sb: Ca a, Sb minus a116.9-mainly Mg1, Sb:Mg1a, Sb minus a
300131.54.1127.19.4
700132.47.8131.614.6
Eu
(IR, LO)
0143.4-mainly Ca, Sb: Ca b, Sb minus b150.6-mainly Mg1, Sb:Mg1 b, Sb minus b
300143.93.9155.56.9
700144.57.0158.211.1
A2u
(IR, 1)
0148.3-All, Ca(most): Ca c, Sb minus c, Mg c135.5-All, Mg1 (most): Mg1 c, Sb minus c, Mg c
300149.53.8143.66.7
700151.46.5148.79.1
A1g
(R)
0206.6-Mg: One Mg c, One Mg minus c206.7-Mg: One Mg c, One Mg minus c
300206.83.5208.32.2
700206.56.4209.35.3
Eu
(IR, TO)
0215.6-Sb, Mg(most): Mg a, Sb minus a214.8-Sb, Mg(most): Mg a, Sb minus a
300214.52.2218.1−0.8
700217.33.0219.4−0.2
Eu
(IR, LO)
0231.6-Sb, Mg(most): Mg b, Sb minus b231.8-Sb, Mg(most): Mg b, Sb minus b
300230.93.0233.91.5
700234.34.3234.82.4
Eg
(R, TO)
0231.6-Sb, Mg(most): one Mg and Sb pair a, One Mg and Sb pair minus a, 231.8-Sb, Mg(most): one Mg and Sb pair a, One Mg and Sb pair minus a
300230.93.0233.91.5
700234.34.3234.82.4
Eg
(R, LO)
0248.6-Sb, Mg(most): one Mg and Sb pair b, One Mg and Sb pair minus b246.5-Sb, Mg(most): one Mg and Sb pair b, One Mg and Sb pair minus b
300247.81.9251.3−0.1
700250.03.1253.00.7
A2u
(IR)
0239.5-Ca, Mg: Ca c, Mg minus c239.2-Mg1, Mg: Mg1 c, Mg minus c
300237.82.7236.71.2
700238.54.5230.83.4
Table 3. Calculated Born effective (Z*), ionic charge Z B * (obtained by Bader method), optical (ε) and static (ε0) dielectric constants, and longitudinal, transversal (vl, vt in m/s), and average sound velocity [ ( v a + v b + v c ) / 3 ] obtained from the phonon dispersion at room temperature for XMg2Sb2 (X = Mg1 or Ca) compounds.
Compounds ( Z X * ,   Z X * ) Z B * ( ε , ε ) ( ε 0 , ε 0 ) ( v l , v t ) (m/s)
XMgSbXMgSb a/bcAve.
CaMg2Sb2(2.52, 2.75)(1.87, 1.74)(−3.14, −3.11)1.382.00−2.69(6.56, 8.03)(11.0, 11.0)(2575, 4657)(2644, 4749)(2598, 4687)
MgMg2Sb2(3.34, 3.20)(1.91, 1.84)(−3.58, −3.44)2.002.00−3.00(4.97, 6.41)(15.2, 16.3)(1756, 4434)(1782, 4636)(1765, 4501)
Disclaimer/Publisher’s Note: The statements, opinions and data contained in all publications are solely those of the individual author(s) and contributor(s) and not of MDPI and/or the editor(s). MDPI and/or the editor(s) disclaim responsibility for any injury to people or property resulting from any ideas, methods, instructions or products referred to in the content.

