
Biomass Pyrolysis-Derived Biochar: A Versatile Precursor for Graphene Synthesis


 , ,
, ,  ,
,  , and
, and
Abstract
:1. Introduction
2. Materials and Methods
2.1. Chemicals & Materials
2.2. Procedures
2.2.1. Pyrolysis
2.2.2. Modification of the Obtained Biochar
2.3. Analyses
3. Results
3.1. Analysis of Biomass and Selection of for Pyrolysis
3.2. Pyrolysis of B-WC/O Biomass Sample
3.3. Valorization of Biochar and Its Graphene-like Derivates
4. Conclusions
Supplementary Materials
Author Contributions
Funding
Informed Consent Statement
Data Availability Statement
Conflicts of Interest
References
- Allen, M.J.; Tung, V.C.; Kaner, R.B. Honeycomb Carbon: A Review of Graphene. Chem. Rev. 2010, 110, 132–145. [Google Scholar] [CrossRef] [PubMed]
- Urade, A.R.; Lahiri, I.; Suresh, K.S. Graphene Properties, Synthesis and Applications: A Review. JOM 2023, 75, 614–630. [Google Scholar] [CrossRef] [PubMed]
- Bahri, M.; Gebre, S.H.; Elaguech, M.A.; Dajan, F.T.; Sendeku, M.G.; Tlili, C.; Wang, D. Recent advances in chemical vapour deposition techniques for graphene-based nanoarchitectures: From synthesis to contemporary applications. Coord. Chem. Rev. 2023, 475, 214910. [Google Scholar] [CrossRef]
- Novoselov, K.S.; Geim, A.K.; Morozov, S.V.; Jiang, D.; Zhang, Y.; Dubonos, S.V.; Grigorieva, I.V.; Firsov, A.A. Electric Field Effect in Atomically Thin Carbon Films. Science 2004, 306, 666–669. [Google Scholar] [CrossRef] [PubMed]
- Farid, M.A.A.; Andou, Y. A route towards graphene from lignocellulosic biomass: Technicality, challenges, and their prospective applications. J. Clean. Prod. 2022, 380, 135090. [Google Scholar] [CrossRef]
- Aunkor, M.T.H.; Mahbubul, I.M.; Saidur, R.; Metselaar, H.S.C. The green reduction of graphene oxide. RSC Adv. 2016, 6, 27807. [Google Scholar] [CrossRef]
- Zhang, P.; Li, Z.; Zhang, S.; Shao, G. Recent Advances in Effective Reduction of Graphene Oxidefor Highly Improved Performance Toward Electrochemical Energy Storage. Energy Environ. Mater. 2018, 1, 5–12. [Google Scholar] [CrossRef]
- Yan, Y.; Nashath, F.Z.; Chen, S.; Manickam, S.; Lim, S.S.; Zhao, H.; Lester, E.; Wu, T.; Pang, C.H. Synthesis of graphene: Potential carbon precursors and approaches. Nanotechnol. Rev. 2020, 9, 1284–1314. [Google Scholar] [CrossRef]
- International Institute for Sustainability Analysis and Strategy (IINAS); European Forest Institute (EFI); Joanneum Research (JR). Forest Biomass for Energy in the EU: Current Trends, Carbon Balance and Sustainable Potential; Final Report; International Institute for Sustainability Analysis and Strategy (IINAS): Darmstadt, Germany; Madrid, Spain; European Forest Institute (EFI): Joensuu, Finland; Joanneum Research (JR): Graz, Austria, 2014. [Google Scholar]
- International Council on Clean Transportation, The European Commission’s Renewable Energy Proposal for 2030; Policy Update. 2017. Available online: http://www.theicct.org/sites/default/files/publications/RED%20II_ICCT_Policy-Update_vF_jan2017.pdf (accessed on 23 October 2023).
- Vuppaladadiyam, A.K.; Vuppaladadiyam, S.S.V.; Sikarwar, V.S.; Ahmad, E.; Pant, K.K.; Murugavelh, S.; Pandey, A.; Bhattacharya, S.; Sarmah, A.; Leu, S.-Y. A critical review on biomass pyrolysis: Reaction mechanisms, process modeling and potential challenges. J. Energy Inst. 2023, 108, 101236. [Google Scholar] [CrossRef]
- Ran, T.; Li, J.; Liao, H.; Zhao, Y.; Yang, G.; Long, J. Effects of biochar amendment on bacterial communities and their function predictions in a microplastic-contaminated Capsicum annuum L. soil. Environ. Technol. Innov. 2023, 31, 103174. [Google Scholar] [CrossRef]
- Liu, J.; Zhang, W.; Jin, H.; Li, Z.; Liu, G.; Xing, F.; Tang, L. Exploring the carbon capture and sequestration performance of biochar-artificial aggregate using a new method. Sci. Total Environ. 2023, 859, 160423. [Google Scholar] [CrossRef] [PubMed]
- Al Masud, A.; Shin, W.S.; Sarker, A.; Septian, A.; Das, K.; Deepo, D.M.; Iqbal, M.A.; Islam, A.R.T.; Malafaia, G. A critical review of sustainable application of biochar for green remediation: Research uncertainty and future directions. Sci. Total Environ. 2023, 904, 166813. [Google Scholar] [CrossRef]
- Wang, Y.; Ma, C.; Kong, D.; Lian, L.; Liu, Y. Review on application of algae-based biochars in environmental remediation: Progress, challenge and perspectives. J. Environ. Chem. Eng. 2023, 11, 111263. [Google Scholar] [CrossRef]
- Ghogia, A.C.; Romero Millán, L.M.; White, C.E.; Nzihou, A. Synthesis and Growth of Green Graphene from Biochar Revealed by Magnetic Properties of Iron Catalyst. ChemSusChem 2023, 16, e202201864. [Google Scholar] [CrossRef] [PubMed]
- Mishra, R.; Kumar, A.; Singh, E.; Kumari, A.; Kumar, S. Synthesis of graphene oxide from biomass waste: Characterization and volatile organic compounds removal. Process Saf. Environ. Prot. 2023, 180, 800–807. [Google Scholar] [CrossRef]
- Kovačić, M.; Perović, K.; Papac, J.; Tomić, A.; Matoh, L.; Žener, B.; Brodar, T.; Capan, I.; Surca, A.K.; Kušić, H.; et al. One-pot synthesis of sulfur-doped TiO2/reduced graphene oxide composite (S-TiO2/rGO) with improved photocatalytic activity for the removal of Diclofenac from water. Materials 2020, 13, 1621. [Google Scholar] [CrossRef]
- Dimiev, A.M.; Bachilo, S.M.; Saito, R.; Tour, J.M. Reversible Formation of Ammonium Persulfate/Sulfuric Acid Graphite Intercalation Compounds and Their Peculiar Raman Spectra. ACS Nano 2012, 6, 7842–7849. [Google Scholar] [CrossRef]
- EN 14918:2009; Solid Biofuels—Determination of Calorific Value. 2009. Available online: https://repozitorij.hzn.hr/norm/HRN+EN+14918%3A2010 (accessed on 6 October 2023).
- ISO 13878:1998; Soil Quality—Determination of Total Nitrogen Content by Dry Combustion (Elemental Analysis). ISO: Geneva, Switzerland, 1998. Available online: https://repozitorij.hzn.hr/norm/HRN+ISO+13878%3A2004 (accessed on 6 October 2023).
- ISO 10694:1995; Soil Quality—Determination of Organic and Total Carbon after dry Combustion (Elementary Analysis). ISO: Geneva, Switzerland, 1995. Available online: https://repozitorij.hzn.hr/norm/HRN+ISO+10694%3A2004 (accessed on 6 October 2023).
- ISO 15178:2000; Soil Quality—Determination of Total Sulfur by dry Combustion. ISO: Geneva, Switzerland, 2000. Available online: https://www.iso.org/standard/26682.html (accessed on 6 October 2023).
- EN 15104:2011; Solid Biofuels—Determination of Total Content of Carbon, Hydrogen and Nitrogen—Instrumental Methods. 2011. Available online: https://repozitorij.hzn.hr/norm/HRN+EN+15104%3A2011 (accessed on 6 October 2023).
- Radić, G.; Šajnović, I.; Petrović, Ž.; Kraljić Roković, M. Reduced Graphene Oxide/α-Fe2O3 Fibres as Active Material for Supercapacitor Application. Croat. Chem. Acta 2018, 91, 481–490. [Google Scholar] [CrossRef]
- Raic, M.; Sacer, D.; Kraljic Rokovic, M. Structural and capacitive properties of graphene obtained by a green method of graphene oxide reduction. Chem. Biochem. Eng. Q. 2019, 33, 385–393. [Google Scholar] [CrossRef]
- Saidur, R.; Abdelaziz, E.A.; Demirbas, A.; Hossain, M.S.; Mekhilef, S. A review on biomass as a fuel for boilers. Renew. Sustain. Energy Rev. 2011, 15, 2262–2289. [Google Scholar] [CrossRef]
- Wang, M.; Zhang, S.-L.; Duan, P.-G. Slow pyrolysis of biomass: Effects of effective hydrogen-to-carbon atomic ratio of biomass and reaction atmospheres. Energ Source Part A 2023, 45, 2637–2650. [Google Scholar] [CrossRef]
- Ambrosi, A.; Chee, S.Y.; Khezri, B.; Webster, R.D.; Sofer, Z.; Pumera, M. Metallic Impurities in Graphenes Prepared from Graphite Can Dramatically Influence Their Properties. Angew. Chem. Int. Ed. 2012, 51, 500–503. [Google Scholar] [CrossRef] [PubMed]
- Reddy, K.R.; Spokas, K. Characteristics and Applications of Biochar for Environmental Remediation: A Review. Crit. Rev. Environ. 2015, 45, 939–969. [Google Scholar]
- Uddin, M.N.; Techato, K.; Taweekun, J.; Rahman, M.M.; Rasul, M.G.; Mahlia, T.M.I.; Ashrafur, S.M. An Overview of Recent Developments in Biomass Pyrolysis Technologies. Energies 2018, 11, 3115. [Google Scholar] [CrossRef]
- Agilent Application Note 5991-6590EN: Validation of a Confirmatory GC/MS/MS Method for Dioxins and Dioxin-Like PCBS to Meet the Requirements of EU Regulation 709/2014, 2016. Available online: https://www.agilent.com/cs/library/applications/5991-6590EN.pdf (accessed on 8 October 2023).
- Scialli, A.R.; Watkins, D.K.; Ginevan, M.E. Agent Orange Exposure and 2,3,7,8-Tetrachlorodibenzo-p-Dioxin (TCDD) in Human Milk. Birth Defects Res. B Dev. Reprod. Toxicol. 2015, 104, 29–139. [Google Scholar] [CrossRef]
- Eskenazi, B.; Warner, M.; Brambilla, P.; Signorini, S.; Ames, J.; Mocarelli, P. The Seveso accident: A look at 40 years of health research and beyond. Environ. Int. 2018, 121, 71–84. [Google Scholar] [CrossRef]
- Rimkute, G.; Gudaitis, M.; Barkauskas, J.; Zarkov, A.; Niaura, G.; Gaidukevic, J. Synthesis and Characterization of Graphite Intercalation Compounds with Sulfuric Acid. Crystals 2022, 12, 421. [Google Scholar] [CrossRef]
- Ljubek, G.; Čapeta, D.; Šrut Rakić, I.; Kraljić Roković, M. Energetically efficient and electrochemically tuneable exfoliation of graphite: Process monitoring and product characterization. J. Mater. Sci. 2021, 56, 10859–10875. [Google Scholar] [CrossRef]
- Karim, N.A.; Ramli, M.M.; Ghazali, C.M.R.; Mothar, M.N. Synthetic graphite production of oil palm trunk chip at various heating rate via pyrolisis process. Mater. Today Proc. 2019, 16, 2088–2095. [Google Scholar] [CrossRef]
- Perumbilavil, S.; Sankar, P.; Rode, T.P.; Philip, R. White light Z-scan measurements of ultrafast optical nonlinearity in reduced graphene oxide nanosheets in the 400–700 nm region. Appl. Phys. Lett. 2015, 107, 051104. [Google Scholar] [CrossRef]
- Zgang, C.; Zhang, Z.; Zhang, L.; Li, Q.; Li, C.; Chen, G.; Zhang, S.; Liu, Q.; Hu, X. Evolution of the functionalities and structures of biochar in pyrolysis of poplar in a wide temperature range. Bioresour. Technol. 2020, 304, 123002. [Google Scholar]
- Sačer, D.; Čapeta, D.; Šrut Rakić, I.; Peter, R.; Petravić, M.; Kraljić Roković, M. Tailoring polypyrrole supercapacitive properties by intercalation of graphene oxide within the layer. Electrochim. Acta 2016, 193, 311–320. [Google Scholar] [CrossRef]
- Sun, Y.; Zhang, J.P.; Wen, C.; Zhang, L. An enhanced approach for biochar preparation using fluidized bed and its application for H2S removal. Chem. Eng. Process. 2016, 104, 1–12. [Google Scholar] [CrossRef]


| B-G | B-CS | B-BS | B-WC/O | B-WC/S | |
|---|---|---|---|---|---|
| Calorific values (MJ kg−1) | |||||
| 17.04 (±0.11) | 19.98 (±0.10) | 22.25 (±0.14) | 19.39 (±0.18) | 19.76 (±0.16) | |
| Elemental analysis | |||||
| C, % | 46.7 | 55.9 | 53.0 | 52.1 | 51.3 |
| H, % | 8.5 | 10.5 | 10.0 | 9.1 | 8.6 |
| O, % | 40.8 | 30.8 | 33.3 | 38.8 | 40.0 |
| N, % | 3.2 | 2.5 | 3.3 | <0.1 | <0.1 |
| S, % | 0.2 | 0.2 | 0.2 | <0.1 | <0.1 |
| effective hydrogen-to-carbon atomic ratio (H/Ceff) | |||||
| 0.87 | 1.43 | 1.32 | 0.98 | 0.84 | |
| Group Name | Compound Name | Retention Time |
|---|---|---|
| Dioxins and Furans | 2,5-dimethylfuran | 3.117 |
| 2,3-dihydro-5,6-dimethyl-1,4-dioxine | 14.703 | |
| Phenols | 2-methoxyphenol | 12.329 |
| 4-ethyl-2-methoxyhenol | 15.418 | |
| Aldehydes | hydroxyacetaldehyde | 2.319 |
| pentadecanal | 18.443 | |
| Ketones | 1-penten-3-one | 4.107 |
| 1,2-cyclopentanedione | 9.112 | |
| Aliphatic acids | formic acid | 2.127 |
| acetic acid | 2.814 | |
| Other hydrocarbons | 3,5-dimethoxy-4-hydroxytoluene | 17.866 |
| triacontane | 22.816 | |
| N-containing hydrocarbons | 2,4-diaminopyrimidine | 10.193 |
| 2,2-diethyl-3-methyl-oxazolidine | 10.908 |
| Mw | Compound Name | 400 °C | 600 °C | 800 °C | ||
|---|---|---|---|---|---|---|
| Area | Area | % | Area | % | ||
| 96 | furfural | 22,383,206 | 13,850,372 | 61.9 | 7,599,849 | 34.0 |
| 120.15 | phthalan | 321,587 | 300,774 | 93.5 | 461,073 | 143.4 |
| 98.1 | 2-furanmethanol | 10,442,656 | 6,337,734 | 60.7 | 3,497,492 | 33.5 |
| 319.9 | 2,3,7,8-TCDD | 169,125 | 177,125 | 104.7 | / | / |
| 339.9 | 1,2,3,7,8-penta CDD | 326,782 | 263,358 | 80.6 | / | / |
| 355.9 | 2,3,4,7,8-penta CDF | 346,348 | 262,520 | 75.8 | / | / |
| 301.9 | 13C-PCB (169, 52, 80, 81) | 1,149,042 | 1,216,012 | 105.8 | 6425 | 0.6 |
| 289.9 | PCB (52, 81, 77, 153, 138, 167, 156, 157) | 69,184 | 74,981 | 108.4 | / | / |
| 325.9 | PCB (101, 123, 118, 114, 105) 13C6-1234-TCDD | 306,252 | 276,334 | 90.2 | / | / |
| 303.9 | 13C-12378-PeCDD | 164,730 | 157,342 | 95.5 | / | / |
| 200 | 13C-PCB 28 | 82,622 | 73,534 | 89.0 | 34,906 | 42.3 |
| 303.8 | 13C-PCB (153, 138, 167, 156) | 161,931 | 131,856 | 81.4 | / | / |
| 285.9 | 13C-23478-PeCDF 13C-12378-PeCDF | 152,855 | 213,608 | 139.8 | / | / |
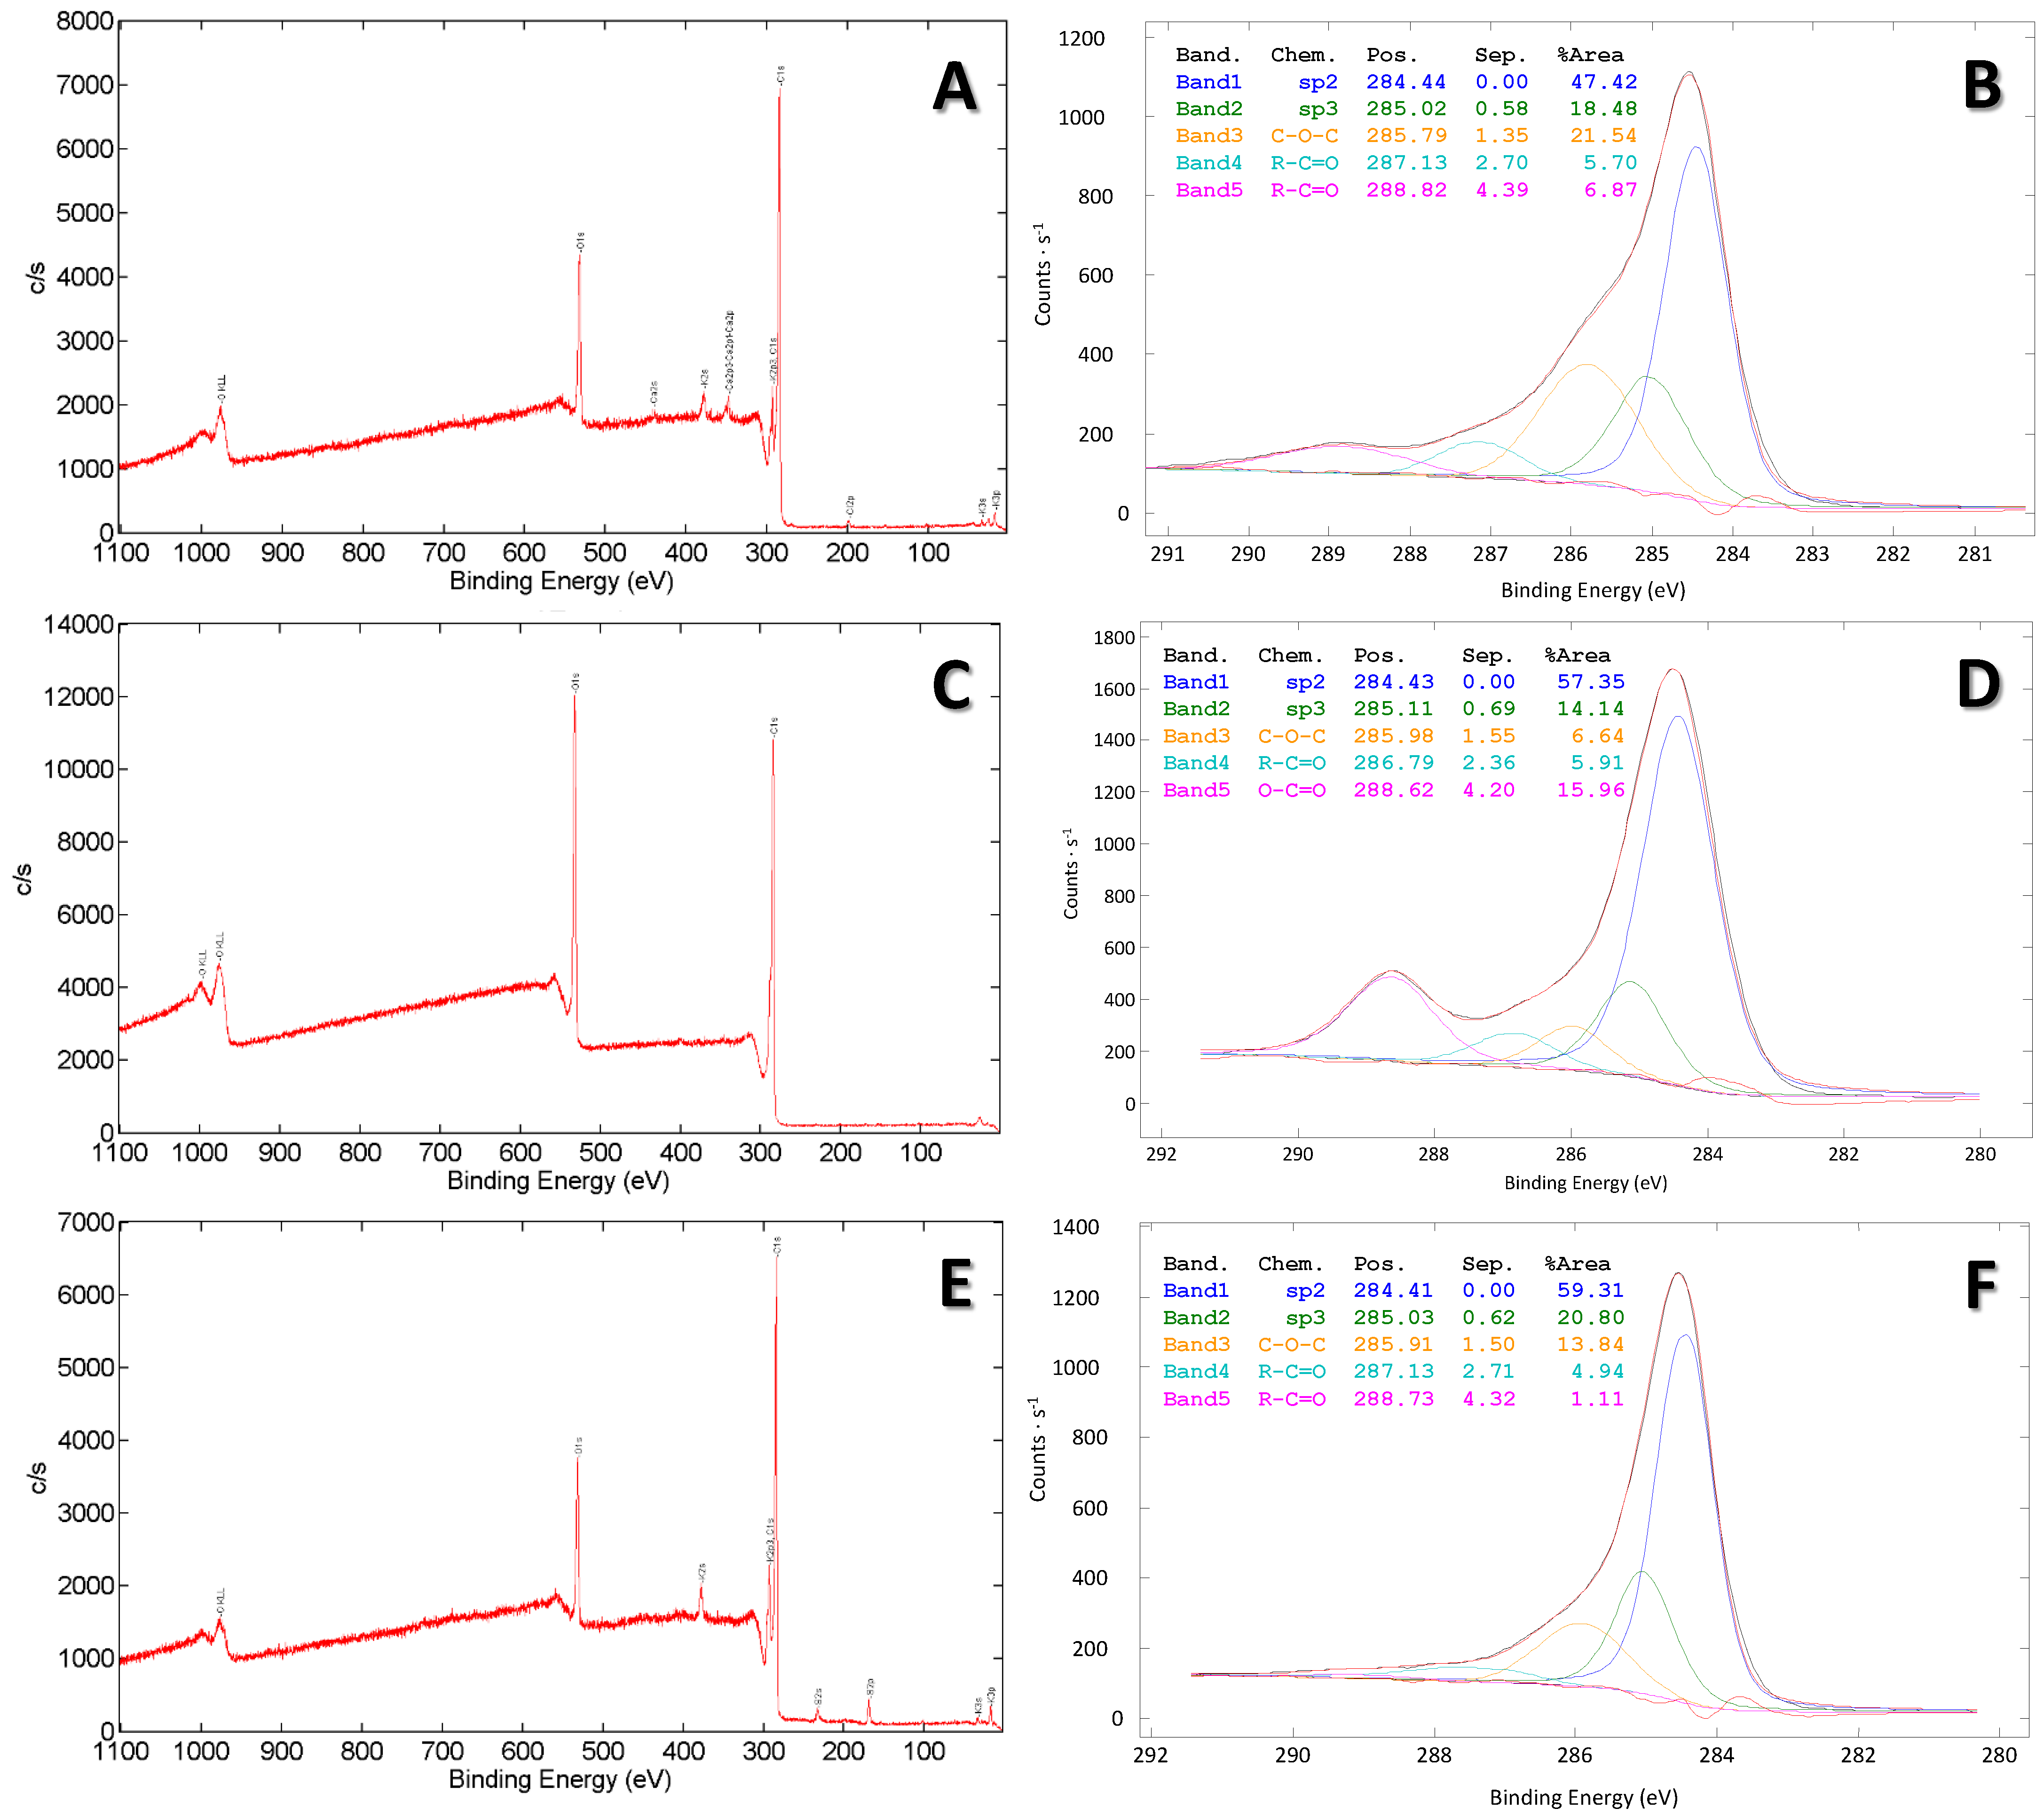
| Biochar Type | sp2 | sp3 | C-O-C/C-OH | R-C=O/O-C-O | R-C=O/O-C-O | O-C=O/CO3 | ID/IG |
|---|---|---|---|---|---|---|---|
| pristine | 47.42 | 18.48 | 21.54 | 5.70 | 6.87 | / | 0.95 |
| Modified by Hummers | 57.35 | 14.14 | 6.64 | 5.91 | / | 15.96 | 0.89 |
| Modified by persulfate | 59.31 | 20.80 | 13.84 | 4.94 | 1.11 | / | 0.95 |
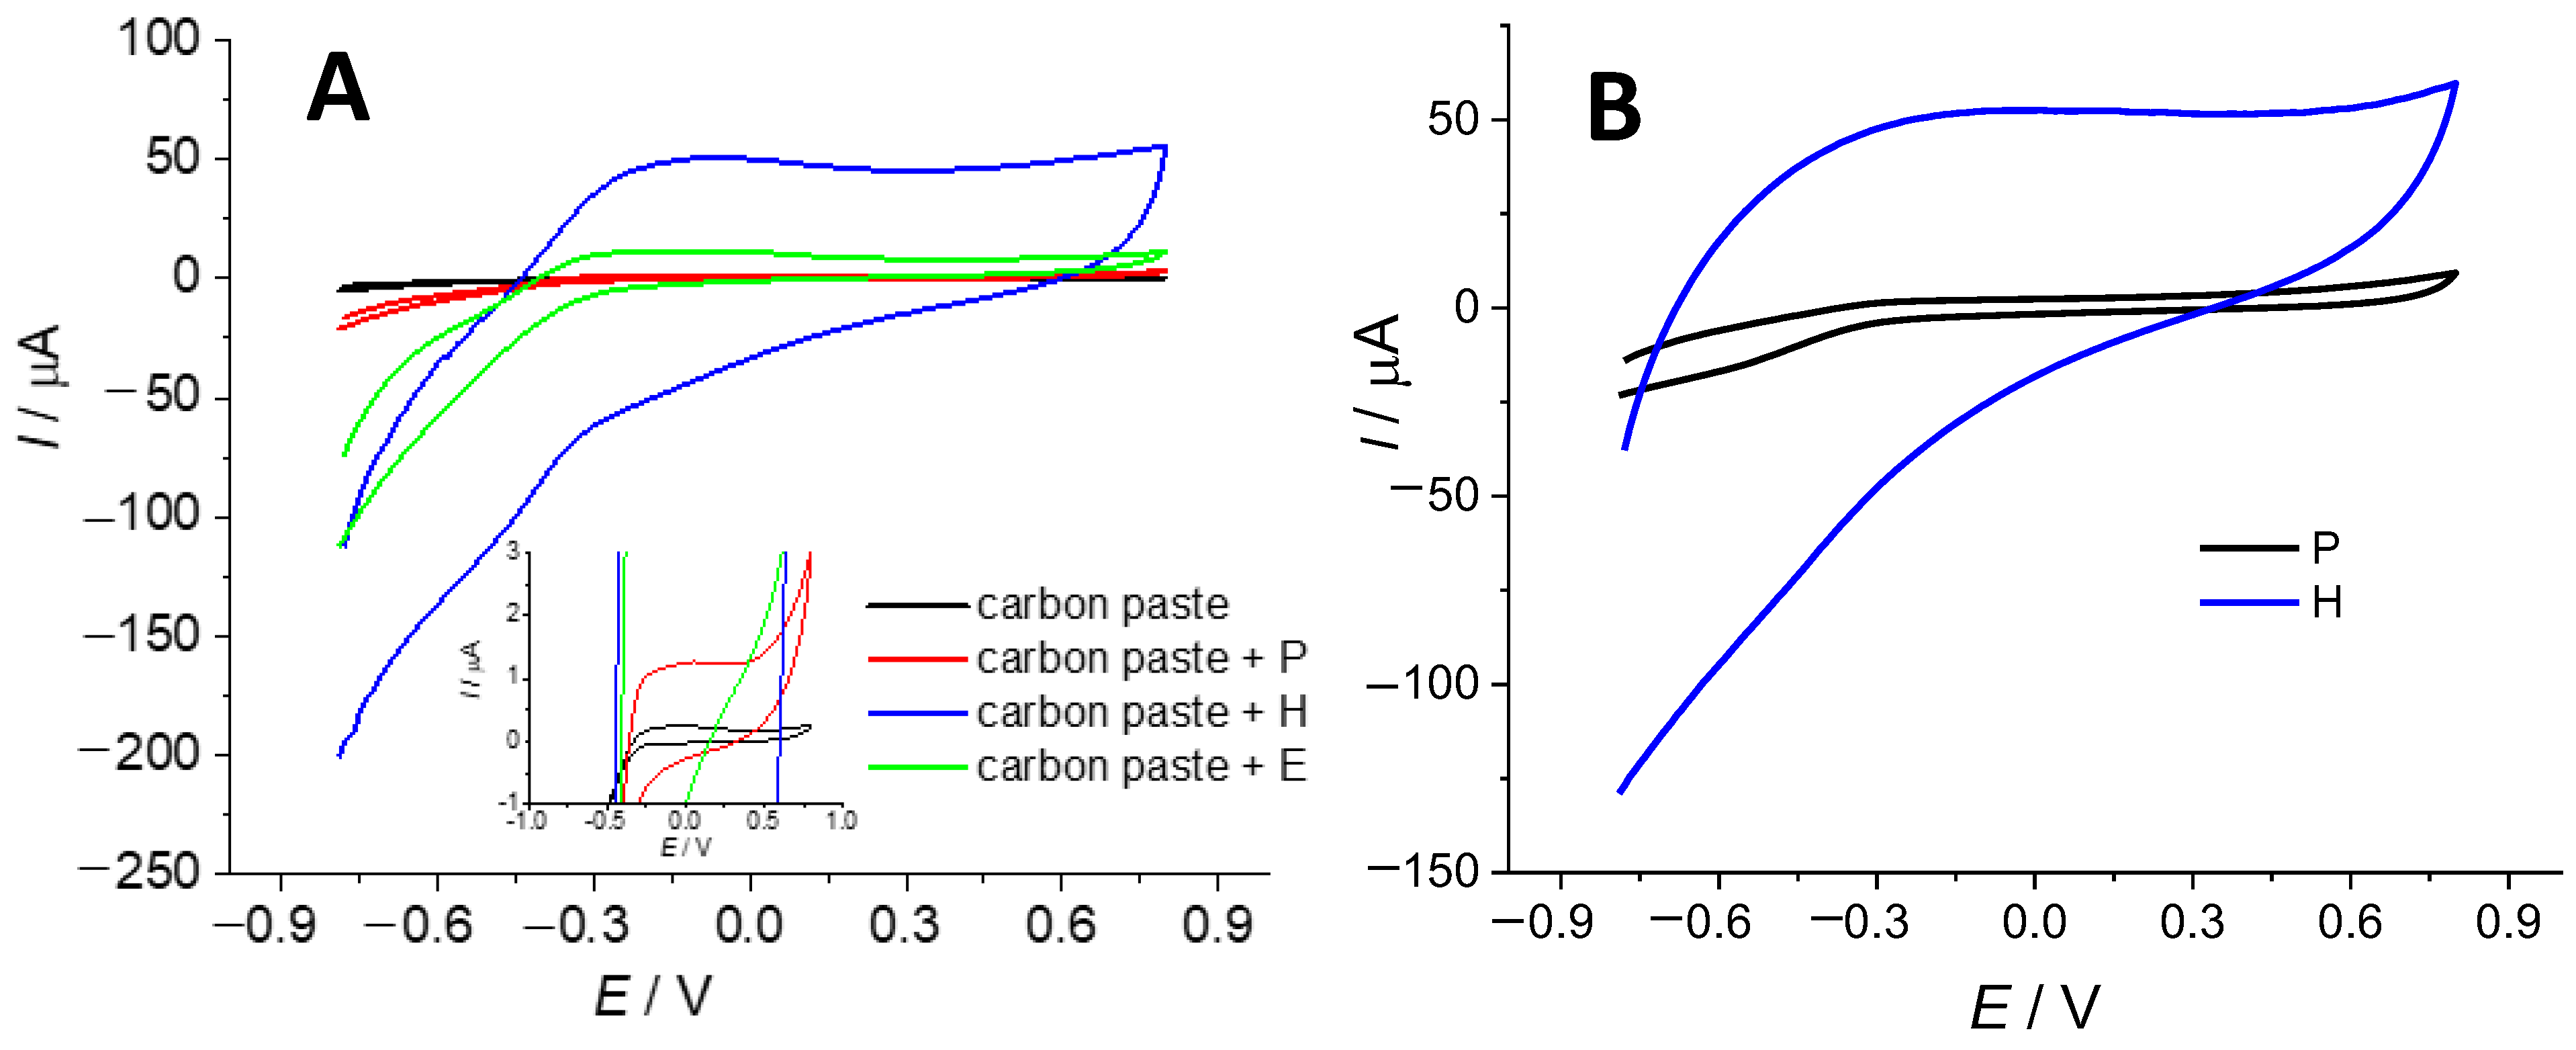
| Biochar Type | Pristine | Modified by Hummers | |
|---|---|---|---|
| Cs [F/g] | 0.55 | 7.13 | |
| Biochar Type | Pristine | Modified by Hummers | Modified by Persulfate |
|---|---|---|---|
| κ [S cm−1] | 2.81 | 0.45 | 0.55 |
Disclaimer/Publisher’s Note: The statements, opinions and data contained in all publications are solely those of the individual author(s) and contributor(s) and not of MDPI and/or the editor(s). MDPI and/or the editor(s) disclaim responsibility for any injury to people or property resulting from any ideas, methods, instructions or products referred to in the content. |
© 2023 by the authors. Licensee MDPI, Basel, Switzerland. This article is an open access article distributed under the terms and conditions of the Creative Commons Attribution (CC BY) license (https://creativecommons.org/licenses/by/4.0/).
Share and Cite
Plenča, K.; Cvetnić, S.; Prskalo, H.; Kovačić, M.; Cvetnić, M.; Kušić, H.; Matusinović, Z.; Kraljić Roković, M.; Genorio, B.; Lavrenčič Štangar, U.; et al. Biomass Pyrolysis-Derived Biochar: A Versatile Precursor for Graphene Synthesis. Materials 2023, 16, 7658. https://doi.org/10.3390/ma16247658
Plenča K, Cvetnić S, Prskalo H, Kovačić M, Cvetnić M, Kušić H, Matusinović Z, Kraljić Roković M, Genorio B, Lavrenčič Štangar U, et al. Biomass Pyrolysis-Derived Biochar: A Versatile Precursor for Graphene Synthesis. Materials. 2023; 16(24):7658. https://doi.org/10.3390/ma16247658
Chicago/Turabian StylePlenča, Karla, Sara Cvetnić, Helena Prskalo, Marin Kovačić, Matija Cvetnić, Hrvoje Kušić, Zvonimir Matusinović, Marijana Kraljić Roković, Boštjan Genorio, Urška Lavrenčič Štangar, and et al. 2023. "Biomass Pyrolysis-Derived Biochar: A Versatile Precursor for Graphene Synthesis" Materials 16, no. 24: 7658. https://doi.org/10.3390/ma16247658
APA StylePlenča, K., Cvetnić, S., Prskalo, H., Kovačić, M., Cvetnić, M., Kušić, H., Matusinović, Z., Kraljić Roković, M., Genorio, B., Lavrenčič Štangar, U., & Lončarić Božić, A. (2023). Biomass Pyrolysis-Derived Biochar: A Versatile Precursor for Graphene Synthesis. Materials, 16(24), 7658. https://doi.org/10.3390/ma16247658