
The Mechanical Properties of Thin-Walled Specimens Printed from a Bronze-Filled PLA-Based Composite Filament Using Fused Deposition Modelling


Abstract
:1. Introduction
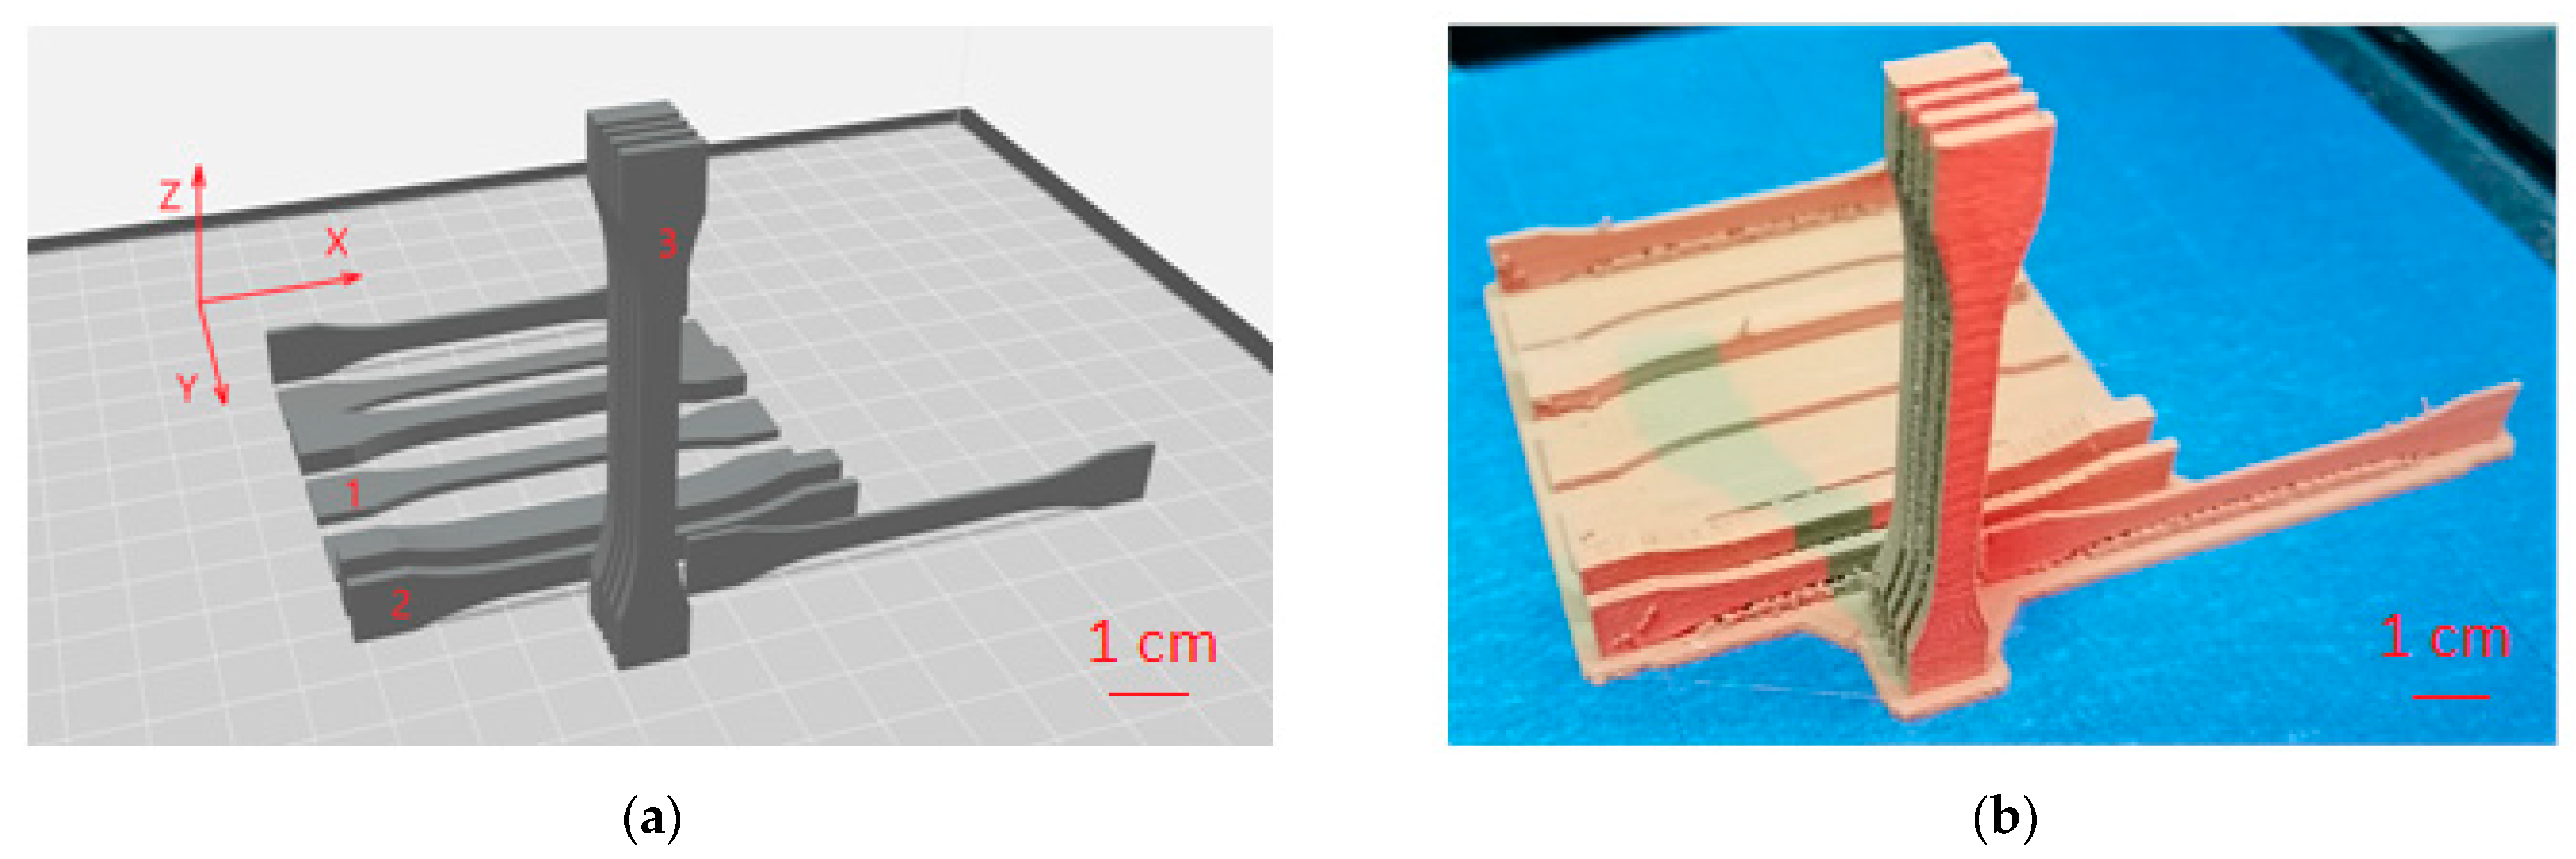
2. Materials and Methods
3. Results
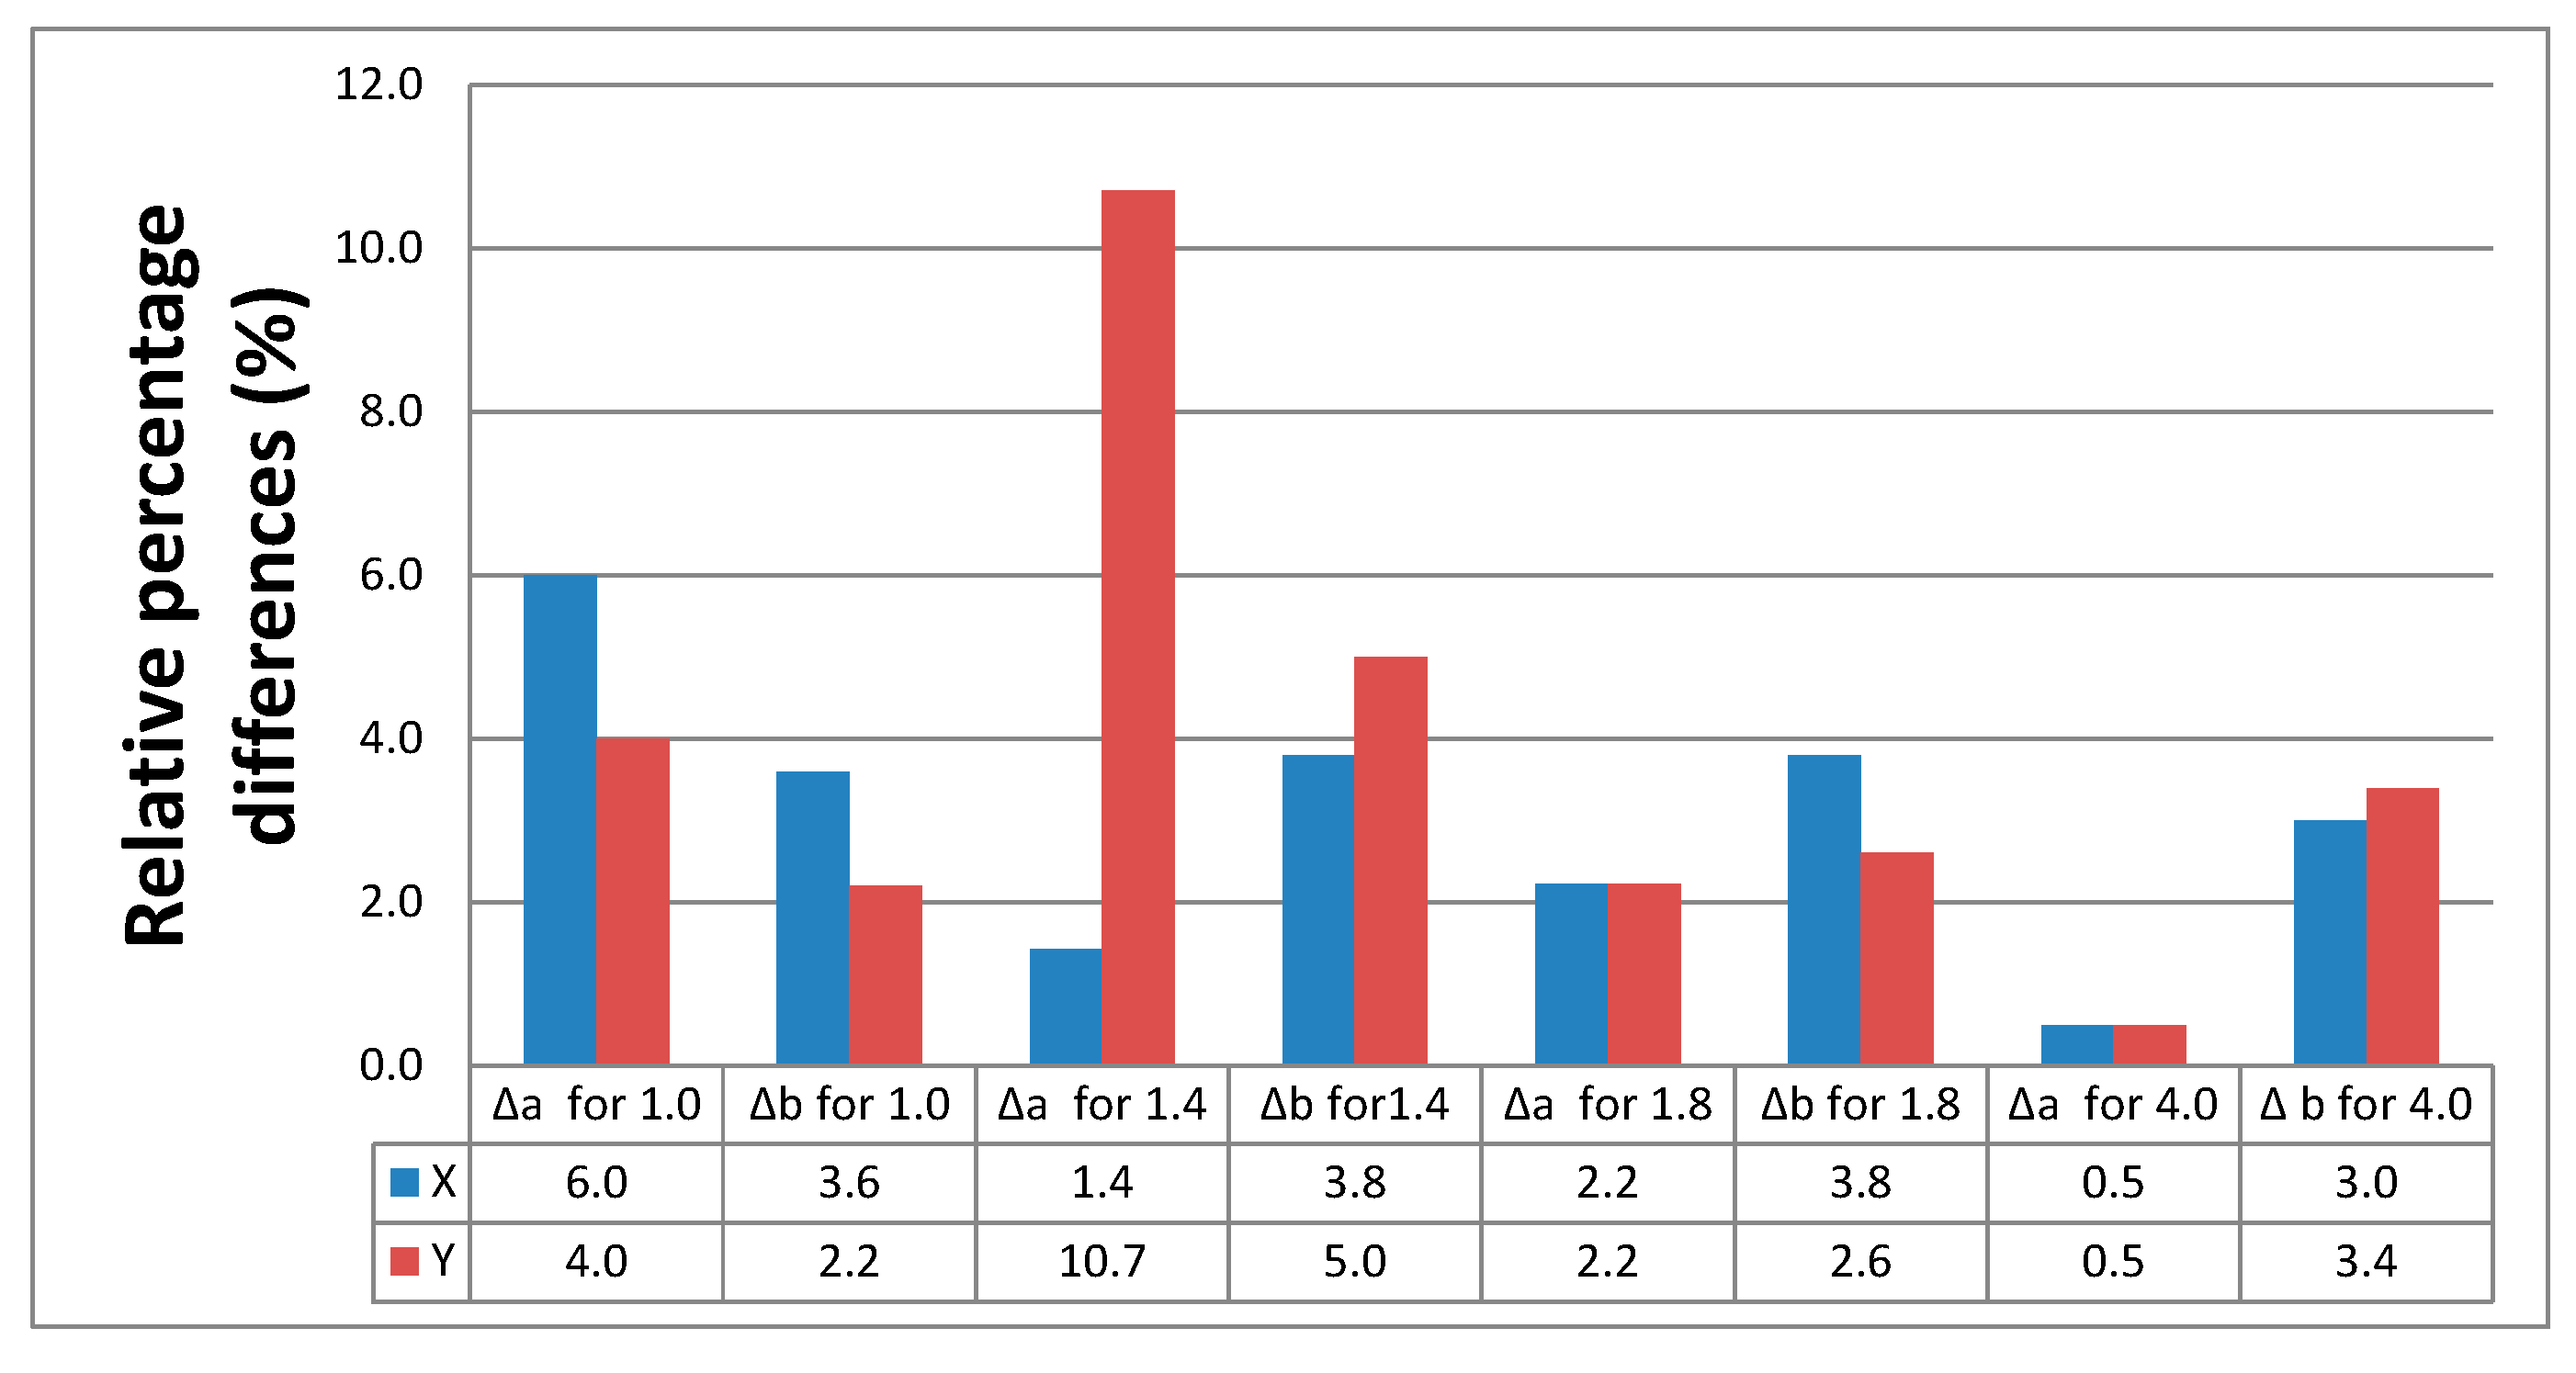
3.1. Thickness and Width Measurements
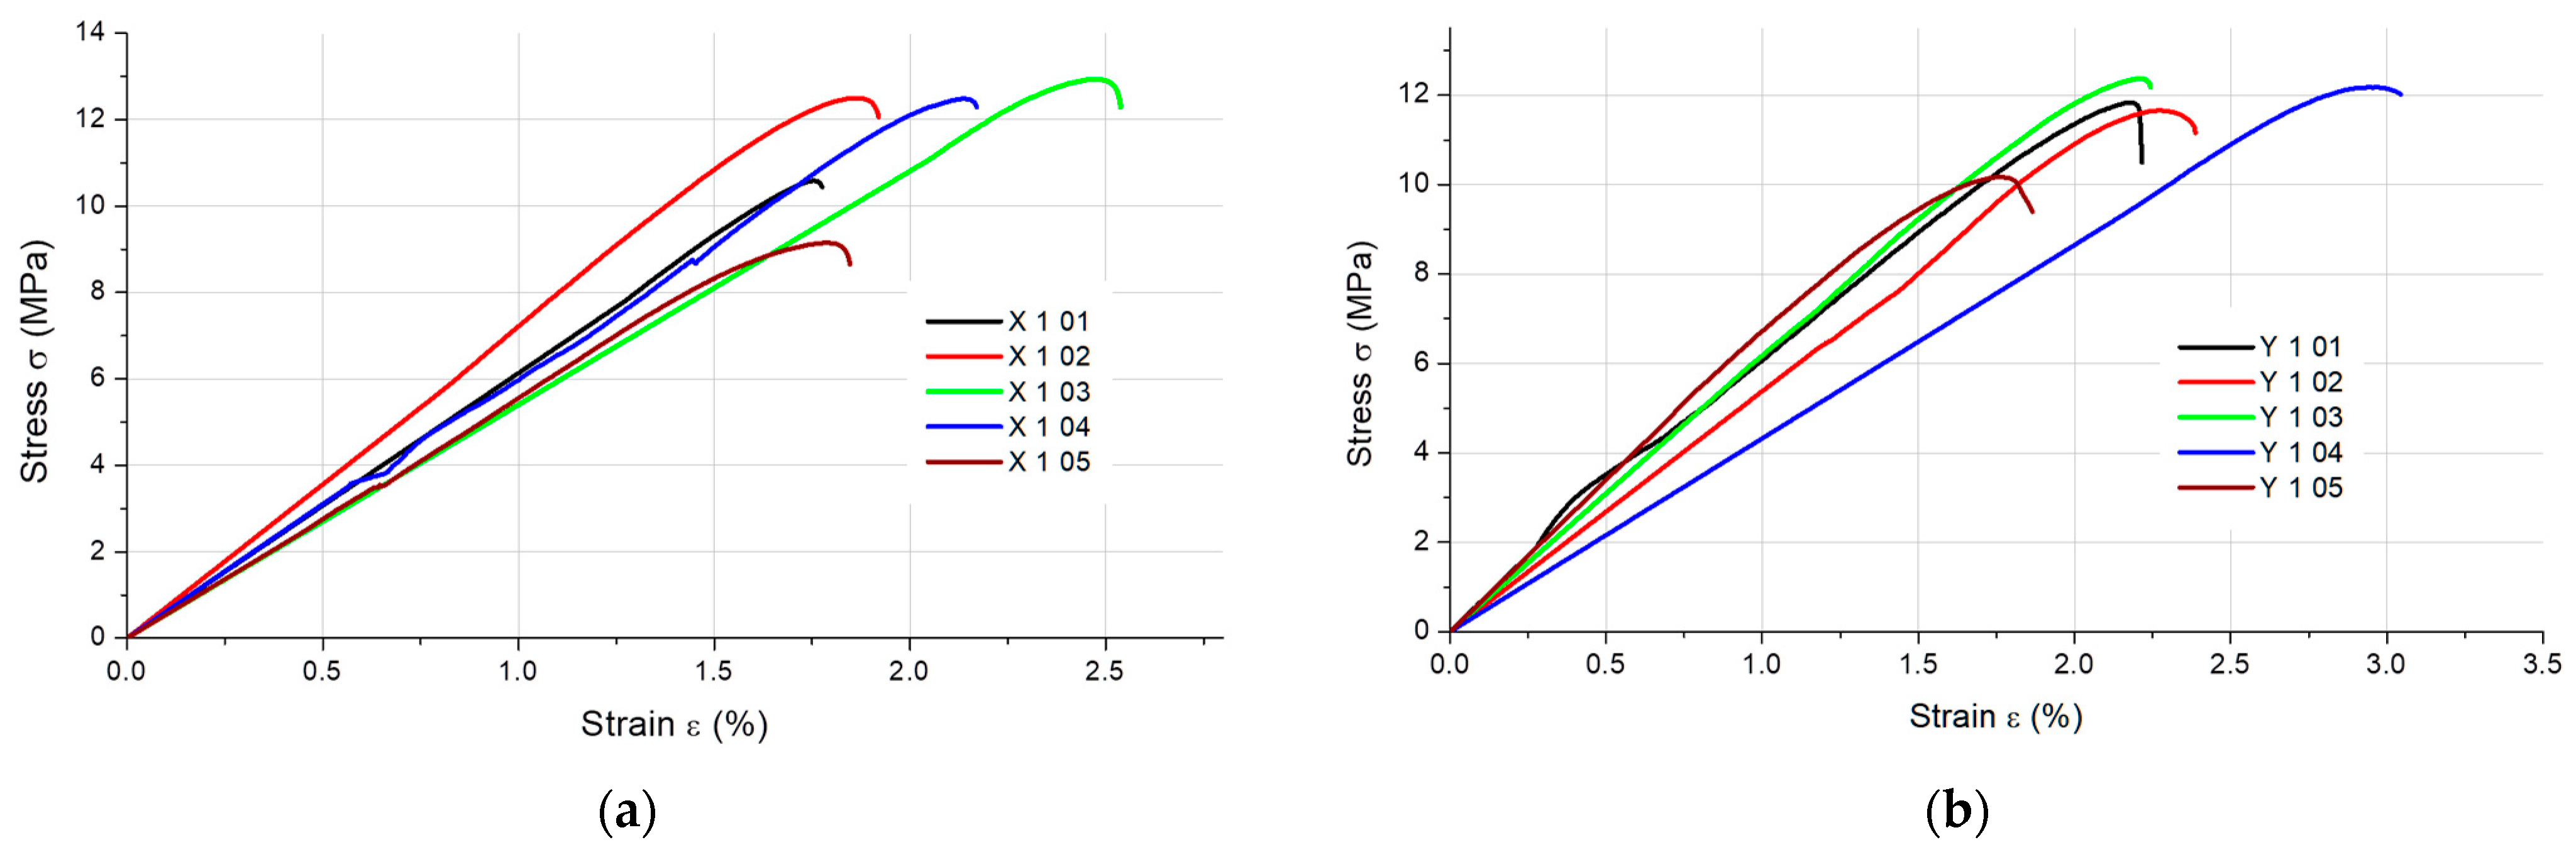
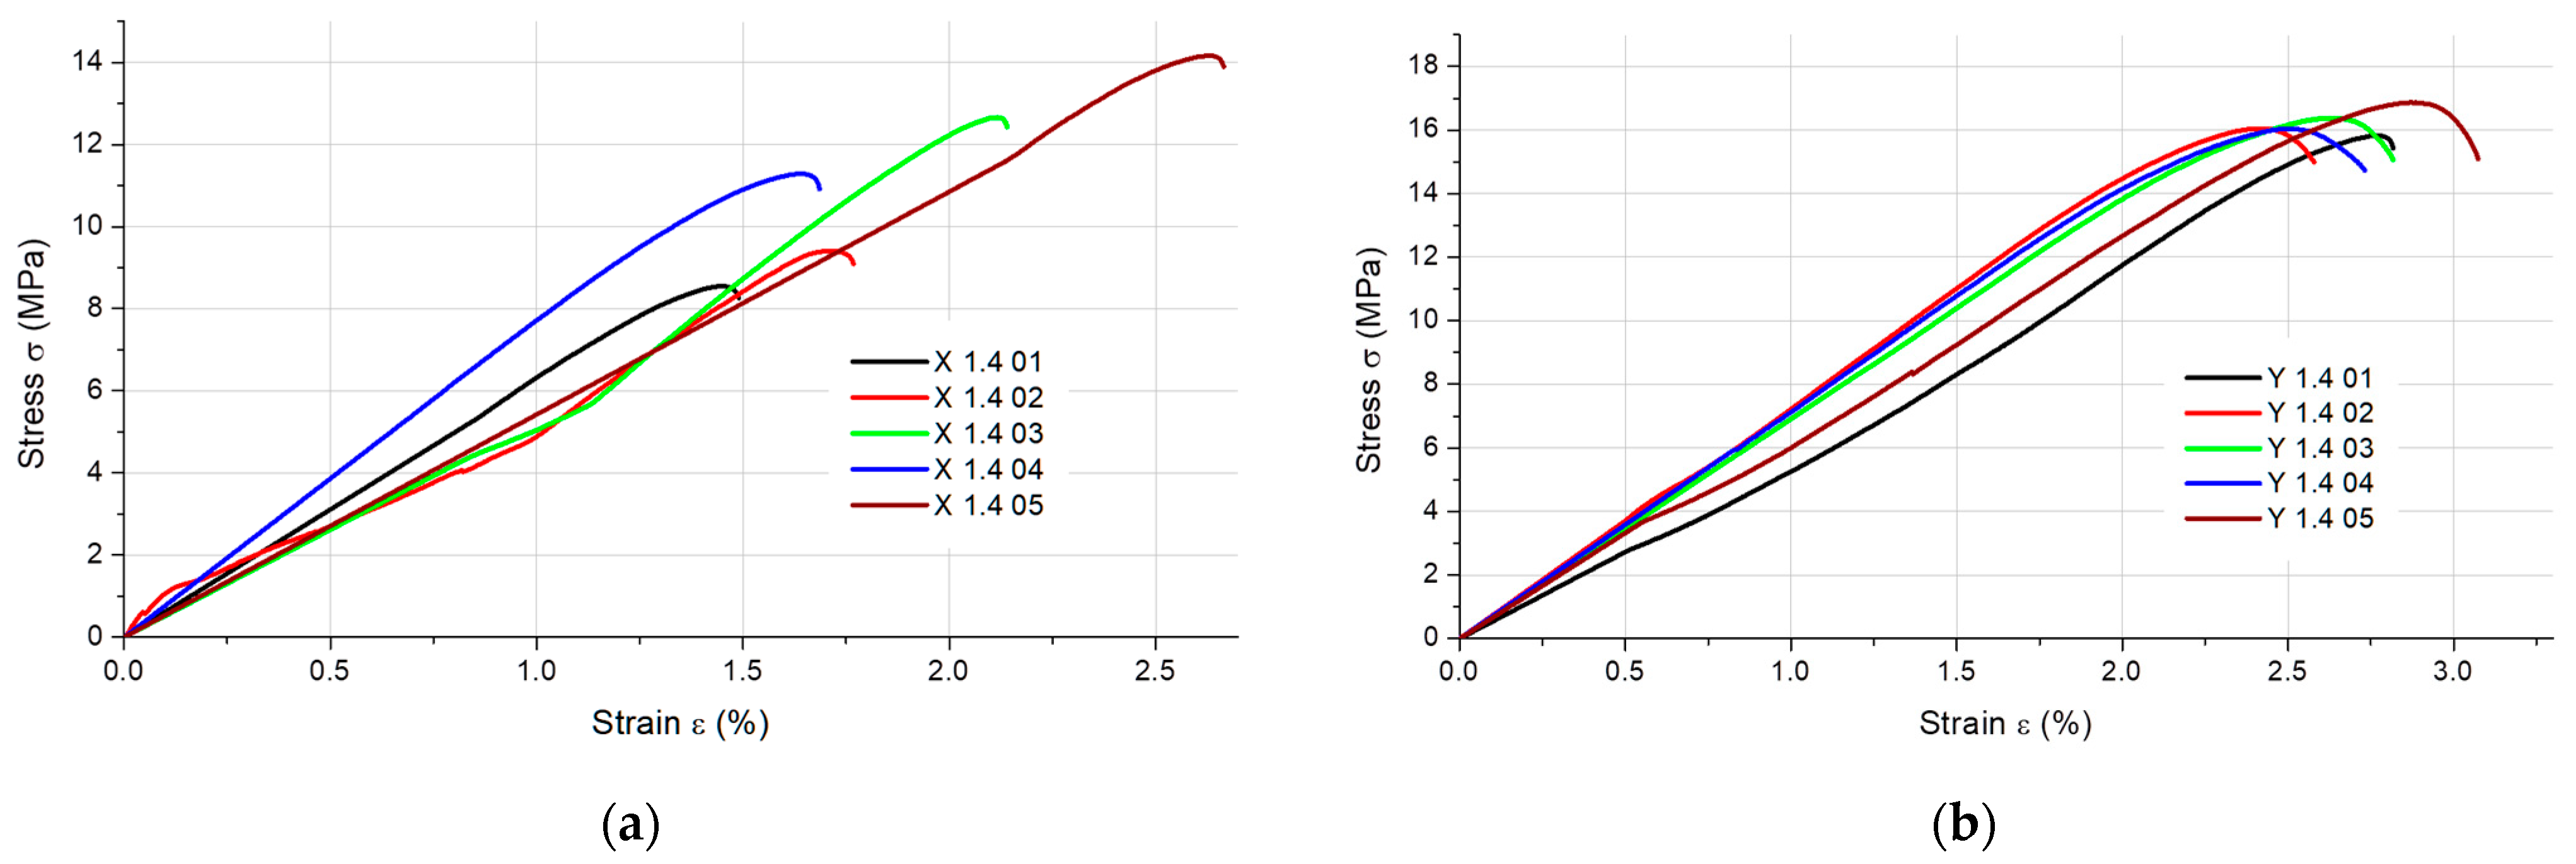
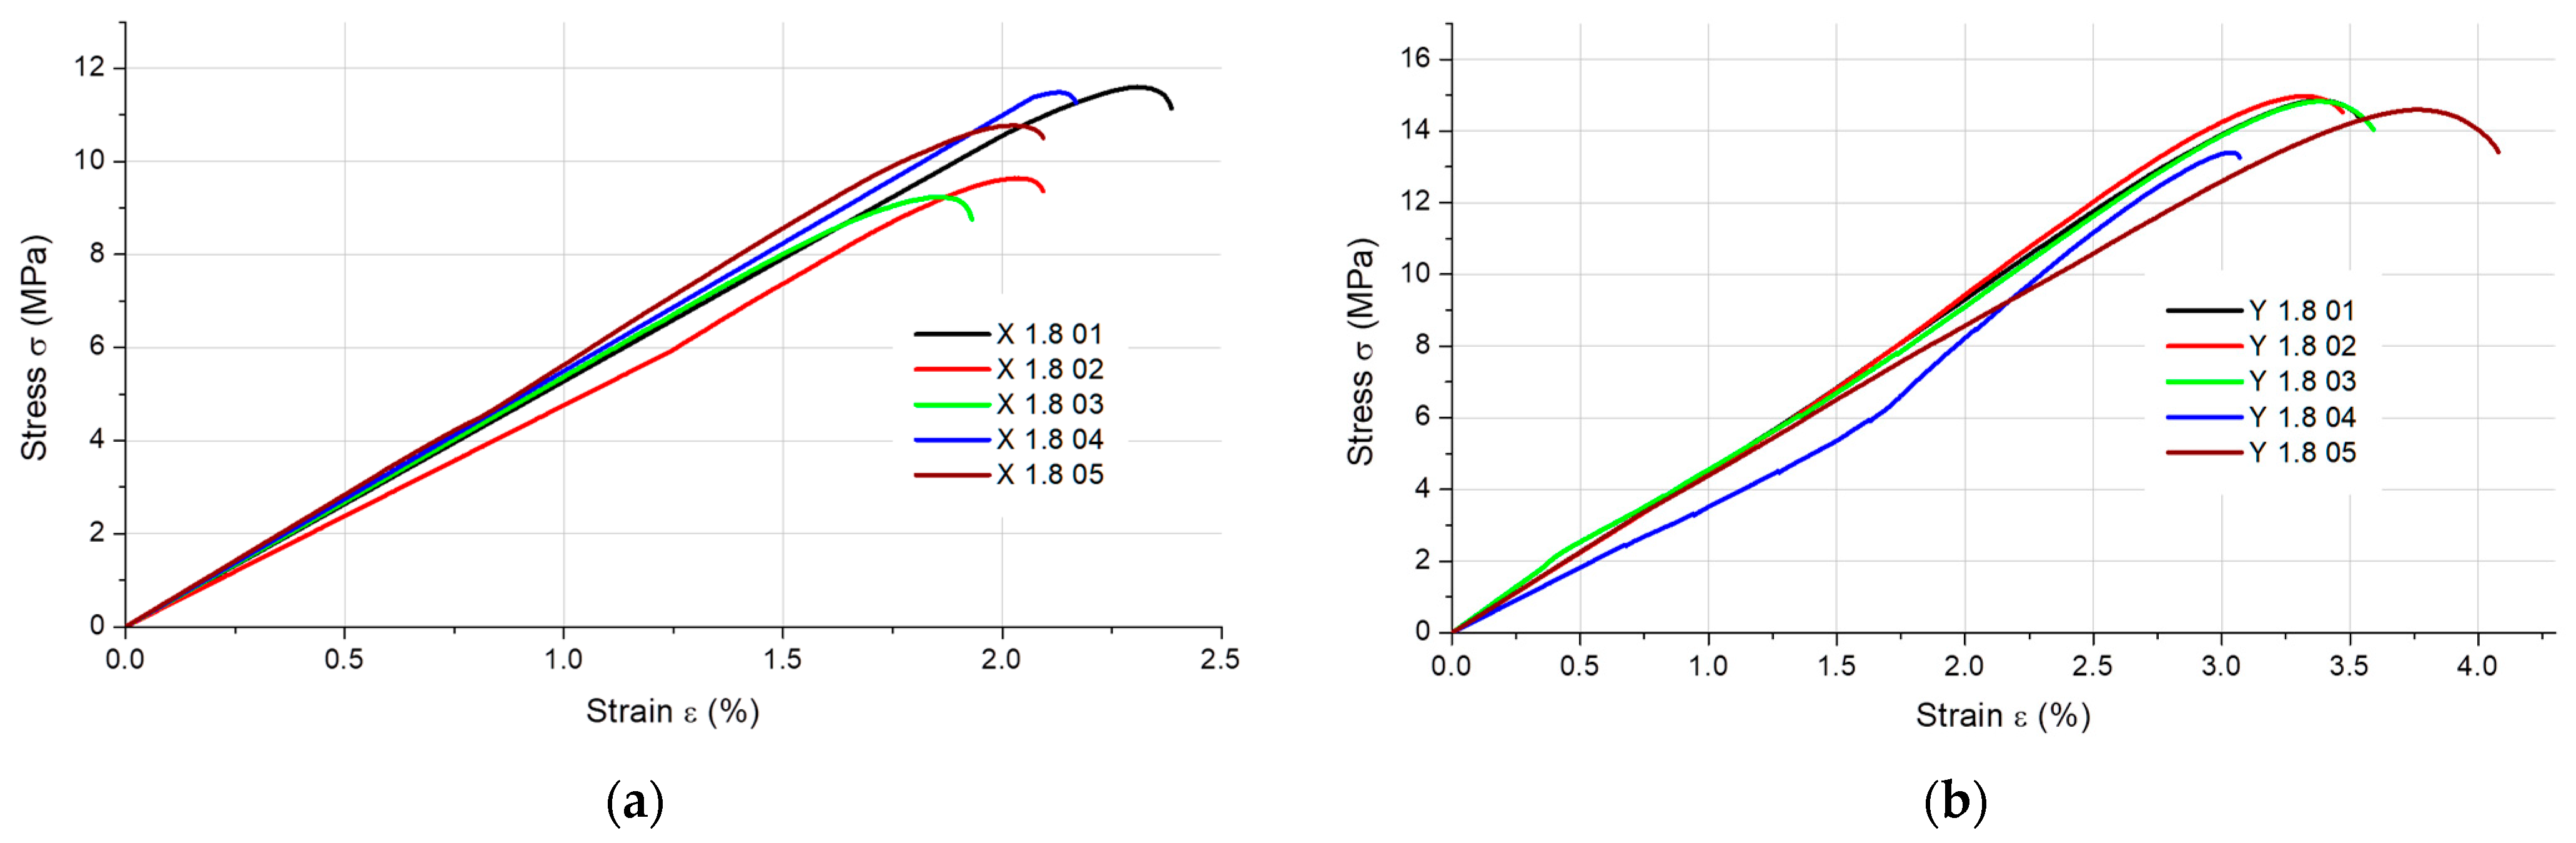
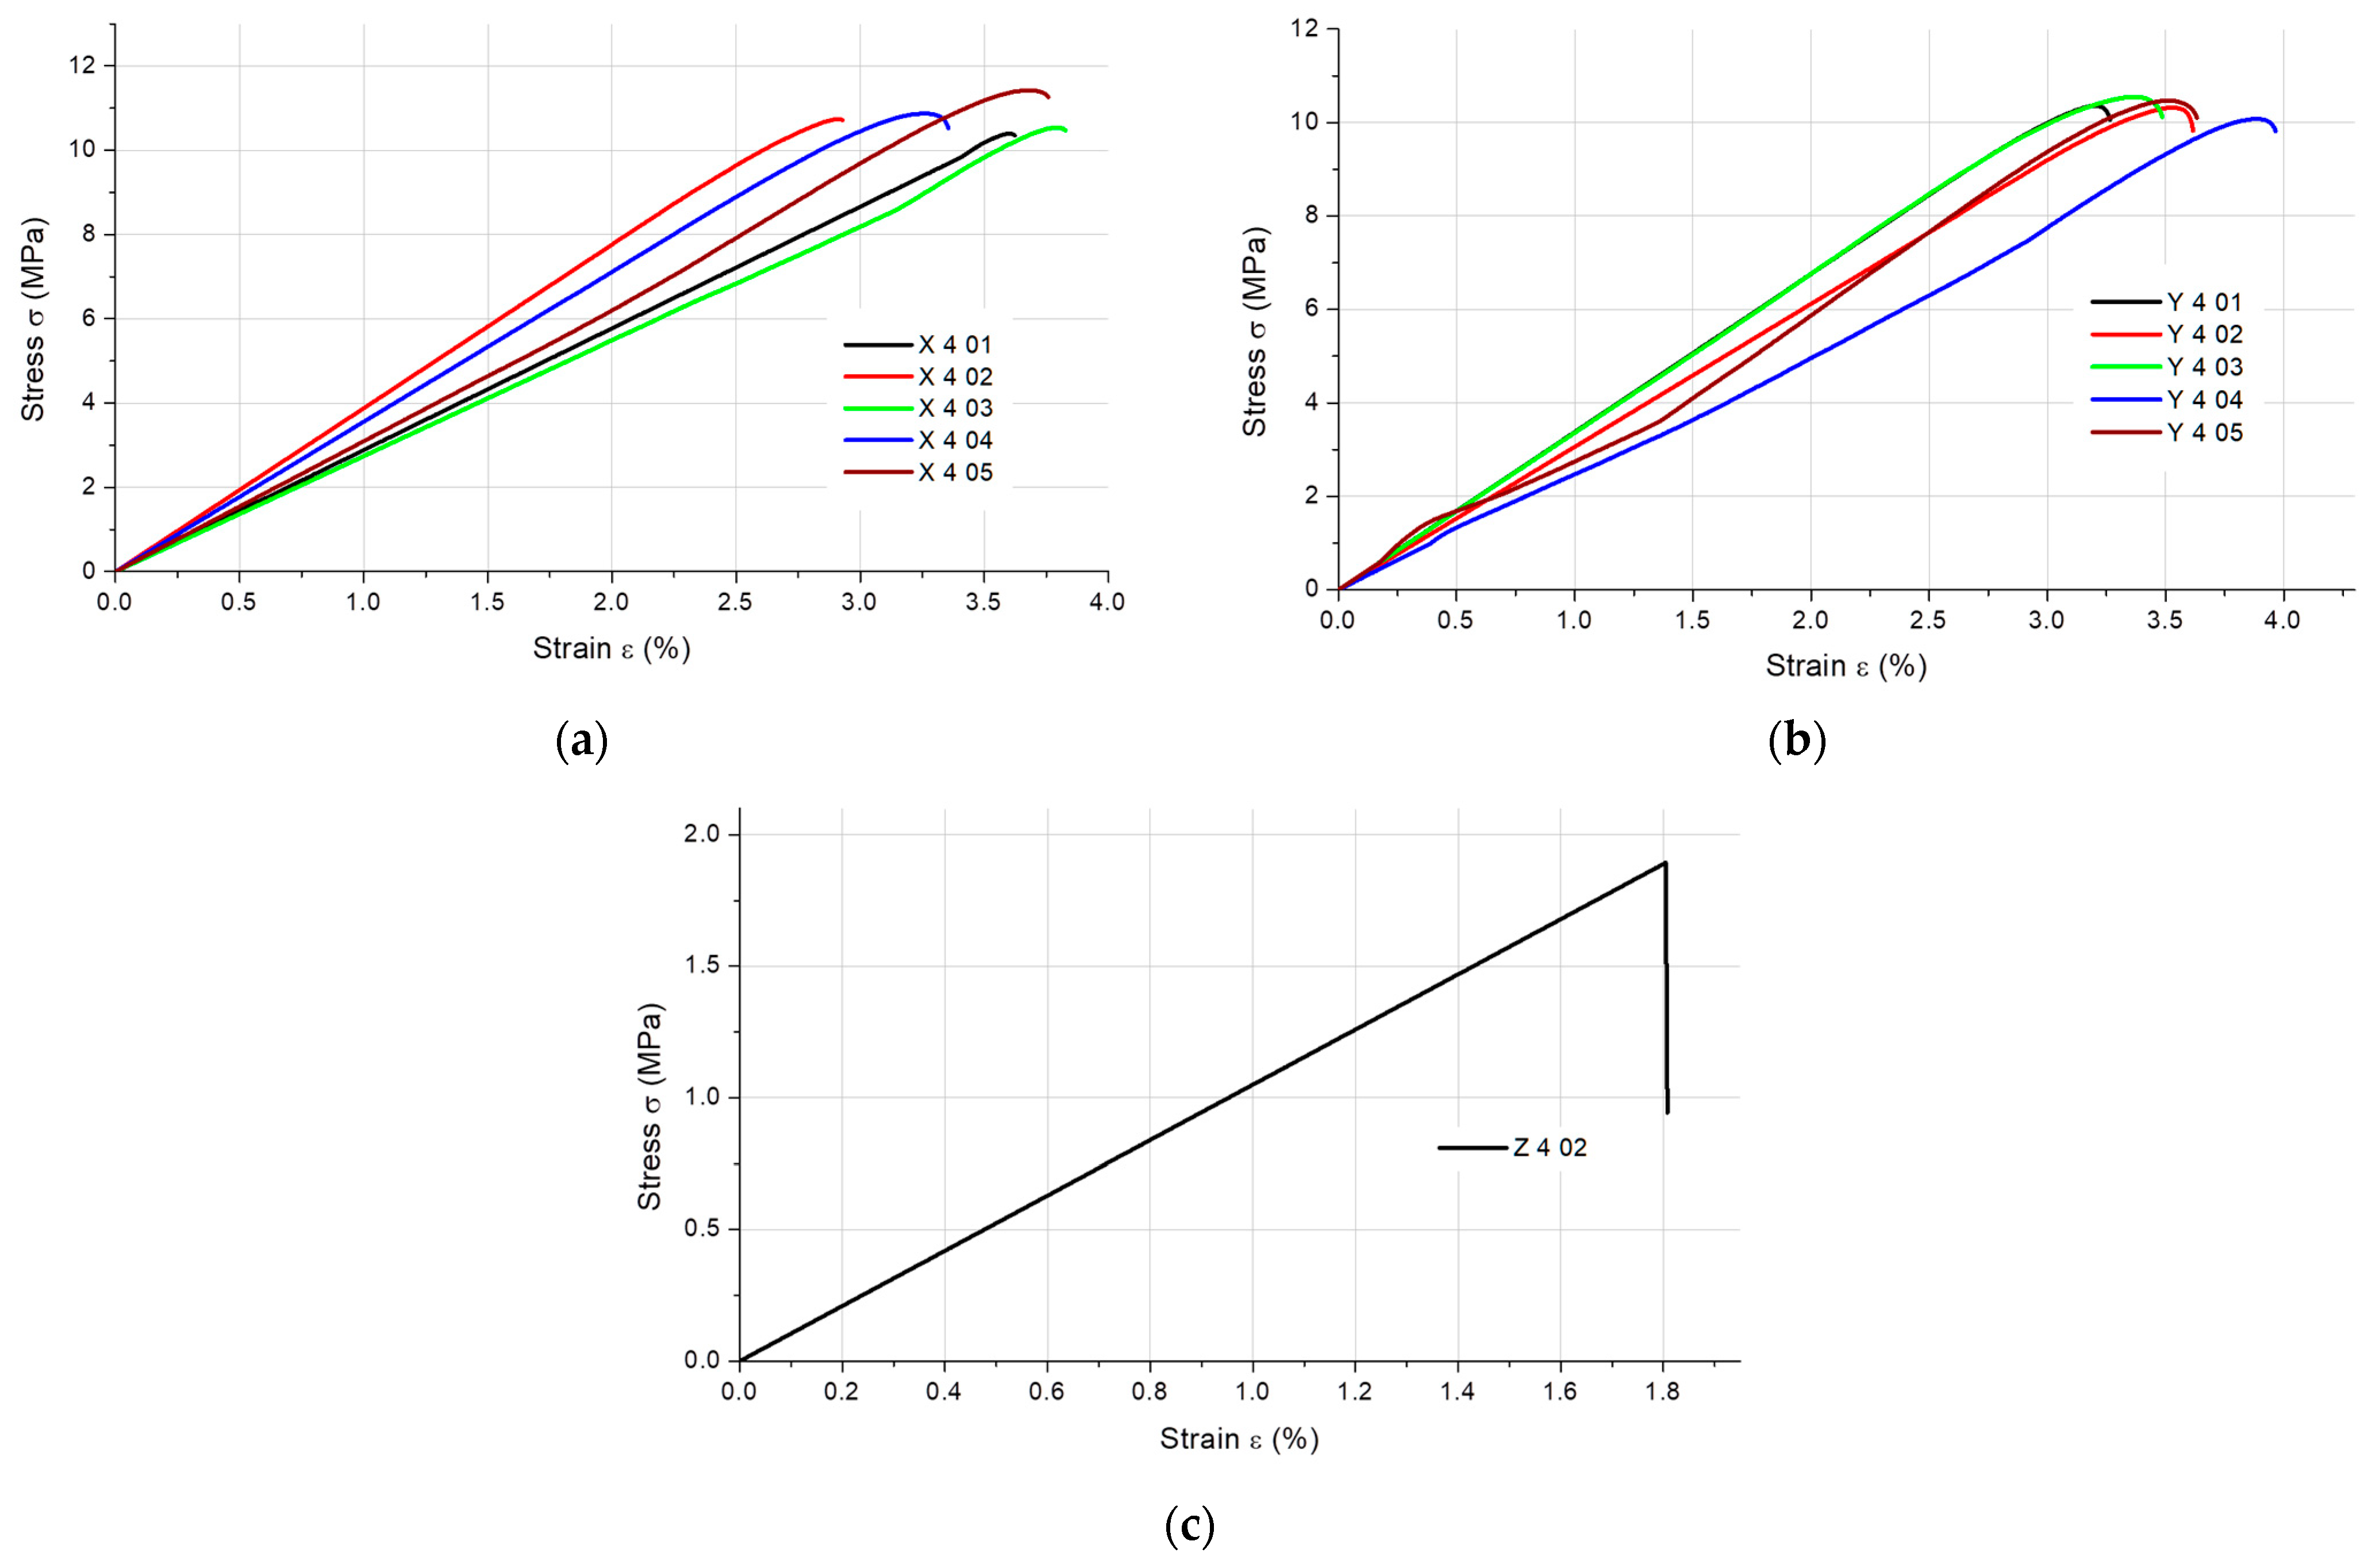
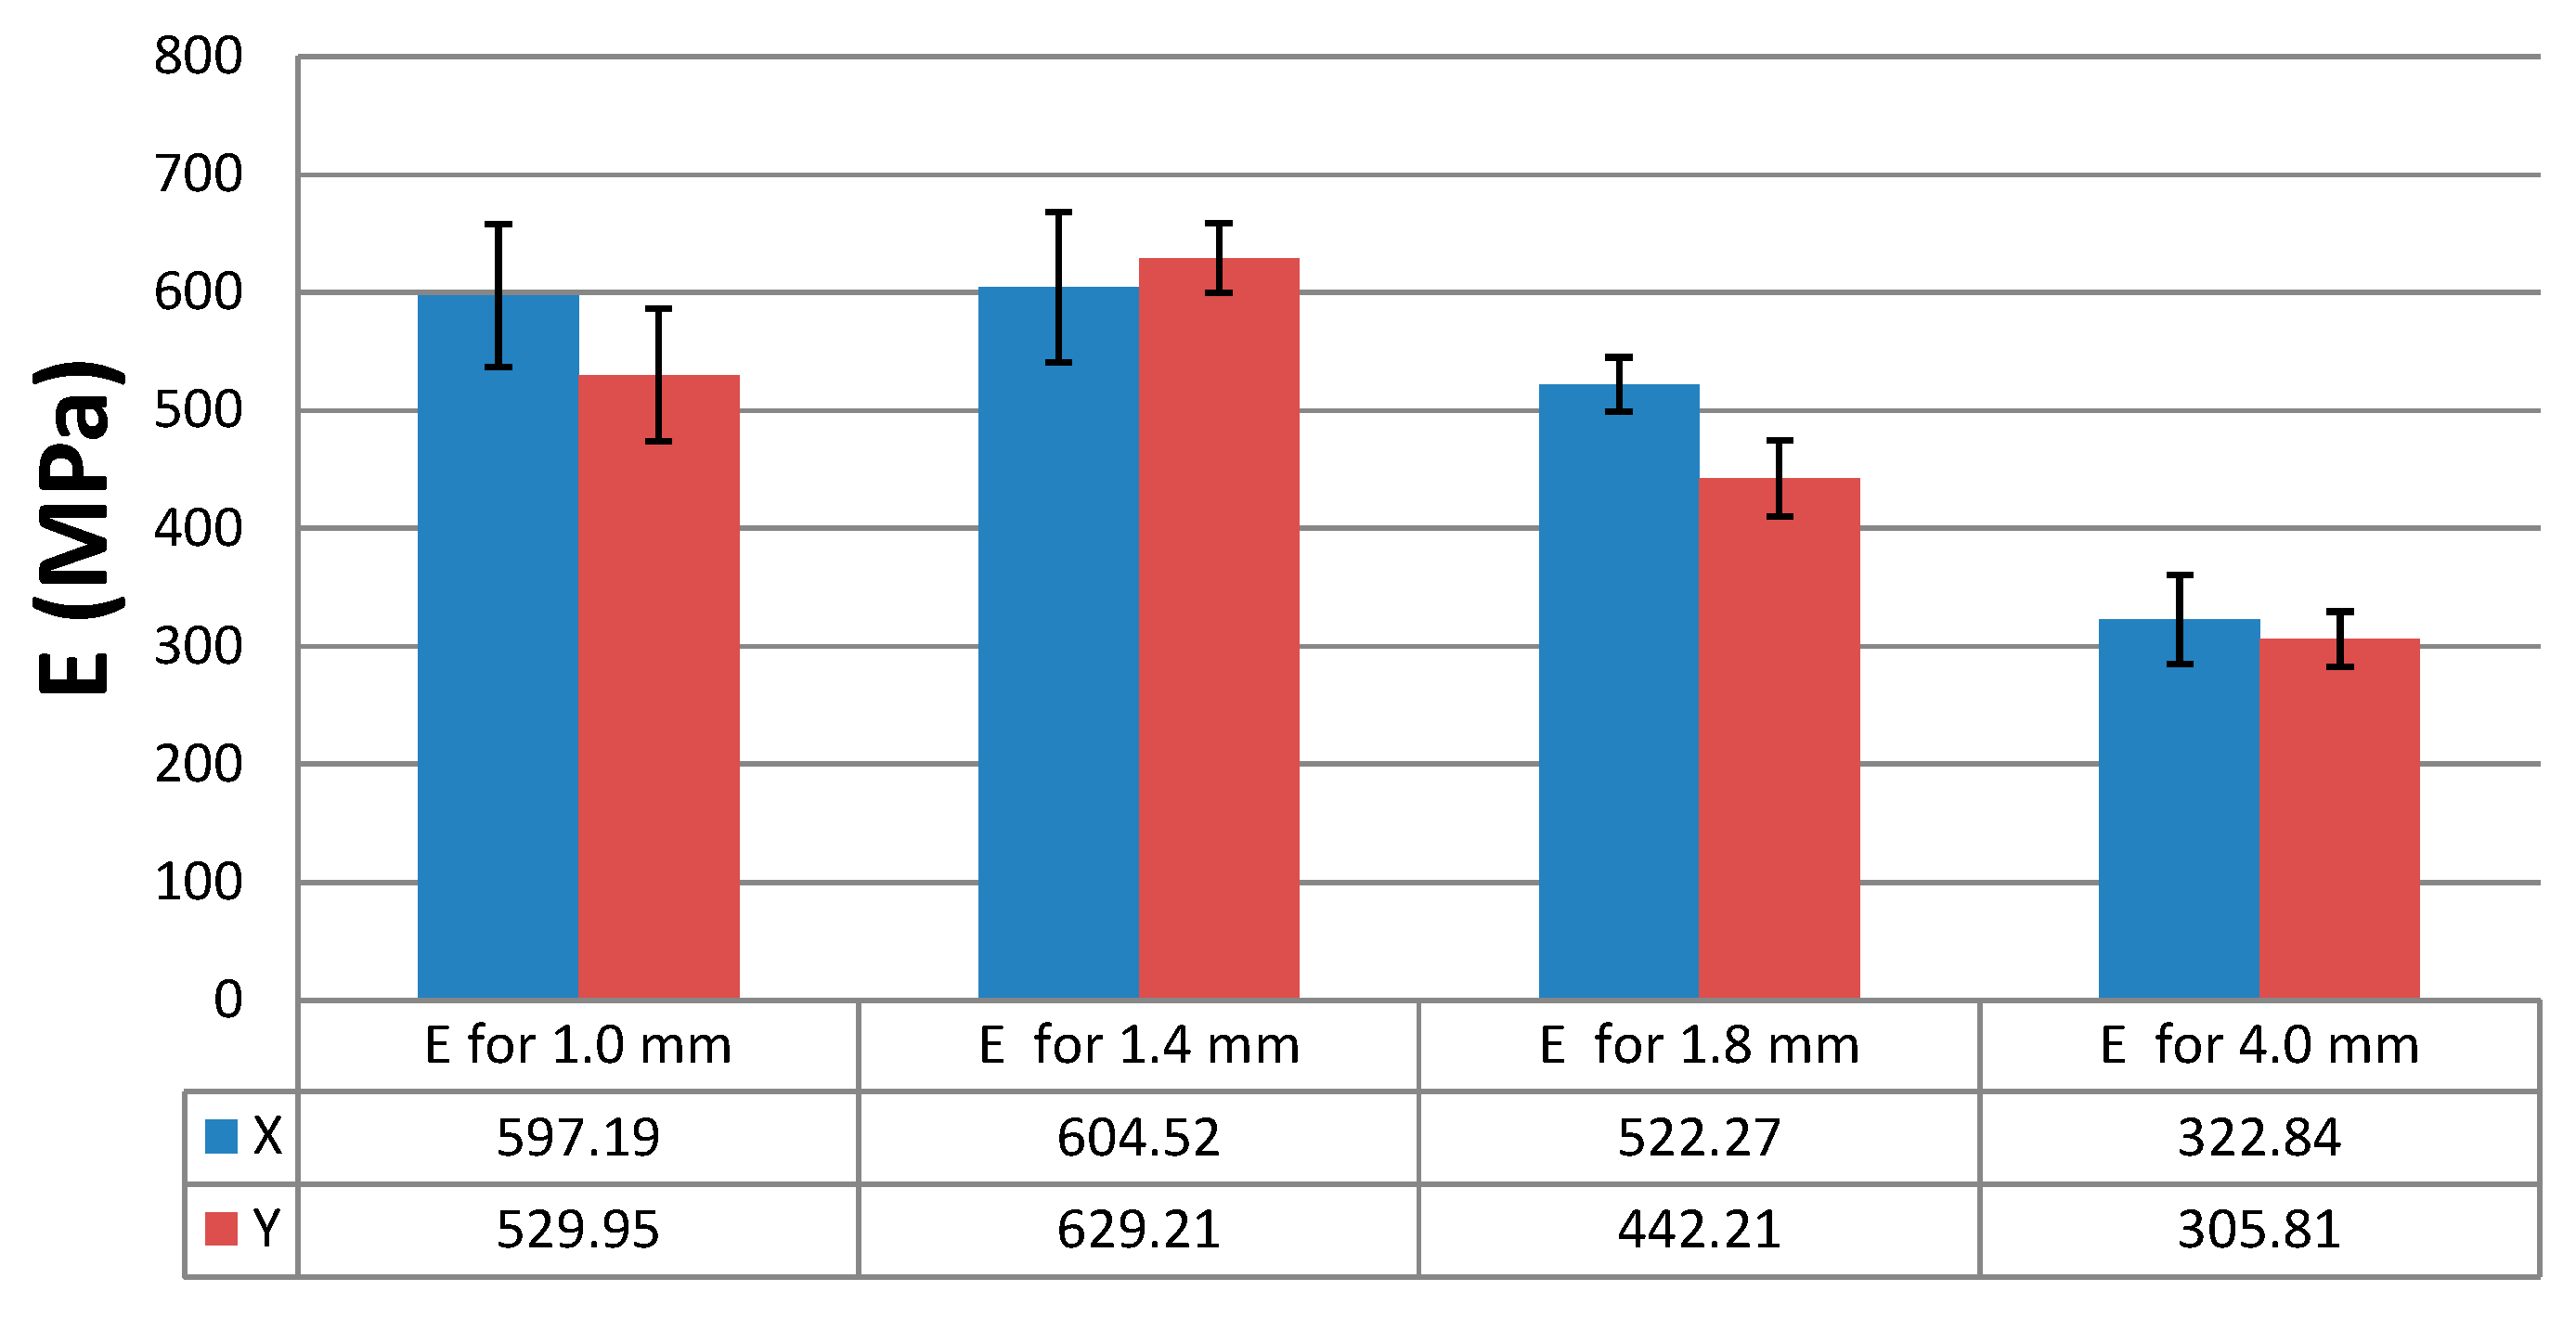
3.2. Tensile Test
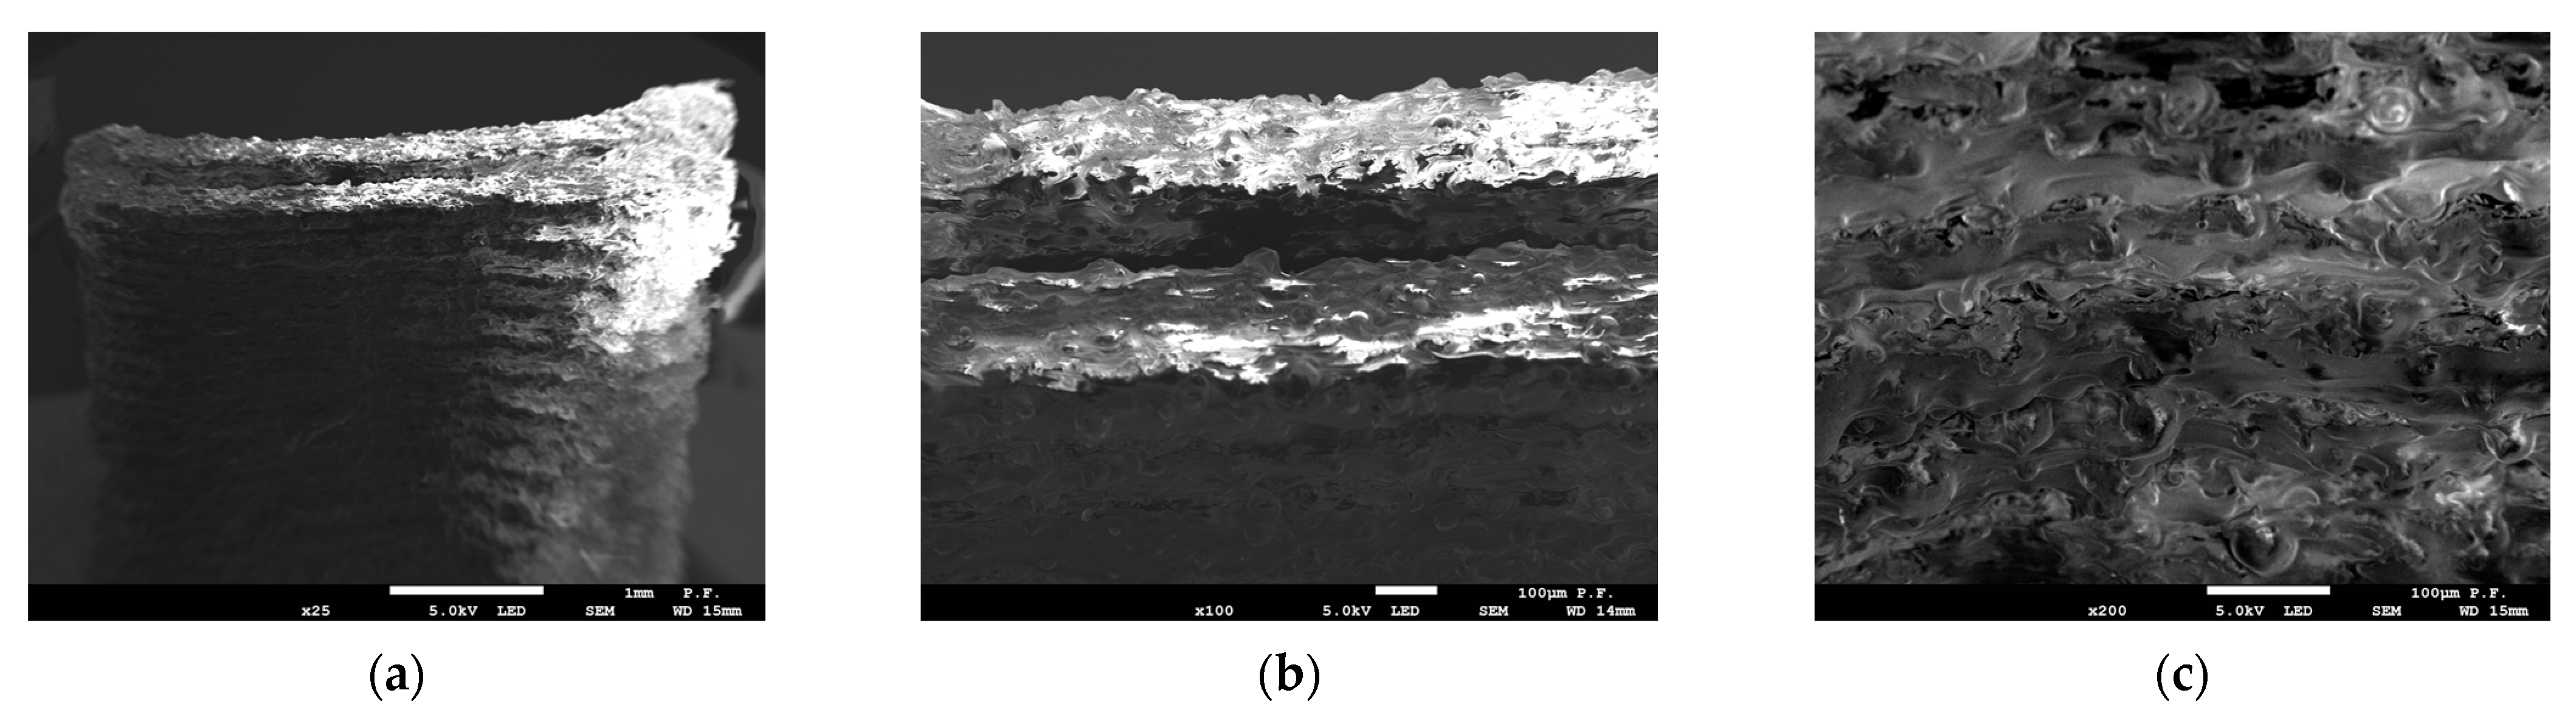
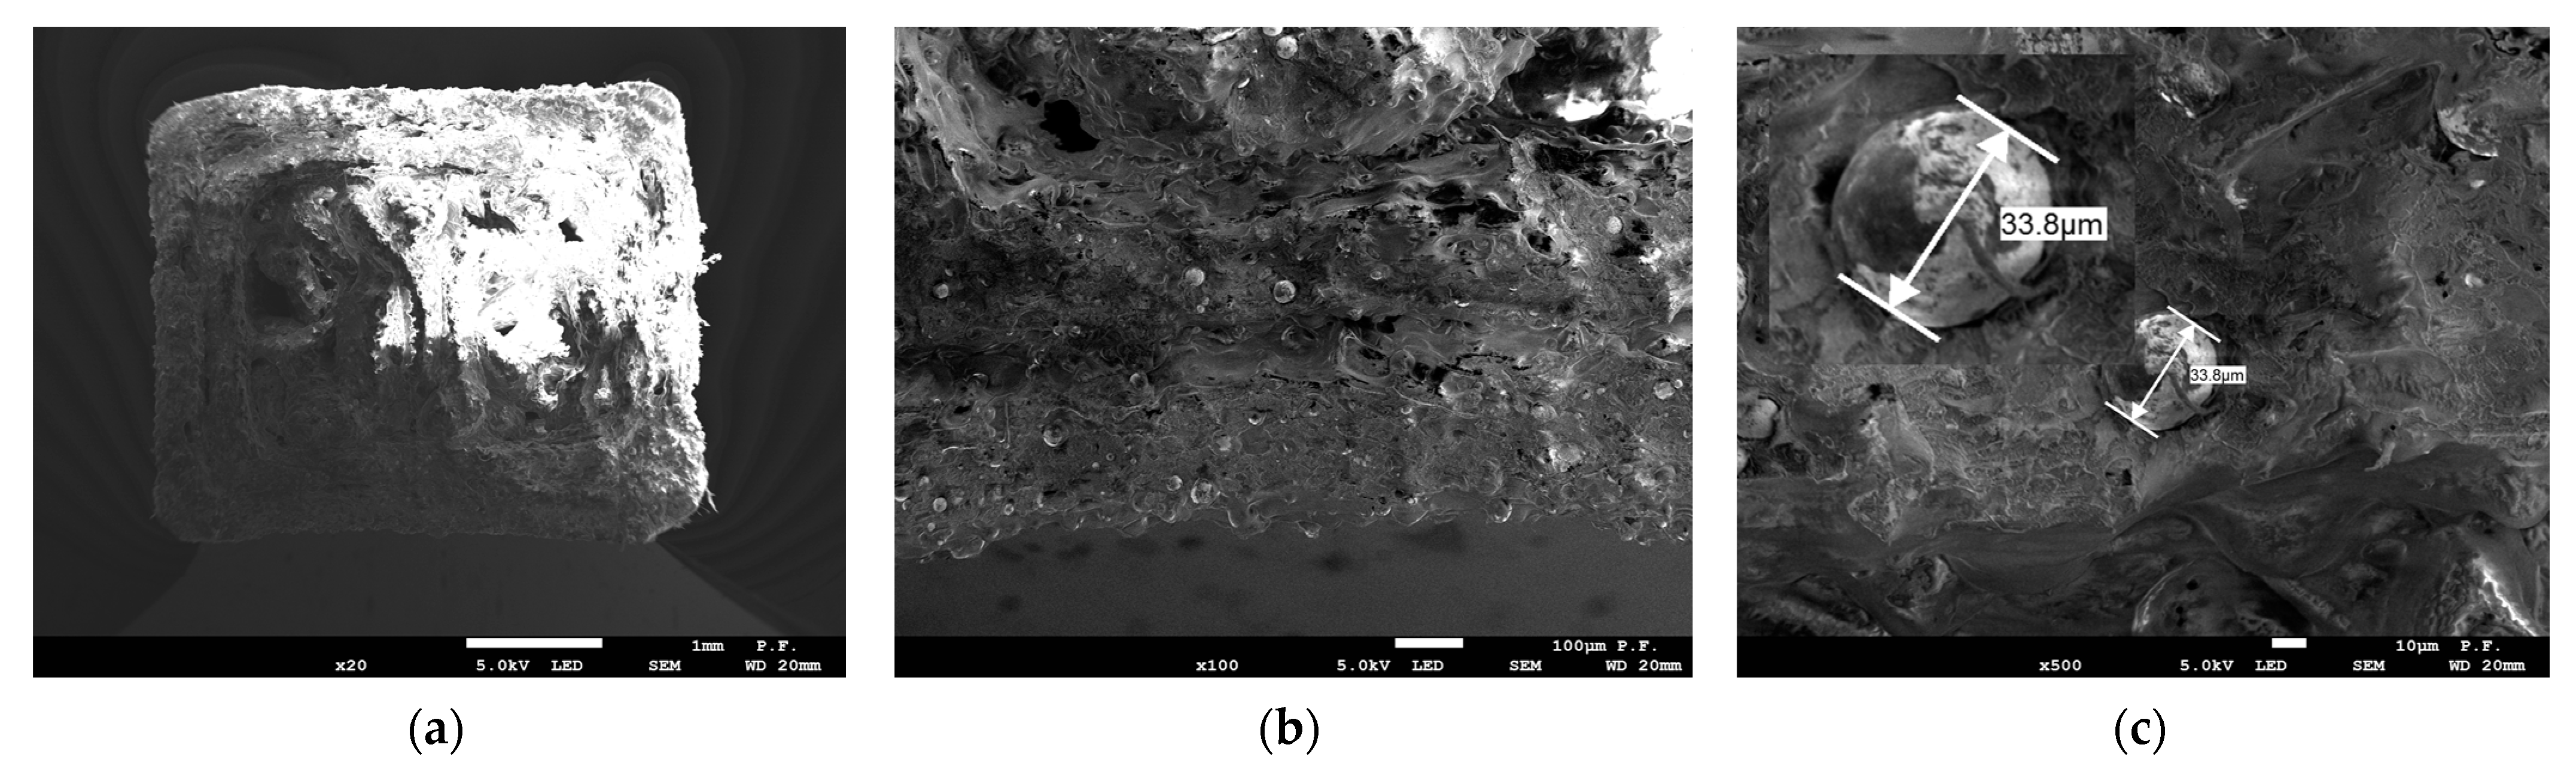
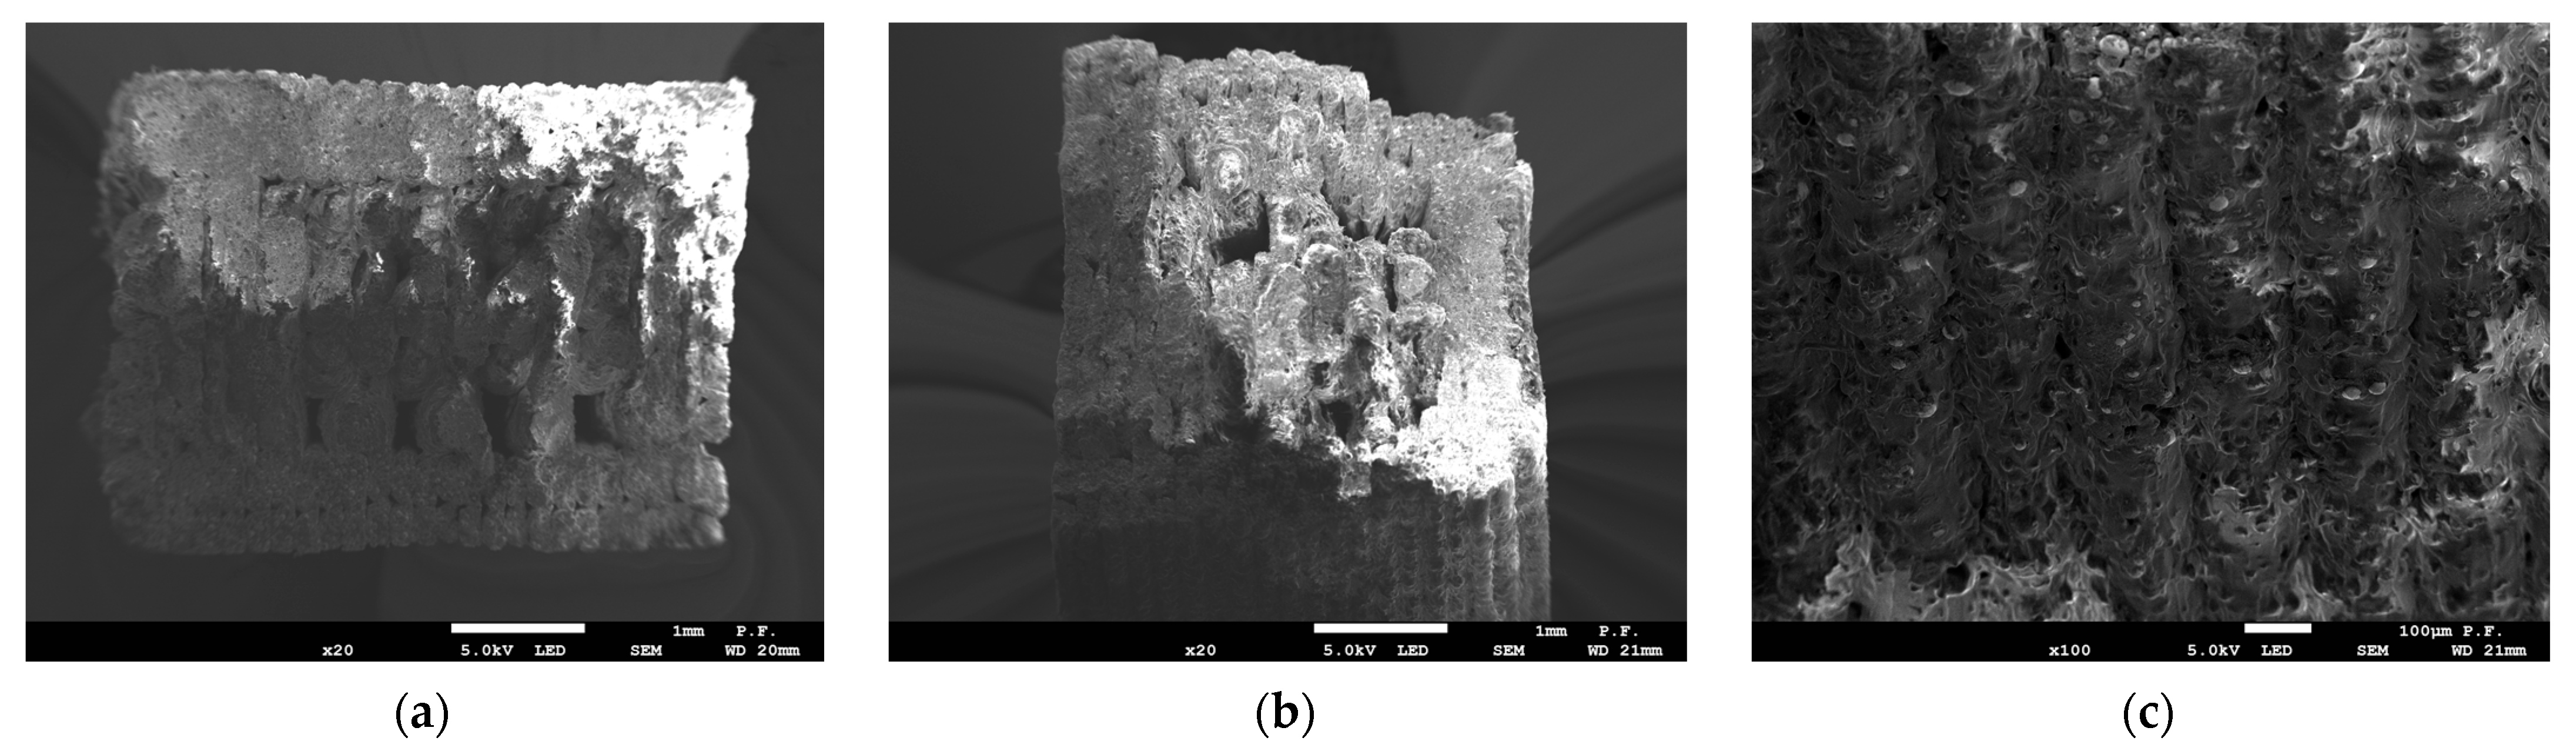
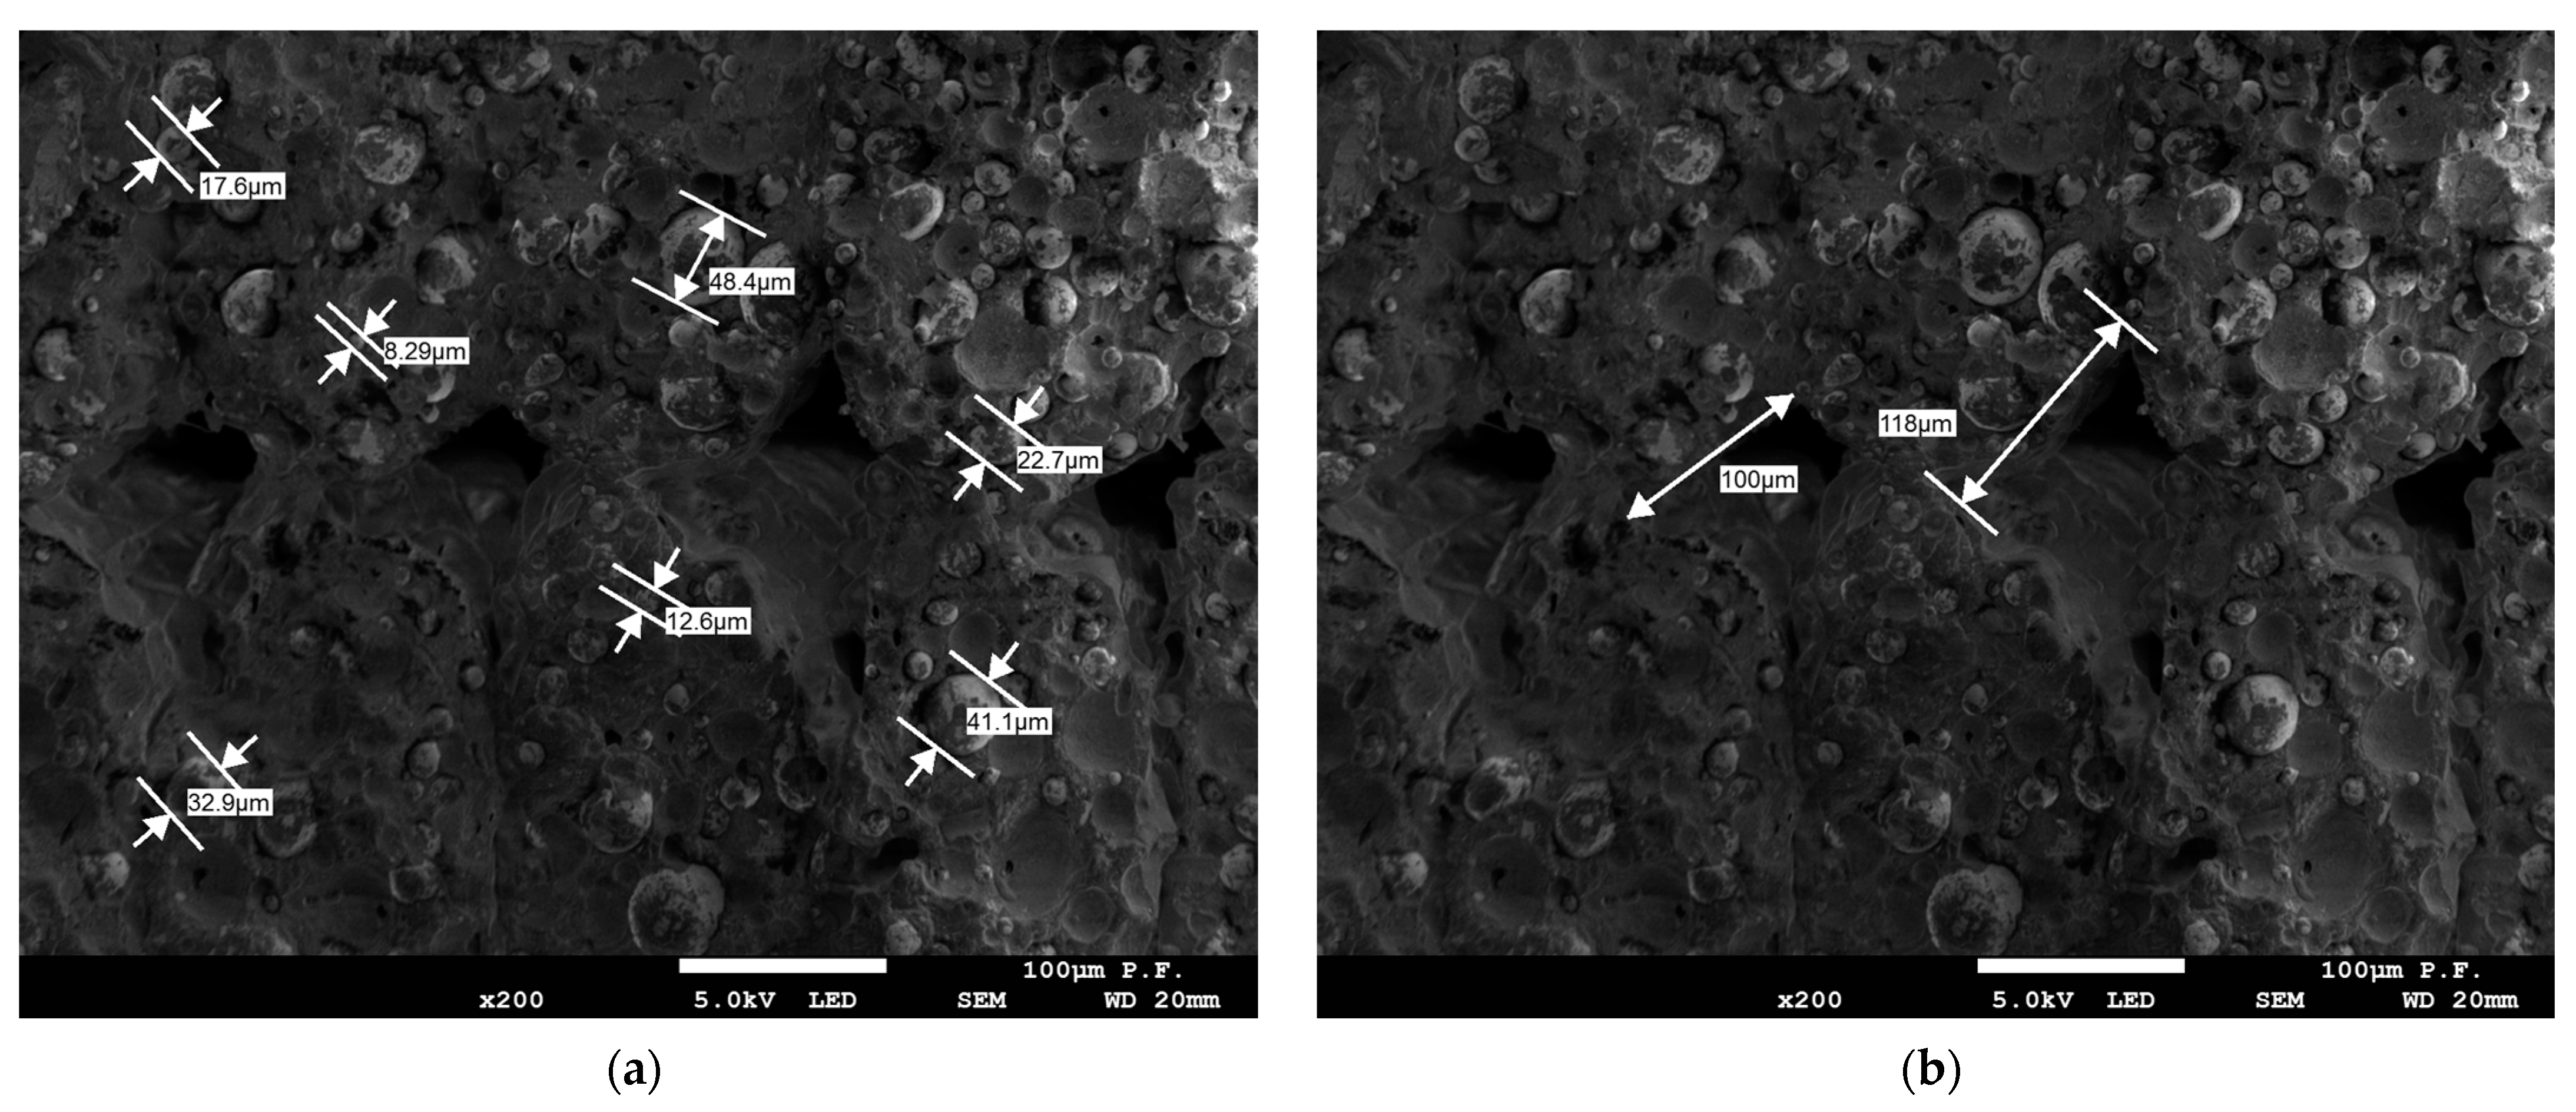
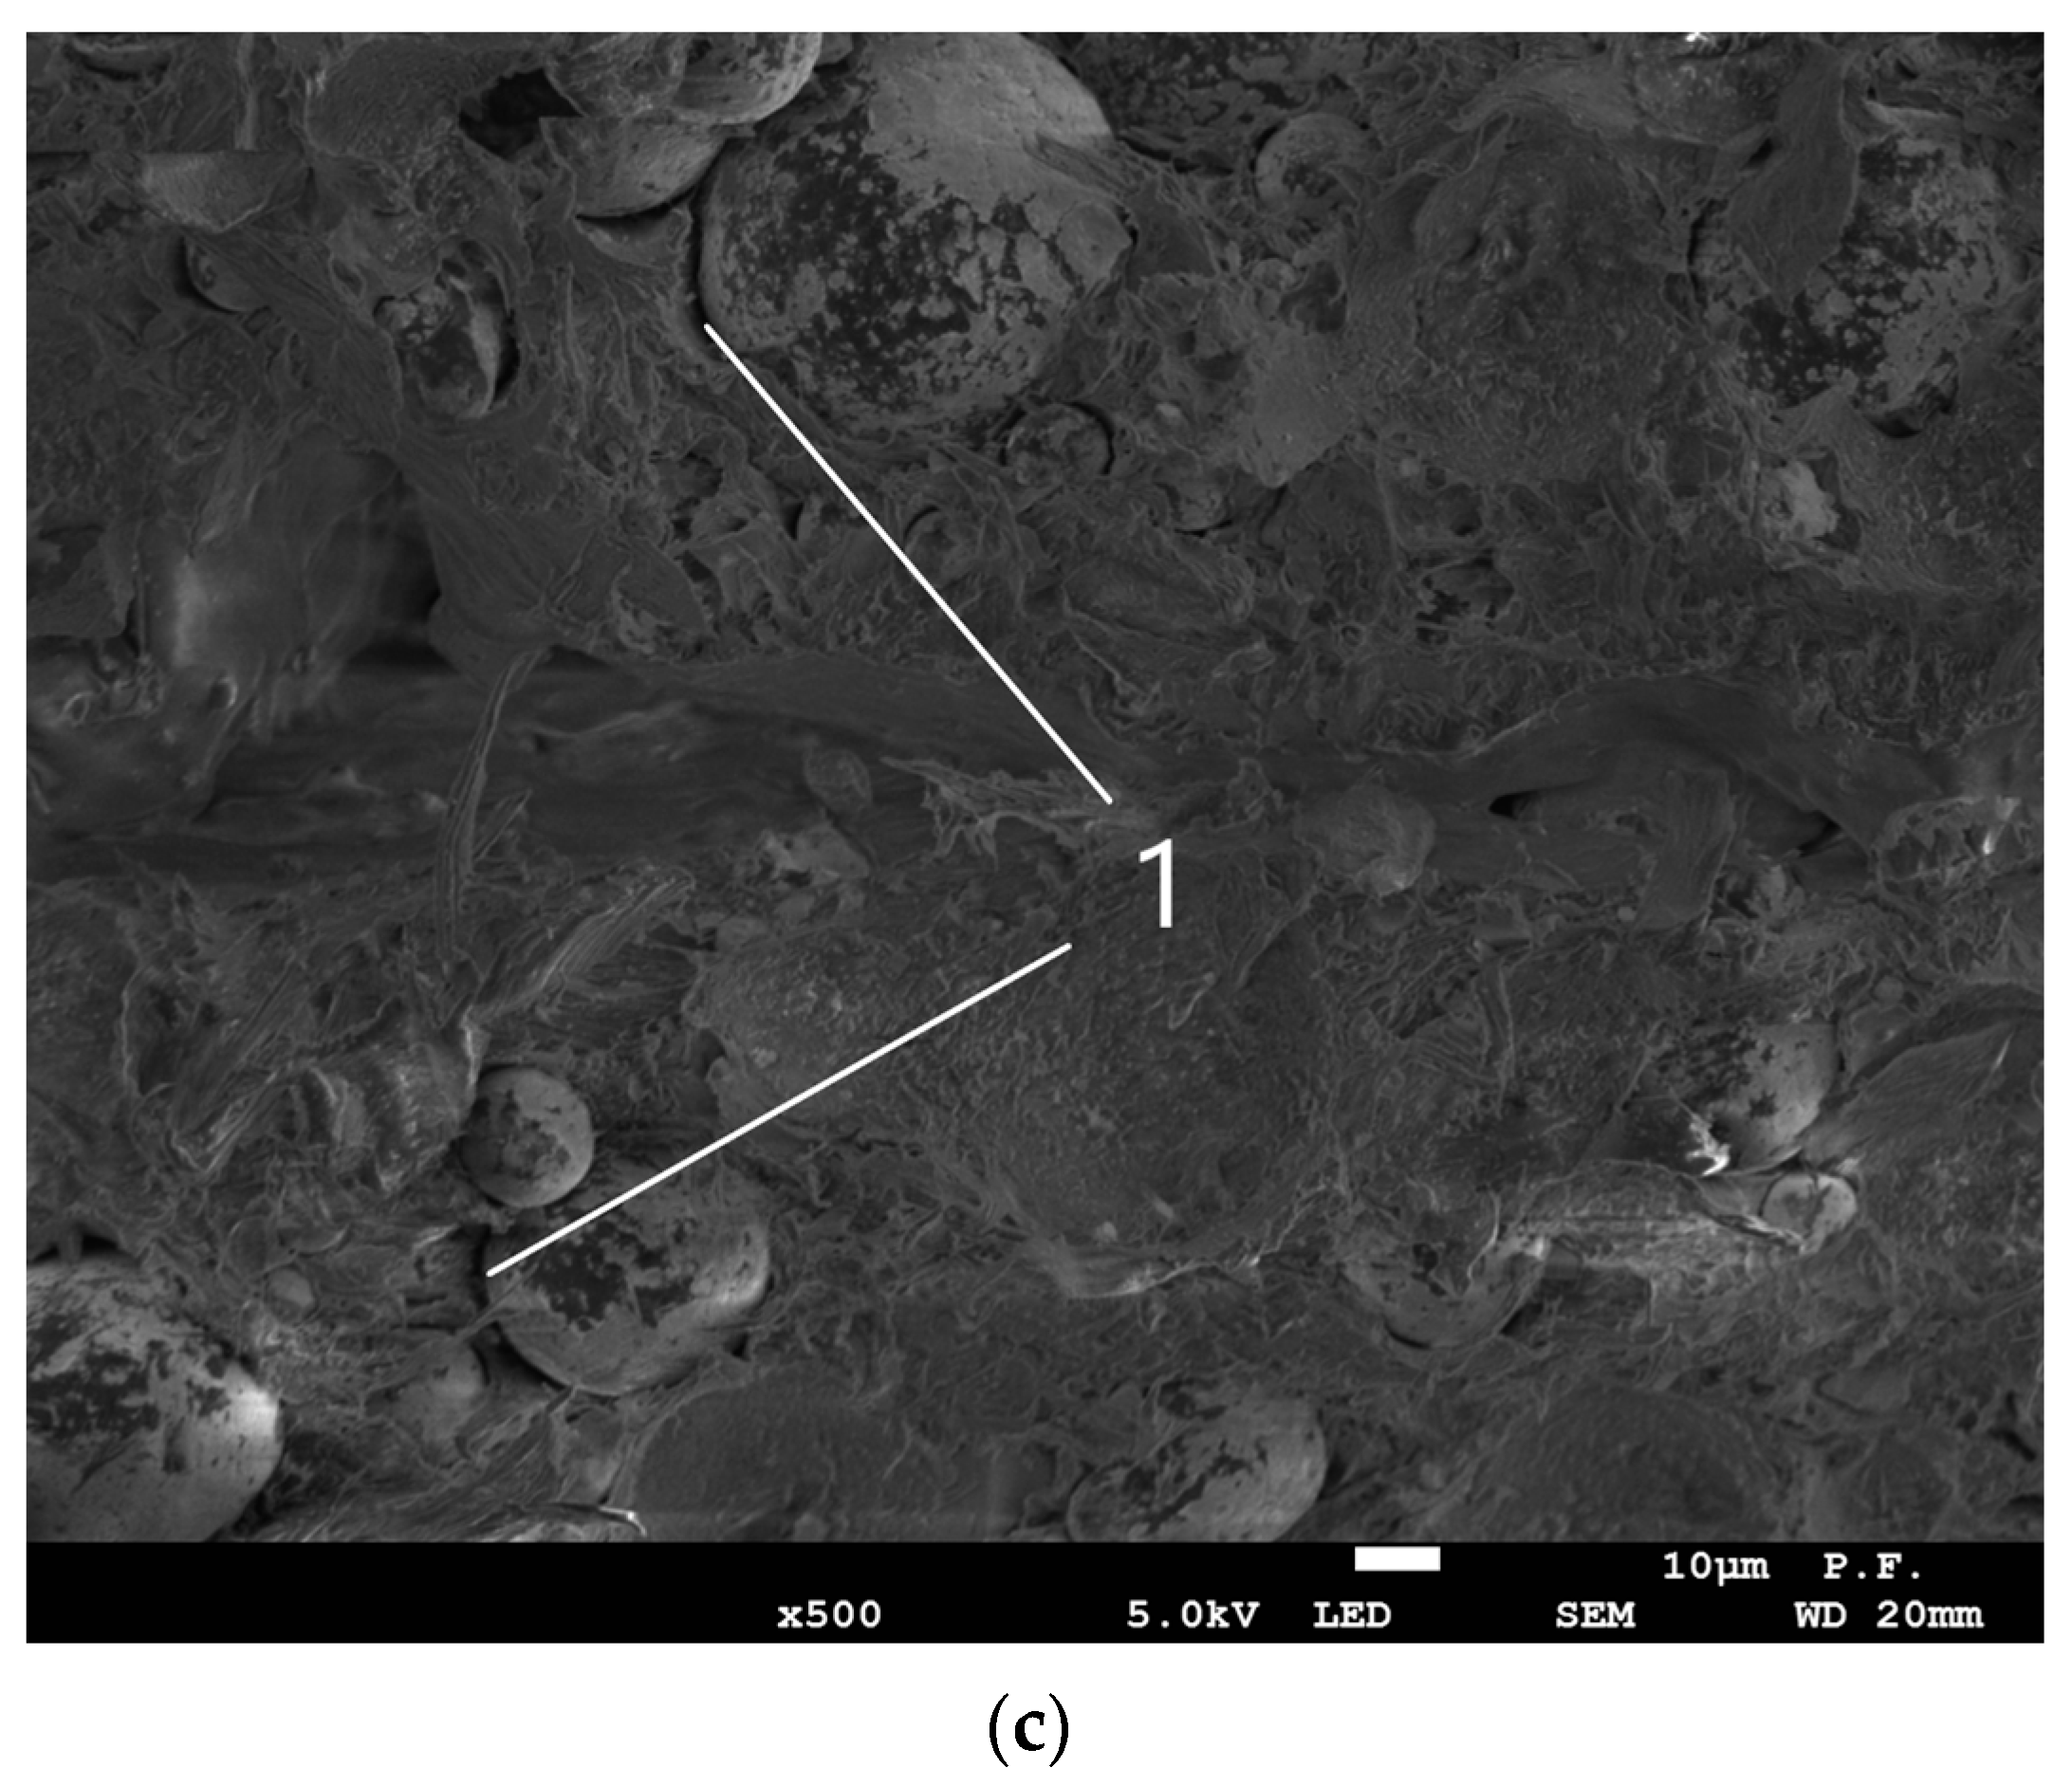
3.3. Microscopy
4. Discussion
5. Conclusions
Author Contributions
Funding
Institutional Review Board Statement
Informed Consent Statement
Data Availability Statement
Acknowledgments
Conflicts of Interest
References
- Liu, Z.; Wang, Y.; Wu, B.; Cui, C.; Guo, Y.; Yan, C. A Critical Review of Fused Deposition Modeling 3D Printing Technology in Manufacturing Polylactic Acid Parts. Int. J. Adv. Manuf. Technol. 2019, 102, 2877–2889. [Google Scholar] [CrossRef]
- Cantrell, J.T.; Rohde, S.; Damiani, D.; Gurnani, R.; DiSandro, L.; Anton, J.; Young, A.; Jerez, A.; Steinbach, D.; Kroese, C.; et al. Experimental Characterization of the Mechanical Properties of 3D-Printed ABS and Polycarbonate Parts. RAPID Prototyp. J. 2017, 23, 811–824. [Google Scholar] [CrossRef]
- Serra, T.; Planell, J.A.; Navarro, M. High-Resolution PLA-Based Composite Scaffolds via 3-D Printing Technology. Acta Biomater. 2013, 9, 5521–5530. [Google Scholar] [CrossRef] [PubMed]
- Murariu, M.; Dubois, P. PLA Composites: From Production to Properties. Adv. Drug Deliv. Rev. 2016, 107, 17–46. [Google Scholar] [CrossRef]
- Bajpai, P.K.; Singh, I.; Madaan, J. Tribological Behavior of Natural Fiber Reinforced PLA Composites. Wear 2013, 297, 829–840. [Google Scholar] [CrossRef]
- Hanon, M.M.; Marczis, R.; Zsidai, L. Anisotropy Evaluation of Different Raster Directions, Spatial Orientations, and Fill Percentage of 3D Printed PETG Tensile Test Specimens. In Key Engineering Materials; Trans Tech Publications Ltd.: Stafa-Zurich, Switzerland, 2019; Volume 821, pp. 167–173. [Google Scholar]
- Allum, J.; Gleadall, A.; Silberschmidt, V.V. Fracture of 3D-Printed Polymers: Crucial Role of Filament-Scale Geometric Features. Eng. Fract. Mech. 2020, 224, 106818. [Google Scholar] [CrossRef]
- Wang, X.; Jiang, M.; Zhou, Z.; Gou, J.; Hui, D. 3D Printing of Polymer Matrix Composites: A Review and Prospective. Compos. Part B-Eng. 2017, 110, 442–458. [Google Scholar] [CrossRef]
- Bochnia, J.; Blasiak, M.; Kozior, T. Tensile Strength Analysis of Thin-Walled Polymer Glass Fiber Reinforced Manufactured by 3D Printing Technology. Polymers 2020, 12, 2783. [Google Scholar] [CrossRef]
- Tekinalp, H.L.; Kunc, V.; Velez-Garcia, G.M.; Duty, C.E.; Love, L.J.; Naskar, A.K.; Blue, C.A.; Ozcan, S. Highly Oriented Carbon Fiber-Polymer Composites via Additive Manufacturing. Compos. Sci. Technol. 2014, 105, 144–150. [Google Scholar] [CrossRef]
- Bochnia, J.; Blasiak, M.; Kozior, T. A Comparative Study of the Mechanical Properties of FDM 3D Prints Madeof PLA and Carbon Fiber-Reinforced PLA for Thin-Walled Applications. Materials 2021, 14, 7062. [Google Scholar] [CrossRef]
- Kariz, M.; Sernek, M.; Obucina, M.; Kuzman, M.K. Effect of Wood Content in FDM Filament on Properties of 3D Printed Parts. Mater. Today Commun. 2018, 14, 135–140. [Google Scholar] [CrossRef]
- Ertane, E.G.; Dorner-Reisel, A.; Baran, O.; Welzel, T.; Matner, V.; Svoboda, S. Processing and Wear Behaviour of 3D Printed PLA Reinforced with Biogenic Carbon. Adv. Tribol. 2018, 2018, 1763182. [Google Scholar] [CrossRef]
- Hanon, M.M.; Alshammas, Y.; Zsidai, L. Effect of Print Orientation and Bronze Existence on Tribological and Mechanical Properties of 3D-Printed Bronze/PLA Composite. Int. J. Adv. Manuf. Technol. 2020, 108, 553–570. [Google Scholar] [CrossRef]
- Unlu, B.S.; Uzkut, M.; Atik, E. Tribological Behaviors of Polymer-Based Particle-Reinforced PTFE Composite Bearings. J. Reinf. Plast. Compos. 2010, 29, 1353–1358. [Google Scholar] [CrossRef]
- Unal, H.; Kurtulus, E.; Mimaroglu, A.; Aydin, M. Tribological Performance of PTFE Bronze Filled Composites under Wide Range of Application Conditions. J. Reinf. Plast. Compos. 2010, 29, 2184–2191. [Google Scholar] [CrossRef]
- Sava, M.; Nagy, R.; Menyhardt, K. Characteristics of 3D Printable Bronze PLA-Based Filament Composites for Gaskets. Materials 2021, 14, 4770. [Google Scholar] [CrossRef]
- Sneha, P.; Balamurugan, K. Investigation on Wear Characteristics of a PLA-14% Bronze Composite Filament. In Recent Trends in Product Design and Intelligent Manufacturing Systems; Deepak, B.B.V.L., Bahubalendruni, M.V.A.R., Parhi, D.R.K., Biswal, B.B., Eds.; Springer Nature Singapore: Singapore, 2023; pp. 453–461. [Google Scholar]
- Sneha, P.; Balamurugan, K.; Kalusuraman, G. Effects of Fused Deposition Model Parameters on PLA-Bz Composite Filament. IOP Conf. Ser. Mater. Sci. Eng. 2020, 988, 12028. [Google Scholar] [CrossRef]
- Sneha, N.; Balamurugan, K. Micro-Drilling Optimization Study Using RSM on PLA-Bronze Composite Filament Printed Using FDM. In Proceedings of the 2022 IEEE 2nd Mysore Sub Section International Conference (MysuruCon), Mysuru, India, 16–17 October 2022; pp. 1–5. [Google Scholar]
- Wei, X.; Behm, I.; Winkler, T.; Scharf, S.; Li, X.; Baehr, R. Experimental Study on Metal Parts under Variable 3D Printing and Sintering Orientations Using Bronze/PLA Hybrid Filament Coupled with Fused Filament Fabrication. Materials 2022, 15, 5333. [Google Scholar] [CrossRef]
- Dizon, J.R.C.; Espera, A.H., Jr.; Chen, Q.; Advincula, R.C. Mechanical Characterization of 3D-Printed Polymers. Addit. Manuf. 2018, 20, 44–67. [Google Scholar] [CrossRef]
- Saharudin, M.S.; Hajnys, J.; Kozior, T.; Gogolewski, D.; Zmarzły, P. Quality of Surface Texture and Mechanical Properties of PLA and PA-Based Material Reinforced with Carbon Fibers Manufactured by FDM and CFF 3D Printing Technologies. Polymers 2021, 13, 1671. [Google Scholar] [CrossRef]
- Kozior, T.; Bochnia, J.; Gogolewski, D.; Zmarzły, P.; Rudnik, M.; Szot, W.; Szczygieł, P.; Musiałek, M. Analysis of Metrological Quality and Mechanical Properties of Models Manufactured with Photo-Curing PolyJet Matrix Technology for Medical Applications. Polymers 2022, 14, 408. [Google Scholar] [CrossRef] [PubMed]
- ISO Standard 527; Plastics-Determination of Tensile Properties. ISO: Geneva, Switzerland, 2012.
- Forfutura. MetalFilTM-Ancient Bronze-Technical Data Sheet; Forfutura: Nijmegen, The Netherlands, 2016; p. 1. [Google Scholar]
- ISO 1183-1:2019; Plastics—Methods for Determining the Density of Non-Cellular Plastics—Part 1: Immersion Method, Liquid Pycnometer Method and Titration Method. ISO: Geneva, Switzerland, 2019.
- ISO 306:2022; Plastics—Thermoplastic Materials—Determination of Vicat Softening Temperature (VST). ISO: Geneva, Switzerland, 2022.


| Properties | Value | Standard |
|---|---|---|
| Specific gravity | 3.5 g/cc | ISO 1183 [27] |
| Tensile strength | 19.0 MPa | ISO 527 [25] |
| Tensile modulus | 3990 MPa | ISO 527 [25] |
| Elongation at break | 8% | ISO 527 [25] |
| Viscat softening temp | ±65 °C | ISO 306 [28] |
| No.· | ā (mm) | (mm) | No.· | ā (mm) | (mm) | No.· | ā (mm) | (mm) | No.· | ā (mm) | (mm) |
|---|---|---|---|---|---|---|---|---|---|---|---|
| 1.0 1X | 1.09 | 5.24 | 1.4 1X | 1.43 | 5.23 | 1.8 1X | 1.78 | 5.19 | 4.0 1X | 4.00 | 5.23 |
| 1.0 2X | 1.07 | 5.28 | 1.4 2X | 1.39 | 5.18 | 1.8 2X | 1.85 | 5.19 | 4.0 2X | 3.97 | 5.11 |
| 1.0 3X | 1.06 | 5.12 | 1.4 3X | 1.46 | 5.15 | 1.8 3X | 1.87 | 5.19 | 4.0 3X | 4.05 | 5.13 |
| 1.0 4X | 1.04 | 5.16 | 1.4 4X | 1.39 | 5.25 | 1.8 4X | 1.81 | 5.22 | 4.0 4X | 4.04 | 5.13 |
| 1.0 5X | 1.06 | 5.11 | 1.4 5X | 1.43 | 5.14 | 1.8 5X | 1.87 | 5.17 | 4.0 5X | 4.03 | 5.14 |
| 1.06 | 5.18 | 1.42 | 5.19 | 1.84 | 5.19 | 4.02 | 5.15 | ||||
| SD | 0.016 | 0.067 | SD | 0.027 | 0.043 | SD | 0.036 | 0.016 | SD | 0.029 | 0.042 |
| 1.0 1Y | 0.97 | 5.08 | 1.4 1Y | 1.56 | 5.27 | 1.8 1Y | 1.88 | 5.13 | 4.0 1Y | 3.99 | 5.15 |
| 1.0 2Y | 0.98 | 5.09 | 1.4 2Y | 1.54 | 5.27 | 1.8 2Y | 1.83 | 5.13 | 4.0 2Y | 4.03 | 5.15 |
| 1.0 3Y | 0.94 | 5.13 | 1.4 3Y | 1.55 | 5.22 | 1.8 3Y | 1.83 | 5.13 | 4.0 3Y | 4.02 | 5.18 |
| 1.0 4Y | 0.98 | 5.13 | 1.4 4Y | 1.55 | 5.24 | 1.8 4Y | 1.82 | 5.14 | 4.0 4Y | 4.02 | 5.16 |
| 1.0 5Y | 0.95 | 5.14 | 1.4 5Y | 1.54 | 5.18 | 1.8 5Y | 1.83 | 5.13 | 4.0 5Y | 4.02 | 5.19 |
| 0.96 | 5.11 | 1.55 | 5.25 | 1.84 | 5.13 | 4.02 | 5.17 | ||||
| SD | 0.016 | 0.024 | SD | 0.007 | 0.034 | SD | 0.021 | 0.004 | SD | 0.014 | 0.016 |
| 1.0 2Z | - | - | 1.4 2Z | - | - | 1.8 2Z | - | - | 4.0 2Z | 4.04 | 5.30 |
| No.· | Rm (MPa) | εm (%) | No.· | Rm (MPa) | εm (%) | No.· | Rm (MPa) | εm (%) | No.· | Rm (MPa) | εm (%) |
|---|---|---|---|---|---|---|---|---|---|---|---|
| 1.0 1X | 10.59 | 1.8 | 1.4 1X | 8.55 | 1.4 | 1.8 1X | 11.60 | 2.3 | 4.0 1X | 10.40 | 3.6 |
| 1.0 2X | 12.50 | 1.9 | 1.4 2X | 9.41 | 1.7 | 1.8 2X | 9.64 | 2.0 | 4.0 2X | 10.74 | 2.9 |
| 1.0 3X | 12.93 | 2.5 | 1.4 3X | 12.66 | 2.1 | 1.8 3X | 9.23 | 1.9 | 4.0 3X | 10.54 | 3.8 |
| 1.0 4X | 12.48 | 2.1 | 1.4 4X | 11.29 | 1.6 | 1.8 4X | 11.48 | 2.1 | 4.0 4X | 10.87 | 3.3 |
| 1.0 5X | 9.15 | 1.8 | 1.4 5X | 14.16 | 2.6 | 1.8 5X | 10.77 | 2.0 | 4.0 5X | 11.42 | 3.7 |
| 11.53 | 2.0 | 11.21 | 1.9 | 10.54 | 2.1 | 10.64 | 3.4 | ||||
| SD | 1.44 | 0.3 | SD | 2.06 | 0.4 | SD | 0.96 | 0.1 | SD | 0.36 | 0.3 |
| 1.0 1Y | 11.84 | 2.2 | 1.4 1Y | 15.82 | 2.8 | 1.8 1Y | 14.85 | 3.4 | 4.0 1Y | 10.36 | 3.2 |
| 1.0 2Y | 11.65 | 2.3 | 1.4 2Y | 16.04 | 2.4 | 1.8 2Y | 14.97 | 3.3 | 4.0 2Y | 10.32 | 3.5 |
| 1.0 3Y | 12.37 | 2.2 | 1.4 3Y | 16.37 | 2.6 | 1.8 3Y | 14.83 | 3.4 | 4.0 3Y | 10.55 | 3.4 |
| 1.0 4Y | 12.17 | 3.0 | 1.4 4Y | 16.04 | 2.5 | 1.8 4Y | 13.40 | 3.0 | 4.0 4Y | 10.08 | 3.9 |
| 1.0 5Y | 10.17 | 1.8 | 1.4 5Y | 16.87 | 2.9 | 1.8 5Y | 14.59 | 3.8 | 4.0 5Y | 10.47 | 3.5 |
| 11.64 | 2.3 | 16.23 | 2.6 | 14.53 | 3.4 | 10.35 | 3.5 | ||||
| SD | 0.78 | 0.4 | SD | 0.36 | 0.2 | SD | 0.58 | 0.2 | SD | 0.16 | 0.2 |
| 1.0 Z | - | - | 1.4 Z | - | - | 1.8 Z | - | - | 4.0 2Z | 0.94 | 1.8 |
| No. | E | No. | E | No. | E | No. | E |
|---|---|---|---|---|---|---|---|
| 1.0 1X | 615.87 | 1.4 1X | 611.03 | 1.8 1X | 514.2 | 4.0 1X | 289.22 |
| 1.0 2X | 699.13 | 1.4 2X | 534.38 | 1.8 2X | 489.62 | 4.0 2X | 382.03 |
| 1.0 3X | 534.03 | 1.4 3X | 616.37 | 1.8 3X | 510.9 | 4.0 3X | 277.45 |
| 1.0 4X | 601.02 | 1.4 4X | 713.67 | 1.8 4X | 546.96 | 4.0 4X | 345.38 |
| 1.0 5X | 535.92 | 1.4 5X | 547.15 | 1.8 5X | 549.68 | 4.0 5X | 320.1 |
| 597.19 | 604.52 | 522.27 | 322.84 | ||||
| SD | 60.83 | SD | 63.73 | SD | 22.90 | SD | 37.97 |
| 1.0 1Y | 546.35 | 1.4 1Y | 602.4 | 1.8 1Y | 454.61 | 4.0 1Y | 332.31 |
| 1.0 2Y | 525.07 | 1.4 2Y | 674.22 | 1.8 2Y | 470.03 | 4.0 2Y | 300.46 |
| 1.0 3Y | 582.52 | 1.4 3Y | 634.29 | 1.8 3Y | 442.53 | 4.0 3Y | 324.94 |
| 1.0 4Y | 424.94 | 1.4 4Y | 643.81 | 1.8 4Y | 463.12 | 4.0 4Y | 264.78 |
| 1.0 5Y | 570.89 | 1.4 5Y | 591.34 | 1.8 5Y | 380.77 | 4.0 5Y | 306.57 |
| 529.95 | 629.21 | 442.21 | 305.81 | ||||
| SD | 56.14 | SD | 29.72 | SD | 32.06 | SD | 23.58 |
| 1.0 Z | - | 1.4 Z | - | 1.8 Z | - | 4.0 2Z | 104.24 |
Disclaimer/Publisher’s Note: The statements, opinions and data contained in all publications are solely those of the individual author(s) and contributor(s) and not of MDPI and/or the editor(s). MDPI and/or the editor(s) disclaim responsibility for any injury to people or property resulting from any ideas, methods, instructions or products referred to in the content. |
© 2023 by the authors. Licensee MDPI, Basel, Switzerland. This article is an open access article distributed under the terms and conditions of the Creative Commons Attribution (CC BY) license (https://creativecommons.org/licenses/by/4.0/).
Share and Cite
Bochnia, J.; Kozior, T.; Blasiak, M. The Mechanical Properties of Thin-Walled Specimens Printed from a Bronze-Filled PLA-Based Composite Filament Using Fused Deposition Modelling. Materials 2023, 16, 3241. https://doi.org/10.3390/ma16083241
Bochnia J, Kozior T, Blasiak M. The Mechanical Properties of Thin-Walled Specimens Printed from a Bronze-Filled PLA-Based Composite Filament Using Fused Deposition Modelling. Materials. 2023; 16(8):3241. https://doi.org/10.3390/ma16083241
Chicago/Turabian StyleBochnia, Jerzy, Tomasz Kozior, and Malgorzata Blasiak. 2023. "The Mechanical Properties of Thin-Walled Specimens Printed from a Bronze-Filled PLA-Based Composite Filament Using Fused Deposition Modelling" Materials 16, no. 8: 3241. https://doi.org/10.3390/ma16083241
APA StyleBochnia, J., Kozior, T., & Blasiak, M. (2023). The Mechanical Properties of Thin-Walled Specimens Printed from a Bronze-Filled PLA-Based Composite Filament Using Fused Deposition Modelling. Materials, 16(8), 3241. https://doi.org/10.3390/ma16083241