
Microwave-Reactor-Based Preparation of Red Iron Oxide Pigment from Waste Iron Sulfate


Abstract
:1. Introduction
2. Materials and Methods
2.1. Materials
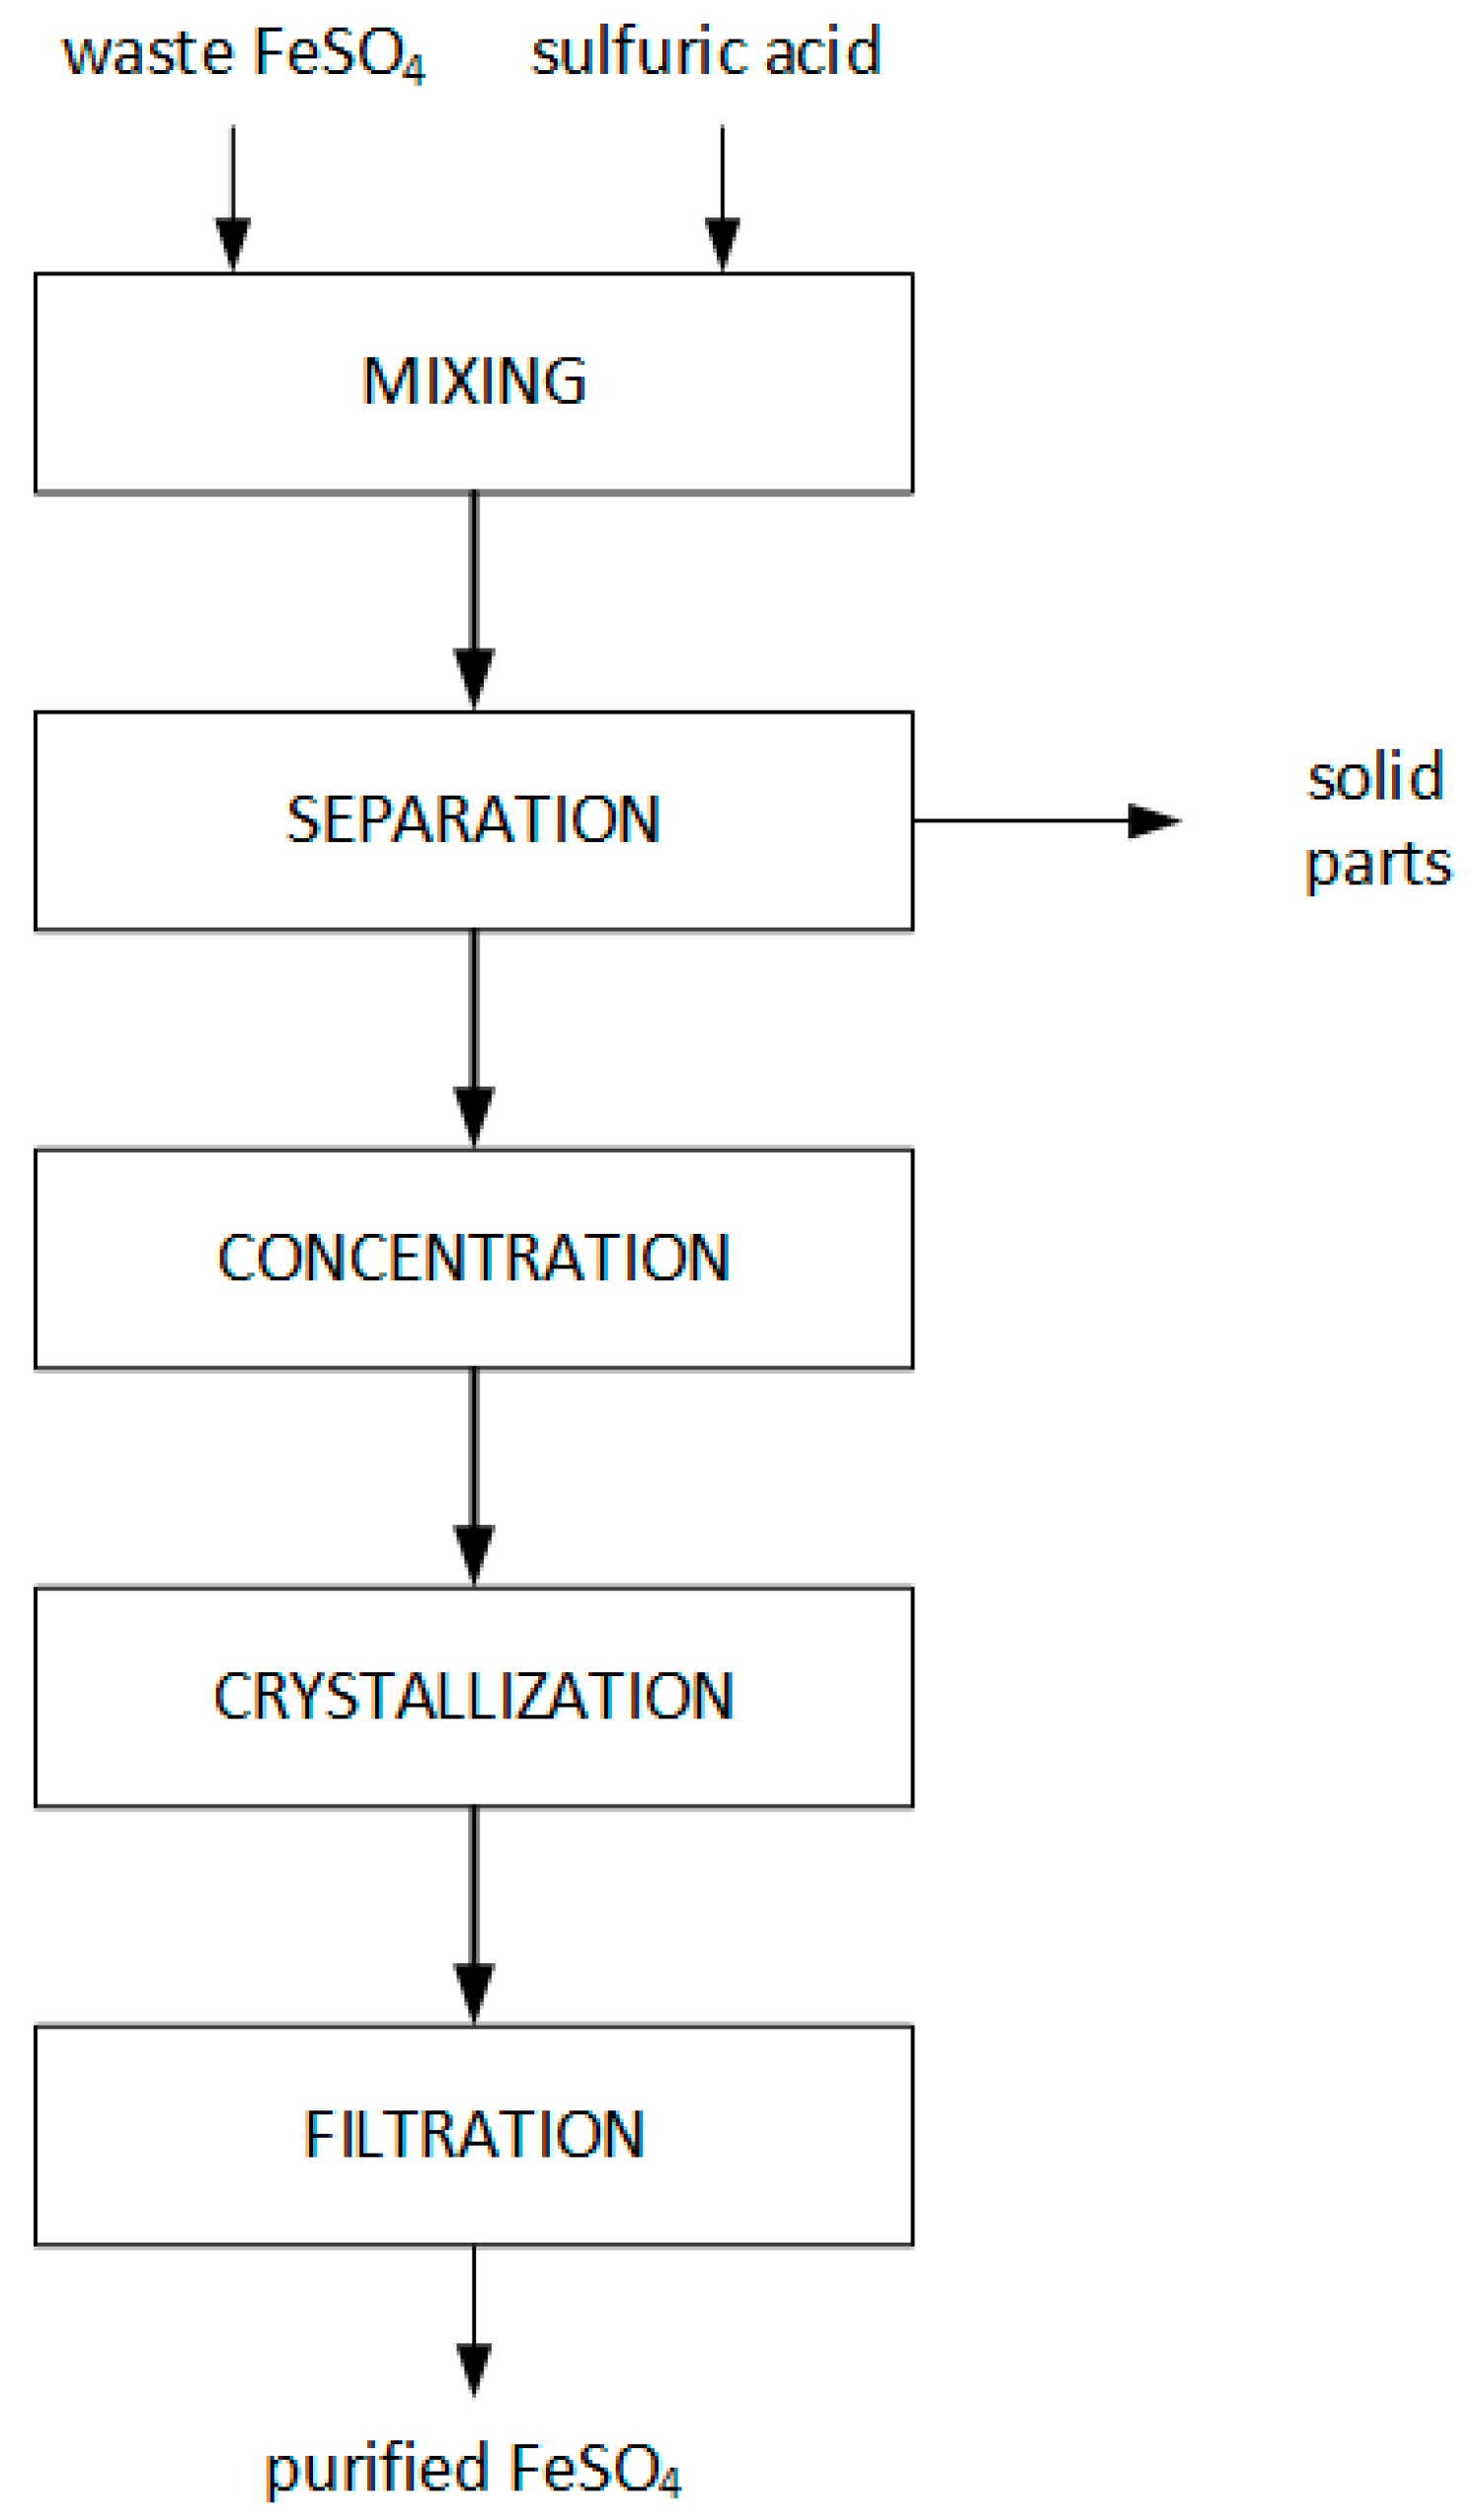
2.2. Purification of Waste FeSO4
2.3. Preparation of Iron Pigments
2.4. Analytical Methods
3. Results and Discussion
3.1. Iron Pigment Characterization
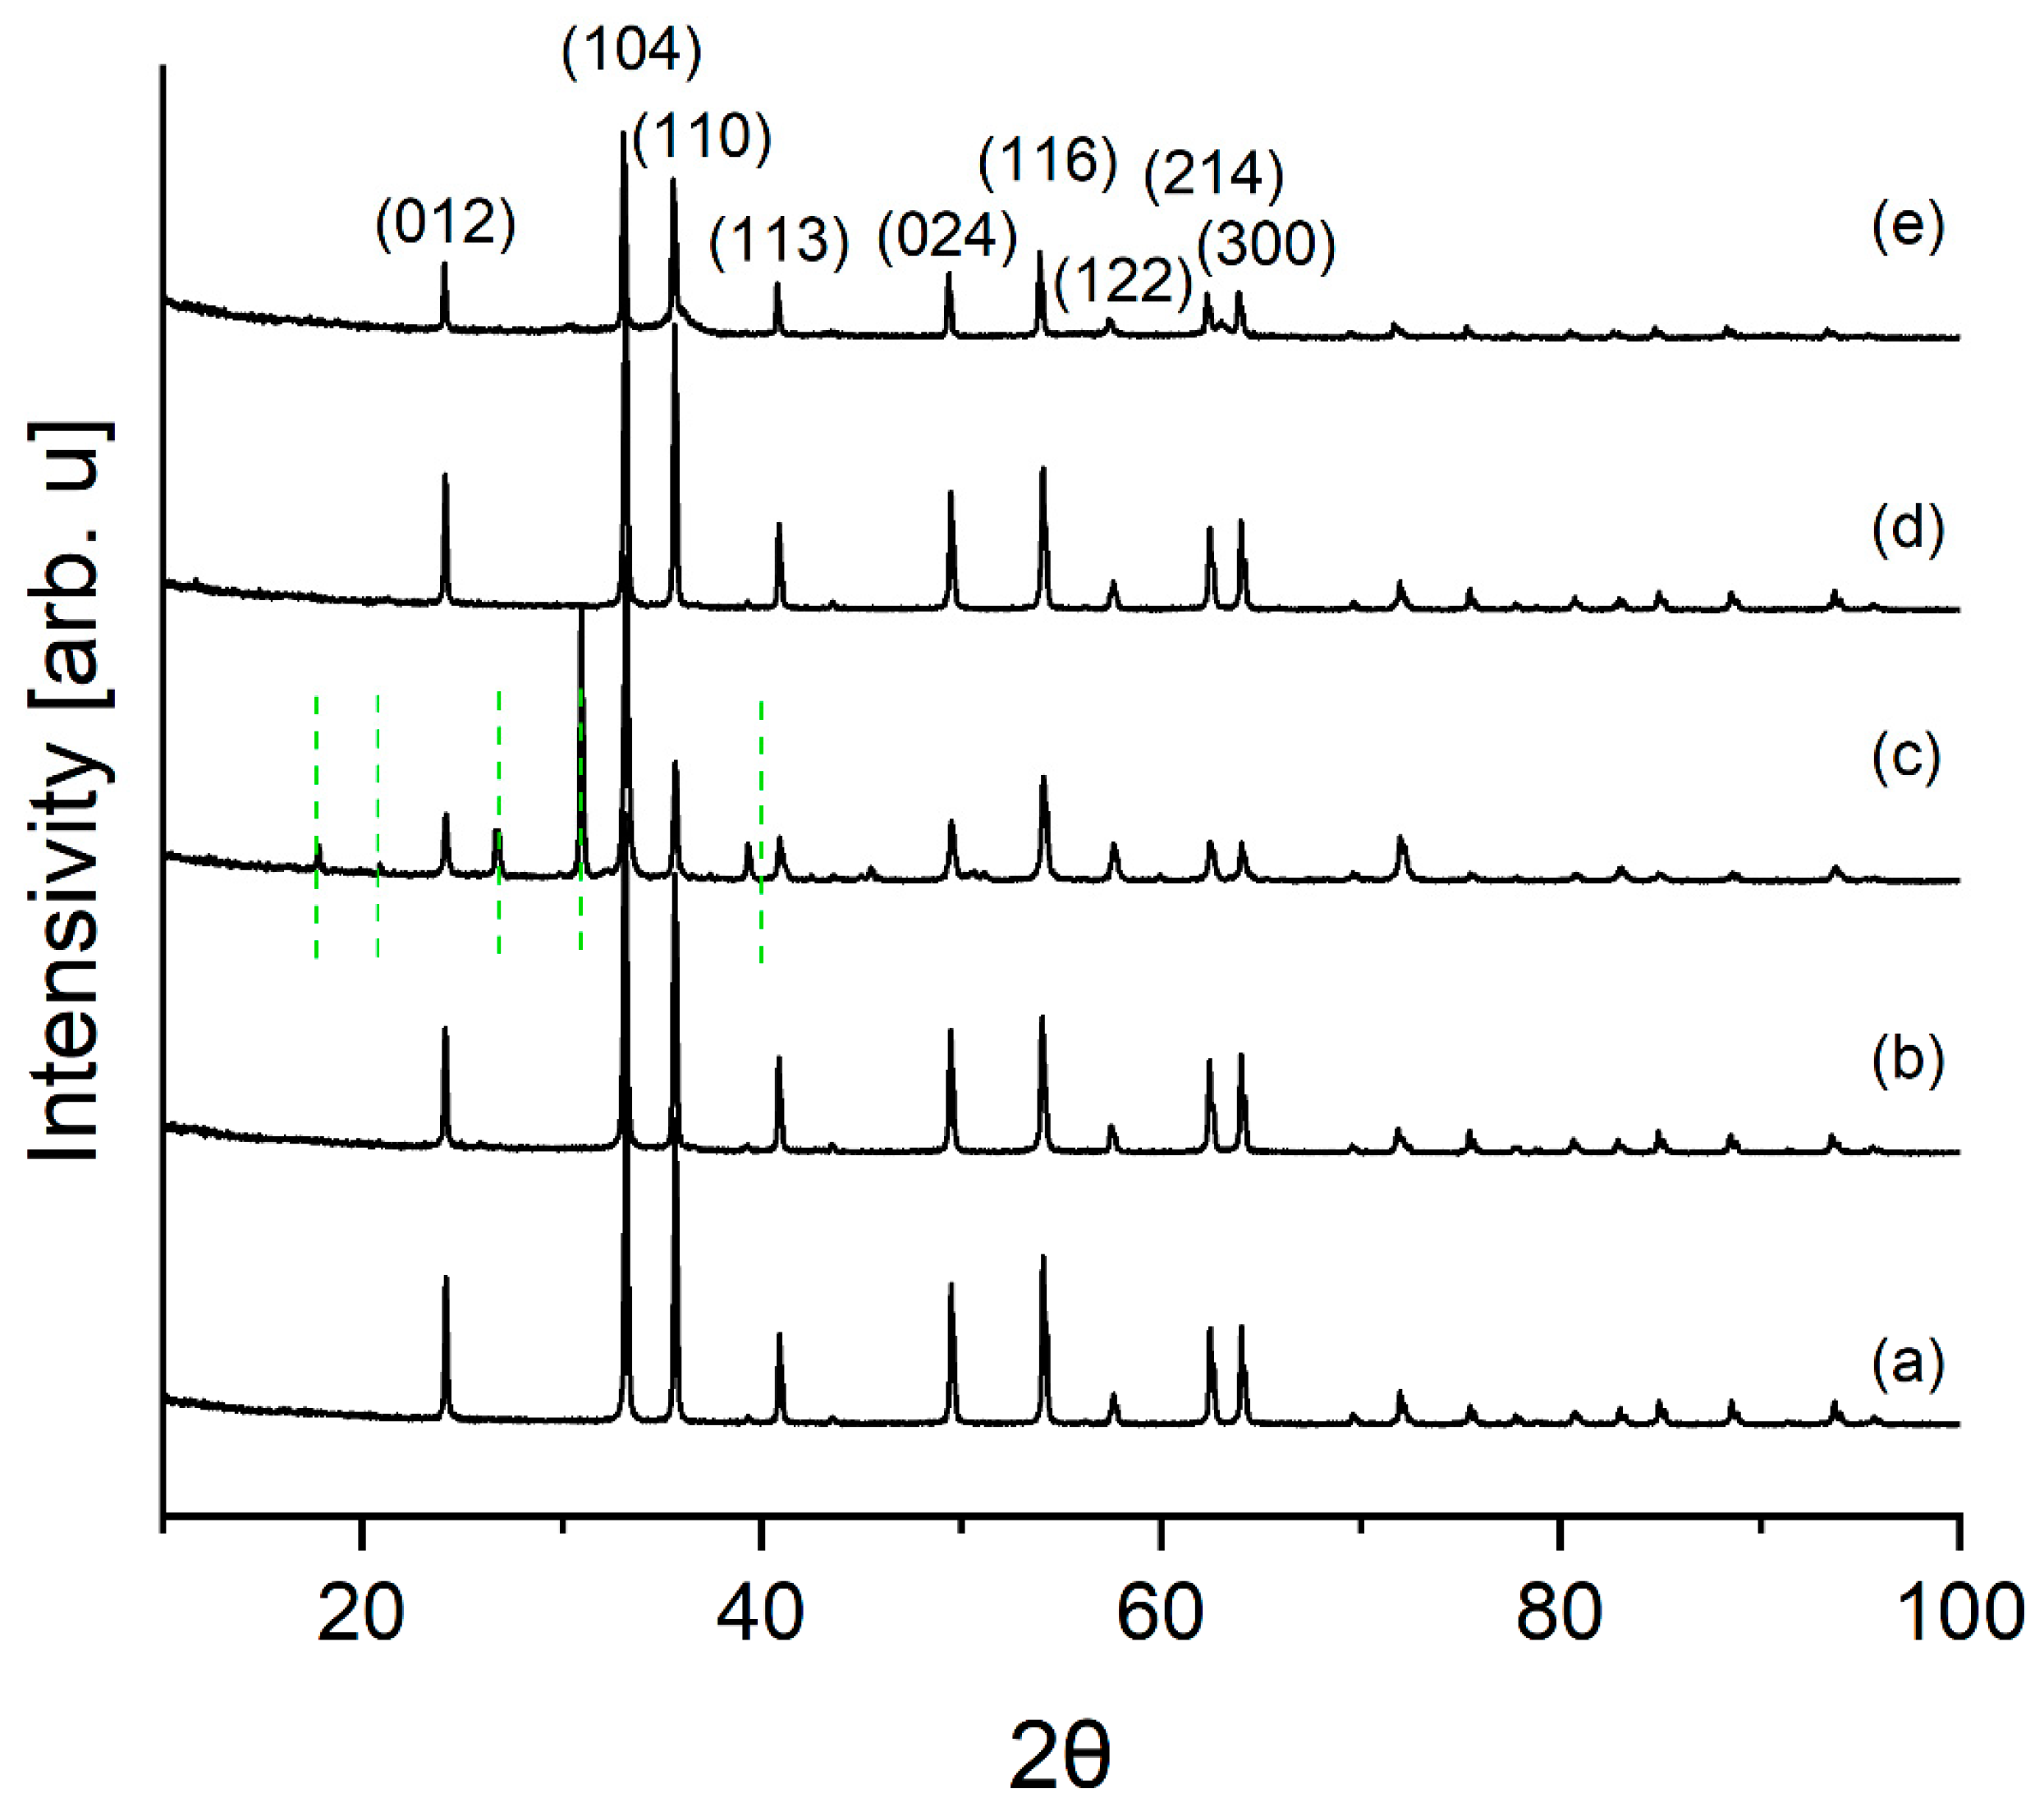
3.1.1. XRD
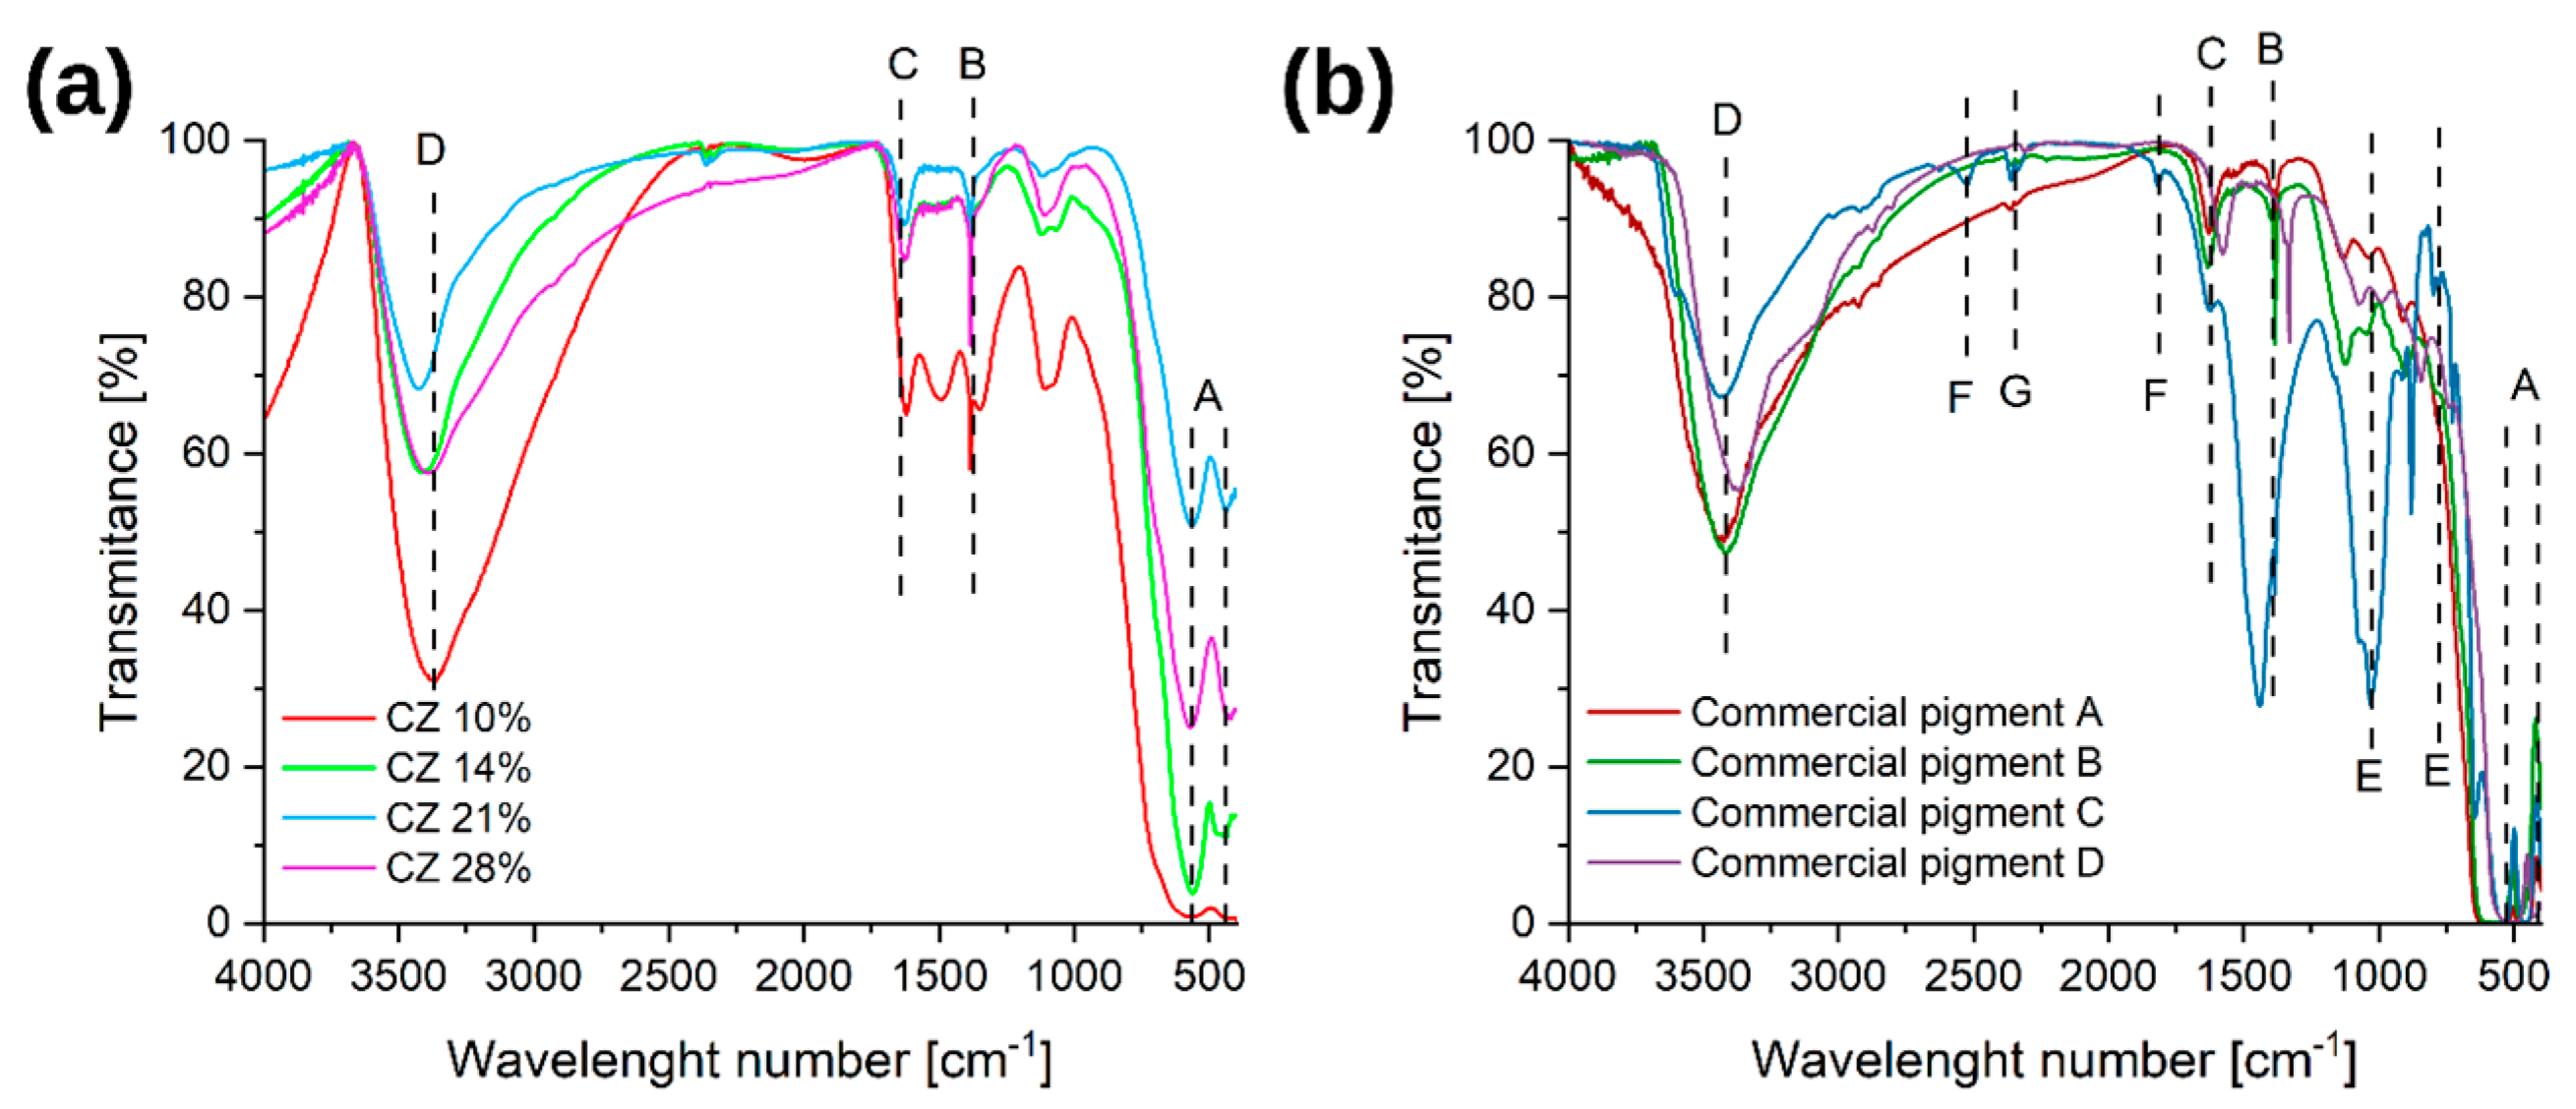
3.1.2. FT-IR
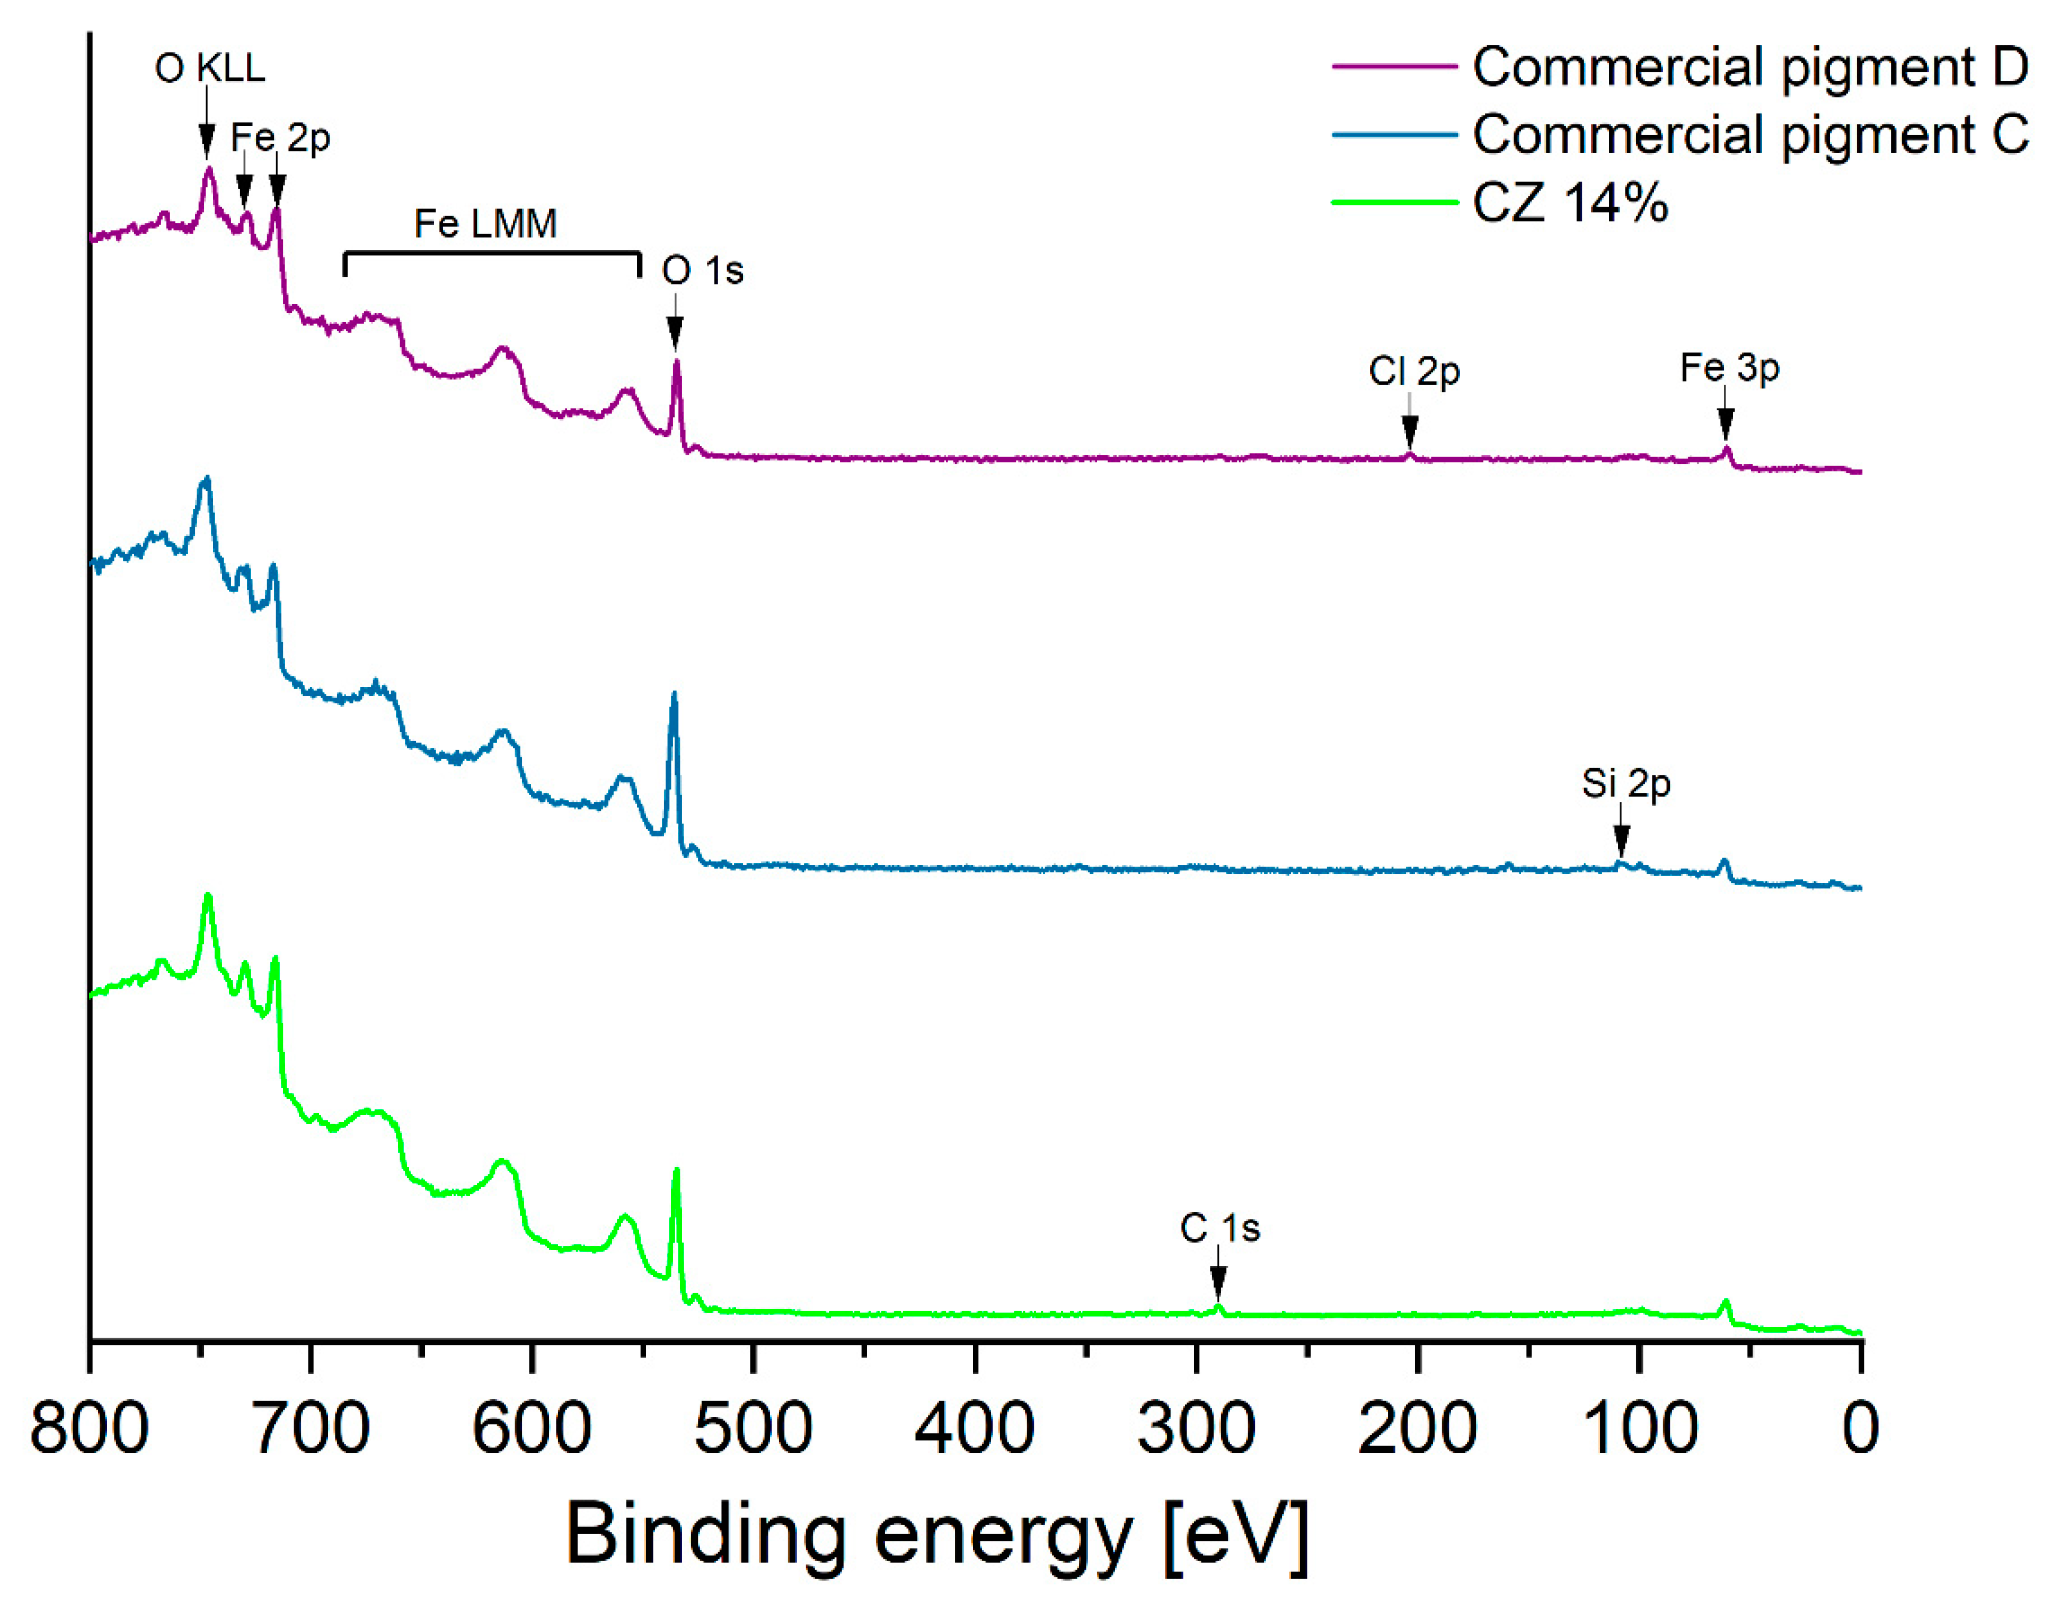
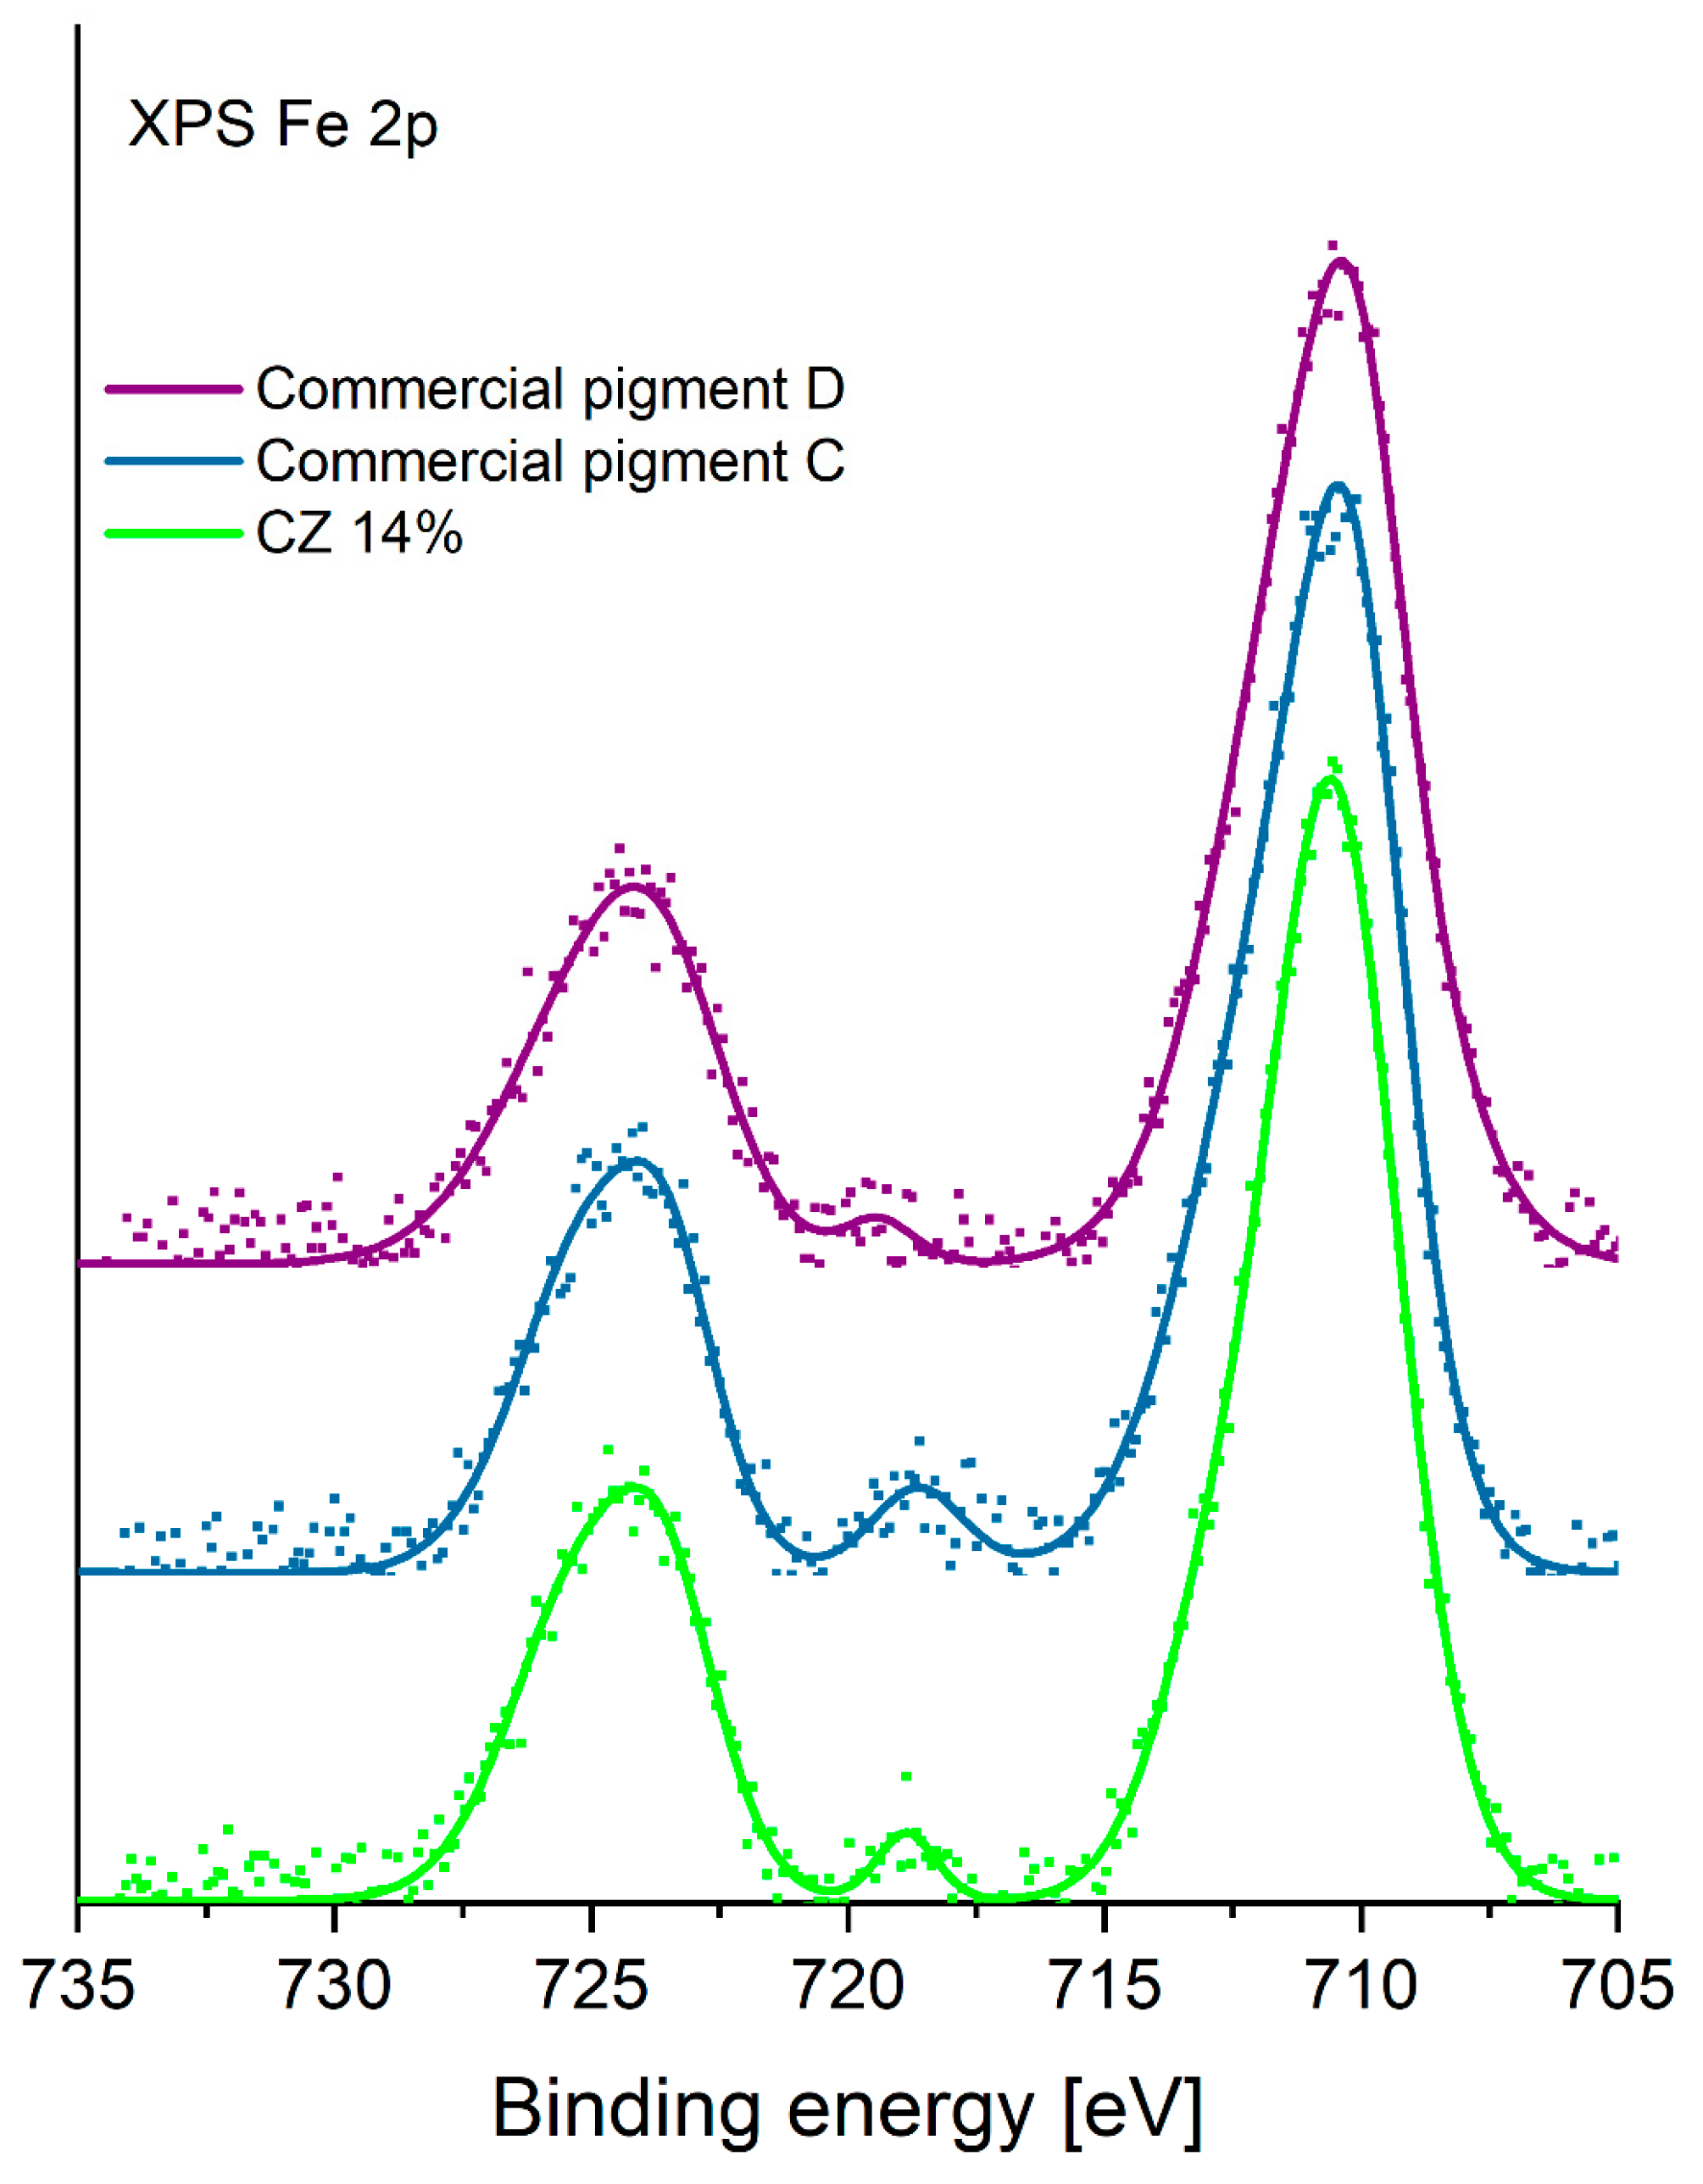
3.1.3. XPS
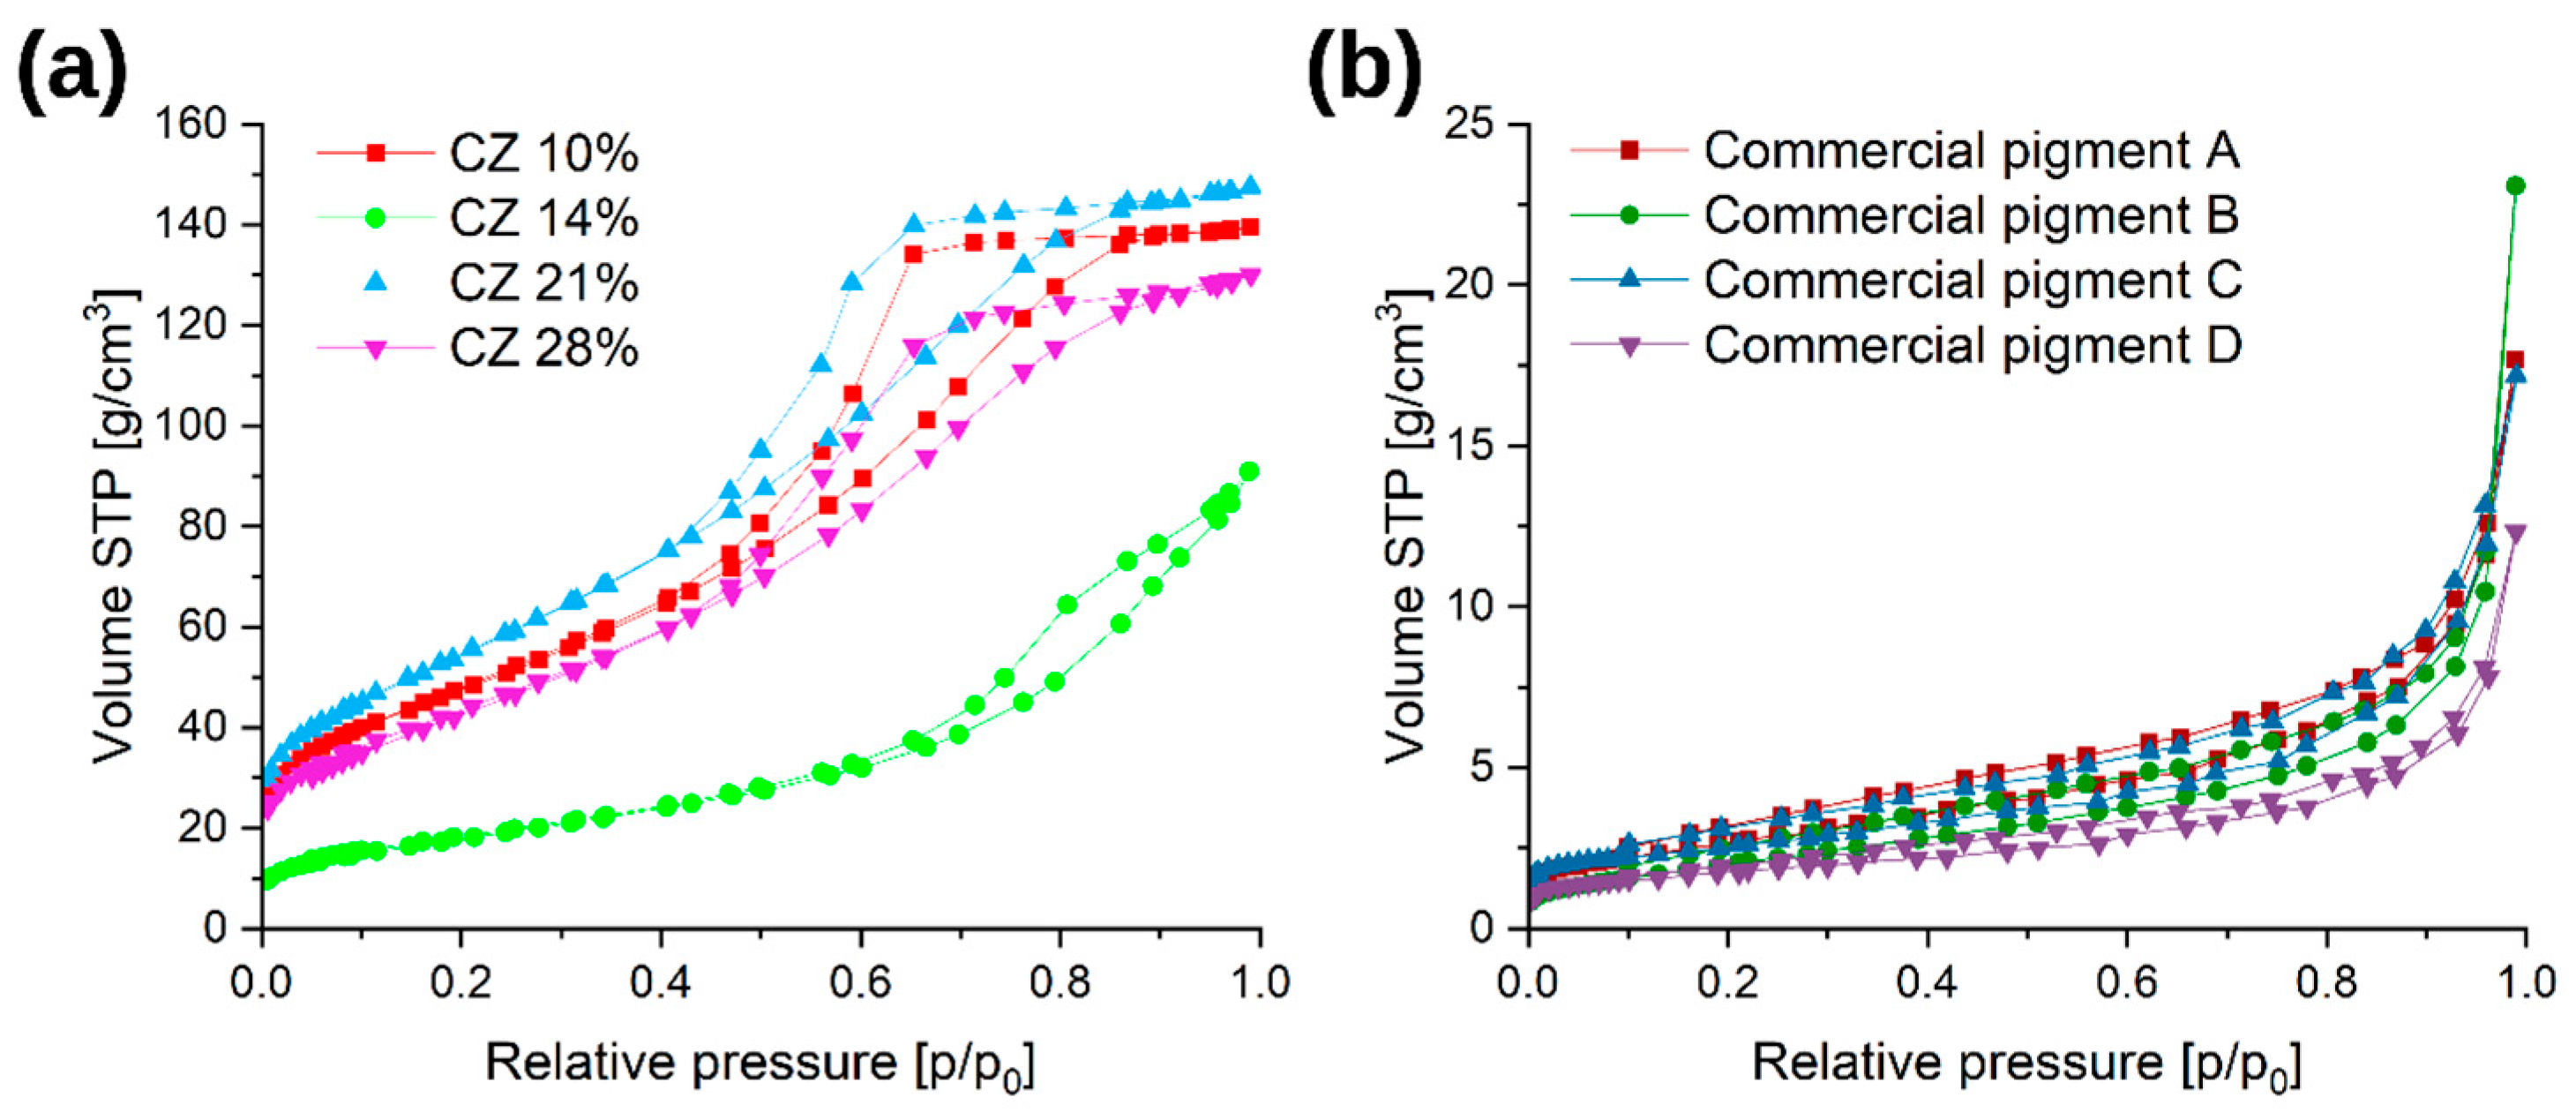
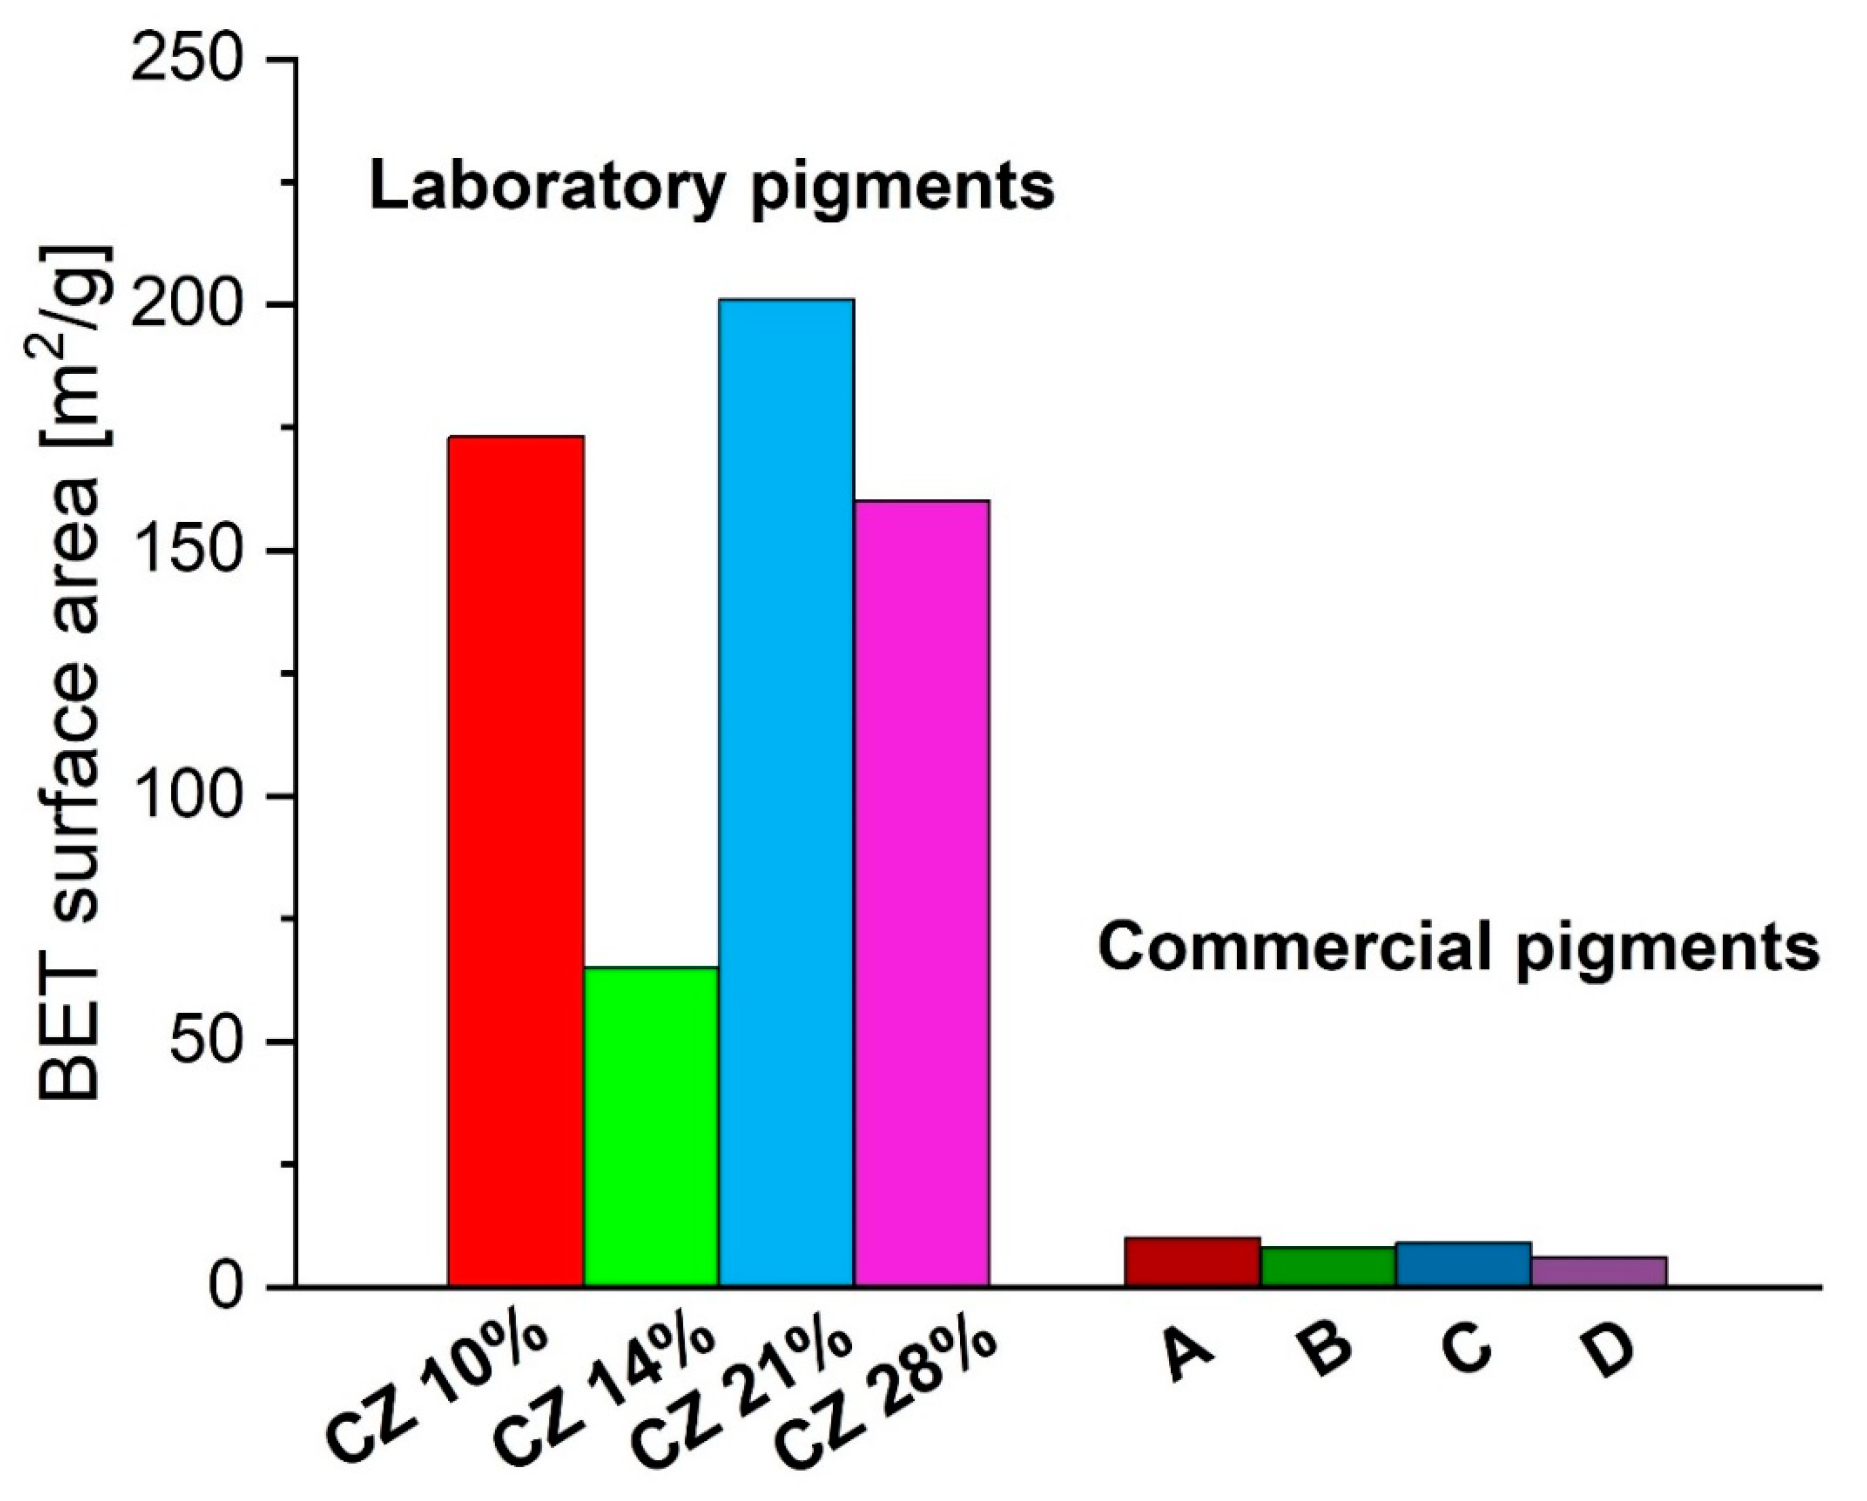
3.1.4. Determination of the Specific Surface by the BET Method
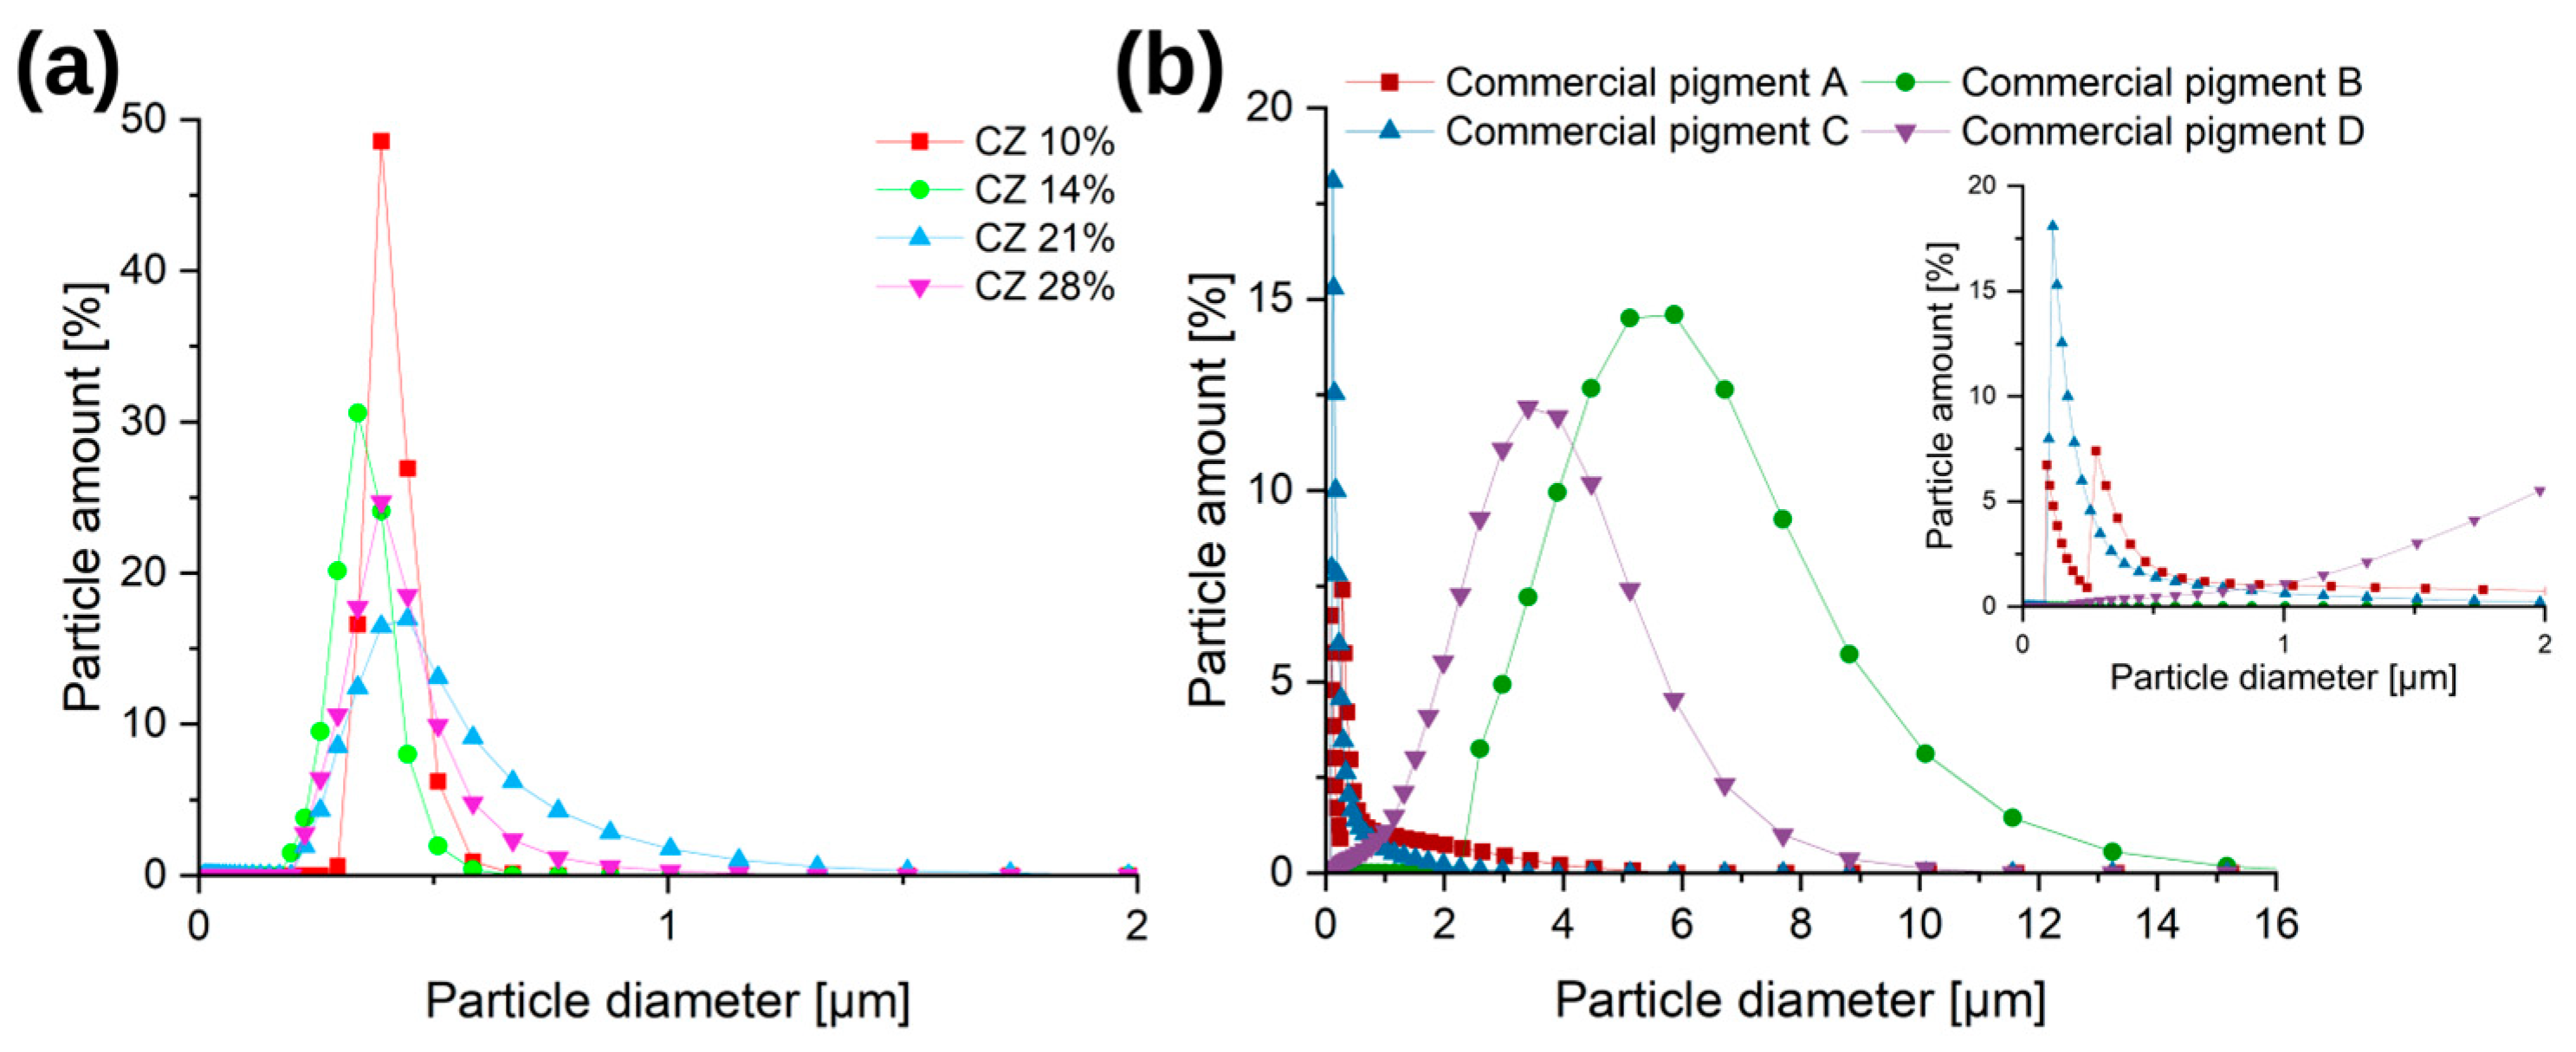
3.1.5. DLS
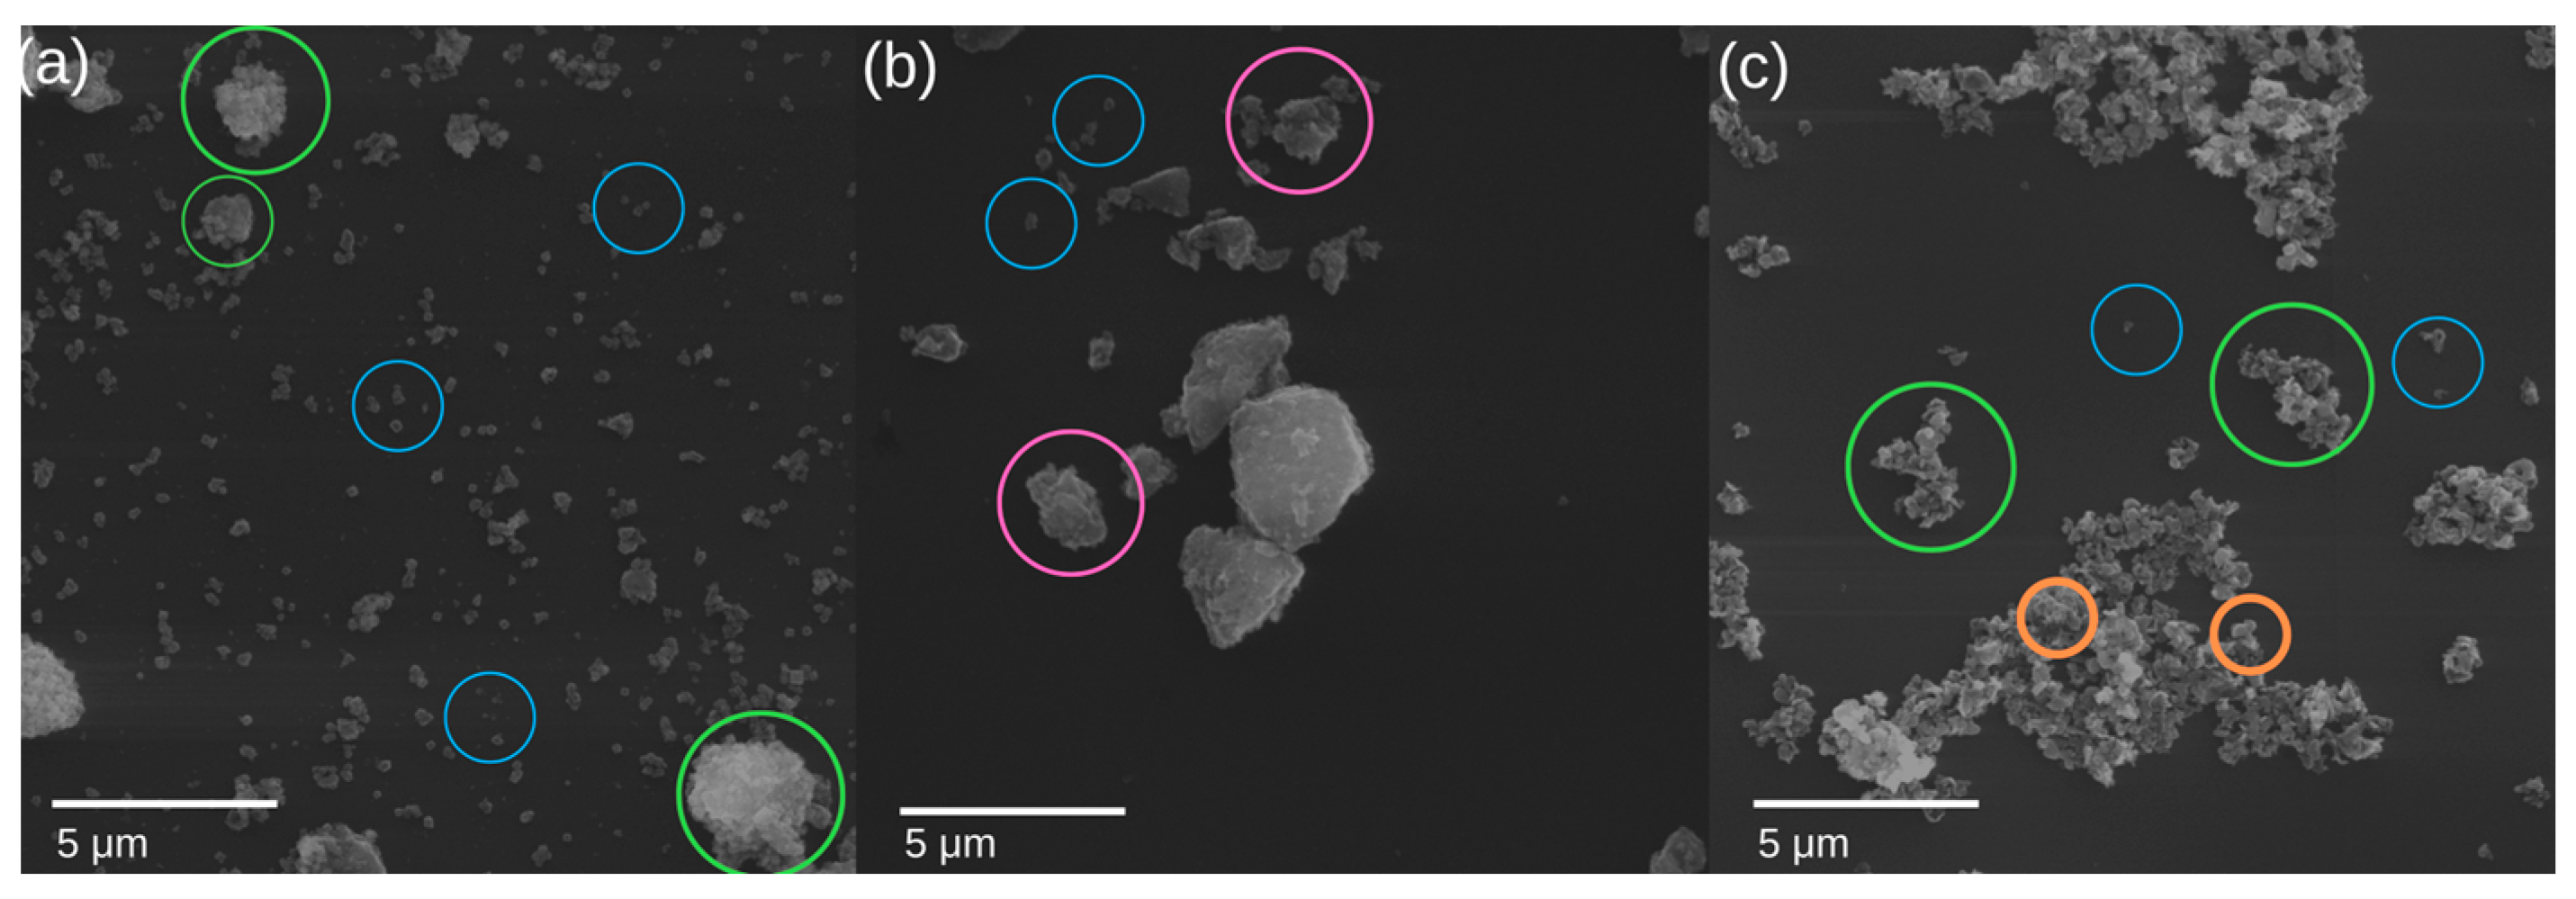
3.1.6. Pigment Observation on SEM
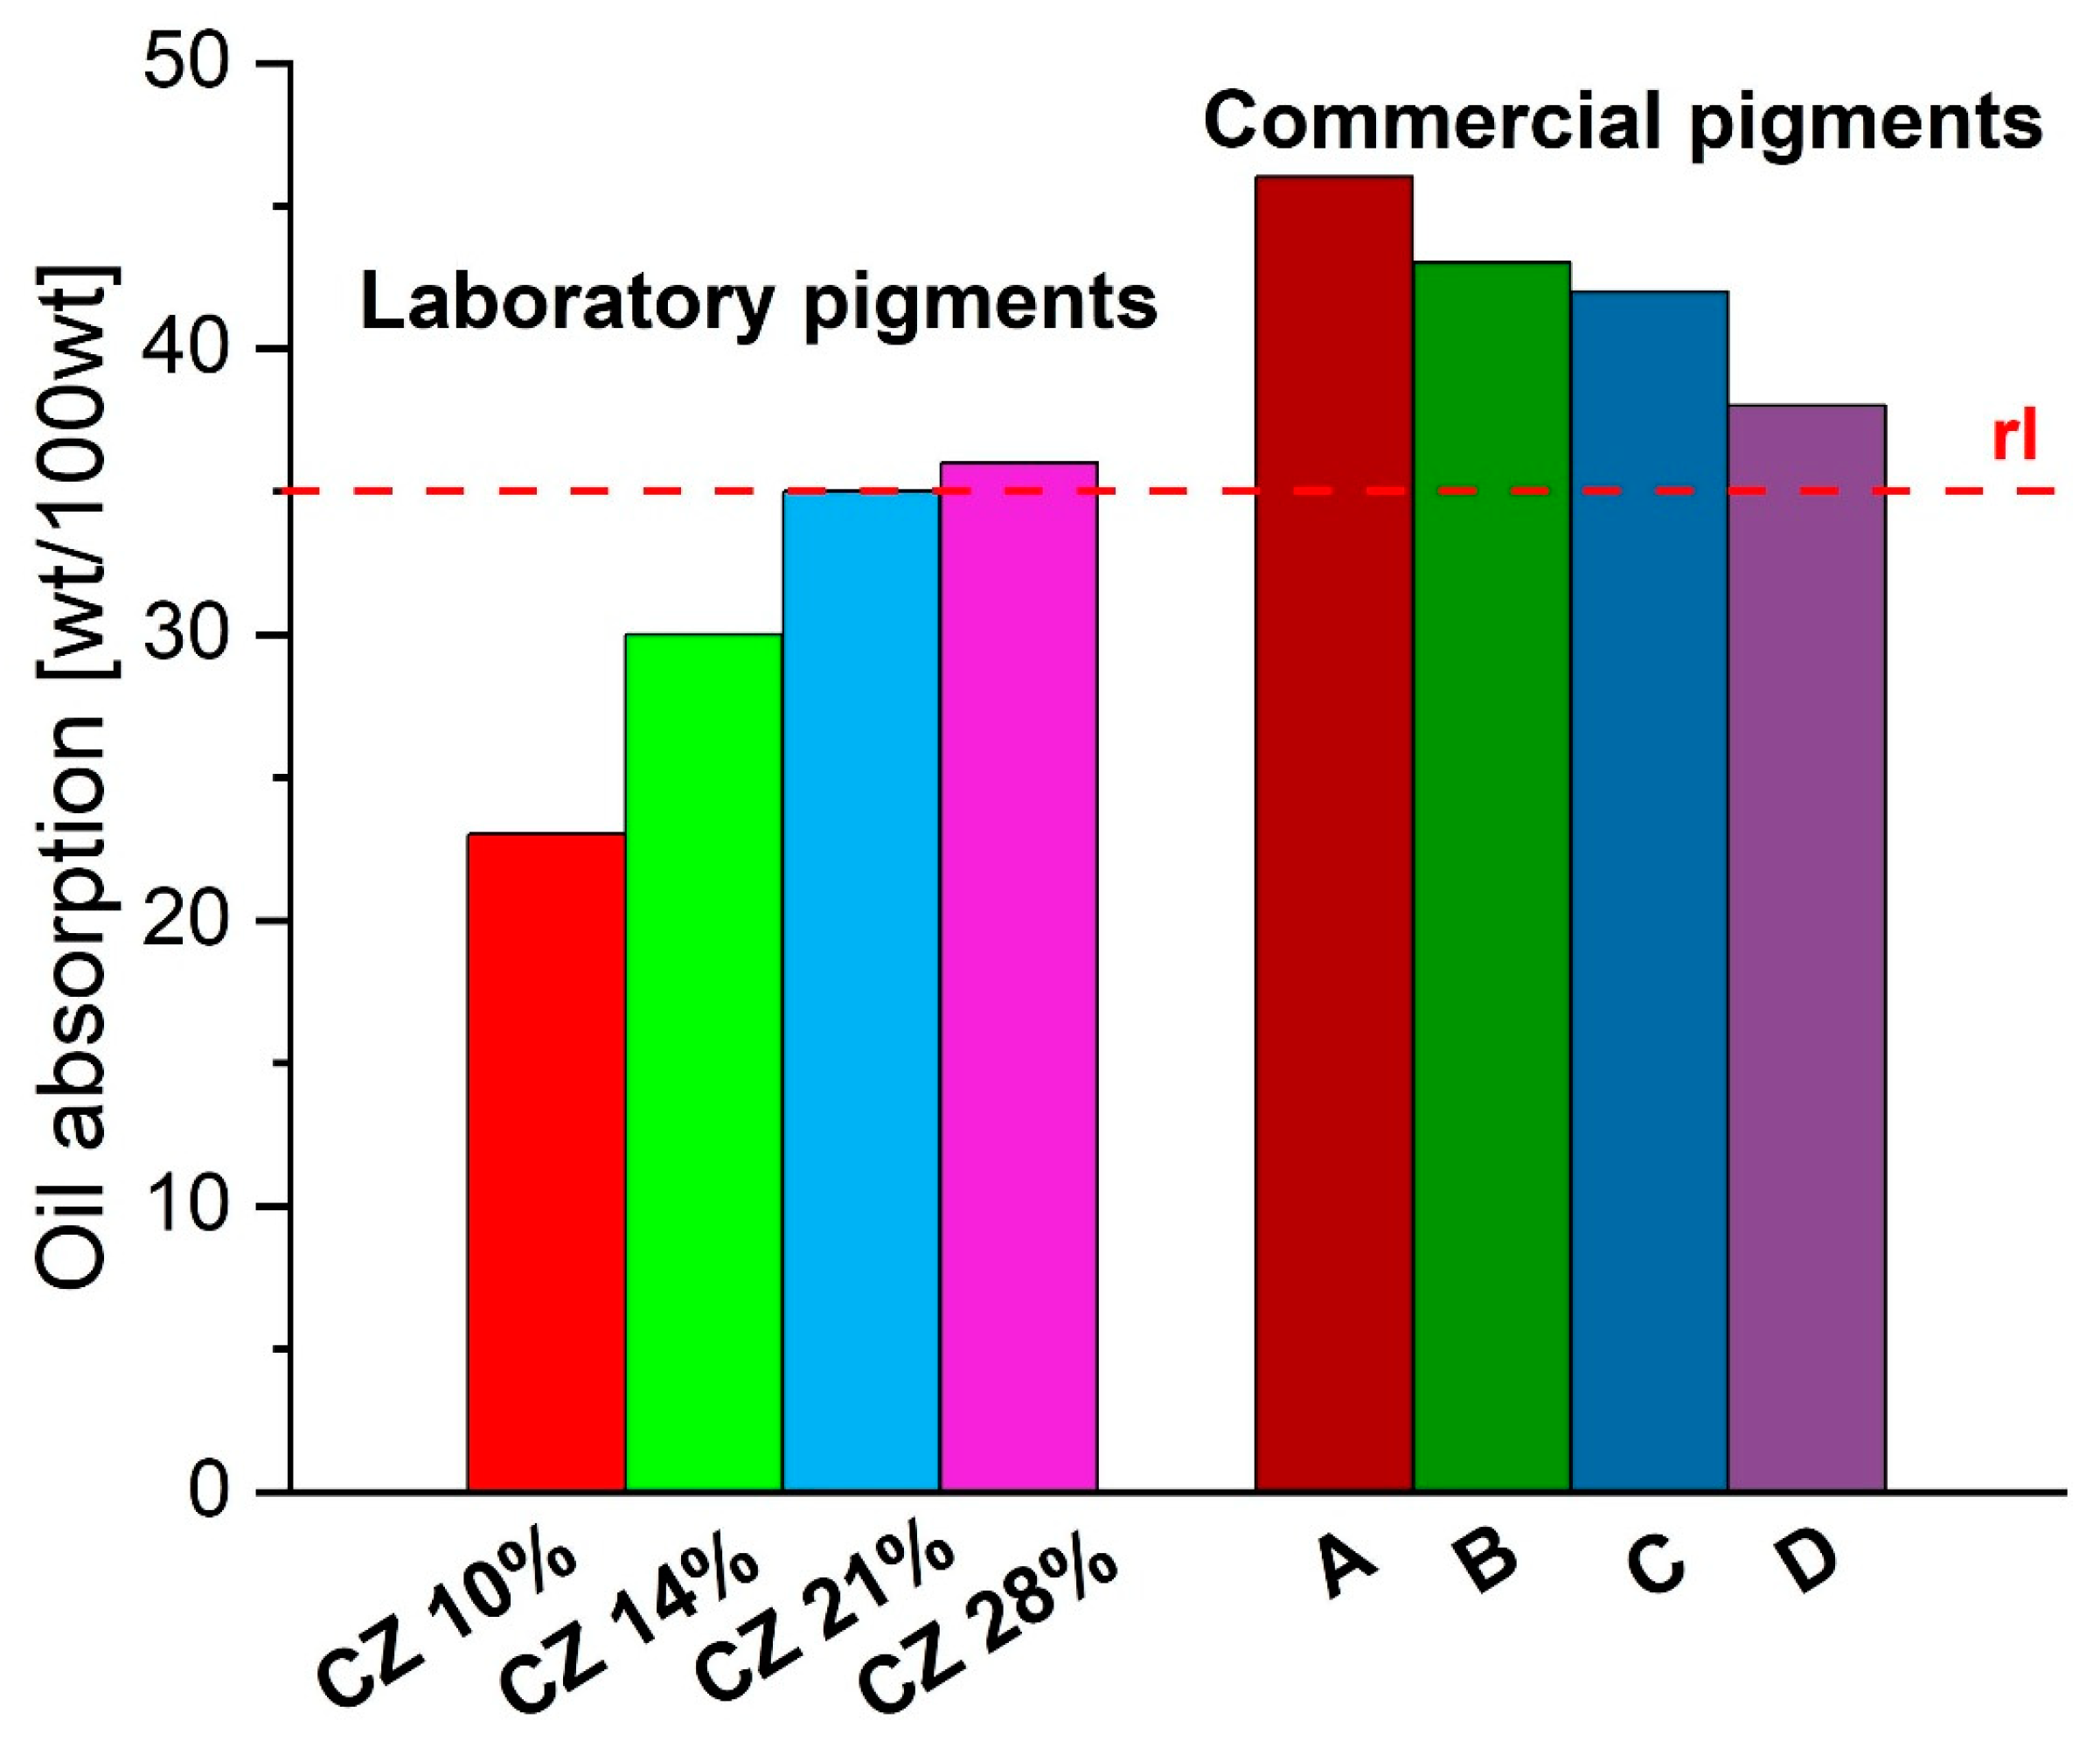
3.1.7. Oil Absorption
4. Conclusions
Author Contributions
Funding
Institutional Review Board Statement
Informed Consent Statement
Data Availability Statement
Conflicts of Interest
References
- Krześlak, A.; Hoffmann, J.; Zieliński, S. Wytyczne dla Branży Chemicznej w Polsce; Najlepsze Dostępne Techniki (BAT): Warsaw, Poland, 2005. [Google Scholar]
- Krockert, B.; Printzen, H.; Ganter, K.-W.; Buxbaum, G. Process for the Production of Iron Oxide Yellow Pigments. US5032180A, 25 May 1989. [Google Scholar]
- Okonkwo, C.; Evans, U.F.; Ekung, S. Unearthing direct and indirect material waste-related factors underpinning cost overruns in construction projects. Int. J. Constr. Manag. 2022. [Google Scholar] [CrossRef]
- Mufti, N.; Atma, T.; Fuad, A.; Sutadji, E. Synthesis and characterization of black, red and yellow nanoparticles pigments from the iron sand. AIP Conf. Proc. 2014, 1617, 4897129. [Google Scholar]
- Lu, Y.; Xu, J.; Wang, W.; Wang, T.; Zong, L.; Wang, A. Synthesis of iron red hybrid pigments from oil shale semi-coke waste. Adv. Powder Technol. 2020, 31, 2179–2586. [Google Scholar] [CrossRef]
- Varvara, D.A.; Aciu, C.; Pica, E.M.; Sava, C. Research on the Chemical Characterization of the Oily Mill Scale for Natural Resources Conservation. Procedia Eng. 2017, 181, 439–443. [Google Scholar] [CrossRef]
- Shoppert, A.; Valeev, D.; Diallo, M.M.; Loginova, I.; Beavogui, M.C.; Rakhmonov, A.; Ovchenkov, Y.; Pankratov, D. High-Iron Bauxite Residue (Red Mud) Valorization Using Hydrochemical Conversion of Goethite to Magnetite. Materials 2022, 15, 8423. [Google Scholar] [CrossRef]
- Swain, B.; Akcil, A.; Lee, J.C. Red mud valorization an industrial waste circular economy challenge; review over processes and their chemistry. Crit. Rev. Environ. Sci. Technol. 2022, 52, 520–570. [Google Scholar] [CrossRef]
- Wei, H.; Zhongyuan, Z.; Junkui, L.; Qingxiang, F. Method for Producing Pigment-Level Iron Oxide Red by Using Titanium Dioxide Waste Residue Ferrous Sulfate. CN102583575A, 20 March 2012. [Google Scholar]
- Zuosheng, Y.; Wenbin, Y.; Jian, P.; Yu, Q.; Zili, L.; Juan, D.; Yinchu, C.; Guohua, Z. Method for Preparing Iron Oxide Black Pigment by Utilizing Titanium Dioxide Waste Acid Ferrous Sulphate. CN102020319A, 7 January 2011. [Google Scholar]
- Khanam, J.; Hasan, R.; Biswas, B.; Jahan, S.; Sharmin, N.; Ahmed, S.; Al-Reza, S. Development of ceramic grade red iron oxide pigment from waste iron source. Heliyon 2023, 9, e12854. [Google Scholar] [CrossRef]
- Pfaff, G. Transparent pigments. Phys. Sci. Rev. 2021, 6, 549–555. [Google Scholar] [CrossRef]
- Esfahani, M.; Eshaghi, A.; Bakhshi, S.J. Transparent hydrophobic, self-cleaning, anti-icing and anti-dust nano-structured silica based thin film on cover glass solar cell. Non-Cryst. Solids 2022, 583. [Google Scholar] [CrossRef]
- Sayyed, M.I.; Abdo, M.A.; Elhosiny Ali, H.; Sadeq, M.S. Impact of Y2O3 on the structural, optical, radiation shielding, and ligand field parameters of transparent borate glass containing constant CrO3 and high Na2O contents. Ceram. Int. 2022, 48, 17. [Google Scholar] [CrossRef]
- Cai, L.; Peng, Y.; Xu, J.; Zhou, C.; Zhou, C.; Wu, P.; Lin, D.; Fan, S.; Cui, Y. Temperature Regulation in Colored Infrared-Transparent Polyethylene Textiles. Joule 2019, 3, 1478–1486. [Google Scholar] [CrossRef]
- Pitzer, U. Highly Transparent Red Iron Oxide Pigments, Process for the Production Thereof and Use Thereof. USOO5614012A, 20 September 1995. [Google Scholar]
- Lu, J.; Ng, M.; Yang, S. US2008O181843A1, 2008.
- Kalinowski, Z.; Folek, S.; Jędrzejowska, I. Urządzenie Zasilające Przędzarki Bezwrzecionowej. PL160665, 8 September 1993. [Google Scholar]
- Wang, G.X.; Bewlay, S.; Needham, S.A.; Liu, H.K.; Liu, R.S.; Drozd, V.A.; Lee, J.-F.; Chen, J.M. The Electrochemical Society, find out more Synthesis and Characterization of LiFePO4 and LiuTi0.01Fe0.99PO4 Cathode Materials. J. Electrochem. Soc. 2006, 153, A25. [Google Scholar] [CrossRef]
- Nakamura, T.; Sakumoto, K.; Okamoto, M.; Seki, S.; Kobayashi, Y.; Takeuchi, T.; Tabuchi, M.; Yamada, Y.J. Electrochemical study on Mn2+-substitution in LiFePO4 olivine compound. Power Sources 2007, 174, 435. [Google Scholar] [CrossRef]
- Tajimi, S.; Ikeda, Y.; Uematsu, K.; Toda, K.; Sato, M. Enhanced electrochemical performance of LiFePO4 prepared by hydrothermal reaction. Solid State Ion. 2004, 175, 287–290. [Google Scholar] [CrossRef]
- Cassol, G.S.; Shang, C.; Li, J.; Ling, L.; Yang, X.; Yin, R.J. Dosing low-level ferrous iron in coagulation enhances the removal of micropollutants, chlorite and chlorate during advanced water treatment. Environ. Sci. 2022, 117, 119–128. [Google Scholar] [CrossRef]
- Hussain, T.; Wahab, A.J. A critical review of the current water conservation practices in textile wet processing. Clean Prod. 2018, 198, 806–819. [Google Scholar] [CrossRef]
- Luo, X.; Liang, C.; Hu, Y. Comparison of Different Enhanced Coagulation Methods for Azo Dye Removal from Wastewater. Sustainability 2019, 11, 4760. [Google Scholar] [CrossRef]
- Sharma, D.K.; Sharma, R. Effect of FeSO4.7H2O and SnCl2.2H2O added as chromium (VI) reducers in ordinary Portland cement. Orient. J. Chem. 2019, 31, 519–526. [Google Scholar] [CrossRef]
- Wang, Y.; Wang, Z.; Jiang, L.; Sun, Y.; Tan, B.; Niu, J.J. Effect of ferrous sulfate replacing gypsum on properties and reducing Cr(VI) of cement paste. Build. Eng. 2023, 69, 106295. [Google Scholar] [CrossRef]
- Splinter, K. Preparation of Iron Pigments Based on Waste Iron(II) Sulfate. Bachelor‘s Thesis, West Pomeranian University of Technology in Szczecin, Szczecin, Poland, 2021. [Google Scholar]
- Splinter, K. Synthesis and Characterization of Iron Oxides with Pigmentation Properties. Master‘s Thesis, West Pomeranian University of Technology in Szczecin, Szczecin, Poland, 2022. [Google Scholar]
- UN General Assembly. Transforming Our World: The 2030 Agenda for Sustainable Development, A/RES/70/1. 21 October 2015. Available online: https://www.refworld.org/docid/57b6e3e44.html (accessed on 29 March 2023).
- Splinter, K.; Lendzion-Bieluń, Z.; Wojciechowska, A. Method of Producing Iron Pigments. PL437851A1, 14 May 2021. [Google Scholar]
- Manganometric Titration Procedure. Faculty of Chemistry, University of Wrocław, Analytical Chemistry Dept., Manganometry. p. 1. Available online: http://zd2.chem.uni.wroc.pl/files/chemistry/12A_ENG.pdf (accessed on 30 March 2023).
- Konratowska, A. Otrzymywanie, Właściwości I Zastosowanie Wybranych Tlenków I Hydroksytlenków Żelaza. Ph.D. Thesis, West Pomeranian University of Technology in Szczecin, Szczecin, Poland, 2010. [Google Scholar]
- Qianzhi, C.; Weiguo, L.; Xiaoqing, S.; Ziqiang, S.; Zhenwen, T. Titanium Removal Method for Titanium White Byproduct Ferrous Sulfate. CN101767837A, 20 January 2010. [Google Scholar]
- Sayuri, T.; Kenzo, H. Purification of Iron Sulfate. JP3690690B2, 31 August 2005. [Google Scholar]
- Wolska, E.; Schwertmann, U.Z. Nonstoichiometric structures during dehydroxylation of goethite. Für Krist.-Cryst. Mater. 1989, 189, 1. [Google Scholar]
- Anju Agarwal, A.; Aghamkar, P.; Lal, B.J. Structural and multiferroic properties of barium substituted bismuth ferrite nanocrystallites prepared by sol–gel method. Magn. Magn. Mater. 2017, 426, 800–805. [Google Scholar] [CrossRef]
- Chandel, S.; Thakur, P.; Tomar, M.; Gupta, V.; Thakur, A. Investigation of structural, optical, dielectric and magnetic studies of Mn substituted BiFeO3 multiferroics. Ceram. Int. 2017, 43, 13750–13758. [Google Scholar] [CrossRef]
- Hwang, S.W.; Umar, A.; Dar, G.N.; Kim, S.H.; Badran, R.I. Synthesis and Characterization of Iron Oxide Nanoparticles for Phenyl Hydrazine Sensor Applications. Sens. Lett. 2014, 12, 97–101. [Google Scholar] [CrossRef]
- Haaland, D.M.; Easterling, R.G. Application of New Least-squares Methods for the Quantitative Infrared Analysis of Multicomponent Samples. Appl. Spectrosc. 1982, 36, 665–673. [Google Scholar] [CrossRef]
- Rege, S.U.; Yang, R.T. A novel FTIR method for studying mixed gas adsorption at low concentrations: H2O and CO2 on NaX zeolite and γ-alumina. Chem. Eng. Sci. 2001, 56, 3781–3796. [Google Scholar] [CrossRef]
- Solomon, P.R.; Carangelo, R.M. FT-i.r. analysis of coal: 2. Aliphatic and aromatic hydrogen concentration. Fuel 1988, 67, 949–959. [Google Scholar] [CrossRef]
- Painter, P.; Starsinic, M.; Coleman, M. Fourier Transform Infrared Spectroscopy; Academic Press: Cambridge, CA, USA, 1985; pp. 169–241. [Google Scholar]
- Estep, P.A.; Kovach, J.J.; Karr, C. Quantitative infrared multicomponent determination of minerals occurring in coal. Anal. Chem. 1968, 40, 358–363. [Google Scholar] [CrossRef]
- Grosvenor, A.P.; Kobe, B.A.; Biesinger, M.C.; McIntyre, N.S. Investigation of multiplet splitting of Fe 2p XPS spectra and bonding in iron compounds. Surf Interface Anal. 2004, 36, 1564–1574. [Google Scholar] [CrossRef]
- IUPAC Recommendation. Pure and Applied Chemistry. 1985, Volume 57, p. 603. Available online: https://publications.iupac.org/pac/57/4/0603/index.html (accessed on 20 March 2023).
- IUPAC Recommendation. Pure and Applied Chemistry. 1994, Volume 66, p. 1739. Available online: https://publications.iupac.org/pac/66/8/index.html (accessed on 20 March 2023).
- Kamel, A.H.; Abdallah, A.M.; El-Baradie, H.Y. The effect of temperature on the properties of calcined red iron oxide pigments. J. Appl. Chem. Biotech. 2007, 22, 1209–1215. [Google Scholar] [CrossRef]
- Arbain, R.; Othman, M.; Palaniandy, S. Preparation of iron oxide nanoparticles by mechanical milling. Miner. Eng. 2011, 24, 1–9. [Google Scholar] [CrossRef]
- Józwiak, W.; Kaczmarek, E.; Maniecki, T.; Ignaczak, W.; Maniukiewicz, W. Reduction behavior of iron oxides in hydrogen and carbon monoxide atmospheres. Appl. Catal. 2007, 326, 17–27. [Google Scholar] [CrossRef]
- European Commission Recommendation. 2011. 2011/696/UE. Available online: https://eur-lex.europa.eu/legal-content/EN/TXT/?uri=CELEX%3A32011H0696 (accessed on 20 March 2023).
- Wani, Y.; Kovakas, P.; Nikoubashman, A.; Howard, M.J. Diffusion and sedimentation in colloidal suspensions using multiparticle collision dynamics with a discrete particle model. Chem. Phys. 2022, 156, 024901. [Google Scholar] [CrossRef]
- Laurent, S.; Forge, D.; Port, M.; Roch, A.; Robic, C.; Vander Elst, L.; Muller, R. Magnetic iron oxide nanoparticles: Synthesis, stabilization, vectorization, physicochemical characterizations, and biological applications. Chem. Rev. 2008, 108, 2064–2110. [Google Scholar] [CrossRef] [PubMed]
- Babes, L.; Denizot, B.; Tanguy, G.; Le Jeune, J.J.; Jallet, P.J. Synthesis of Iron Oxide Nanoparticles Used as MRI Contrast Agents: A Parametric Study. Colloid Interface Sci. 1999, 212, 474. [Google Scholar] [CrossRef] [PubMed]


| Fe2+ | ∑Fe | Mg | Ti | Ca | K | Mn | Zn | Ni | Cr | |
|---|---|---|---|---|---|---|---|---|---|---|
| (wt%) | (ppm) | |||||||||
| Waste FeSO4 | 9.2 (a) | 17.9 (a) | 5.97 | 11,544 | 1322 | 718 | 513 | 404 | 392 | <dl (b) |
| Purified FeSO4 | 14.2 (a) | 16.2 (a) | 0.68 | 20 | 347 | 64 | 189 | 205 | 38 | <dl (b) |
Disclaimer/Publisher’s Note: The statements, opinions and data contained in all publications are solely those of the individual author(s) and contributor(s) and not of MDPI and/or the editor(s). MDPI and/or the editor(s) disclaim responsibility for any injury to people or property resulting from any ideas, methods, instructions or products referred to in the content. |
© 2023 by the authors. Licensee MDPI, Basel, Switzerland. This article is an open access article distributed under the terms and conditions of the Creative Commons Attribution (CC BY) license (https://creativecommons.org/licenses/by/4.0/).
Share and Cite
Splinter, K.; Moszyński, D.; Lendzion-Bieluń, Z. Microwave-Reactor-Based Preparation of Red Iron Oxide Pigment from Waste Iron Sulfate. Materials 2023, 16, 3242. https://doi.org/10.3390/ma16083242
Splinter K, Moszyński D, Lendzion-Bieluń Z. Microwave-Reactor-Based Preparation of Red Iron Oxide Pigment from Waste Iron Sulfate. Materials. 2023; 16(8):3242. https://doi.org/10.3390/ma16083242
Chicago/Turabian StyleSplinter, Kamila, Dariusz Moszyński, and Zofia Lendzion-Bieluń. 2023. "Microwave-Reactor-Based Preparation of Red Iron Oxide Pigment from Waste Iron Sulfate" Materials 16, no. 8: 3242. https://doi.org/10.3390/ma16083242
APA StyleSplinter, K., Moszyński, D., & Lendzion-Bieluń, Z. (2023). Microwave-Reactor-Based Preparation of Red Iron Oxide Pigment from Waste Iron Sulfate. Materials, 16(8), 3242. https://doi.org/10.3390/ma16083242