3.1. Purification of QI Particles in Heavy Coal Tar by Catalytic Polycondensation
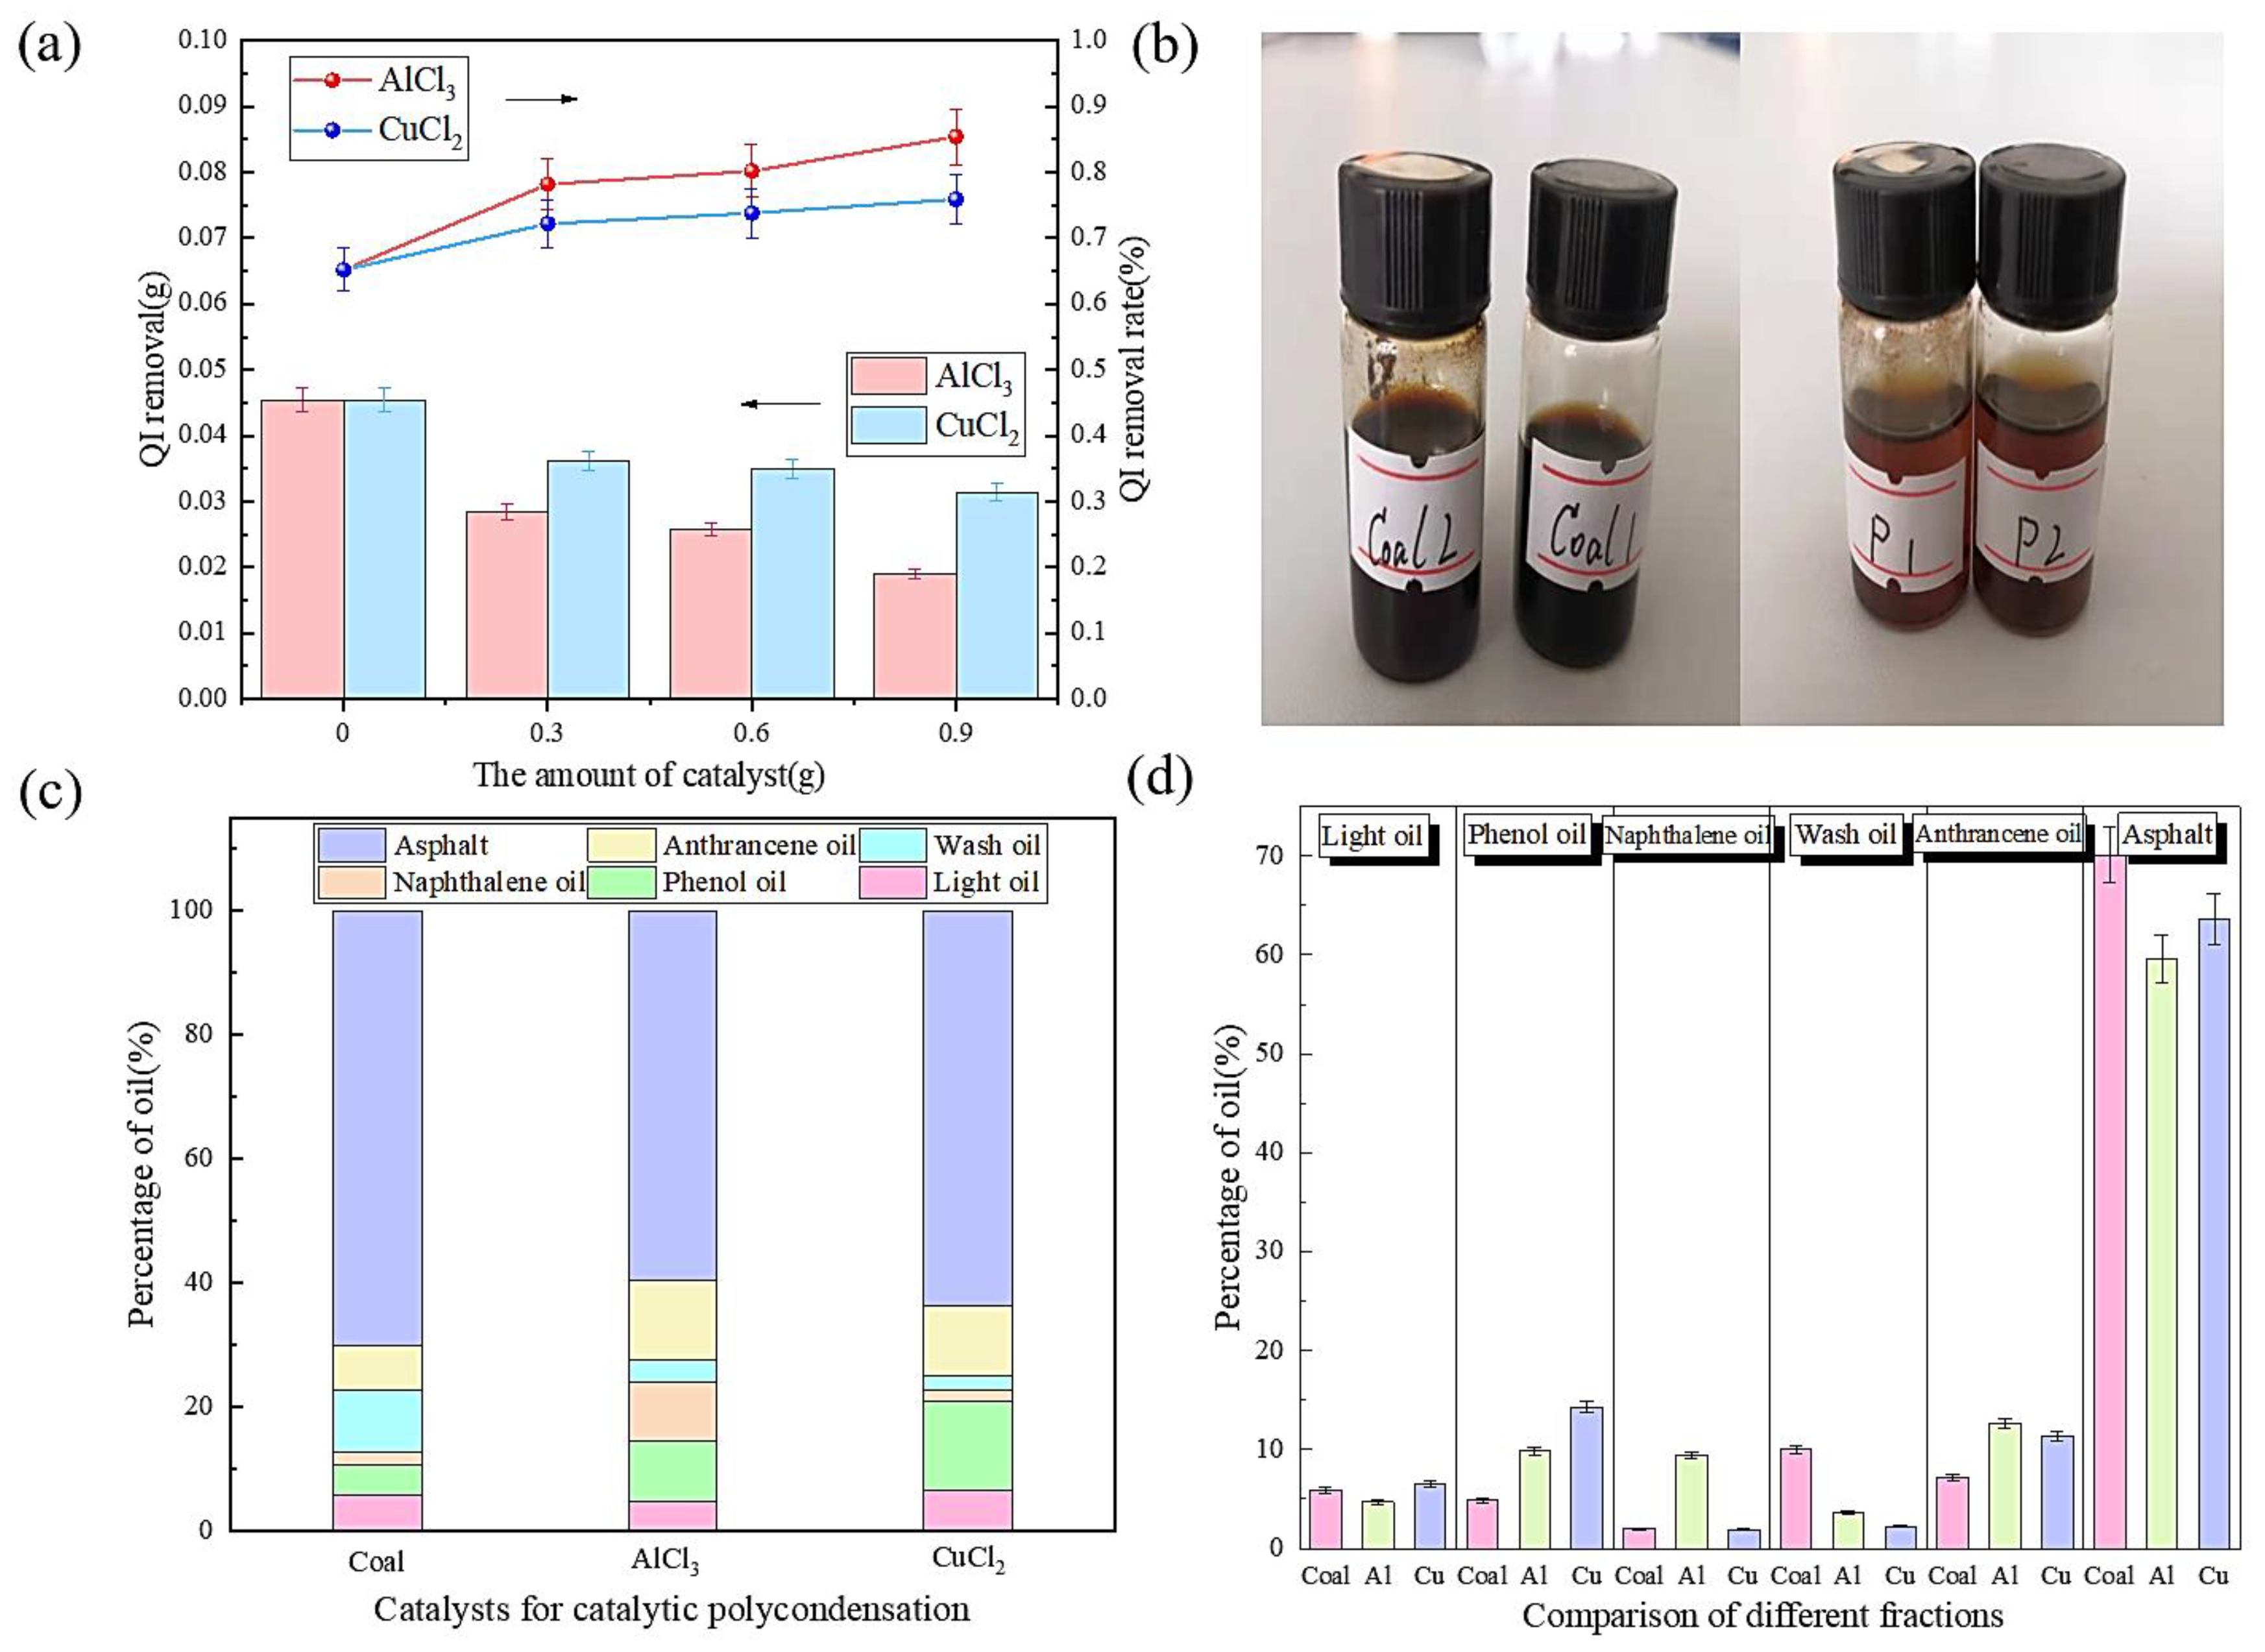
Under conditions of 200 °C and 6 h, different amounts of catalysts were selected to catalyze the polycondensation of heavy coal tar. The relationship between the QI content of purified heavy coal tar and the amount of catalyst was explored, and the best catalyst was selected as the basis for subsequent research. In addition to inorganic substances in QI matter, there were also a large number of fused-ring aromatic structures. After adding the Lewis acid catalysts AlCl
3 and CuCl
2, a catalytic polycondensation reaction occurred. In the reaction process, part of the aliphatic side chain was removed, more alkyl groups and cycloalkyl groups were obtained, and a highly condensed, fused-ring macromolecular compound was formed. This catalytic polycondensation process is illustrated in
Figure 1. It can be seen from
Figure 2a that the QI content decreased after adding AlCl
3 and CuCl
2, and the use of an AlCl
3 catalyst had a better QI removal effect. The comparison of heavy coal tar before and after purification is shown in
Figure 2b. From its appearance, the color of unpurified raw, heavy coal tar was deep, while the color of the heavy coal tar after purification was lighter. The content of light fractions in purified heavy coal tar increased overall, as shown in
Figure 2c. After purification with AlCl
3, the content of phenol oil, naphthalene oil, and anthracene oil increased, while the content of light oil, washing oil, and pitch decreased. And after purification with CuCl
2, the content of light oil, phenol oil, and anthracene oil increased, and the content of naphthalene oil, washing oil, and pitch decreased. This shows that in the purification of heavy coal tar, the Lewis acid catalysts AlCl
3 and CuCl
2 can reduce the activation energy of aromatic molecules and change the aromaticity of heavy coal tar [
39,
40]. Especially under the catalysis of AlCl
3, the content of the pitch component in the heavy coal tar system decreased, as shown in
Figure 2d.
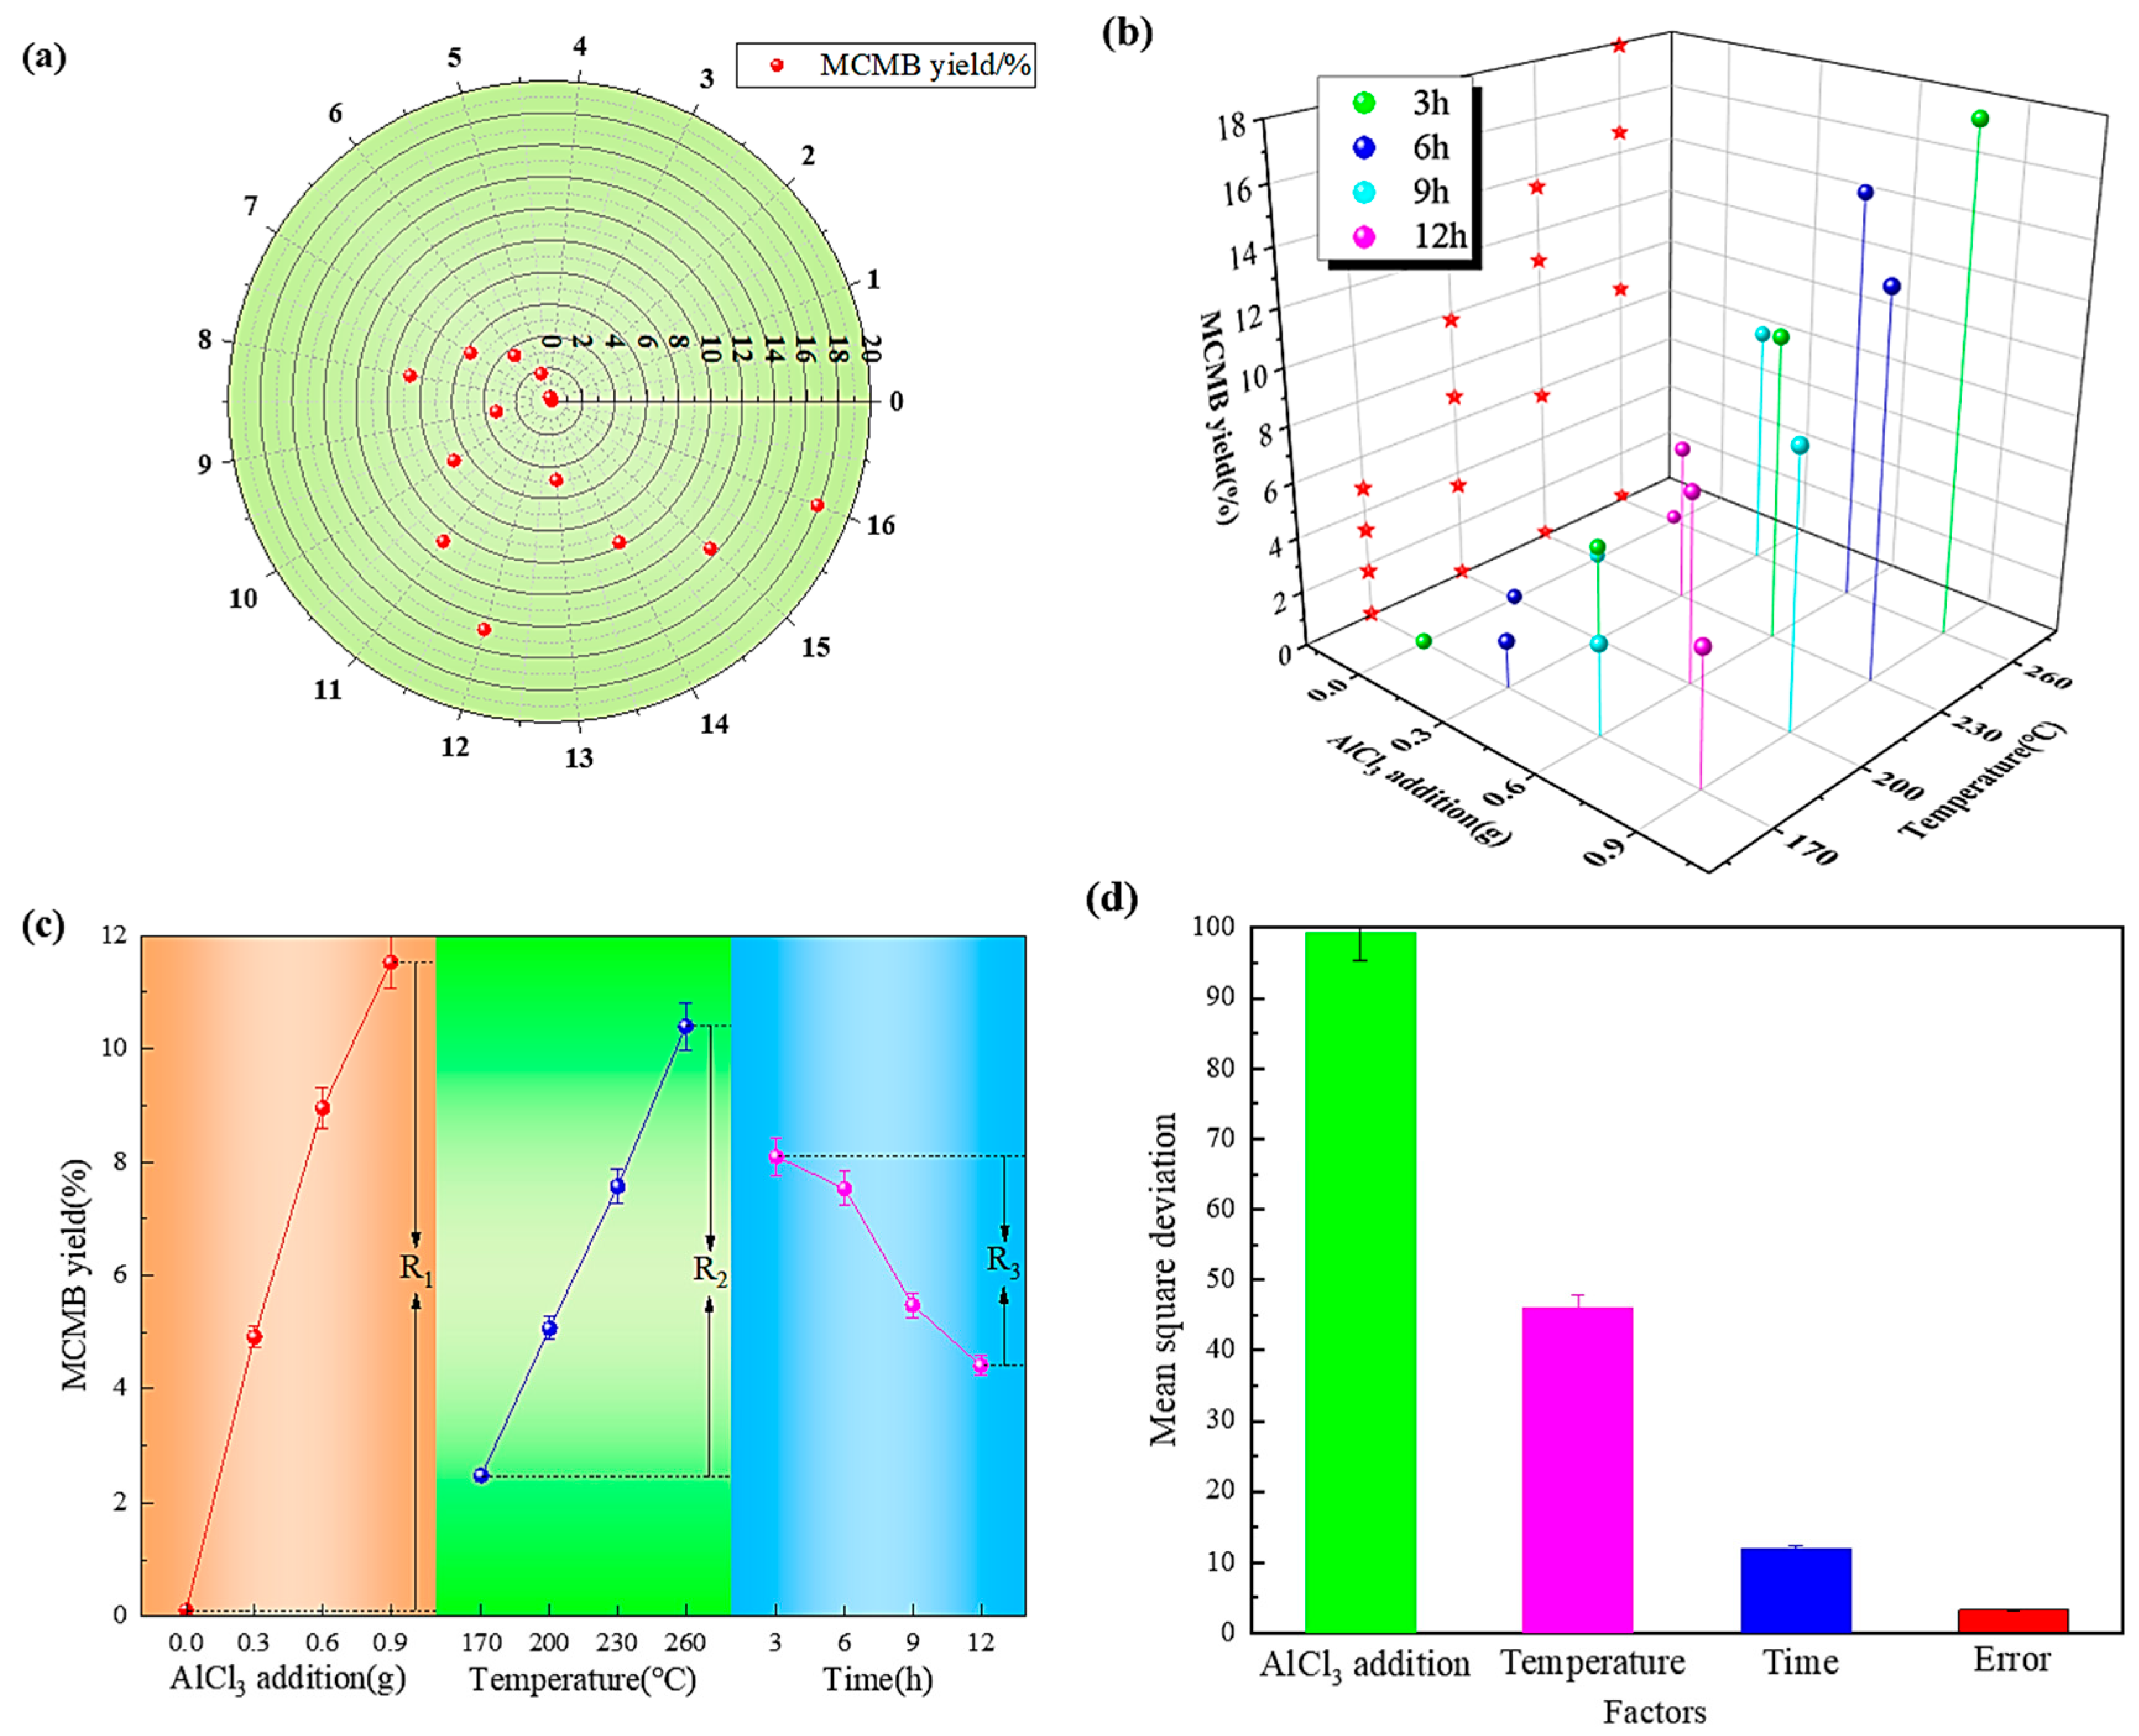
According to the influence of polycondensation temperature, polycondensation time, and AlCl
3 addition on the change in QI content, this paper established an orthogonal experiment table of 3 factors and 4 levels. The experiment was carried out according to the conditions in
Table 3, and the measured QI content was used as the experimental result.
The range analysis of QI content in
Table 3 was obtained through calculation. K
j is the sum of each factor at the same level, and k
j is the mean value at the same level; that is, k
j = K
j/4. Through the range analysis, the range (R) value was obtained by Equation (1). The value of R represents the importance of the factors, so the importance of the three factors in descending order is time, AlCl
3 addition, and temperature. According to the experimental results of the QI content, the result of experiment number 14 was the best. And the corresponding factor was the best experimental condition factor; that is, when the AlCl
3 addition was 0.9 g, the temperature was 230 °C, and the time was 9 h. After the catalytic polycondensation of heavy coal tar, the QI content was the lowest.
In addition, the variance analysis of each factor was also analyzed for the QI content. In
Table 4, SS is the sum of squared deviations of various levels under different factors; MS is mean square; Df is degrees of freedom; and the F value is the ratio of MS in different factors to that of the error column. The
p-value is the possibility that it may be greater than the F value. In general, when the
p-value was less than 0.05, it was considered that the factor had a significant impact on the experimental results and it was an important indicator affecting the experimental indicators. According to the calculation results, it is known that the AlCl
3 addition, temperature, and time all had a significant effect on the removal of QI by the catalytic polycondensation of heavy coal tar. And all parameters were calculated using relevant functions in Excel.
The relationship between different experiment numbers and QI content is shown in
Figure 3a. The smaller the QI content, the better the heavy coal tar purification effect, and this shows more as it gets closer to the center of the circle in the figure. As also shown in
Figure 3b, the projection of the minimum QI content of three different factors on the YZ axis can illustrate the combination of the optimal level and the optimal scheme.
Figure 3c illustrates the effect of QI content under different factors, and it illustrates the influence and trend of thermal polycondensation conditions on QI content under different factors. And the difference between the maximum and minimum QI content is precisely the R value in the orthogonal experiment table. The effects of each factor on average-level mean square deviation are shown in
Figure 3d, in which the abscissa is related to the four factors corresponding to AlCl
3 addition: temperature, time, and error, successively.
3.2. Preparation of Mesophase Carbon Microspheres by Catalytic Polycondensation
Under the conditions of 200 °C and 6 h, different amounts of catalysts were selected to catalyze the polycondensation of heavy coal tar to prepare the MCMBs. The different Lewis acids, AlCl
3 and CuCl
2, had a significant effect on the MCMB yields. It can be seen from
Figure 4a that after adding the Lewis acid catalyst, the MCMB yields were significantly improved. When the addition amount of catalyst was 0.9 g, the MCMB yields were the highest, which were 11.06% and 9.98%, respectively.
Samples were taken at different polycondensation times to observe the morphology of the MCMBs. The growth process of the mesosphere spheres at different temperatures is shown in
Figure 4b–e. The added AlCl
3 would act as a primary QI, which had a positive effect on the formation of the MCMBs, and some related articles had been reported. That was the main reason that the added inorganic matter caused heterogeneous nucleation of tar during polycondensation, and the inorganic matter acted as the nucleating agent [
41]. It reduced the surface energy of the heavy coal tar system and adhered to the surface of the spheres to prevent the growth and fusion between spheres [
42], which was also the reason why the surface of the small spheres was not smooth, as shown in
Figure 4c.
Similar to the QI content in the catalytic polycondensation to purify heavy coal tar, it established an orthogonal experiment table of 3 factors and 4 levels (polycondensation temperature, polycondensation time, and AlCl
3 addition) on the MCMB yield. And
Table 5 shows the factors affecting the MCMB yield and its results. The R-value showed that the AlCl
3 addition, temperature, and time all had a significant effect on the formation of MCMBs by the catalytic polycondensation of heavy coal tar.
In
Table 6, the
p value of the catalytic polycondensation time is greater than 0.05, indicating that the effect of time on the preparation of MCMB is not obvious when the heavy coal tar catalytic polycondensation is used to prepare MCBM, and it mainly lies in the catalyst and temperature, which is consistent with previous reports.
The distribution of MCMB yield under different experiment numbers is shown in
Figure 5a. Under the optimal catalytic polycondensation conditions (catalyst 0.9 g, catalytic polycondensation temperature 200 °C, catalytic polycondensation time 9 h), the content of QI was the lowest, which was 0.035%. Under these optimal conditions, the MCMB yield was only 9.76%, and it did not reach the maximum value of 17.91%. As also shown in
Figure 5b, the projection of the maximum MCMB yield of three different factors on the YZ axis can illustrate the combination of the optimal level and the optimal scheme.
Figure 5c illustrates the effect of MCMB yield under different factors, and it illustrates the influence and trend of thermal polycondensation conditions on MCMB yield under different factors. The difference between the maximum and minimum MCMB yield is precisely the R value in the orthogonal experiment table. The effects of each factor on average-level mean square deviation are shown in
Figure 5d, in which the abscissa is related to the four factors corresponding to AlCl
3 addition, temperature, time, and error, successively.


