Article

Enhancing the Performance of Hemihydrate Phosphogypsum by the Collaborative Effects of Calcium Hydroxide and Carbonation

1
School of Civil Engineering, Railway Campus, Central South University, No. 68, South Shaoshan Road, Tianxin District, Changsha 410018, China
2
Geology Institute of China Chemical Geology and Mine Bureau, Block B, No. 19, Xiaoying Road, Chaoyang District, Beijing 100101, China
*
Authors to whom correspondence should be addressed.
Materials 2024, 17(10), 2204; https://doi.org/10.3390/ma17102204
Submission received: 11 April 2024 / Revised: 1 May 2024 / Accepted: 6 May 2024 / Published: 8 May 2024
(This article belongs to the Special Issue Sustainable Materials from Industrial Waste)

Abstract

:
Normally, the acidic impurities in hemihydrate phosphogypsum (HPG) must be neutralized when HPG is utilized, and a little amount of calcium hydroxide (CH) is the best choice. In this paper, the effects of excessive CH (5 wt.%, 10 wt.%, 15 wt.% and 20 wt.% of HPG) for carbonation curing on the performance of hardened HPG paste were studied. According to the results of macro tests and microanalyses of XRD, TG, SEM-EDS, MIP and N2 physisorption, it could be verified that CaF2, Ca3(PO4)2 and a large amount of nanoscale CaCO3 crystals were produced as a result of neutralization and carbonation, and the compressive strength and the water resistance of carbonated HPG + CH paste were significantly improved due to the effects of nanoscale CaCO3 crystals on pore refinement and the coverage on the surfaces of gypsum crystals of the hardened paste. Therefore, this study suggests a feasible and green method for recycling HPG/PG, with the collaborative effects of neutralization, performance enhancement and reductions in CO2 emissions.

1. Introduction

Phosphogypsum (PG) is an industrial solid waste obtained in the process of phosphoric acid production [1], and its main component is calcium sulfate dihydrate (CaSO4·2H2O), the same as natural gypsum, and PG represents a renewable gypsum resource [2]. However, PG contains amounts of fluorine, phosphorus, organic matter and other impurities [3] that hinder the utilization of PG [4]. According to statistics, the global PG production is around 280 million tons per year [5], while the comprehensive utilization rate is only 15% [6]. The remaining PG is accumulated [7], not only taking up lots of land [8], but also causing serious environmental issues [9]. Therefore, the effective disposal and reuse of PG offer benefits for the environment, economy and society.
When applied to building materials, PG can be used as a cement retarder [10], a component of composite binding material [11] and a gypsum building material [12]. The consumption of PG in cement retarders and composite binding materials is limited. Calcinating PG to produce hemihydrate phosphogypsum (HPG) to prepare gypsum building material is one of the most effective ways to utilize PG, and the main component of HPG is calcium sulfate hemihydrate (CaSO4·0.5H2O), which can be made into gypsum board, gypsum block and other decorative or functional building products [13]. However, the impurities of phosphorus and fluorine in PG affect the crystallization process of gypsum during the hydration of HPG [14], resulting in poor strength and a loose microstructure of hardening pastes [15], and HPG products generally have poor water resistance owing to the high solubility of CaSO4·2H2O and the loss of strength [16].
To reduce the negative effects of impurities, alkaline regulators are generally used, such as calcium hydroxide (Ca(OH)2, (CH)), magnesium hydroxide (Mg(OH)2), ammonium hydroxide(NH3·H2O), sodium hydroxide (NaOH), cement [17], and so on. All alkaline regulators could neutralize acidity, but the effects of Mg(OH)2, NH3·H2O and NaOH on HPG strength are not obvious, and cement could reduce the volume stability of HPG [17]. Adding CH is the best choice to modify HPG, because 0.1–2.0 wt.% CH has been shown to contribute to the immobilization of impurities [18], promote hydration [17], regulate the growth of gypsum crystal [19], optimize performance [20] and elevate the potential for carbon absorption. CH (or industrial solid wastes with CH as the main content, such as calcium carbide slag) carbonation, as an important CO2 sequestration technology, can generate insoluble calcium carbonate (CaCO3) crystals [21].
The carbonation of cement and concrete has been studied extensively. The early-age carbonation of cement can form carbonate binders composed primarily of CaCO3 and amorphous silica/alumina gel on the surface, which improve pore structure, decrease permeability and achieve lower carbon emissions [22]. PG could be carbonated to prepare CaCO3 in the presence of ammonium ions [23], but it struggles to be carbonated under normal circumstances. By adding excessive CH into HPG and combining with carbonation curing, after the neutralization reaction, the remaining CH could be carbonated and form a lot of insoluble CaCO3, which may fill the pores of the hardened HPG paste to further improve its performance, similar to the early carbonation of cement. So, the novelty of this work is in combining the needs of HPG materials regarding impurity solidification, performance improvement and carbon emission reduction.
Therefore, CH, carbonation curing and their collaborative effects on the performance of HPG, including setting and hardening properties, hydration products, microstructure development, carbon footprint and energy consumption, were evaluated in this study. The hydration products of the hardened pastes were measured by X-ray diffraction (XRD) and thermogravimetric analysis (TG). A scanning electron microscope (SEM) was used to observe the microstructure. N2 physisorption and mercury intrusion porosimetry (MIP) were both used to measure the pore structure. These conclusions were suggested to provide guidance for the comprehensive utilization of PG and CH-containing solid wastes.

2. Materials and Experiments

2.1. Raw Materials

The hemihydrate phosphogypsum (HPG) used in this study was donated from Guizhou Phosphating Green Environmental Protection Co., Ltd. (Guiyang, China) and is produced by crushing, flotation, washing, pre-drying by hammer air dryer, calcining by three boiling calciners connected in series, cooling, grinding modification, homogenization, storage and other processes. The physical and mechanical properties of HPG are shown in Table 1. The internal exposure index IRa and the external exposure index Ic evaluated the radioactivity level of HPG. It can be found that the radioactivity is lower than the criteria of the Chinese standard (GB 9776-2022) [24], which means HPG is safe for use as a construction material [25].
The mineral compositions of HPG are shown in Figure 1 according to XRD analysis, and the primary crystalline phases in HPG are hemihydrate gypsum (CaSO4·0.5 H2O) and quartz (SiO2).
The chemical compositions of HPG powder as characterized by XRF analysis are shown in Table 2.
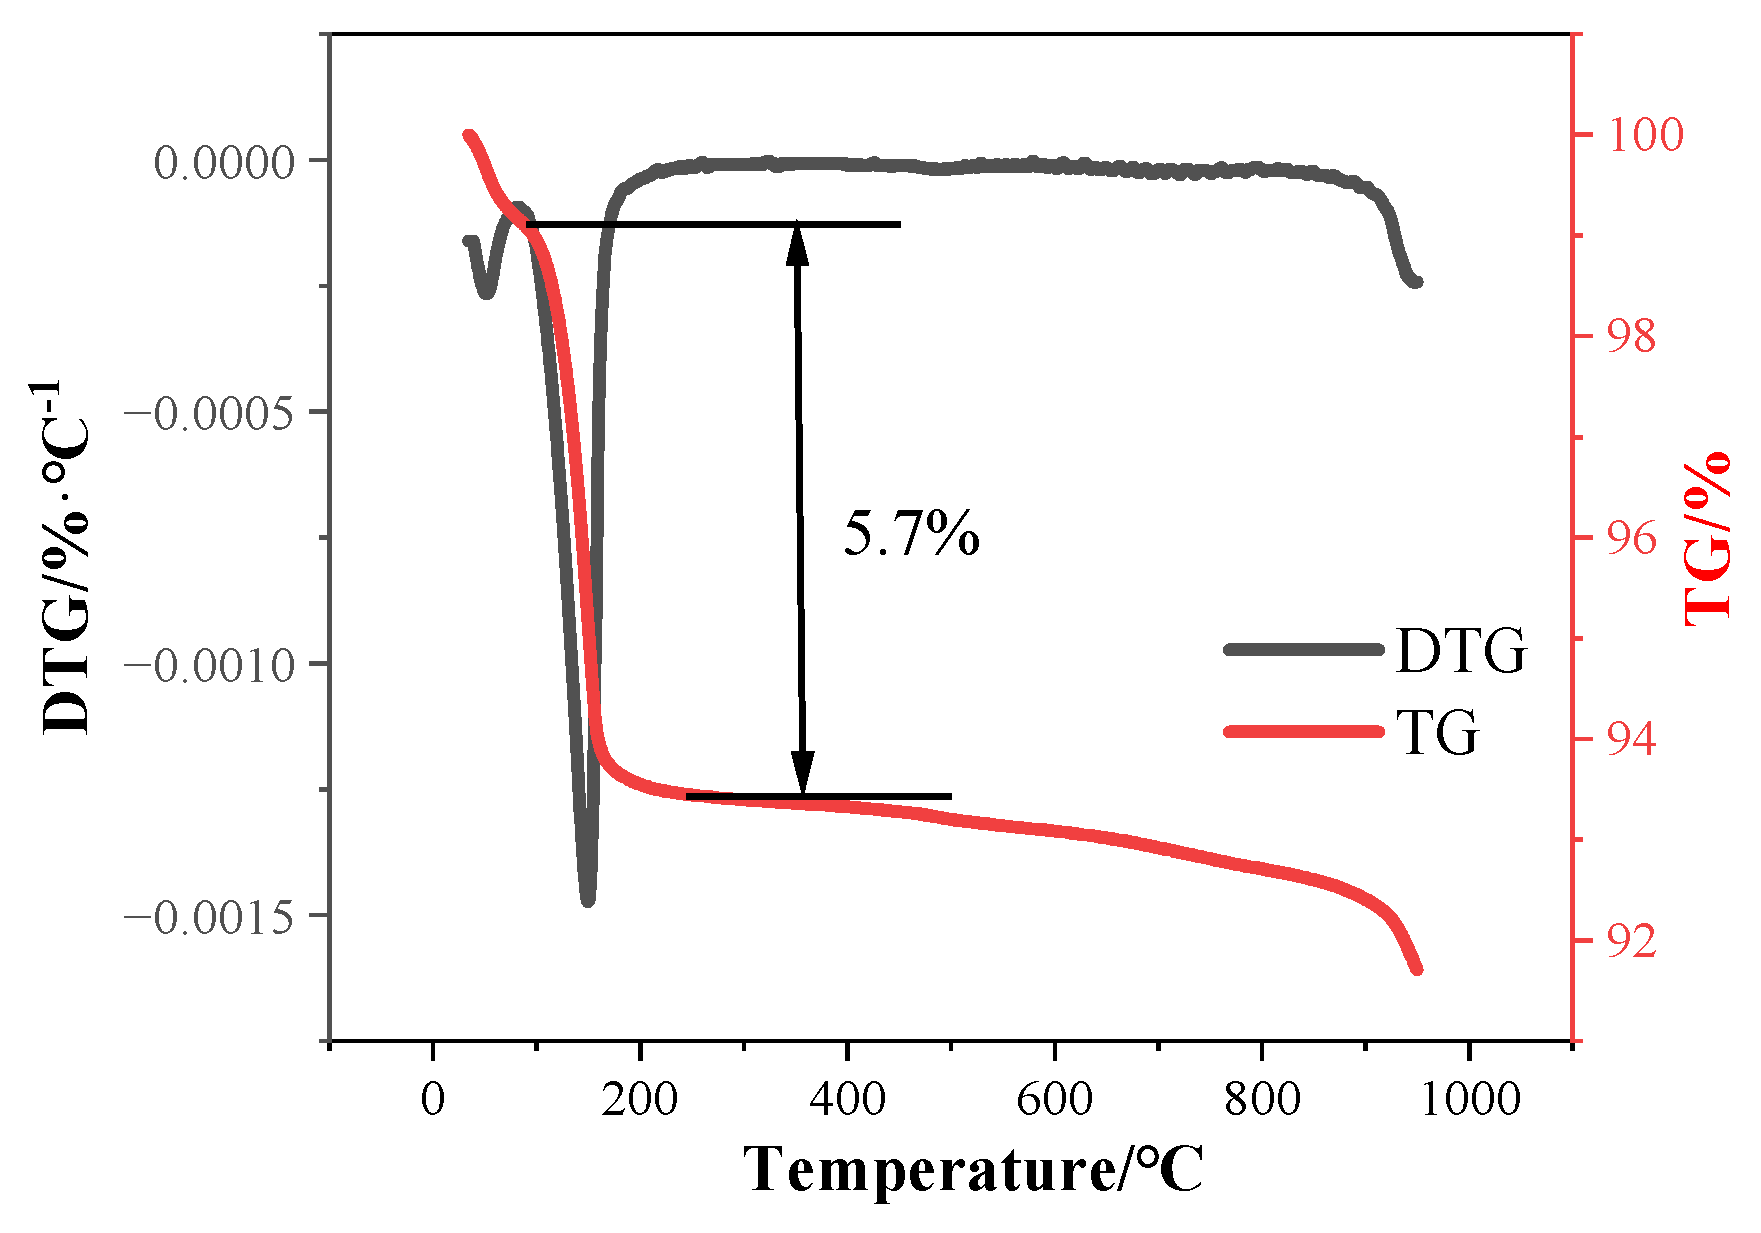
The main chemical compositions are CaO and SO3, which are the specific components of CaSO4·0.5H2O. There are also two specific impurities, F and P. The chemically combined water in HPG is 5.7%, as suggested by the TG-DTG analysis shown in Figure 2, and the content of hemihydrate gypsum (CaSO4·0.5H2O) is 91.8%.
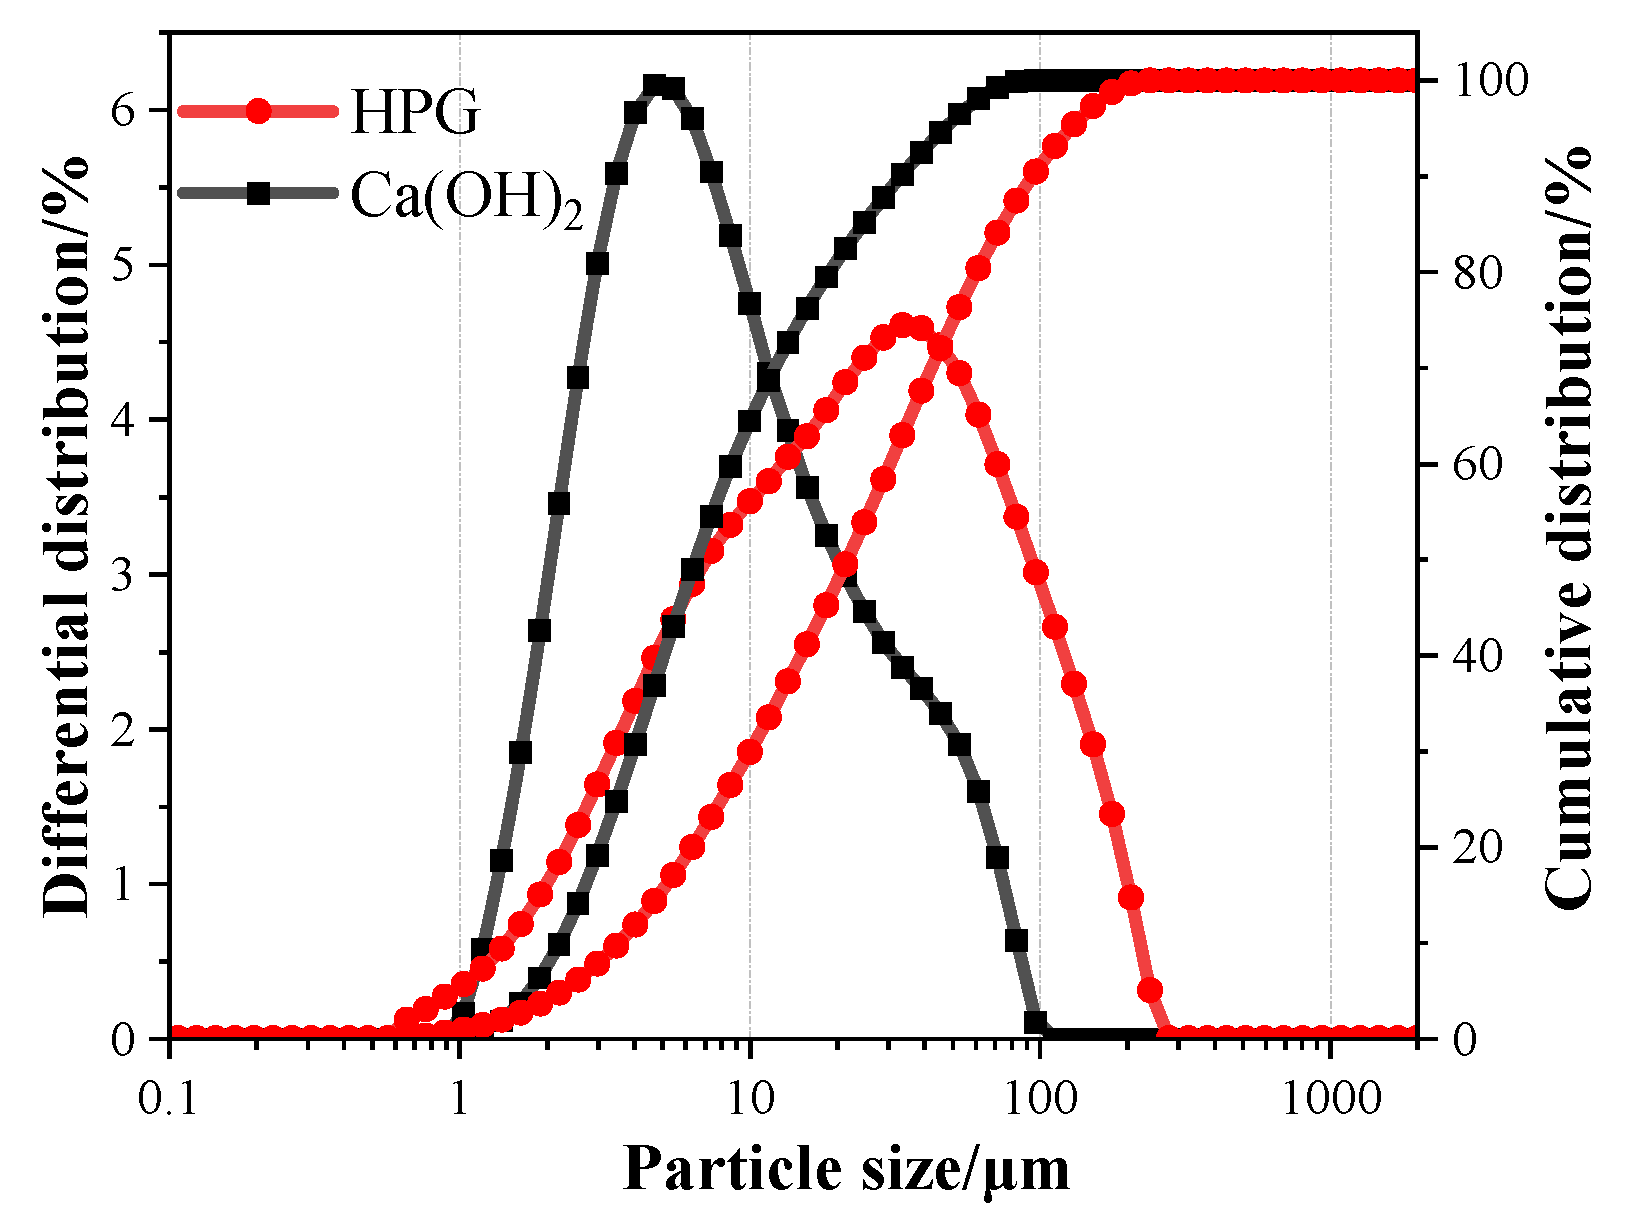
The particle size distributions of HPG and calcium hydroxide (CH) were determined by the laser particle size analyzer shown in Figure 3. The particle size distribution range of HPG is relatively wide, with almost 80% distributed between 1 and 70 μm; there is a median particle size of 21.7 μm and the specific surface area is 214.14 m2/kg.
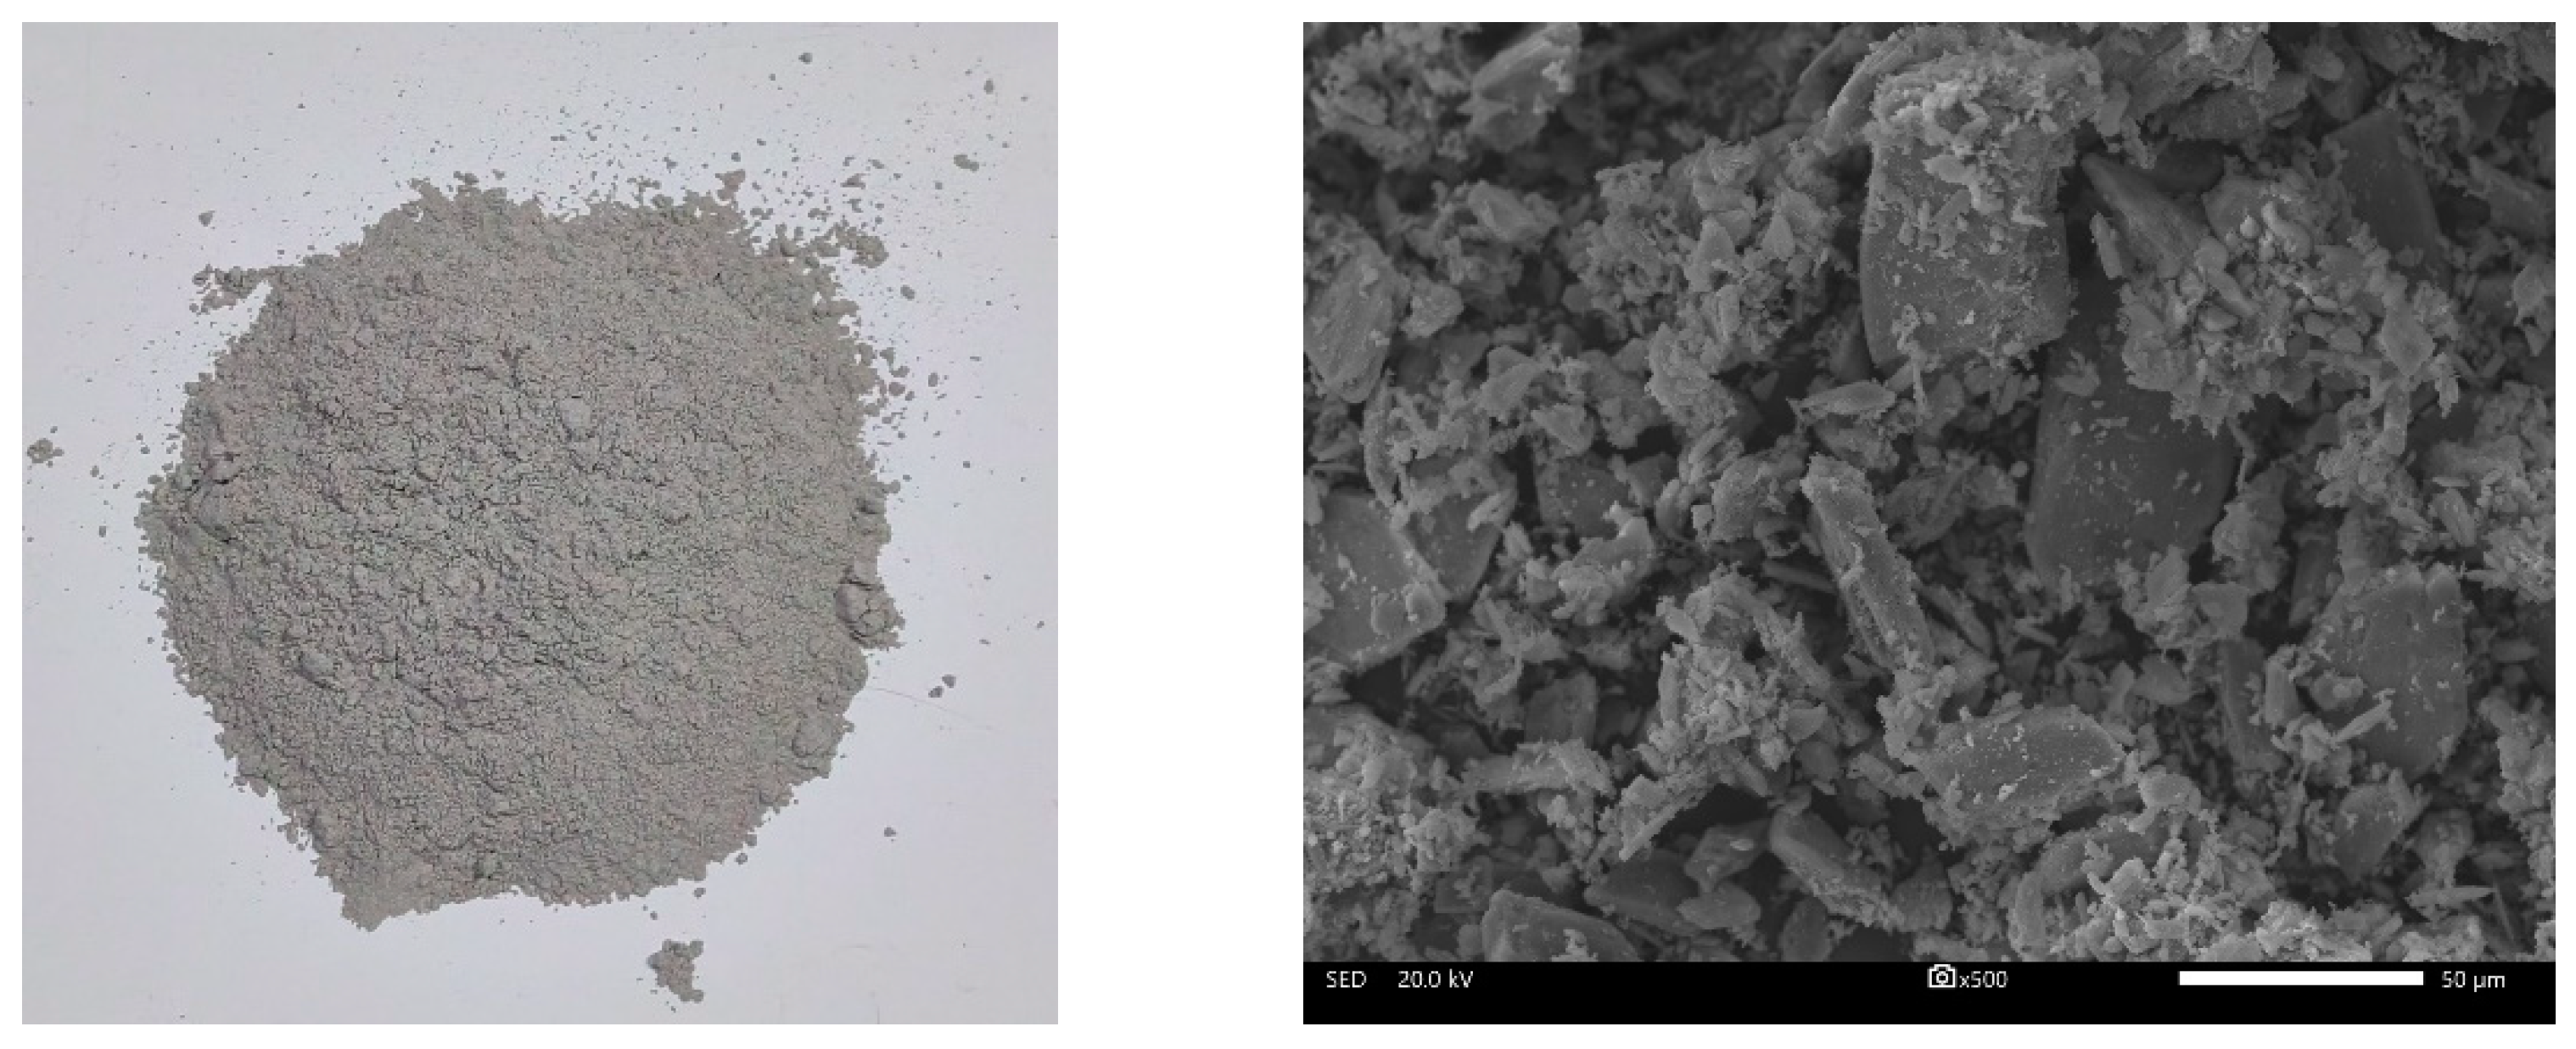
The particle morphology and SEM image of HPG are presented in Figure 4, showing that the powder is grey and HPG is composed of CaSO4·0.5H2O crystals with irregular shapes and uneven boundaries.
For the exact quantitative analysis, analytically pure-grade calcium hydroxide (CH) was used in this work, composed of more than 95% Ca (OH)2 and obtained from Tianjin Zhiyuan Chemical Reagent Co. Ltd. (Tianjin, China) The chemical compositions of CH are illustrated in Table 2. As shown in Figure 3, the particle size of CH is finer than that of HPG, with 6.5 μm median particle size and 1222.84 m2/kg specific surface area. Retarder XK (a modification of amino acid retarder-200p) obtained from Swiss Sika Group was used to improve the working ability of HPG.

2.2. Sample Preparation and Curing

The mix proportions of HPG and CH are presented in Table 3, designated as CH-0, CH-5, CH-10, CH-15, and CH-20, containing 0 wt.%, 5 wt.%, 10 wt.%, 15 wt.%, and 20 wt.% CH as the HPG replacement, respectively.
The water-to-binder ratios of the pastes are all 0.58, which is the water requirement for the normal consistency of HPG. The water was deionized water and was stored at 20 ± 2 °C for 24 h. The addition of 0.01% retarder XK of the mass of HPG was used to increase the setting time and ensure the casting process.
For each mix, 40 mm × 40 mm × 160 mm paste prisms were cast in accordance with GB 17669.3-1999 [26]: XK and Ca(OH)2 were mixed in water for 2 min to obtain a homogeneous suspension liquid. Then, HPG was added to the liquid with 5 min of mixing, and the prepared paste was poured into the molds. Subsequently, the molds were repeatedly vibrated until no air bubbles were produced. The specimens were cured at 20 ± 2 °C, and 70 ± 5% relative humidity for 1 h, and then demolded. Once demolded, one set of paste prisms was exposed to a carbonation environment (20 ± 2% CO2 concentration, 70 ± 5% R.H, 20 ± 2 °C) for 14 days. For comparison, the second set of paste prisms were cured in atmosphere (approximately 0.04% CO2 concentration, 70 ± 5% R.H, 20 ± 2 °C) for 14 days.

2.3. Test Procedures

2.3.1. Water Requirement for the Normal Consistency, Fluidity and Setting Time

Then, 300 g of powder and water were stirred for 30 s. Then, the slurry was poured into a steel cylinder with a 50 mm diameter and 100 mm height, and the cylinder was lifted quickly. Subsequently, the diameters of the slurry in the two vertical directions were measured and the average value was taken as the fluidity. The water requirement for normal consistency was confirmed when the fluidity was equal to 180 ± 5 mm. In this paper, the water requirement for the normal consistency of HPG was 0.58.
The initial setting time and final setting time of the pastes were determined using the Vicat apparatus. The point at which the needle could no longer touch the bottom of the glass plate was taken as the initial setting time of the pastes. When the depth of the needle inserted into pastes was no more than l mm, this was taken as the final setting time of the pastes.
According to Chinese standard GB/T 17669.4-1999 [27], the normal consistency water requirement data used and the setting time data used are the mean values of at least two test results.

2.3.2. Mechanical Properties

The mechanical properties were tested according to GB/T 17669.3-1999 [26] in China. The specimens were dried at 40 ± 2 °C until they reached a constant weight when the mass difference between them at 24 h was less than 0.2%. The compressive strength of the samples was measured at a 0.6 kN/s loading speed on a TYA-300B testing machine. The compressive strength data used are the mean value of at least five test results after excluding the results with deviation over 15%.

2.3.3. Water Resistance

The strength of HPG pastes under saturated conditions, the softening coefficient and the saturated water absorption rate were used to evaluate water resistance. The drying samples were soaked in water (20 ± 2 °C) for 1 day. A damp towel was wrung out to remove excess water, and we then wiped away the water on the surfaces of samples. The weight and the strength of saturated specimens were tested immediately. The softening coefficient can be calculated using Equation (1) and the saturated water absorption rate can be calculated by Equation (2). Three samples were used in the test.
S = S W S D
R = m W m D m D × 100 %
where S is the softening coefficient; SW (MPa) is the compressive strength of specimens under saturated conditions; SD (MPa) is the compressive strength of drying samples; R is the water absorption at saturation; mW (g) is the quality of specimens under saturated conditions; and mD (g) is the quality of drying specimens.

2.3.4. Carbonation Area

After curing for 14 days, the hardened HPG pastes were split in the middle and applied 1 wt.% phenolphthalein pH indicator ethanol solution on the fresh split surface, to examine the carbonation area.

2.3.5. Chemical Composition Analysis

The raw materials were dried to constant weight in a vacuum at 40 °C and were ground with a mortar and pestle. The chemical composition analysis of raw materials was conducted on an X-ray fluorescence spectrometer (Bruker, S8 TIGER, Billerica, MA, USA).

2.3.6. Particle Size Distribution Analysis

The raw materials were dried to a constant weight in a vacuum at 40 °C. The particle size distribution analysis of raw materials was performed using a laser particle size analyzer (OMEC, Topsizer, Zhuhai, China) and the dispersion medium was ethanol.

2.3.7. Hydration Products Analysis

After curing for 14 days, the hardened pastes were crushed into pieces of less than 5 mm. In order to terminate hydration, the pastes were immersed in isopropanol for 7 days and then dried in a vacuum for another 7 days. The drying pastes were ground with a mortar and pestle to prepare powder samples.
The crystalline phases in the powder samples were measured using an X-ray diffraction machine (Rigaku, model D/max·III·X, Tokyo, Japan) with Cu Kα radiation (λ = 1.5418 Å) at 40 KV and 40 mA, a scanning range of 5–65°, a scanning step of 0.02° and a scanning rate of 2°/min. Table 4 presents the phases used with a PDF code and an ICSD collection code.
The powder samples were characterized by TG-DTG using a Germany Netsch STA 449C thermal analyzer with a temperature range of 35–950 °C. The heating rate was 10 °C/min and the nitrogen gas flow was 20 mL/min. Water lost before and after 100 °C is considered as adsorbed water and chemical combined water, respectively.

2.3.8. Microstructure Analysis

A JSM-IT500L machine (JEOL, Tokyo, Japan) was used for the scanning electron microscopy (SEM) test to analyze the microstructures of the pastes after 14 days of curing. The drying fractured samples were platinum sputter-coated. Images were acquired at 20 kV and 40 μA. EDS analyses were performed at 20 kV and 66 μA, and image magnification ranged from 50 to 20,000 times.

2.3.9. Pore Structure Analysis

After curing for 14 days, the hardened pastes were drilled into cores to make the samples for pore structure analysis. Hydration also had to be terminated in the samples. Mercury intrusion porosimetry (MIP) was conducted on a AutoPoreIV9500 apparatus (Micromeritics, Norcross, GA, USA). N2 physisorption measurement was performed using a Builder SSA-4000 apparatus (Builder, Beijing, China) and analyzed using a BJH model [34].

3. Results

3.1. Effects of CH Addition on the Setting Time and Fluidity of HPG Pastes

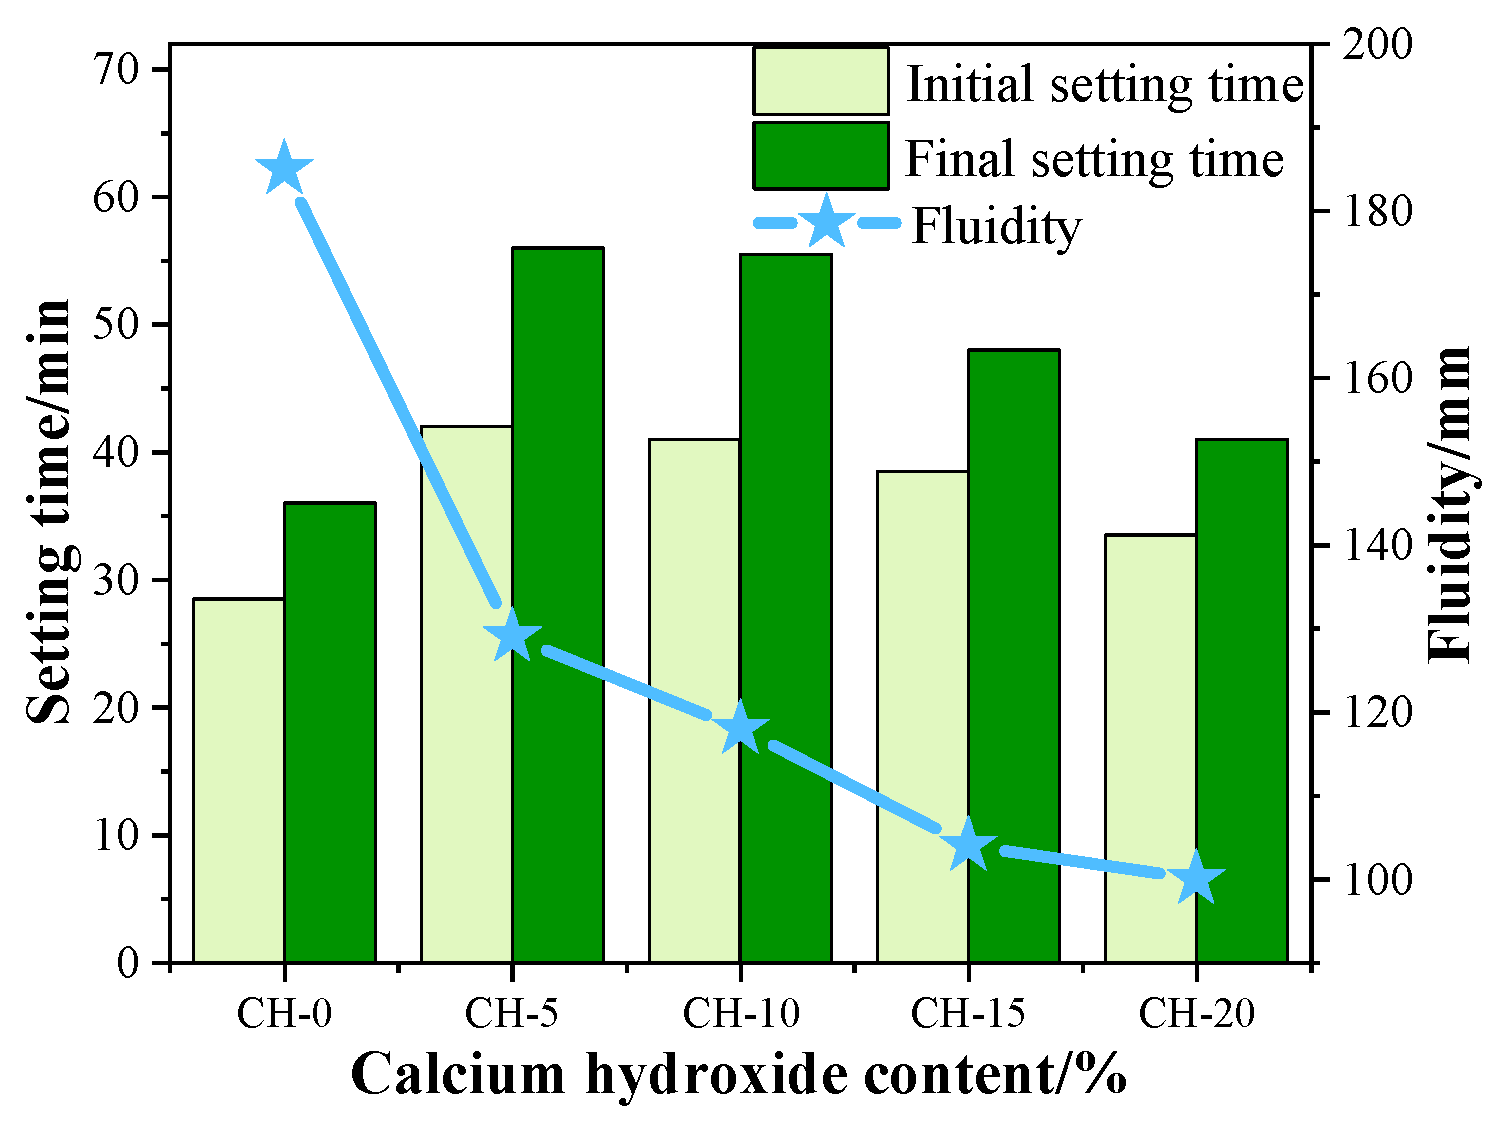
Figure 5 shows the setting properties of HPG pastes with variable additions of CH. It can be seen that CH additions prolonged the setting time of HPG pastes, and the setting time presented a tendency of increasing first and then decreasing with the increase in CH. The HPG paste with 5 wt.% CH showed the longest setting time, with 42 min of initial setting time and 56 min of final setting time. The group without CH had the shortest setting time, with a 28.5 min initial setting time and 36 min final setting time. As to the fluidity, when the CH increased from 0 wt.% to 20 wt.%, the fluidity reduced from 185 mm to 100 mm. The main reason for the reduced fluidity is that CH has a finer particle size and a larger surface area than HPG, and it requires more water to achieve the same consistency.

3.2. Effects of Carbonation on the Mechanical Properties and Water Resistance of HPG + CH Pastes

Figure 6 displays the effects of CH addition and carbonation curing on the compressive strength of HPG pastes.
From Figure 6a, it can be seen that the compressive strength of specimens under atmosphere showed a downward trend with the increase in CH addition by approximately 9–37%, which suggests that excessive amounts of CH could reduce the strength. However, the compressive strengths of samples under carbonation curing first decreased and then increased with the increase in CH. The compressive strengths of CH-15 and CH-20 under carbonation curing were 17.16 MPa and 19.15 MPa, respectively, which increased by 16.2% and 59.6% compared to those pastes under atmosphere. After 1 day of water immersion, as shown in Figure 6b, the compressive strength of the pastes showed a similar trend to the dry condition, whereby the CH addition decreased the compressive strength, but the carbonation curing was shown to significantly increase the compressive strength of HPG + CH pastes, especially the carbonation-cured CH-15, which showed a 60.9% increase compared to the CH-15 under atmosphere curing.
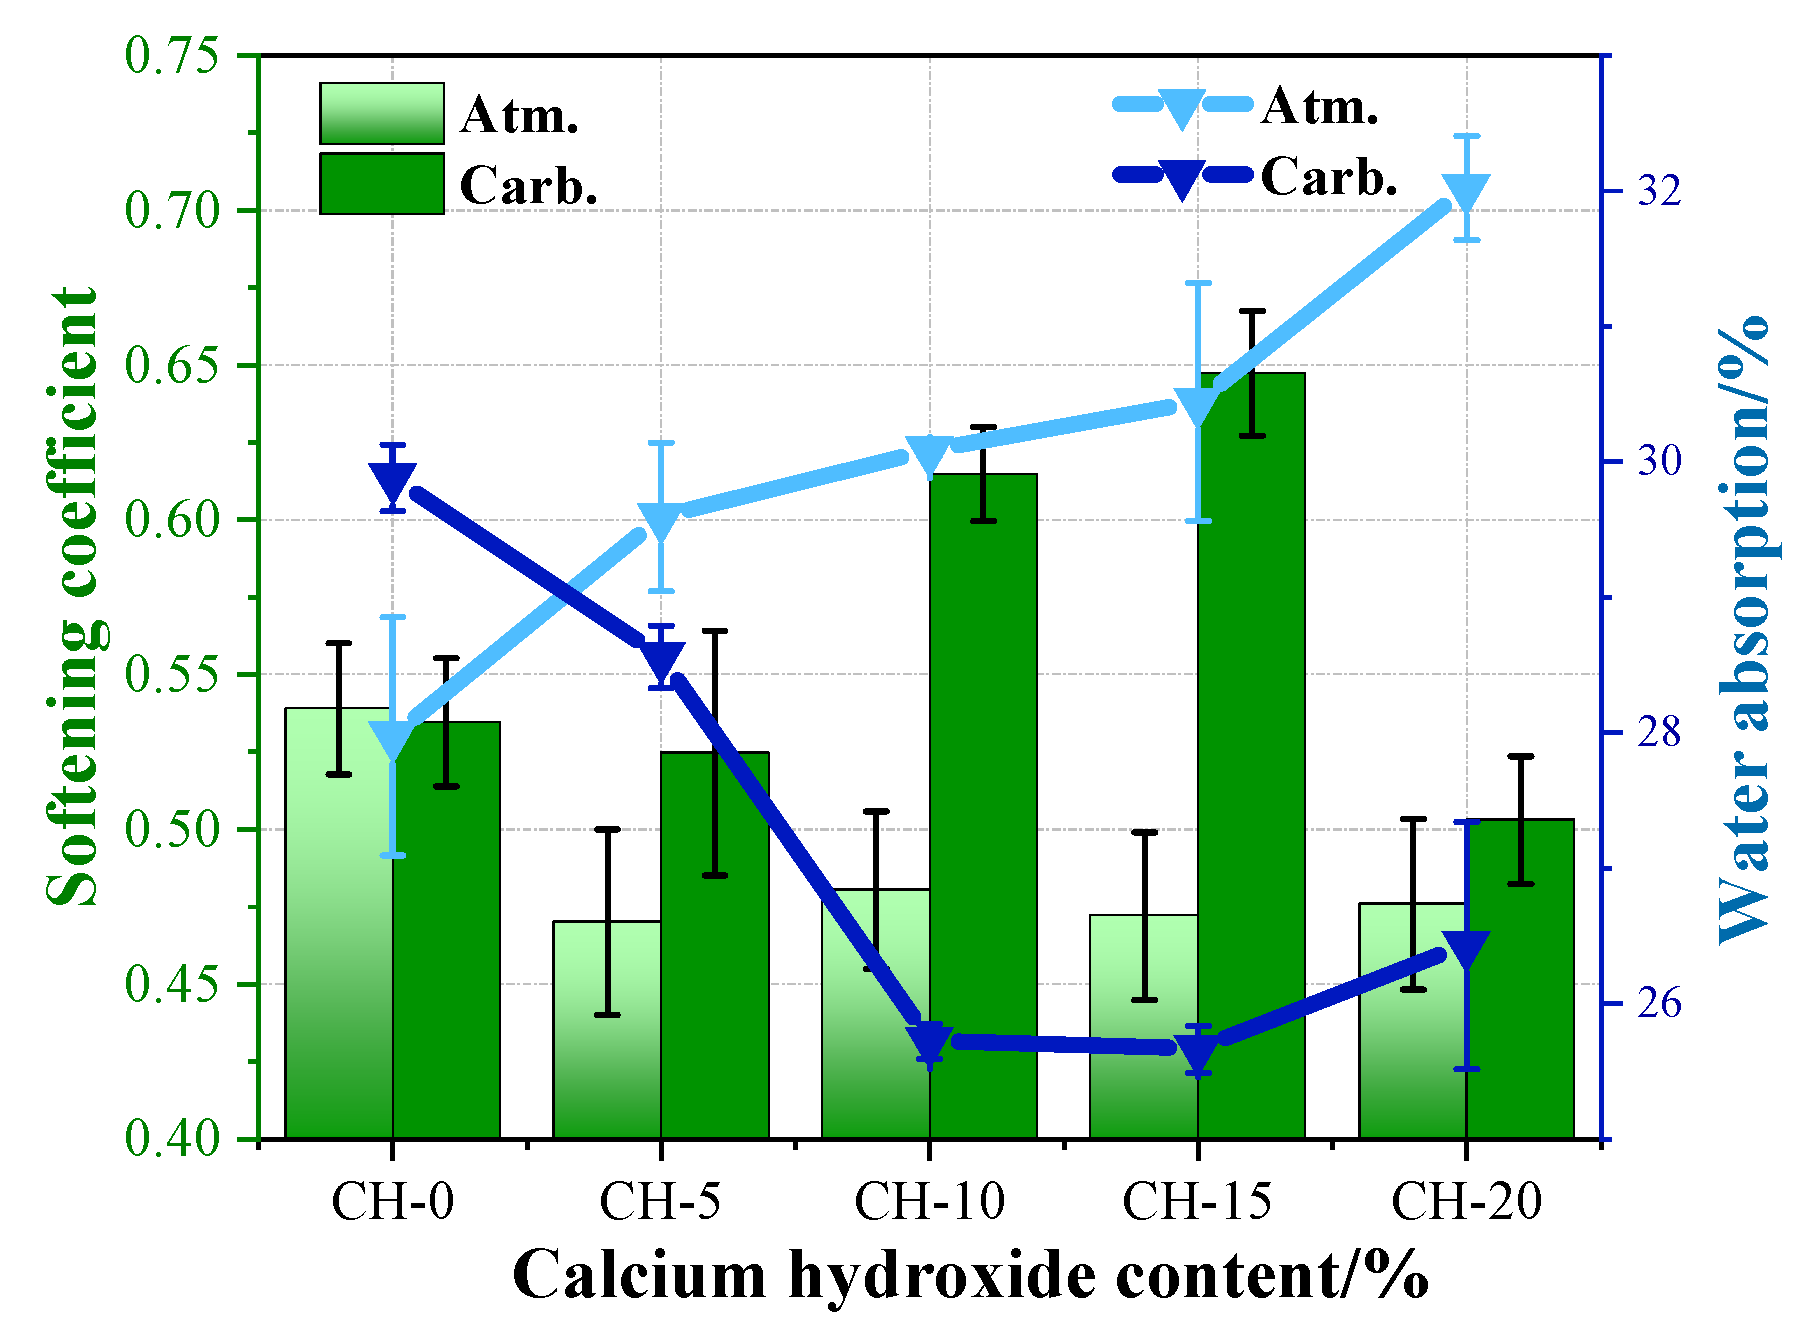
The high-water resistance of gypsum products will encourage their use. The softening coefficient and the water absorption rate were calculated and illustrated in Figure 7.
It can be seen in Figure 7 that: (1) The CH addition could decrease the water resistance of HPG pastes with a small softening coefficient and a high water-absorption rate. (2) The carbonation curing also decreased the water resistance of pure HPG paste, but could markedly improve the water resistance of HPG + CH pastes, especially for the softening coefficient of carbonation-cured CH-15, which reached 0.65. (3) The inadequate water resistance of CH-20 may be due to too much CH addition, and the CaCO3 formation under carbonation curing could not make up the loss of water resistance of HPG paste. Pore structure analysis helped us to identify the causes.

3.3. Carbonation Area of HPG + CH Pastes

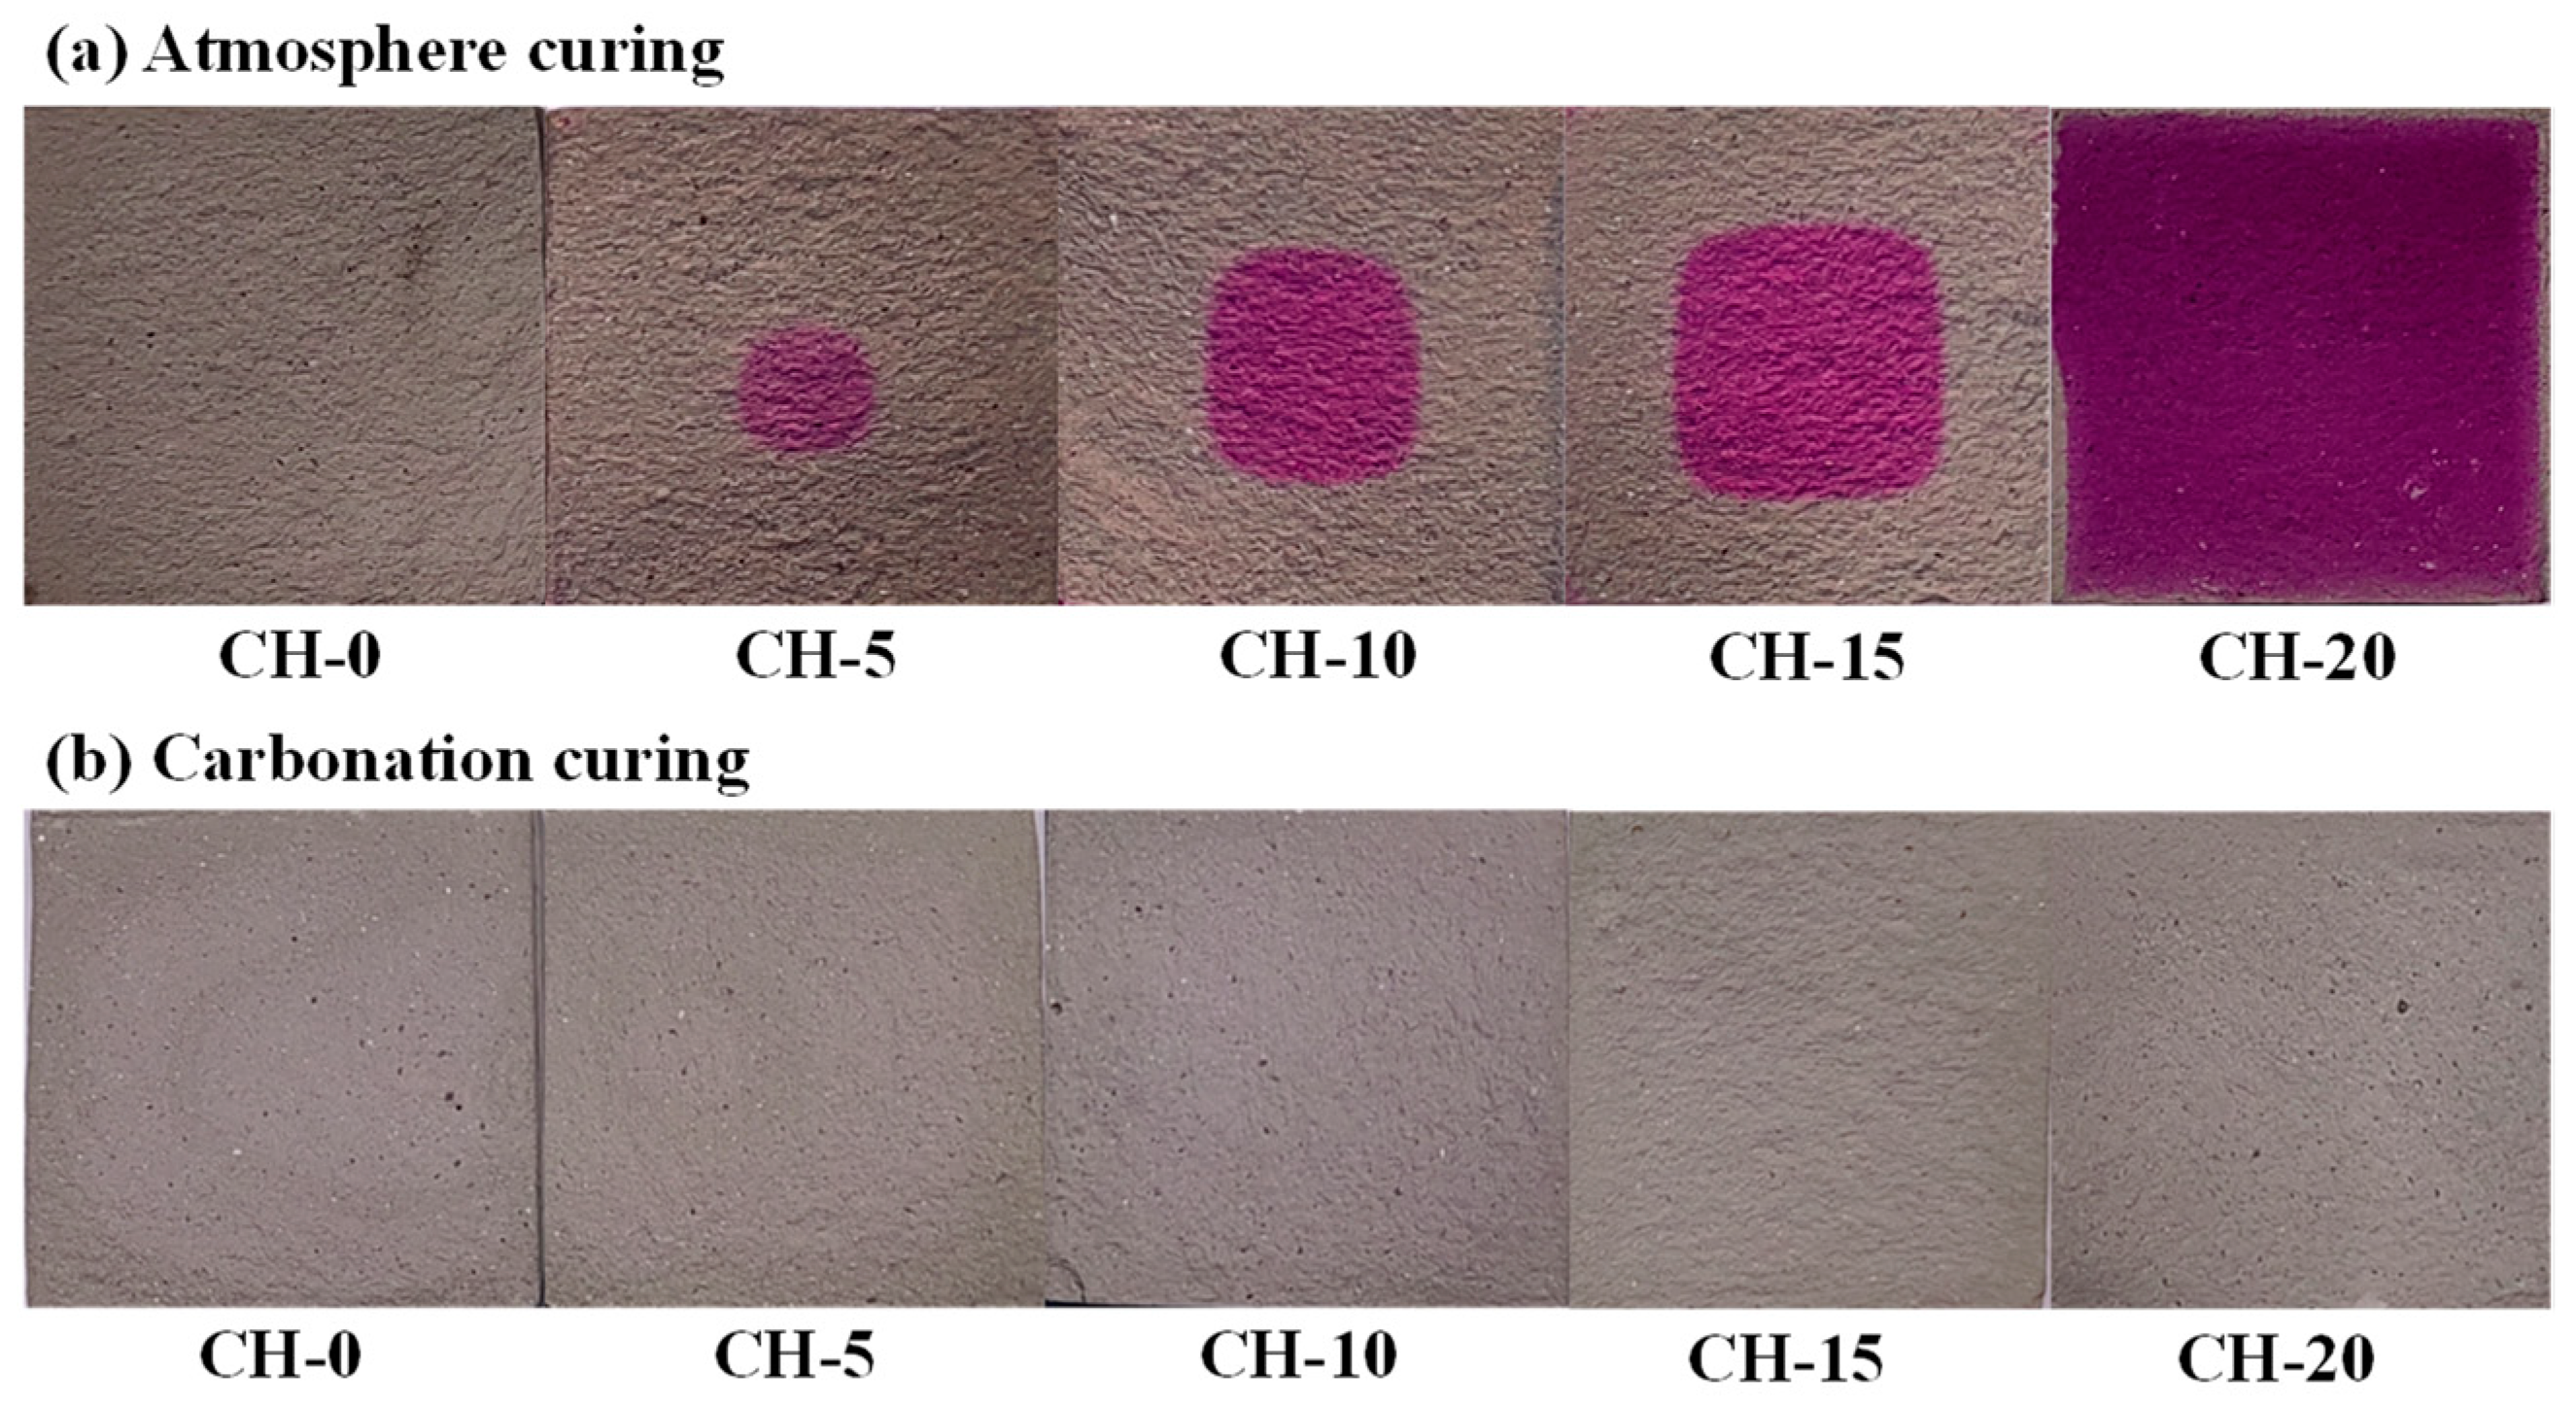
Figure 8 illustrates the freshly split surfaces of specimens sprayed with a 1 wt.% phenolphthalein indicator ethanol solution after atmosphere curing and carbonation curing for 14 d.
In Figure 8a, the red color shown in the center of atmosphere-cured specimens containing CH indicates that carbonation proceeds from the outsides to the insides. Under atmosphere curing, the CH in the periphery of specimens was carbonated due to natural carbonation, and uncarbonated CH occurred in the centers of the specimens. Increasing the CH addition enlarged the red areas, which means that the carbonation rate slowed down with the increase in CH addition. In Figure 8b, for all specimens with CH exposed to the carbonation environment, no obvious color difference appeared on the split surfaces. This reflects that CH in the specimens has been neutralized by CO2 after carbonation curing for 14 d. XRD and TG-DTG analysis helped us to further identify the reaction products in the pastes.

3.4. Products Identification of HPG + CH Pastes

3.4.1. XRD Analysis

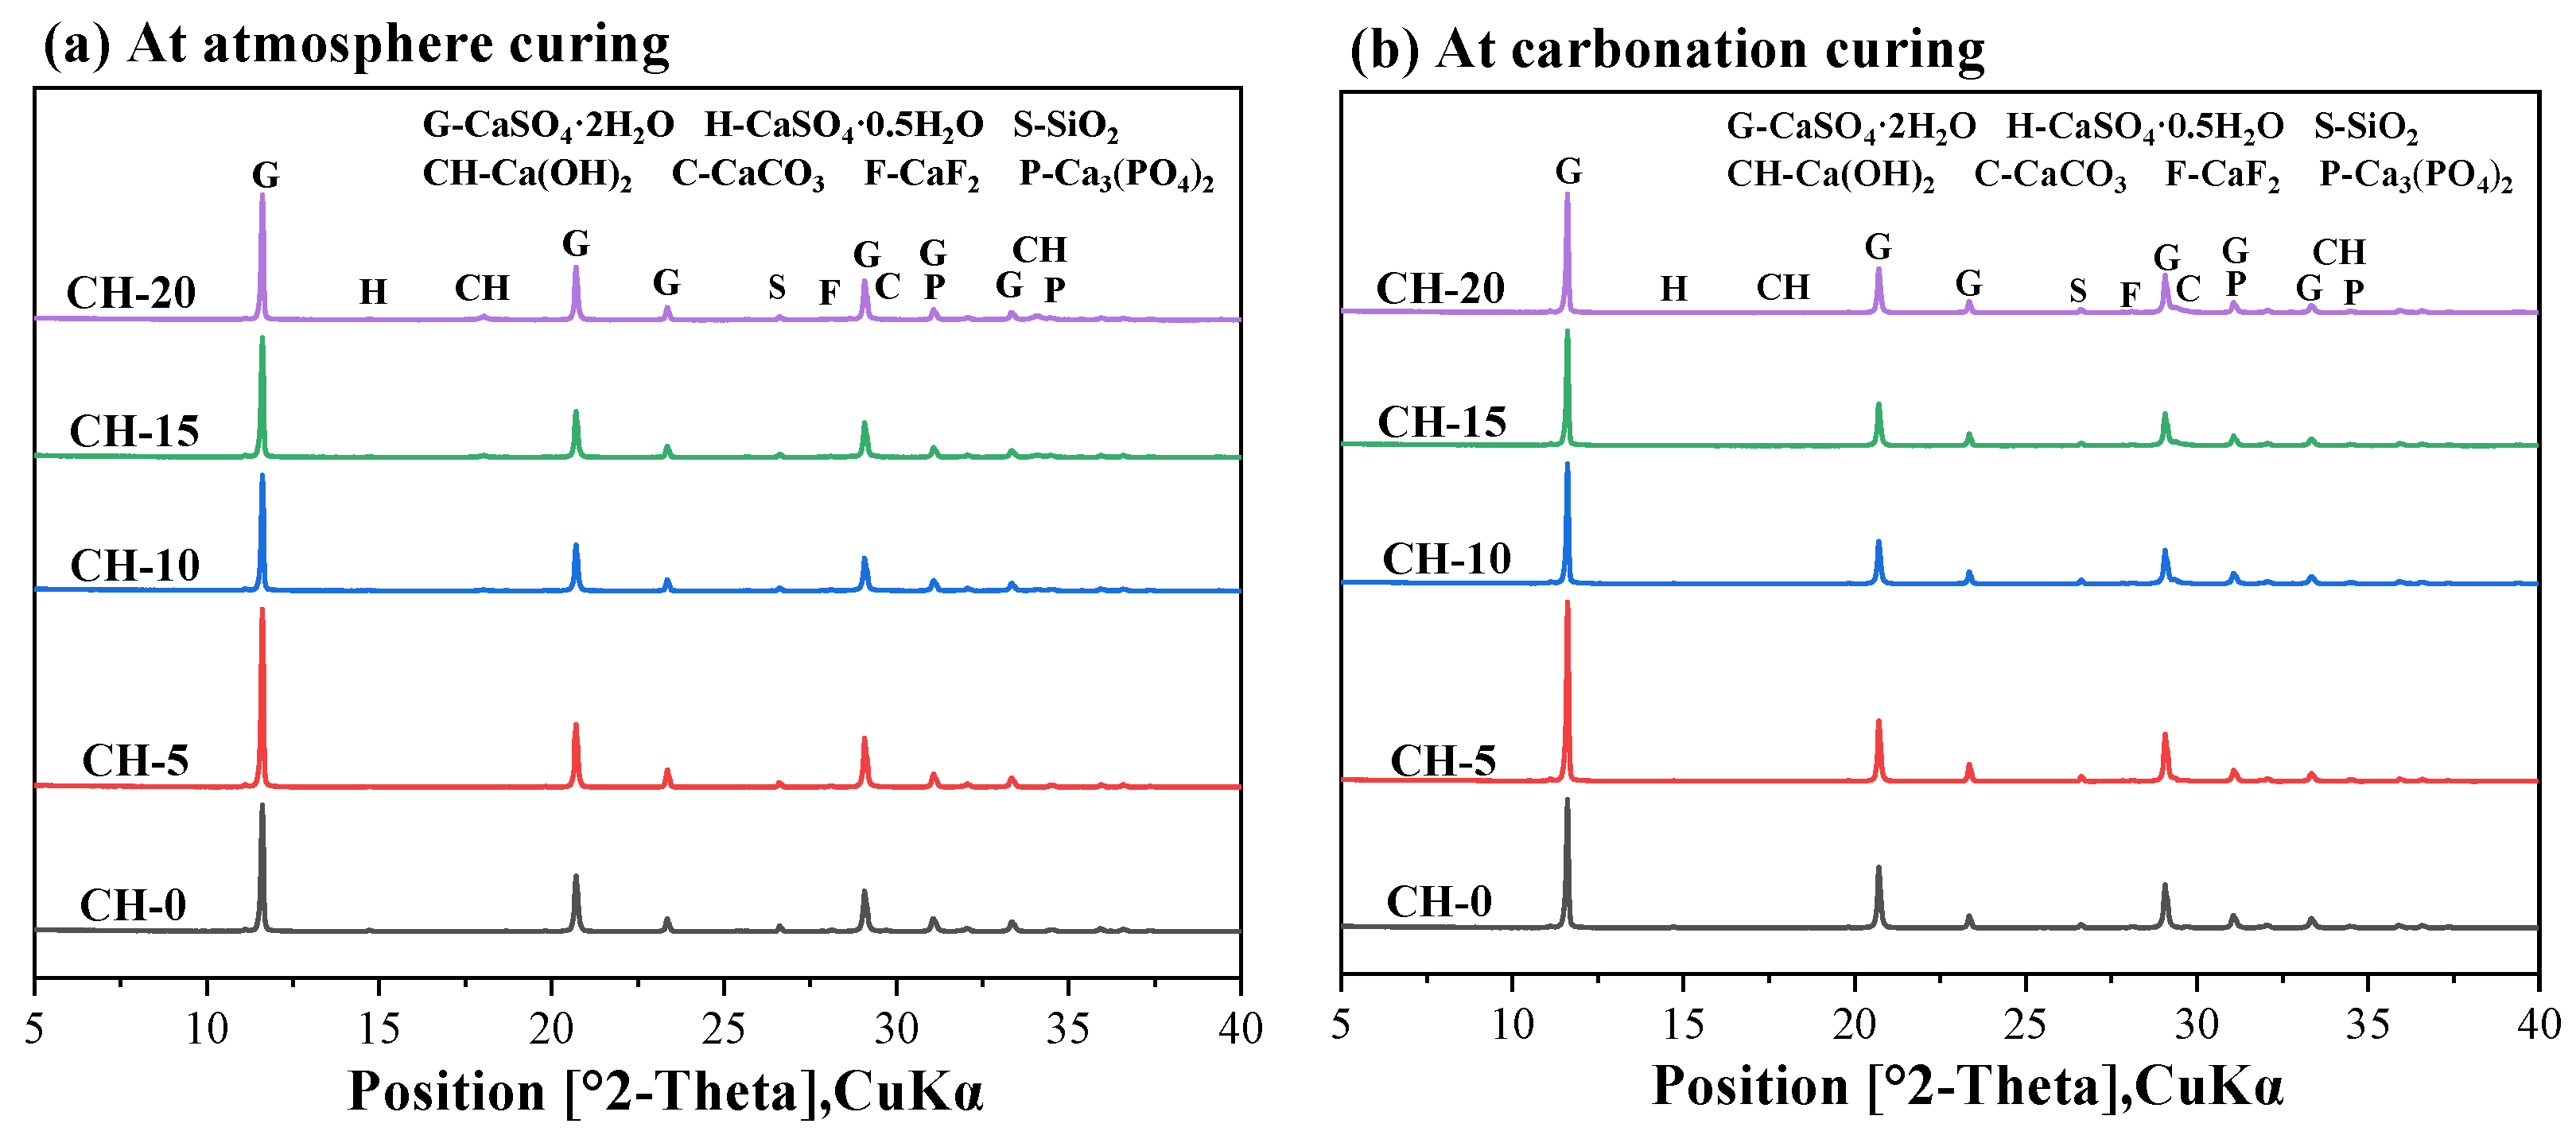
Figure 9 displays the XRD patterns of the pastes exposed to atmosphere curing and carbonation curing for 14 days.
In all the samples, we can observe the presence of CaSO4·2H2O, CaCO3, CaF2, Ca3(PO4)2 and impurity SiO2. It is hard to detect CaSO4·0.5H2O, which here hydrated to form CaSO4·2H2O. The characteristic peaks of Ca3(PO4)2 and CaF2 were detected, suggesting that CH could solidify harmful impurities into insoluble substances in HPG [18]. In Figure 9a, diffraction peaks of CH were apparent in the atmosphere-cured pastes, and CaCO3 was also identified due to natural carbonation. In Figure 9b, CaCO3 was detected in the carbonation pastes and Ca(OH)2 could hardly be detected, demonstrating that the Ca(OH)2 was almost carbonated to form CaCO3. The gypsum peak overlaps with the CaCO3 peak at around 29°, and TG-DTG analysis could help to further analyze the change in hydration products.

3.4.2. TG-DTG Analysis

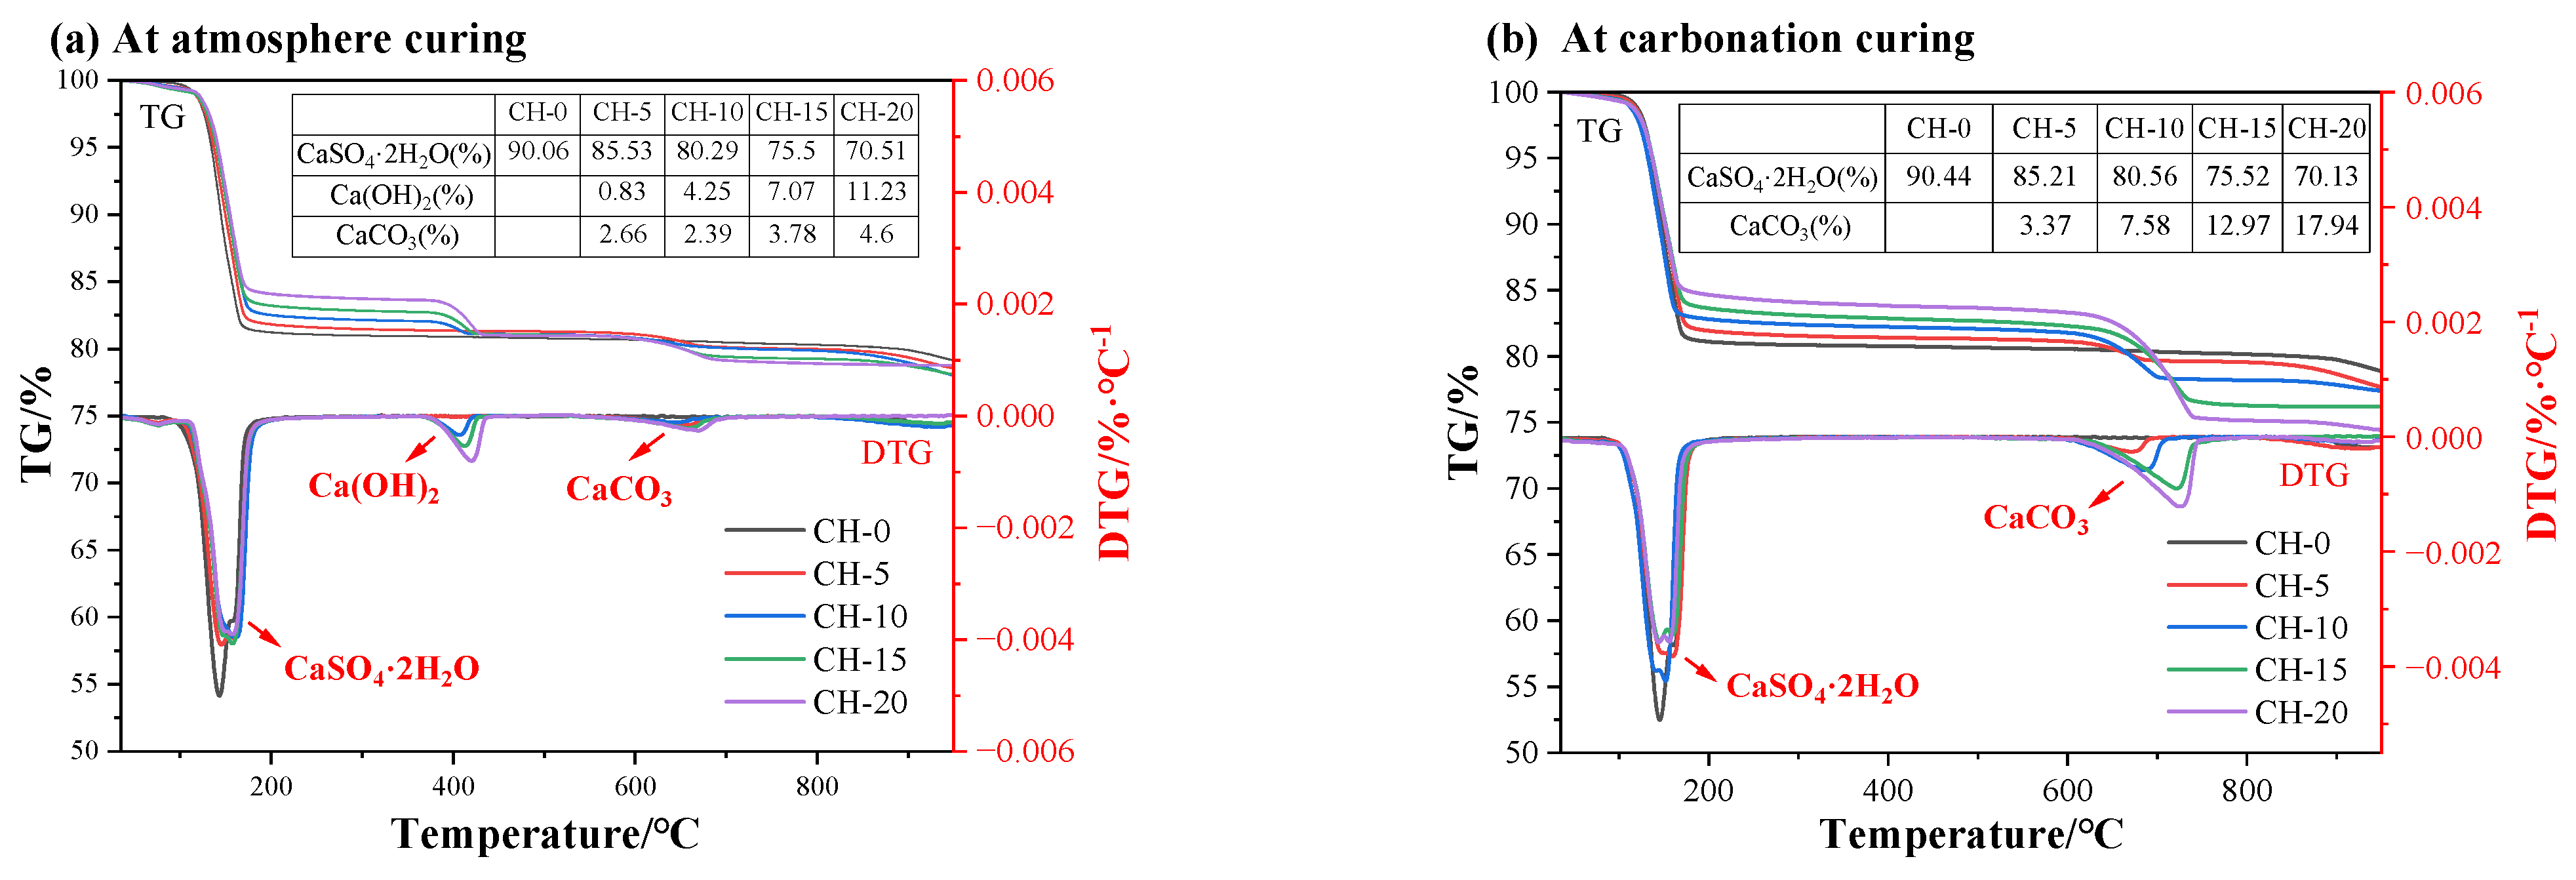
The DTG/TG analysis of HPG paste powder samples after 14 d of atmosphere curing and carbonation curing was used to calculate the amounts of hydration products. For samples under atmosphere curing, as shown in Figure 10a, three clear stages of mass loss occur at 100–190 °C, 360–450 °C, and 540–700 °C due to the decomposition of CaSO4·2H2O [35], Ca(OH)2 and CaCO3 [36] (Ca(OH)2 was lightly carbonated in air), respectively.
As displayed in Figure 10b, the carbonated specimens have weak dehydration peaks of CH, suggesting that most of the CH was consumed. CaCO3 decarbonation at higher temperatures from 670 °C to 730 °C implies its good crystallization [37]. Furthermore, a higher CH content resulted in a higher decarbonation peak, also revealing the formation of well-crystallized CaCO3 [38].

3.5. Microstructure Analysis

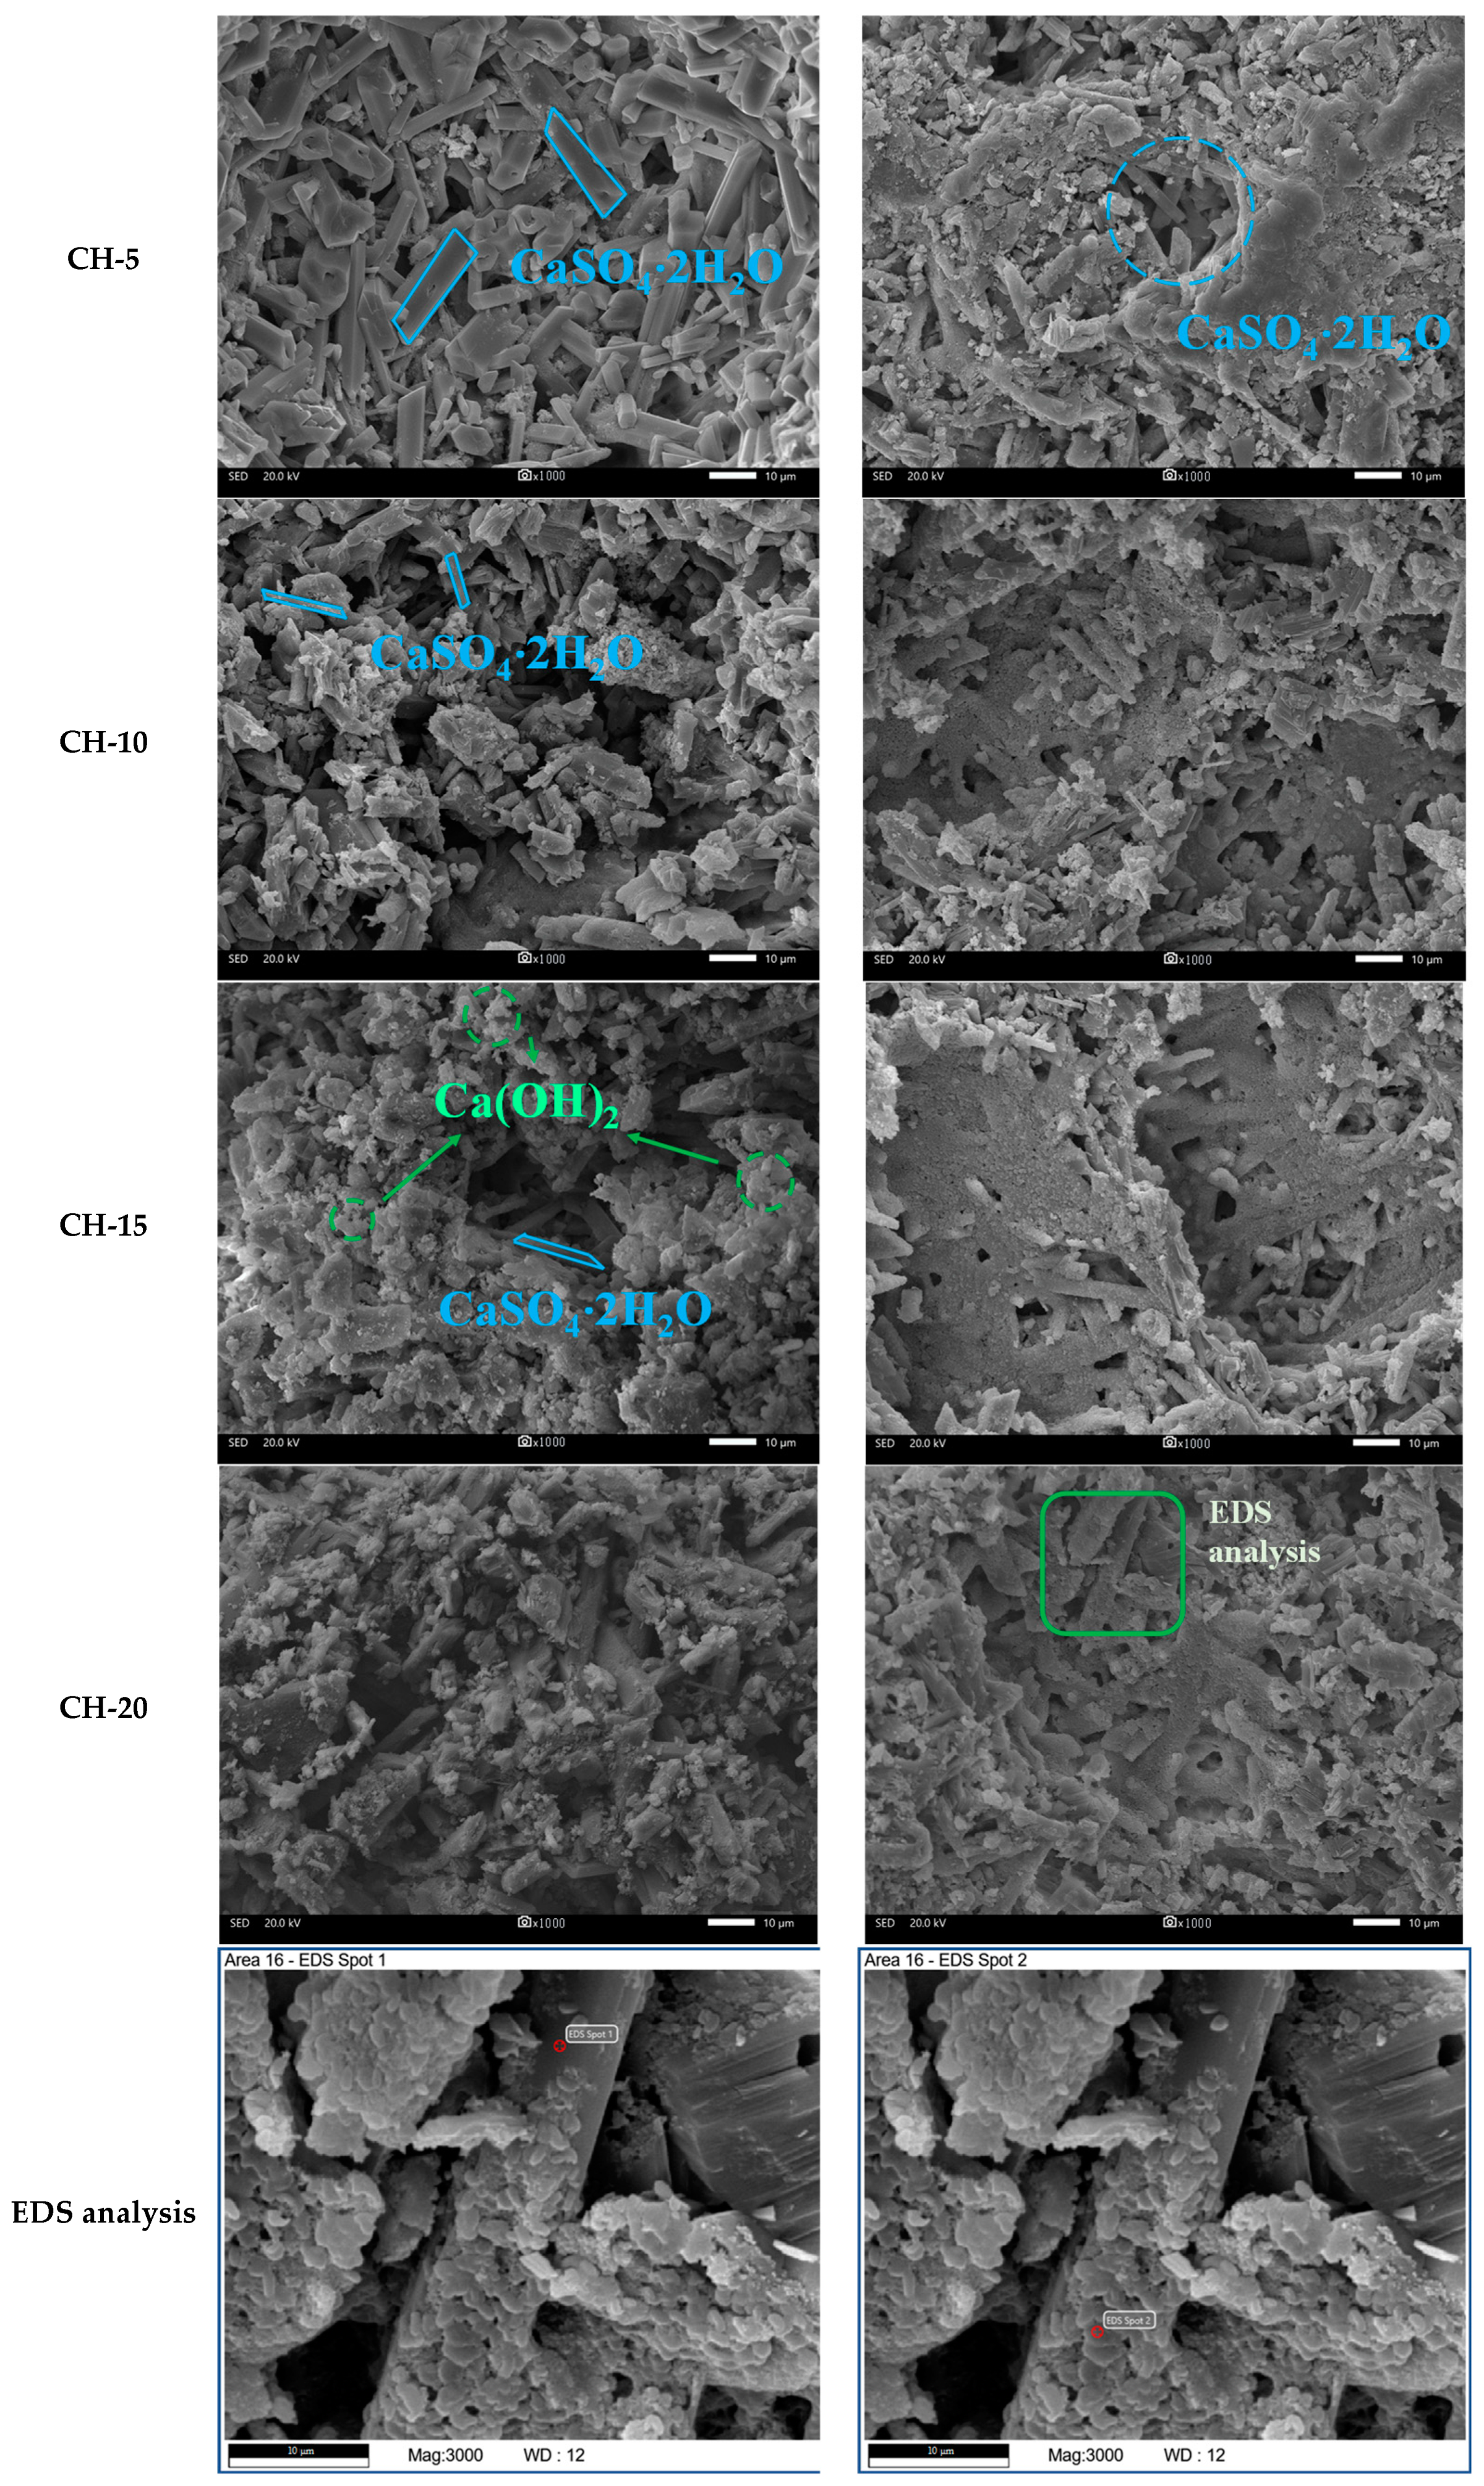
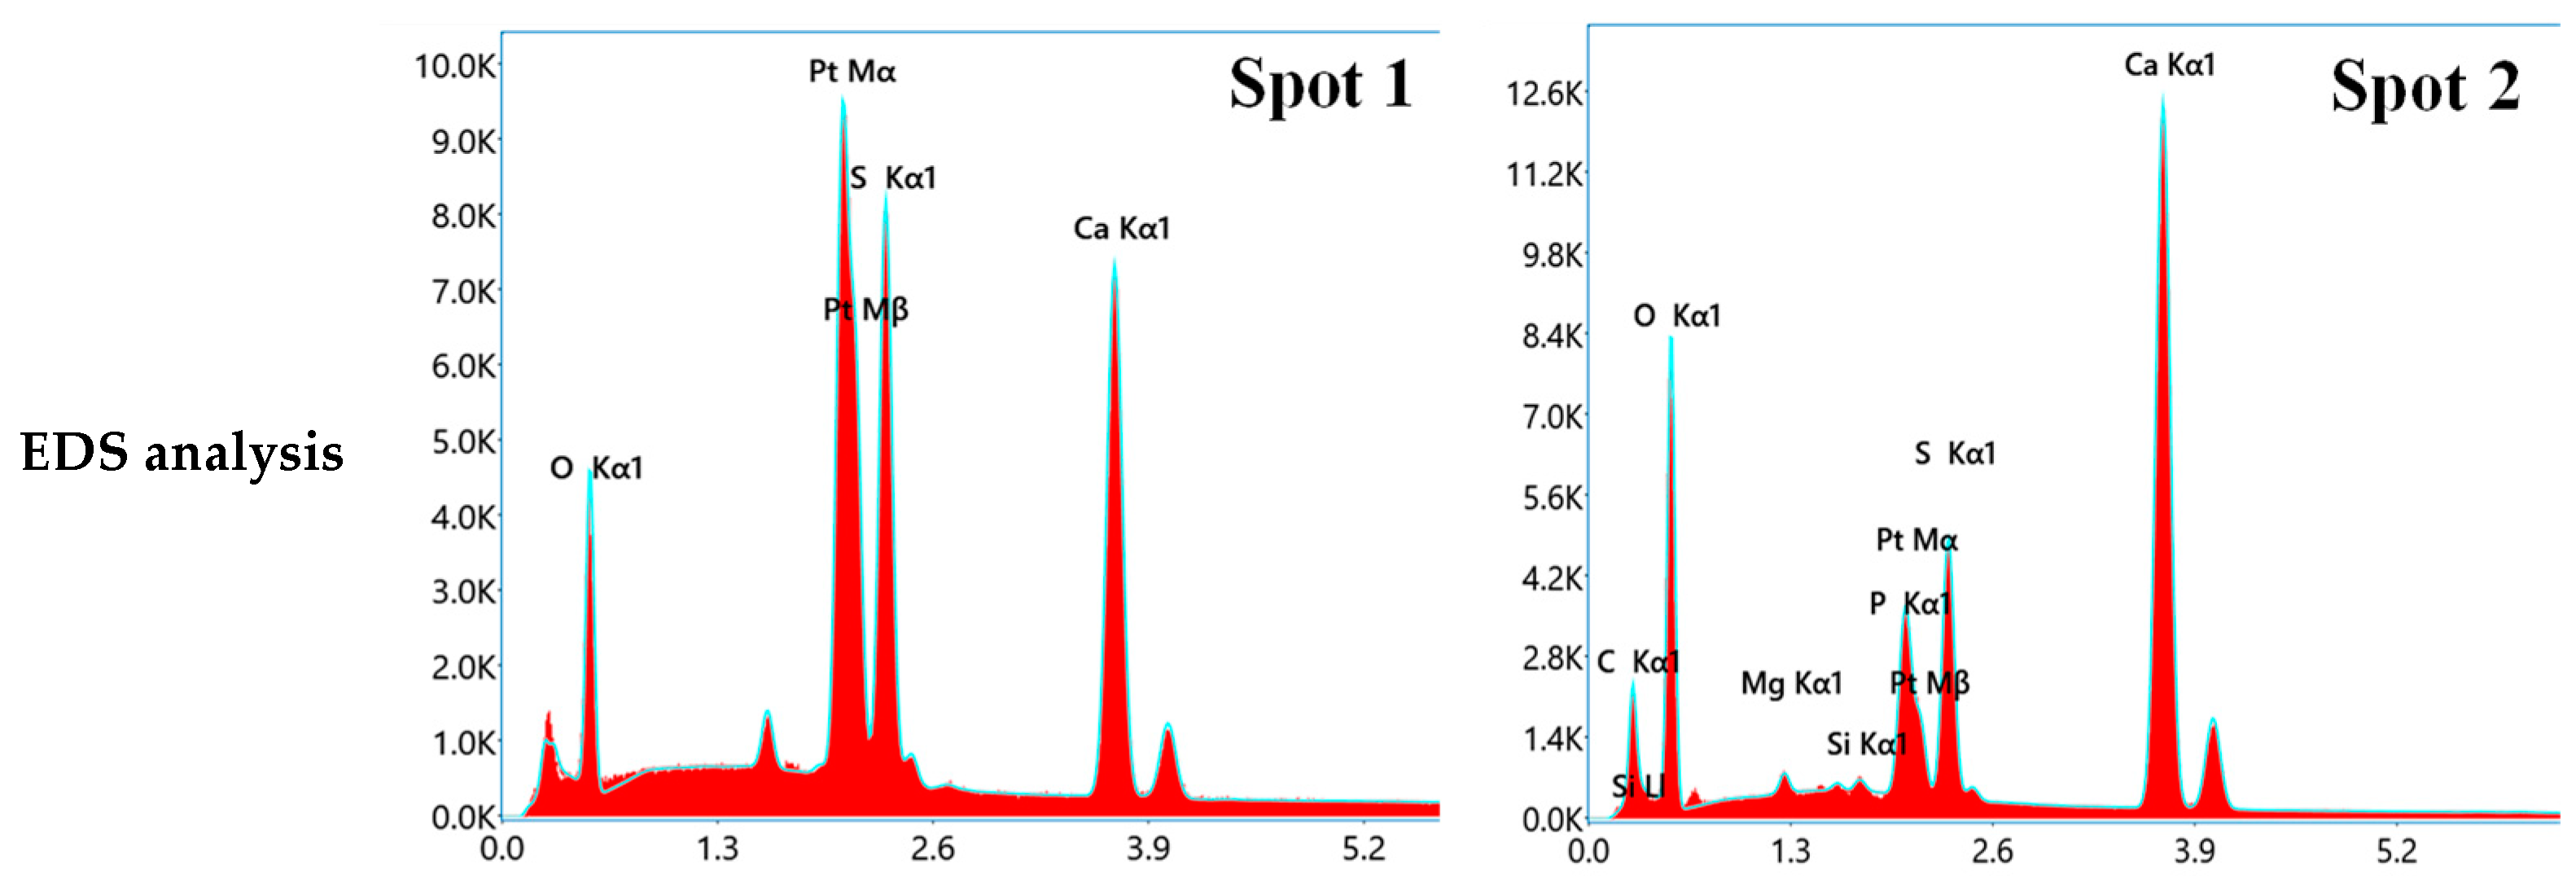
Figure 11 displays the SEM-EDS analysis of HPG pastes after 14 d of atmosphere curing and carbonation curing.
In the atmosphere-cured group, it was evident that the appearance of gypsum crystals was altered with CH addition from interlaced needle-like (CH-0) to short prism-like (CH-5), and the length–radius ratio decreased [39]. With increasing dosages of CH, the gypsum crystal shapes recovered to some extent (CH-10, CH-15), while the number of gypsum crystals decreased. Fewer gypsum crystals formed effective contact with each other, and a large amount of CH remained uncarbonated, resulting in a loose microstructure.
As for carbonation-cured samples, firstly, the gypsum crystals in the pure HPG paste showed poor crystallization (CH-0) and the addition of CH restored the crystal growth of gypsum (CH-5). Secondly, it can be seen that lots of nanoscale CaCO3 crystals like fish’s scales covered the gypsum crystals to form a dense carbonate layer (shown in EDS analysis). Thirdly, CaCO3 crystals filled in the pores to make the microstructure denser. However, the insufficient amount of CH (CH-5) limited the coverage of CaCO3. With increasing dosages of CH (CH-10, CH-15 and CH-20), the carbonation-cured samples showed a dense microstructure.

3.6. Pore Structure

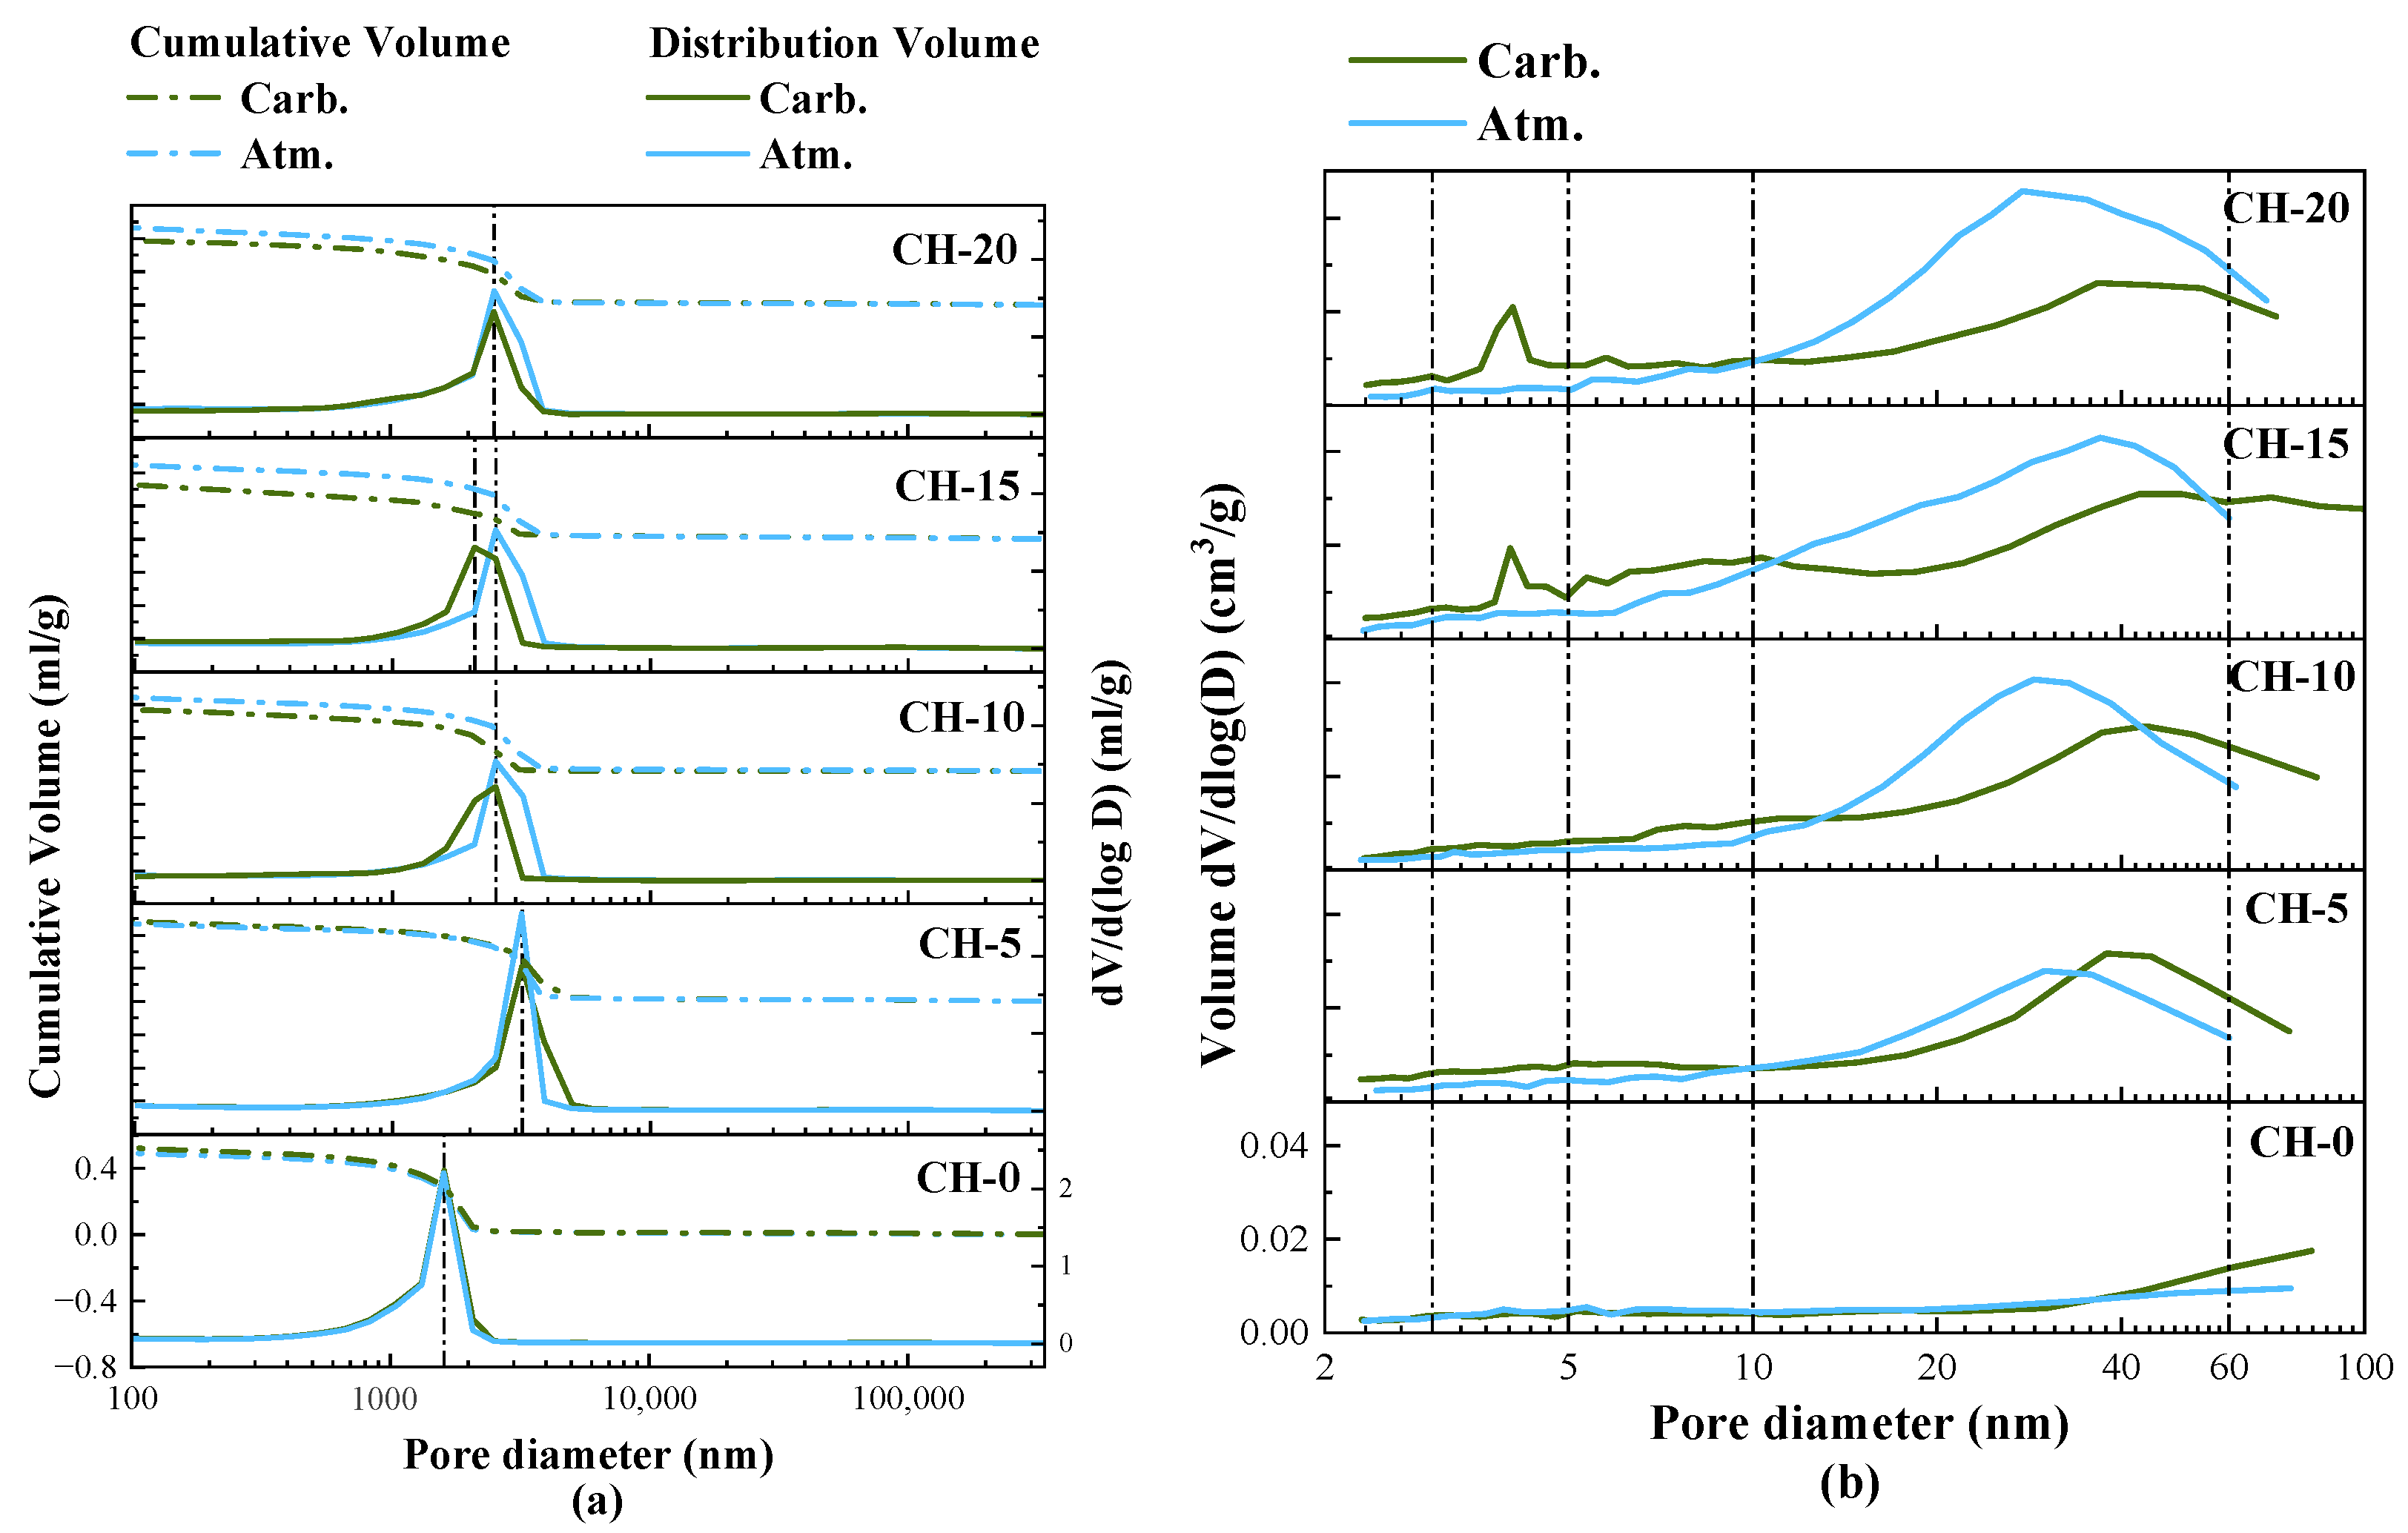
The pore structure of HPG-hardened pastes can be used to interpret the macroscopic performance (mechanical strength [40] and water resistance [41]). In accordance with the International Union of Pure and Applied Chemistry (IUPAC) pore classification [42] for <2 nm micropores, 2–50 nm mesopores, and >50 nm macropores, mercury intrusion porosimetry (MIP) was used to analyze pores >100 nm and N2 physisorption measurement was used to analyze pores <100 nm in the study [43]. The distributions of pores are presented in Figure 12.
According to the results obtained from MIP in Figure 12a, under atmosphere curing, fewer changes were seen in the cumulative porosity, and the most probable aperture (MPA) shifted to a larger size with the addition of CH. Under carbonation curing, the cumulative porosity of pure HPG paste was slightly increased, and the cumulative porosity of HPG + CH pastes was significantly decreased compared to atmosphere curing. Compared to the strength, the changes in accumulated porosity showed a higher correlation with the softening coefficient of HPG pastes. Carbonation-cured CH-15 achieved the highest softening coefficient with the minimum cumulative porosity. The number of MPA of carbonated HPG + CH pastes was reduced compared to atmosphere curing, and the size of MPA of carbonated CH-15 was smaller than that of atmosphere curing. In summary, carbonated HPG + CH pastes reduced the number of pores and refined the distribution of pores compared to atmosphere curing.
The pore distributions between 2 and 100 nm obtained by N2 physisorption analysis using a BJH model are displayed in Figure 12b. The atmosphere-cured pastes exhibited higher pore volumes with increasing CH content. For the carbonation-cured pastes, the volumes of pores between 10 and 60 nm remarkably decreased when CH exceeded 5 wt.%, and a second peak appeared between 3 and 5 nm in both CH-15 and CH-20. This suggests that sufficient CH replacement could reduce the mesopore size of HPG pastes and expand the pore distribution range under carbonation curing. This is related to the agglomeration and filling effects of CaCO3, associated with the SEM results.

4. Discussion

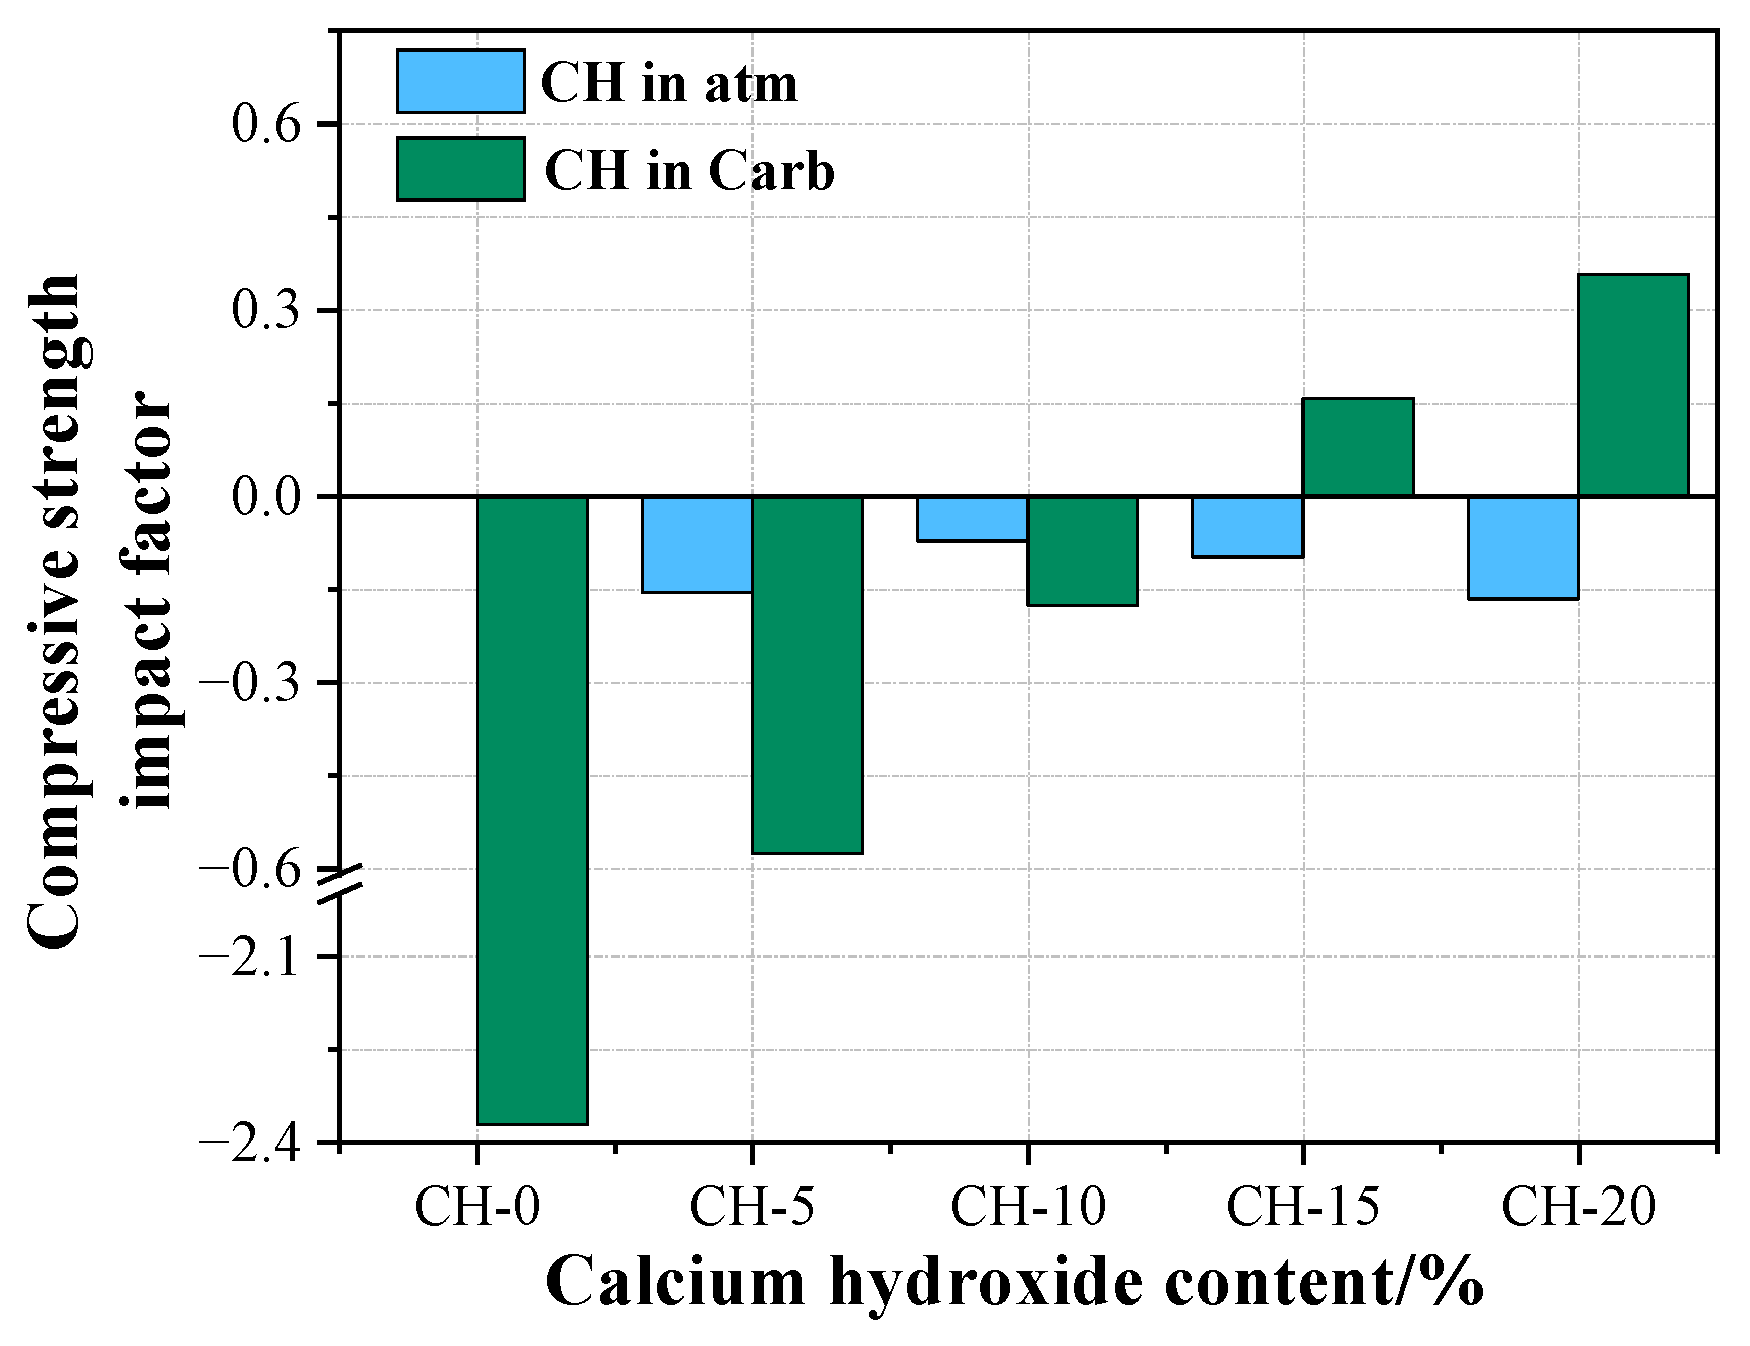
To visually analyze the effects of adding CH and carbonation on the properties of HPG pastes, we used Equation (3) to calculate their compressive strength impact factor, and displayed the results in Figure 13. The positive and negative values of compressive strength influencing factors represent the positive and negative influence on compressive strength of the reference group.
λ = S t S CH - 0
where λ is the compressive strength impact factor; St (MPa) is the compressive strength of samples; SCH-0 (MPa) is the compressive strength of CH-0 under atmosphere curing.

4.1. The Effects of CH on the Performance of HPG

The effects of CH on the performance of HPG are analyzed according to the atmosphere-cured pastes. As revealed by XRD and SEM analysis, incorporating CH into HPG could generate Ca3(PO4)2 and CaF2, which coated the surfaces of HPG and gypsum nuclei, impeding the dissolution of HPG, and concurrently slowing down the formation of gypsum nuclei and suppressing the growth of gypsum crystals [44]. Therefore, adding CH into HPG sharply prolonged the setting time, and presented a negative influence on compressive strength and water resistance (showed in Figure 7 and Figure 13). With the increase in CH, P and F were completely neutralized, and excess CH particles preferentially adsorbed Ca3(PO4)2 and CaF2, which mitigated their negative impacts on the growth of gypsum crystals [19]. Furthermore, the residual CH particles could act as nuclei for the crystallization of gypsum through the seeding effect [20]. This is why the setting time gradually decreased when the CH content exceeded 5 wt.%. However, during this process, there was a dilution effect that decreased the number of gypsum crystals, and a large amount of CH remained uncarbonated, which jointly led to a larger pore size and a loose microstructure, and reduced the performance of HPG (showed in Figure 13). However, the structure is conducive to the carbonation of CH.

4.2. The Effects of Carbonation Curing on the Performance of HPG + CH Pastes

In Figure 11, Figure 12 and Figure 13, it can be observed that carbonation curing has a heavy negative influence on the strength of the pure HPG, with poor crystallization and a higher cumulative porosity. This is because carbonation curing has an adverse effect on the gypsum crystallization, similar to the effect of phosphoric acid on HPG [39]. The samples were carbonated at all levels of CH used as an HPG replacement. Since the coverage of CaCO3 crystals formed from the residual CH after neutralization was limited, 5 wt.% CH addition showed a negative value of compressive strength influencing factor, as shown in Figure 13. With the increase in CH addition under carbonation curing, a greater number of insoluble CaCO3 crystals were precipitated (about 3.37~17.94% from TG analysis) with an 11.4% increase in solid volume [45]. CaCO3 aggregation not only formed a compact layer of carbonate salts on the surface of gypsum crystals, but also filled in the pores and around the pore surfaces of the gypsum crystals (shown in SEM analysis), which led to a smaller pore size, a lower porosity and a dense microstructure. This is the reason why the compressive strength influencing factor value of HPG + CH pastes under carbonation curing changed from negative to positive and increased with the increase in CH in Figure 13. This is also of great significance for enhancing the water resistance of gypsum. The dense carbonate layer on the surface of gypsum crystals could prevent the dissolution of gypsum, and the aggregation of CaCO3 filling in the pores and around the pore surfaces could block both the entry and exit of moisture. As a result, the collaborative effects of carbonation curing and CH addition cancel out the harm that a single factor causes.
To select the optimal dosage of CH, Figure 14 displays the growth rates of the compressive strength and softening coefficient of carbonation-cured specimens compared to atmosphere-cured specimens.
As revealed by Figure 14, the growth rate of the compressive strength initially exhibited a negative value, followed by an increase to a positive value with the increment of CH content. Concurrently, the growth rate of the softening coefficient first improved and then declined when the CH content exceeded 15 wt.%. The negative values of the growth rate of compressive strength in CH-0, CH-5 and CH-10 are due to the adverse effects of carbonation curing and the presence of fewer CaCO3 crystals. The lower softening coefficient of CH-20 is expected to be attributed to the greater CH addition. A large amount of CaCO3 crystals was not enough to make up for the structural damage caused by the reduction in gypsum crystals resulting in pore coarsening. In Figure 14, the carbonation-cured CH-15 showed optimal comprehensive performance with a softening coefficient of 0.65 increased by 37.1%, and a compressive strength of 17.16 MPa increased by 16.2%. The modified HPG is suitable for making blocks [46], tiles, plastering and masonry work, making glass/sisal reinforced boards and so on [47]. The synergistic effects including the neutralizing, seeding and diluting effects related to CH and the filling effects related to CaCO3 may be optimized. CH-15 achieved the densest microstructure and the minimum cumulative porosity.
There are some studies on improving the water resistance of HPG. Fornés et al. [48] modified HPG with 0.3% metallurgical sludge, and the softening coefficient was 0.53. According to Jin et al. [49], the compressive strength and softening coefficient of HPG can be improved to 21.5 MPa and 0.66 with the content of 20% sulphoaluminate cement. The results show that adding excessive CH into HPG and combining with carbonation curing is an effective modification process with low costs, significant enhancement effects and low carbon emissions. The modified effects could be further enhanced by dispersing CH more uniformly, adding a crystal regulator of CaCO3 and adding other carbonatable alkaline substances.

4.3. Carbon Footprint and Energy Consumption of Carbonated HPG + CH Pastes

2 C a S O 4 · 0.5 H 2 O + C a O H 2 + C O 2 + 2 H 2 O 2 C a S O 4 · 2 H 2 O + C a C O 3
The carbonation process can be expressed by Equation (4). For the comprehensive assessment of the carbon footprint and energy consumption of HPG pastes, the normalized saturated conditions’ compressive strength carbon footprint Cs can be calculated by Equation (5), and the normalized saturated conditions’ compressive strength energy consumption (heat and electricity) Es can be calculated by Equation (6).
C s = i = 1 n N i · m i C C R C
E s = i = 1 n W i · m i R C
where N i (kgCO2/kg) and W i (MJ/kg) are the carbon emission and the energy consumption of the i-th raw material, as shown in Table 5; m i (kg·m−3) is the mass of raw material for HPG pastes based on unit volume; C C (kgCO2·m−3) is the carbon capture of HPG pastes based on unit volume calculated from TG analysis; R C (MPa) is the saturated conditions’ compressive strength.
The carbon footprint and energy consumption of carbonated HPG + CH pastes are shown in Table 6. CH-15 exhibited the lowest normalized saturated conditions compressive strength carbon footprint and smallest normalized saturated conditions compressive strength energy consumption at 110.76 kgCO2·m−3·MPa−1 and 1083.81 MJ·m−3·MPa−1, respectively. These findings highlight that the carbonation of the HPG pastes with 15 wt.% CH is an environmentally friendly option.
Furthermore, CH can be replaced with solid wastes, with CH as the main component (such as calcium carbide slag generated in the production of acetylene). Phosphoric acid plants can use an HPG and calcium carbide slag composite system combined with exhaust gas to prepare gypsum products, further reducing energy consumption and CO2 emissions, to achieve the treatment of waste and to yield cleaner gypsum products.

5. Conclusions

This study investigates the collaborative effects of calcium hydroxide (CH) addition and carbonation curing on the performance of hemihydrate phosphogypsum (HPG) pastes. The conclusions could be summarized as follows:
  • The addition of 5 wt.% to 20 wt.% CH could prolong the setting times and decrease the fluidities of the fresh HPG pastes, and the compressive strength and the softening coefficient of hardened HPG pastes were decreased by about 9–37% and 13%, respectively;
  • CaF2 and Ca3(PO4)2 could be identified in the HPG + CH pastes due to neutralization;
  • Carbonation curing could significantly recover the compressive strength and water resistance of the hardened HPG + CH pastes. The carbonated HPG + 15 wt.% CH paste demonstrated the best performance—compared with the reference paste under atmosphere, the compressive strength and softening coefficient increased by 16.2% and 37.1%, respectively;
  • A large number of nanoscale CaCO3 crystals were identified to fill the pores of the carbonated HPG + CH pastes and cover the surface of CaSO4·2H2O crystals. This refinement and coverage caused the improvement of compressive strength and water resistance;
  • The carbonated HPG + 15 wt.% CH paste is also an environmentally friendly option, exhibiting the lowest normalized saturated conditions compressive strength carbon footprint and energy consumption, with 13.3% and 6.2% reductions compared to pure HPG paste.

Author Contributions

J.H.: methodology, investigation, data curation and visualization, drafting the manuscript. Z.L.: conceptualization, funding acquisition, supervision, revising the manuscript critically. X.W. and X.D.: resources, project administration. J.Z. and Y.Z.: investigation. B.I. and S.G.: revising the manuscript. All authors have read and agreed to the published version of the manuscript.

Funding

This work was sponsored by the Graduate Innovation Project of Central South University (grant number 2022XQLH041), the Graduate Joint Training Base of Central South University-Geology Institute of China Chemical Geology and Mine Bureau (grant number DYKJ202205) and the Hunan Provincial Innovation Foundation for Postgraduate (grant number QL20230030).

Institutional Review Board Statement

Not applicable.

Informed Consent Statement

Not applicable.

Data Availability Statement

The data presented in this study are available on request from the corresponding author.

Conflicts of Interest

The authors declare that they have no known competing financial interests or personal relationships that could have appeared to influence the work reported in this paper.

References

  1. Al-Hwaiti, M.S. Influence of treated waste phosphogypsum materials on the properties of ordinary portland cement. Bangladesh J. Sci. Ind. Res. 2015, 50, 241–250. [Google Scholar] [CrossRef]
  2. Haneklaus, N.; Barbossa, S.; Basallote, M.D.; Bertau, M.; Bilal, E.; Chajduk, E.; Chernysh, Y.; Chubur, V.; Cruz, J.; Dziarczykowski, K.; et al. Closing the upcoming EU gypsum gap with phosphogypsum. Resour. Conserv. Recycl. 2022, 182, 106328. [Google Scholar] [CrossRef]
  3. Taher, M.A. Influence of thermally treated phosphogypsum on the properties of Portland slag cement. Resour. Conserv. Recycl. 2007, 52, 28–38. [Google Scholar] [CrossRef]
  4. Rashad, A.M. Phosphogypsum as a construction material. J. Clean Prod. 2017, 166, 732–743. [Google Scholar] [CrossRef]
  5. López, F.A.; Gázquez, M.; Alguacil, F.J.; Bolívar, J.P.; García-Díaz, I.; López-Coto, I. Microencapsulation of phosphogypsum into a sulfur polymer matrix: Physico-chemical and radiological characterization. J. Hazard. Mater. 2011, 192, 234–245. [Google Scholar] [CrossRef] [PubMed]
  6. Silva, M.V.; de Rezende, L.R.; Mascarenha, M.M.D.A.; de Oliveira, R.B. Phosphogypsum, tropical soil and cement mixtures for asphalt pavements under wet and dry environmental conditions. Resour. Conserv. Recycl. 2019, 144, 123–136. [Google Scholar] [CrossRef]
  7. Seraya, N.; Litvinov, V.; Daumova, G.; Zhusipov, N.; Idrisheva, Z.; Aubakirova, R. Production Waste Management: Qualitative and Quantitative Characteristics and the Calculation of the Hazard Class of Phosphogypsum. Processes 2023, 11, 3033. [Google Scholar] [CrossRef]
  8. Tayibi, H.; Choura, M.; López, F.A.; Alguacil, F.J.; López-Delgado, A. Environmental impact and management of phosphogypsum. J. Environ. Manag. 2009, 90, 2377–2386. [Google Scholar] [CrossRef] [PubMed]
  9. Pérez-López, R.; Álvarez-Valero, A.M.; Nieto, J.M. Changes in mobility of toxic elements during the production of phosphoric acid in the fertilizer industry of Huelva (SW Spain) and environmental impact of phosphogypsum wastes. J. Hazard. Mater. 2007, 148, 745–750. [Google Scholar] [CrossRef]
  10. Altun, İ.A.; Sert, Y. Utilization of weathered phosphogypsum as set retarder in Portland cement. Cem. Concr. Res. 2004, 34, 677–680. [Google Scholar] [CrossRef]
  11. Murali, G.; Azab, M. Recent research in utilization of phosphogypsum as building materials: Review. J. Mater. Res. Technol. 2023, 25, 960–987. [Google Scholar] [CrossRef]
  12. Garbaya, H.; Jraba, A.; Khadimallah, M.A.; Elaloui, E. The Development of a New Phosphogypsum-Based Construction Material: A Study of the Physicochemical, Mechanical and Thermal Characteristics. Materials 2021, 14, 7369. [Google Scholar] [CrossRef]
  13. Bumanis, G.; Zorica, J.; Bajare, D.; Korjakins, A. Technological properties of phosphogypsum binder obtained from fertilizer production waste. Energy Procedia 2018, 147, 301–308. [Google Scholar] [CrossRef]
  14. Singh, M. Effect of phosphatic and fluoride impurities of phosphogypsum on the properties of selenite plaster. Cem. Concr. Res. 2003, 33, 1363–1369. [Google Scholar] [CrossRef]
  15. Singh, M. Role of phosphogypsum impurities on strength and microstructure of selenite plaster. Constr. Build. Mater. 2005, 19, 480–486. [Google Scholar] [CrossRef]
  16. Doleželová, M.; Krejsová, J.; Scheinherrová, L.; Keppert, M.; Vimmrová, A. Investigation of environmentally friendly gypsum based composites with improved water resistance. J. Clean Prod. 2022, 370, 133278. [Google Scholar] [CrossRef]
  17. Chen, X.M. Study on the Hydration-Hardening Mechanism and Microstructure Regulation of Hemihydrate Phosphgypsum under Alkaline Condition. Ph.D. Thesis, Southeast University, Nanjing, China, 25 January 2021. [Google Scholar]
  18. Neto, J.S.A.; Bersch, J.D.; Silva, T.S.M.; Rodriguez, E.D.; Suzuki, S.; Kirchheim, A.P. Influence of phosphogypsum purification with lime on the properties of cementitious matrices with and without plasticizer. Constr. Build. Mater. 2021, 299, 11. [Google Scholar] [CrossRef]
  19. Chen, X.M.; Gao, J.M.; Zhao, Y.S. Investigation on the hydration of hemihydrate phosphogypsum after post treatment. Constr. Build. Mater. 2019, 229, 9. [Google Scholar] [CrossRef]
  20. Cui, Y.; Wang, H.; Wang, D.; Wang, Q. Effects of Ca(OH)2 on the early hydration, macro-performance and environmental risks of the calcined phosphogypsum. Constr. Build. Mater. 2022, 324, 126590. [Google Scholar] [CrossRef]
  21. Altiner, M. Use of Taguchi approach for synthesis of calcite particles from calcium carbide slag for CO2 fixation by accelerated mineral carbonation. Arab. J. Chem. 2019, 12, 531–540. [Google Scholar] [CrossRef]
  22. Hu, X.; He, P.; Shi, C. Carbonate binders: Historic developments and perspectives. Cem. Concr. Res. 2024, 175, 107352. [Google Scholar] [CrossRef]
  23. Chen, Q.; Ding, W.; Sun, H.; Peng, T.; Ma, G. Utilization of Phosphogypsum to Prepare High-Purity CaCO3 in the NH4Cl–NH4OH–CO2 System. ACS Sustain. Chem. Eng. 2020, 8, 11649–11657. [Google Scholar] [CrossRef]
  24. GB/T 9776-2022; Calcined Gypsum. General Administration of Market Regulation of the People’s Republic of China. Standardization Administration of the People’s Republic of China: Beijing, China, 2022.
  25. Campos, M.P.; Costa, L.J.P.; Nisti, M.B.; Mazzilli, B.P. Phosphogypsum recycling in the building materials industry: Assessment of the radon exhalation rate. J. Environ. Radioact. 2017, 172, 232–236. [Google Scholar] [CrossRef] [PubMed]
  26. GB/T 17669.3-1999; Gypsum Plasters-Determination of Mechanical Properties. General Administration of Quality Supervision, Inspection and Quarantine of the People’s Republic of China: Beijing, China, 1999.
  27. GB/T 17669.4-1999; Gypsum Plasters-Determination of Phycical Properties of Pure Paste. General Administration of Quality Supervision, Inspection and Quarantine of the People’s Republic of China: Beijing, China, 1999.
  28. Schofield, P.F.; Wilson, C.C.; Knight, K.S.; Stretton, I.C. Temperature related structural variation of the hydrous components in gypsum. Z. Krist.-Cryst. Mater. 2000, 215, 707–710. [Google Scholar] [CrossRef]
  29. Ikuta, D.; Kawame, N.; Banno, S.; Hirajima, T.; Ito, K.; Rakovan, J.F.; Downs, R.T.; Tamada, O. First in situ X-ray identification of coesite and retrograde quartz on a glass thin section of an ultrahigh-pressure metamorphic rock and their crystal structure details. Am. Miner. 2007, 92, 57–63. [Google Scholar] [CrossRef]
  30. Desgranges, L.; Grebille, D.; Calvarin, G.; Chevrier, G.; Floquet, N.; Niepce, J.-C. Hydrogen thermal motion in calcium hydroxide: Ca(OH)2. Acta Cryst. 1993, B49, 812–817. [Google Scholar] [CrossRef]
  31. Goergens, J.; Manninger, T.; Goetz-Neunhoeffer, F. In-situ XRD study of the temperature-dependent early hydration of calcium aluminate cement in a mix with calcite. Cem. Concr. Res. 2020, 136, 106160. [Google Scholar] [CrossRef]
  32. Hanawalt, J.D.; Rinn, H.W.; Frevel, L.K. Chemical Analysis by X-ray Diffraction: Classification and Use of X-ray Diffraction Patterns. Powder Diffr. 1986, 1, 2–14. [Google Scholar] [CrossRef]
  33. Batchelder, D.N.; Simmons, R.O. Lattice Constants and Thermal Expansivities of Silicon and of Calcium Fluoride between 6° and 322° K. J. Chem. Phys. 2004, 41, 2324–2329. [Google Scholar] [CrossRef]
  34. Barrett, E.P.; Joyner, L.G.; Halenda, P.P. The Determination of Pore Volume and Area Distributions in Porous Substances. I. Computations from Nitrogen Isotherms. J. Am. Chem. Soc. 1951, 73, 373–380. [Google Scholar] [CrossRef]
  35. Chen, S.; Yuan, H. Characterization and optimization of eco-friendly cementitious materials based on titanium gypsum, fly ash, and calcium carbide residue. Constr. Build. Mater. 2022, 349, 128635. [Google Scholar] [CrossRef]
  36. Fang, Y.; Chang, J. Microstructure changes of waste hydrated cement paste induced by accelerated carbonation. Constr. Build. Mater. 2015, 76, 360–365. [Google Scholar] [CrossRef]
  37. Rostami, V.; Shao, Y.X.; Boyd, A.J.; He, Z. Microstructure of cement paste subject to early carbonation curing. Cem. Concr. Res. 2012, 42, 186–193. [Google Scholar] [CrossRef]
  38. Panesar, D.K.; Mo, L.W. Properties of binary and ternary reactive MgO mortar blends subjected to CO2 curing. Cem. Concr. Compos. 2013, 38, 40–49. [Google Scholar] [CrossRef]
  39. Chen, X.M.; Gao, J.M.; Liu, C.B.; Zhao, Y.S. Effect of neutralization on the setting and hardening characters of hemihydrate phosphogypsum plaster. Constr. Build. Mater. 2018, 190, 53–64. [Google Scholar] [CrossRef]
  40. Liao, Y.; Wang, S.; Wang, K.; Qunaynah, S.A.; Wan, S.; Yuan, Z.; Xu, P.; Tang, S. A study on the hydration of calcium aluminate cement pastes containing silica fume using non-contact electrical resistivity measurement. J. Mater. Res. Technol. 2023, 24, 8135–8149. [Google Scholar] [CrossRef]
  41. Halamickova, P.; Detwiler, R.J.; Bentz, D.P.; Garboczi, E.J. Water permeability and chloride ion diffusion in portland cement mortars: Relationship to sand content and critical pore diameter. Cem. Concr. Res. 1995, 25, 790–802. [Google Scholar] [CrossRef]
  42. Sing, K.S.W. Reporting physisorption data for gas/solid systems with special reference to the determination of surface area and porosity (Recommendations 1984). Pure Appl. Chem. 1985, 57, 603–619. [Google Scholar] [CrossRef]
  43. Bogner, A.; Schatz, J.; Dehn, F.; Muller, H.S. Influence of Drying on the Microstructure of Hardened Cement Paste: A Mercury Intrusion Porosimetry, Nitrogen Sorption and SAXS Study. J. Adv. Concr. Technol. 2020, 18, 83–94. [Google Scholar] [CrossRef]
  44. Liao, Y.; Yao, J.; Deng, F.; Li, H.; Wang, K.; Tang, S. Hydration behavior and strength development of supersulfated cement prepared by calcined phosphogypsum and slaked lime. J. Build. Eng. 2023, 80, 108075. [Google Scholar] [CrossRef]
  45. Mo, L.W.; Panesar, D.K. Accelerated carbonation—A potential approach to sequester CO2 in cement paste containing slag and reactive MgO. Cem. Concr. Compos. 2013, 43, 69–77. [Google Scholar] [CrossRef]
  46. Zhao, F.; Liu, H.; Hao, L.X.; Li, Q. Water resistant block from desulfurization gypsum. Constr. Build. Mater. 2012, 27, 531–533. [Google Scholar] [CrossRef]
  47. Garg, M.; Minocha, A.K.; Jain, N. Environment hazard mitigation of waste gypsum and chalk: Use in construction materials. Constr. Build. Mater. 2011, 25, 944–949. [Google Scholar] [CrossRef]
  48. Fornés, I.V.; Vaičiukynienė, D.; Nizevičienė, D.; Doroševas, V. The improvement of the water-resistance of the phosphogypsum by adding waste metallurgical sludge. J. Build. Eng. 2021, 43, 102861. [Google Scholar] [CrossRef]
  49. Jin, Z.; Ma, B.; Su, Y.; Lu, W.; Qi, H.; Hu, P. Effect of calcium sulphoaluminate cement on mechanical strength and waterproof properties of beta-hemihydrate phosphogypsum. Constr. Build. Mater. 2020, 242, 118198. [Google Scholar] [CrossRef]
  50. Zheng, X.X.; Bai, H.D.; Feng, S.S.; Cui, R.Z.; Wang, C.; Gao, Y.F. Carbon emission status of phosphate and compound fertilizer industry and low carbon green development path. Phosphate Compd. Fertil. 2022, 37, 1–7. [Google Scholar]
  51. Smith, P.; Martino, D.L.; Cai, Z.C.; Gwary, D.; Janzen, H.H.; Kumar, P.; McCarl, B.A.; Ogle, S.M.; O’Mara, F.P.; Rice, C.W.; et al. Greenhouse gas mitigation in agriculture. Philos. Trans. R. Soc. B-Biol. Sci. 2008, 363, 789–813. [Google Scholar] [CrossRef]
  52. Hammond, G.; Jones, C. Inventory of Carbon and Energy, 2nd ed.; University of Bath: Bath, UK, 2011. [Google Scholar]
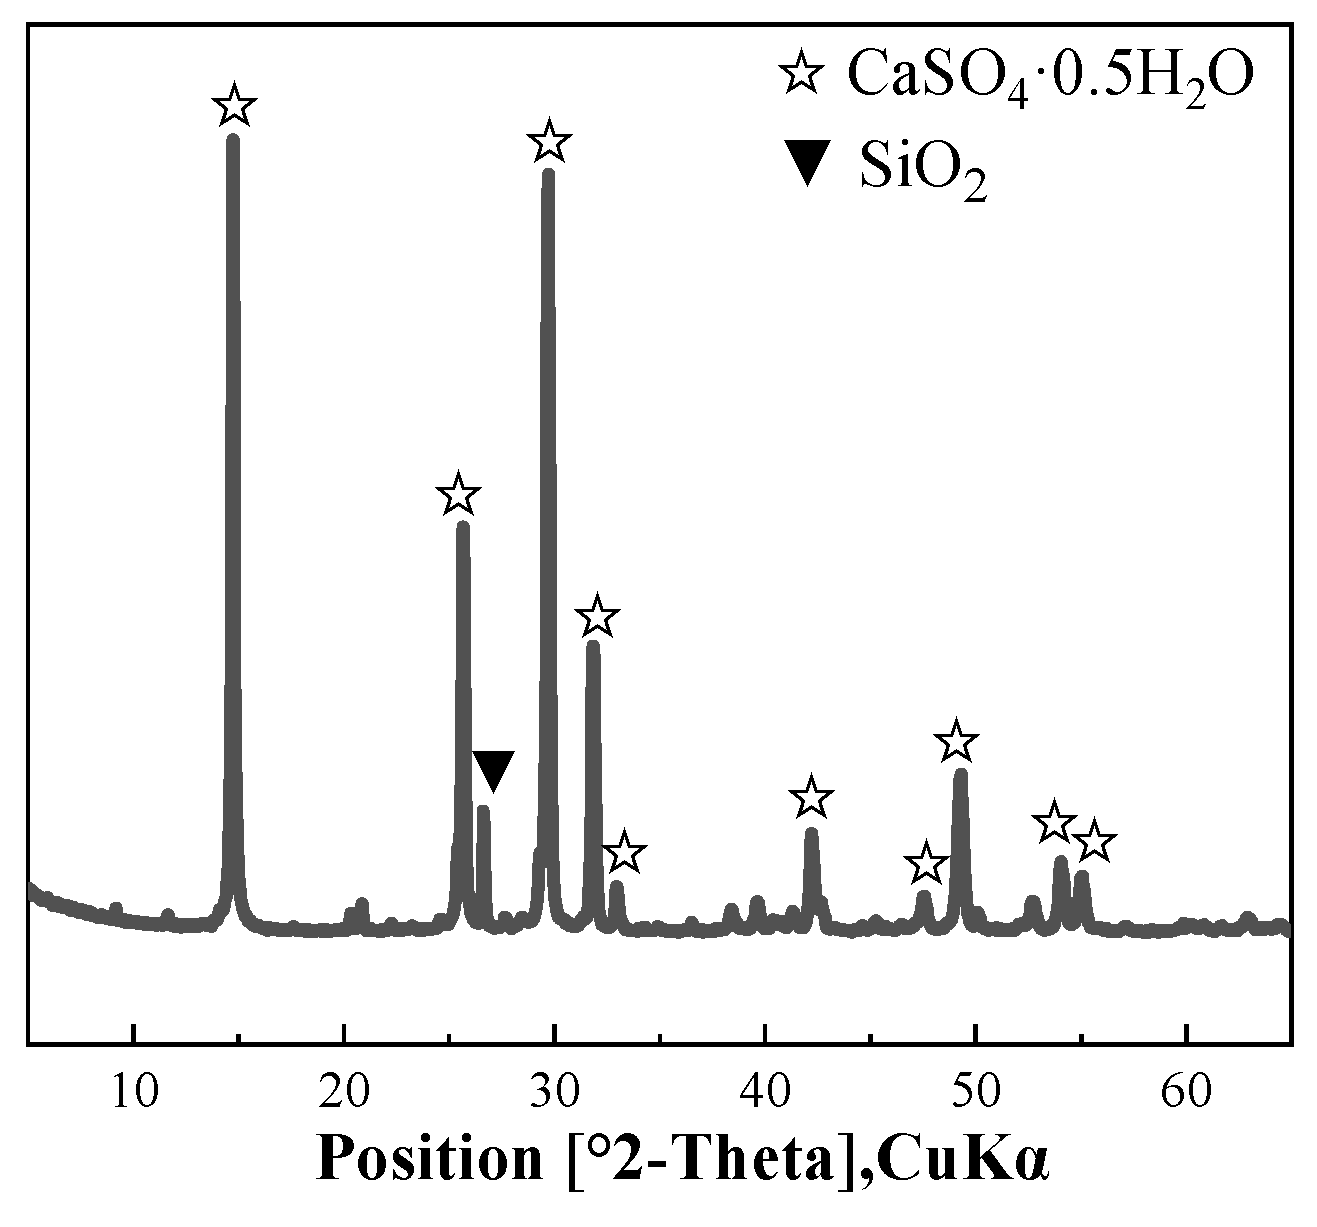
Figure 1. XRD pattern of HPG.
Materials 17 02204 g001
Figure 2. TG/DTG curves of HPG.
Materials 17 02204 g002
Figure 3. Differential and cumulative particle size distribution curves of the raw material (tested during the dispersion of ethanol).
Materials 17 02204 g003
Figure 4. Particle morphology and SEM image of HPG.
Materials 17 02204 g004
Figure 5. Effect of CH addition on the setting time and the fluidity of HPG paste.
Materials 17 02204 g005
Figure 6. Effects of CH addition and carbonation on the compressive strength of HPG paste. (a) dry conditions, (b) saturated conditions.
Materials 17 02204 g006
Figure 7. Effects of CH addition and carbonation on the softening coefficient and the water absorption rate of HPG pastes.
Materials 17 02204 g007
Figure 8. Fresh split surfaces of specimens sprayed with a 1 wt.% phenolphthalein indicator ethanol solution: (a) atmosphere-cured specimens; (b) carbonation-cured specimens.
Materials 17 02204 g008
Figure 9. The XRD patterns of pastes: (a) atmosphere-cured specimens, (b) carbonation-cured specimens.
Materials 17 02204 g009
Figure 10. The TG/DTG curves of pastes: (a) atmosphere-cured specimens; (b) carbonation-cured specimens.
Materials 17 02204 g010
Figure 11. The SEM-EDS analysis of HPG pastes.
Materials 17 02204 g011aMaterials 17 02204 g011bMaterials 17 02204 g011c
Figure 12. Pore size distributions of HPG pastes: (a) pore (>100 nm) distributions analyzed by MIP; (b) pore (<100 nm) distributions analyzed by N2 physisorption.
Materials 17 02204 g012
Figure 13. Compressive strength impact factor.
Materials 17 02204 g013
Figure 14. The growth rate of compressive strength and softening coefficient of carbonation-cured specimens compared to atmosphere-cured specimens.
Materials 17 02204 g014
Table 1. The physical and mechanical properties of HPG.
RadionuclideInitial Setting Time (min)Final Setting Time (min)2 h Flexural Strength (MPa)2 h Compressive Strength (MPa)
Test resultsIRa = 0.3, Ic = 0.37163.38.7
Table 2. Chemical composition of raw material (wt.%).
CompositionSO3CaOSiO2FP2O5Al2O3Fe2O3Na2OTiO2K2OSrOBaO
HPG46.6935.965.5981.81.030.7550.360.0850.07420.07290.07280.071
CH0.29282.560.98-0.010.4080.239-0.0220.08070.0211-
Table 3. Mix proportion of paste mixtures (wt.%).
Mixtures NotationHPGCa (OH)2Retarder XK (By Mass of HPG)Water to Powder Ratio
CH-010000.010.58
CH-5955
CH-109010
CH-158515
CH-208020
Table 4. PDF code and ICSD collection code used for qualitative analysis of the diffraction patterns.
Compound NameChemical FormulaPDF CodeICSD Collection CodeAuthor [Ref.]
GypsumCaSO4·2H2O00-033-031192567Schofield [28]
QuartzSiO2 156196Ikuta [29]
PortlanditeCa(OH)200-004-073373467Desgranges [30]
CalciteCaCO300-005-058680869Goergens [31]
Calcium PhosphateCa3(PO4)2 10941Hanawalt [32]
Calcium FluorideCaF201-077-209660371Batchelder [33]
Table 5. Carbon footprint factors.
Raw MaterialsCO2 Emission (kgCO2/kg)[Ref.]Energy Consumption (MJ/kg)[Ref.]
HPGFormation of PG0.18[50]1.0[51]
Calcination of PG0.13[52]1.8[52]
CH0.78[52]5.3[52]
Table 6. Carbon footprint and energy consumption of carbonated HPG + CH pastes based on unit volume.
HPG PastesCO2 Emission (kgCO2·m−3)CO2 Capture C C (kgCO2·m−3) C s (kgCO2·m −3·MPa−1)Energy Consumption (MJ·m−3) E s (MJ·m−3 ·MPa−1)
N H P G · m H P G N C H · m C H W H P G · m H P G W C H · m C H
CH-01174.610.000.00127.6810,609.380.001153.19
CH-51115.88147.7754.89159.0510,078.911004.101458.29
CH-101057.15295.55124.41136.489548.442008.201284.07
CH-15998.42443.32213.34110.769017.973012.301083.81
CH-20939.69591.09296.47128.578487.504016.411302.49
Disclaimer/Publisher’s Note: The statements, opinions and data contained in all publications are solely those of the individual author(s) and contributor(s) and not of MDPI and/or the editor(s). MDPI and/or the editor(s) disclaim responsibility for any injury to people or property resulting from any ideas, methods, instructions or products referred to in the content.