
Comparison of Physicochemical, Antioxidant, and Cytotoxic Properties of Caffeic Acid Conjugates

 , , , , and
Abstract
:1. Introduction
- (1)
- How does the electronic charge distribution within the caffeic acid moiety change after it creates the selected conjugates?
- (2)
- How do these structural changes affect the activity of caffeic acid and its derivatives?
2. Materials and Methods
2.1. Materials
2.2. Theoretical Studies
2.3. Spectroscopic Studies
2.4. Antioxidant Assays
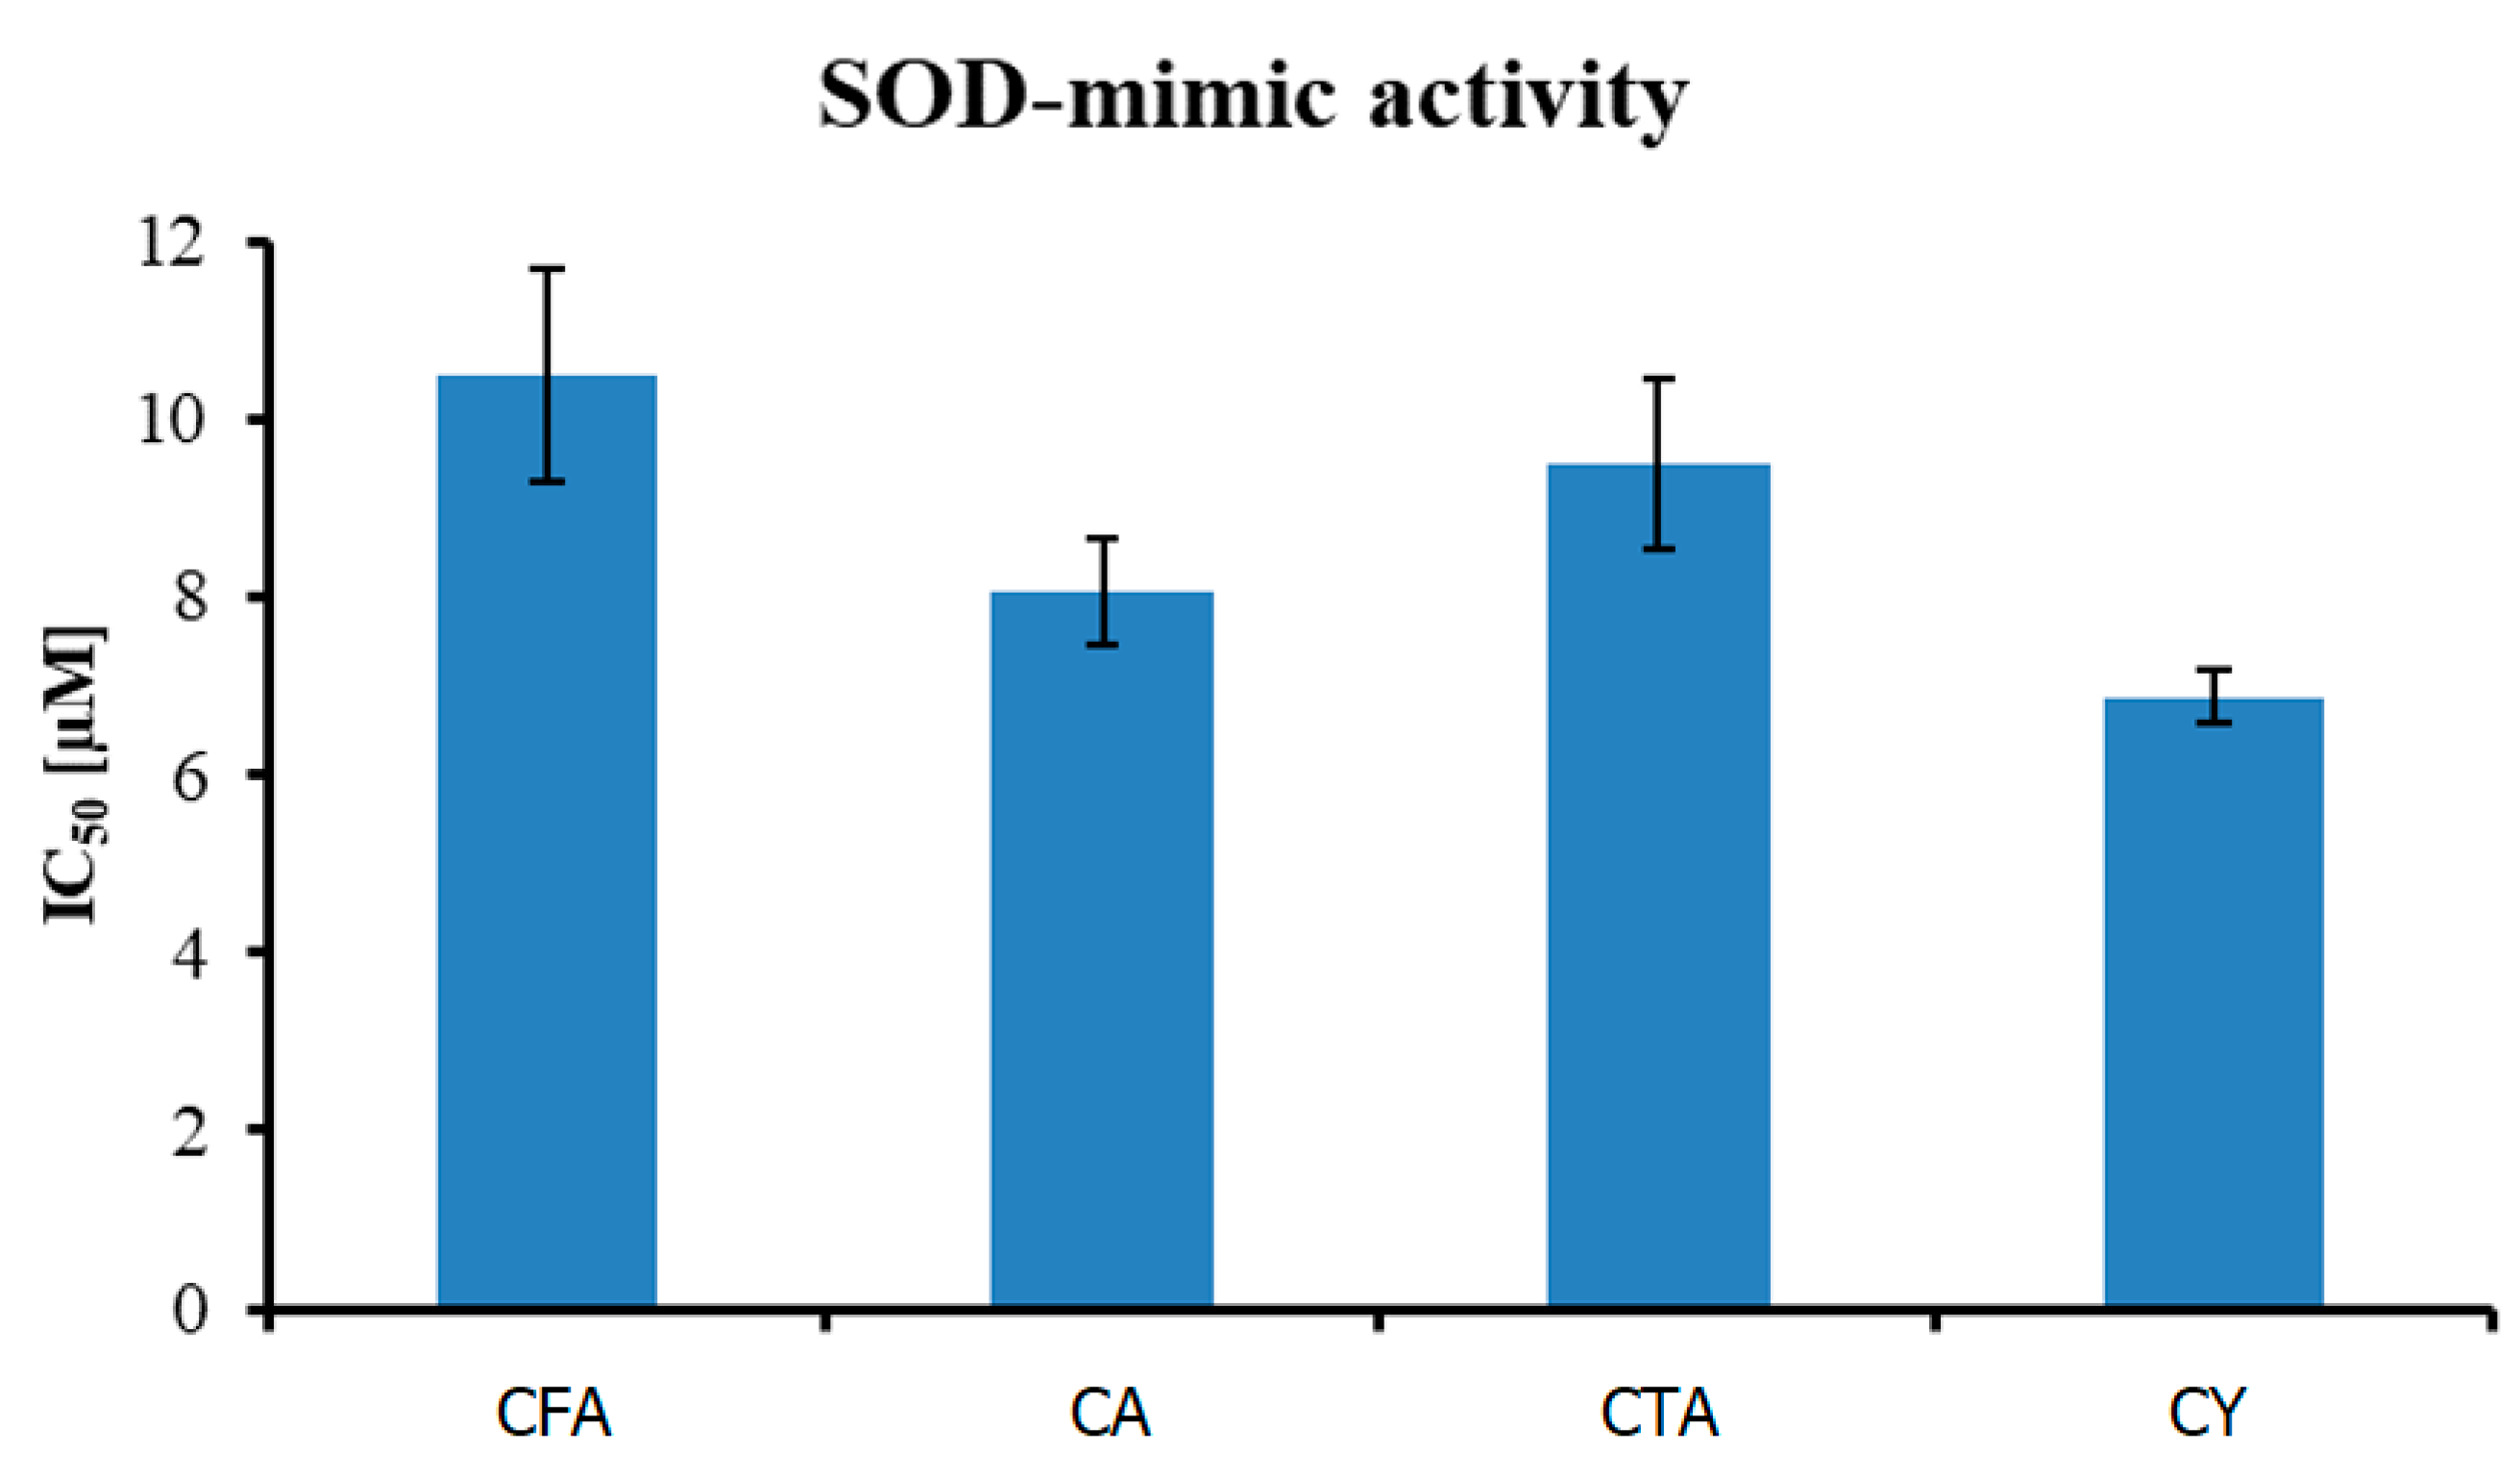
2.4.1. SOD Activity
2.4.2. HO• Radical Inhibition Activity
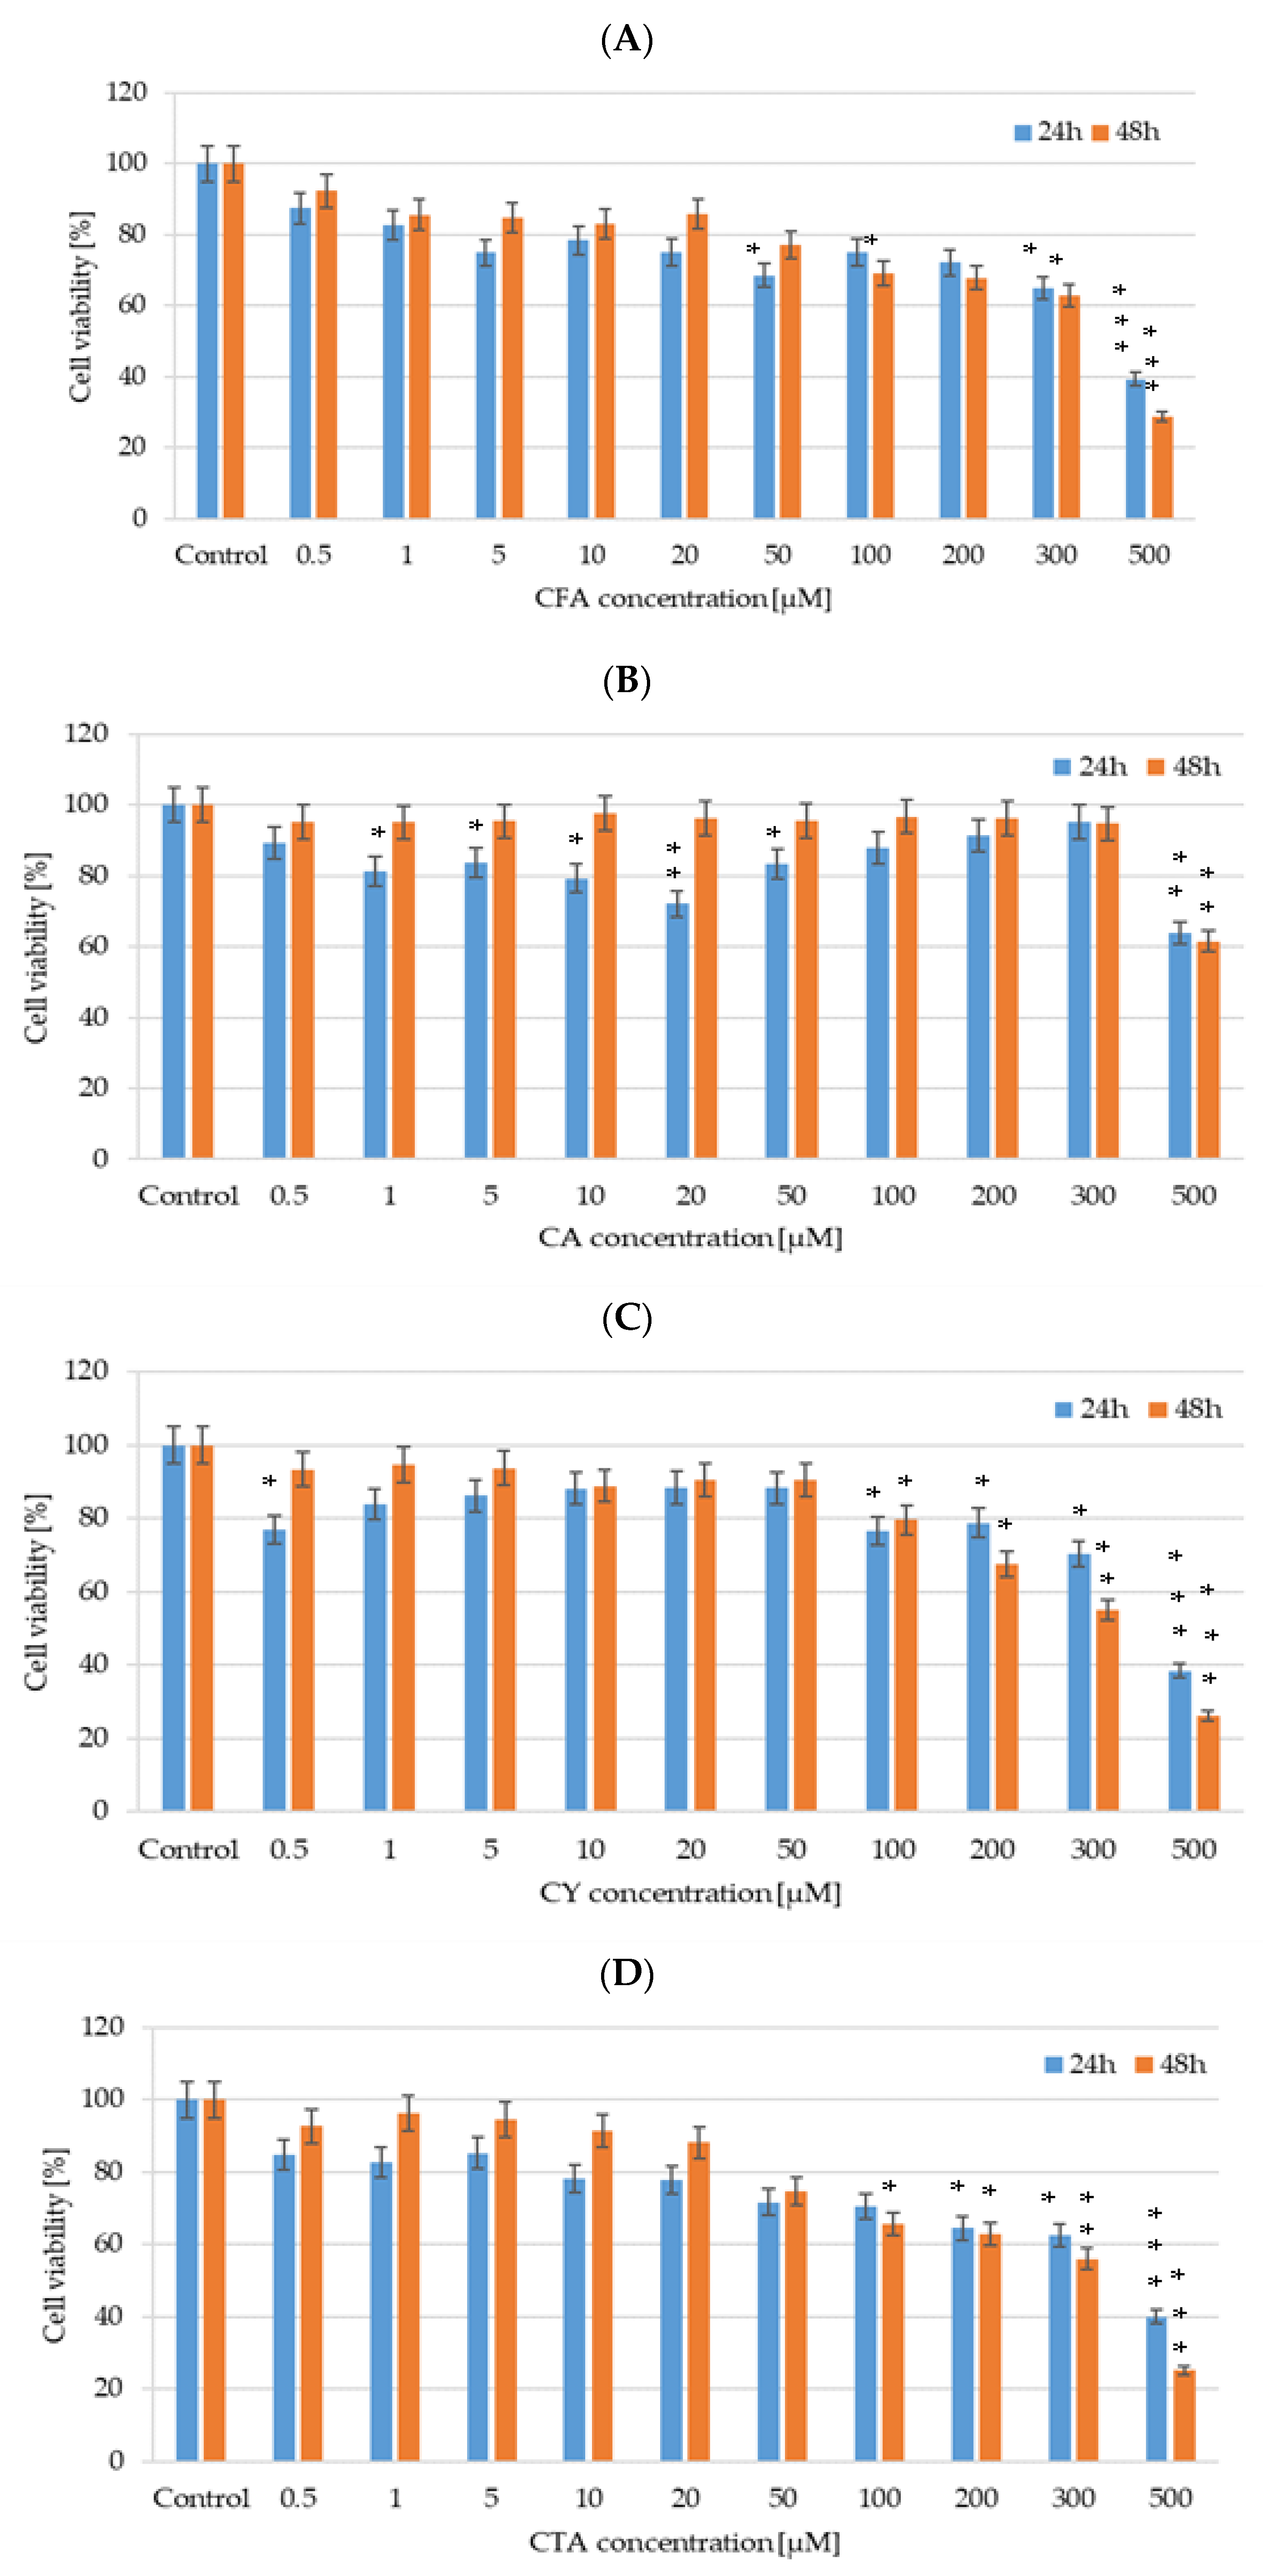
2.5. Cytotoxic Study
2.5.1. Chemical Treatment of Cells
2.5.2. Cichoric Acid, Caftaric Acid, Caffeic Acid, and Cynarin Cytotoxicity
2.5.3. Statistical Analysis
3. Results
3.1. Theoretical Calculations
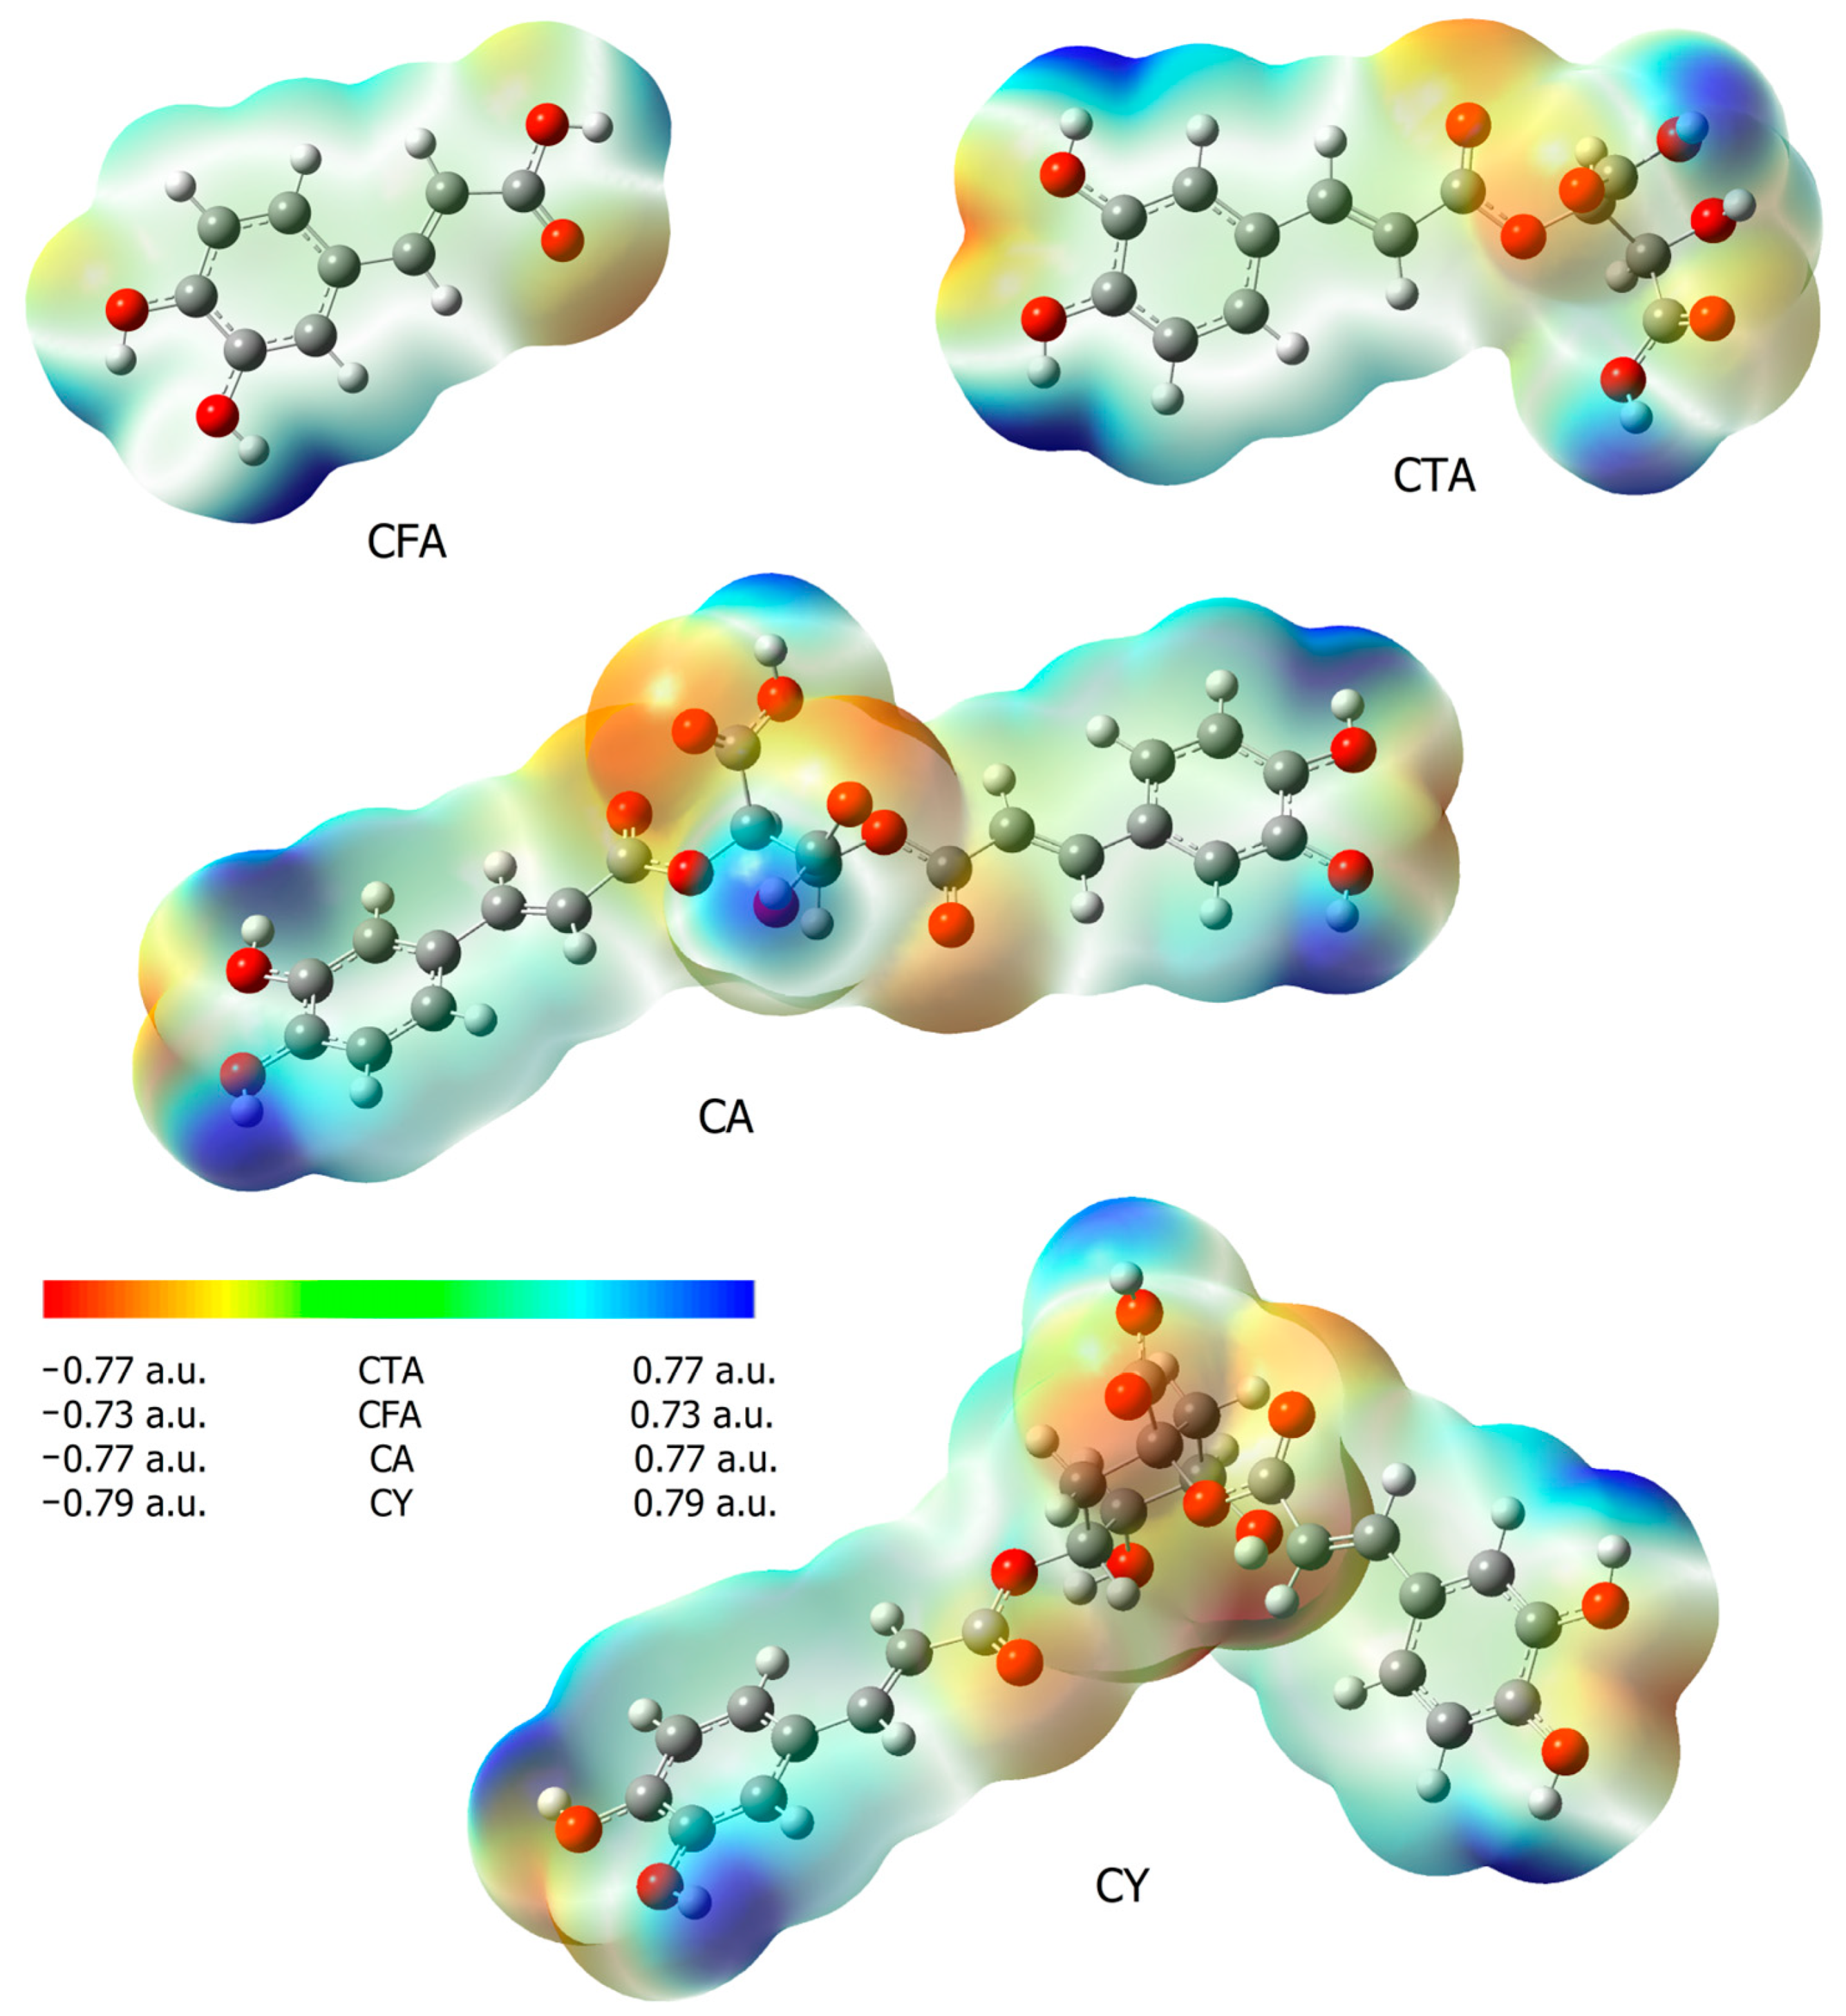
3.2. NBO and ESP
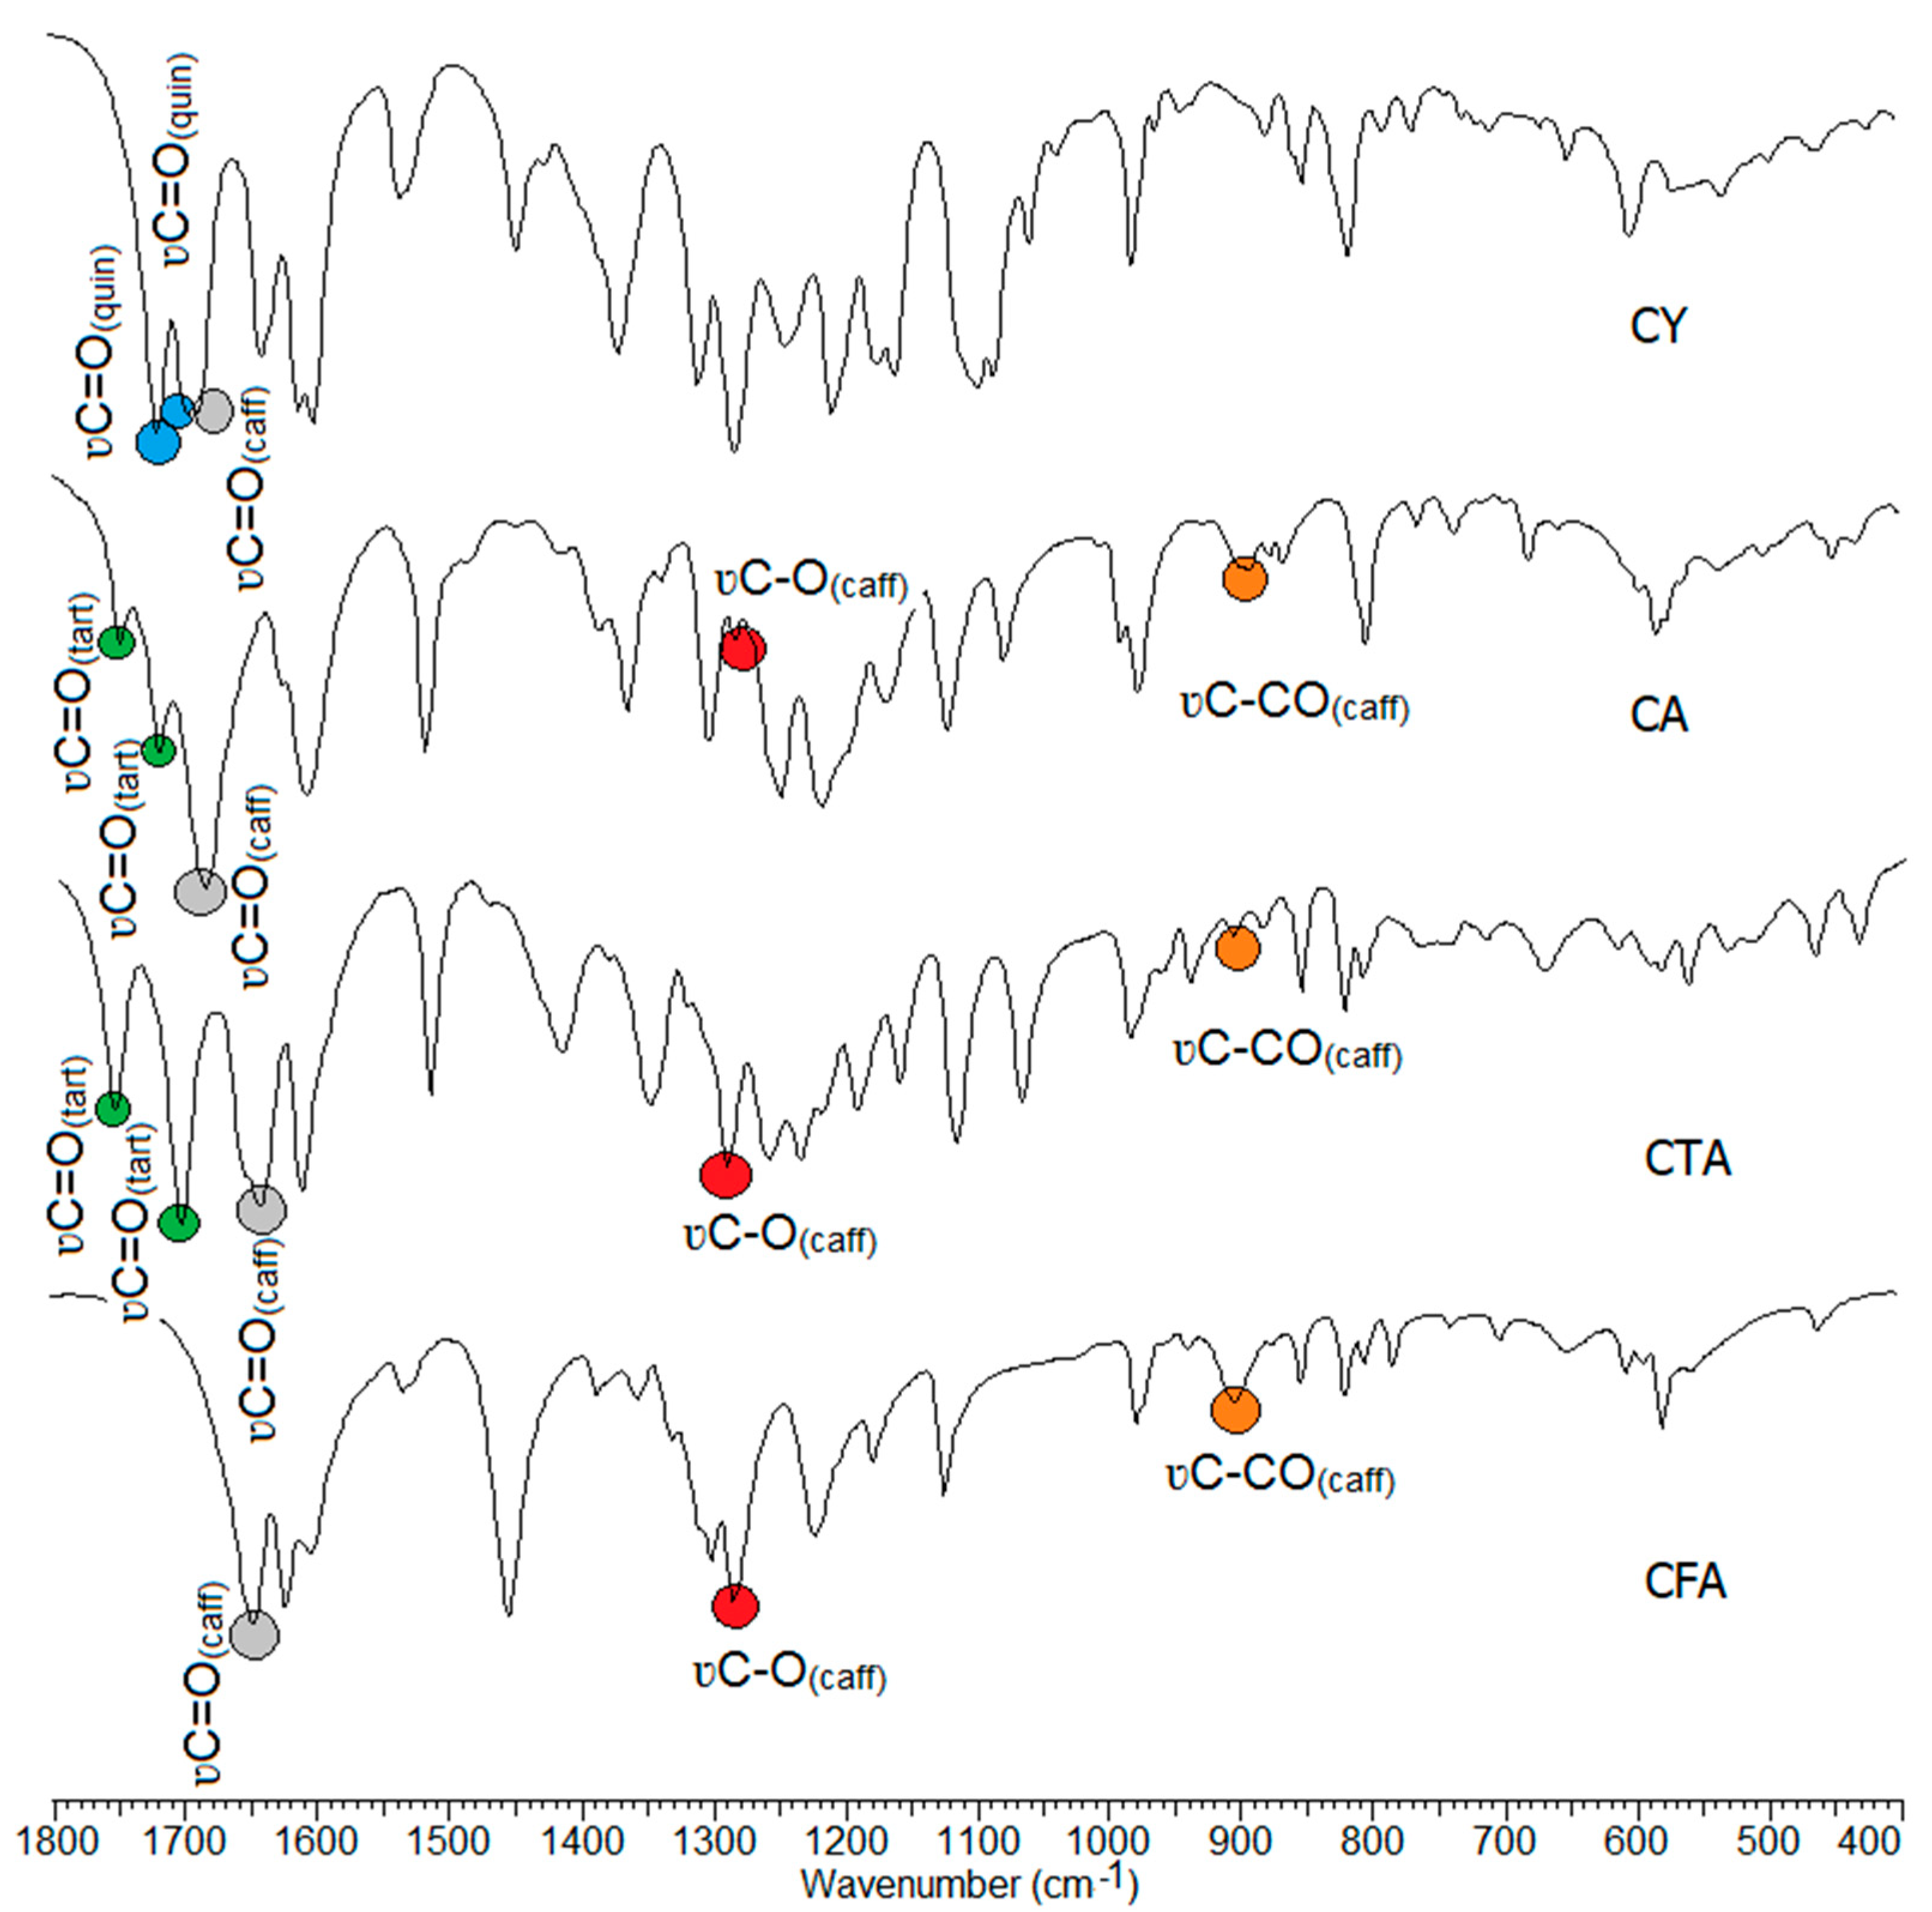
3.3. IR and Raman Spectra
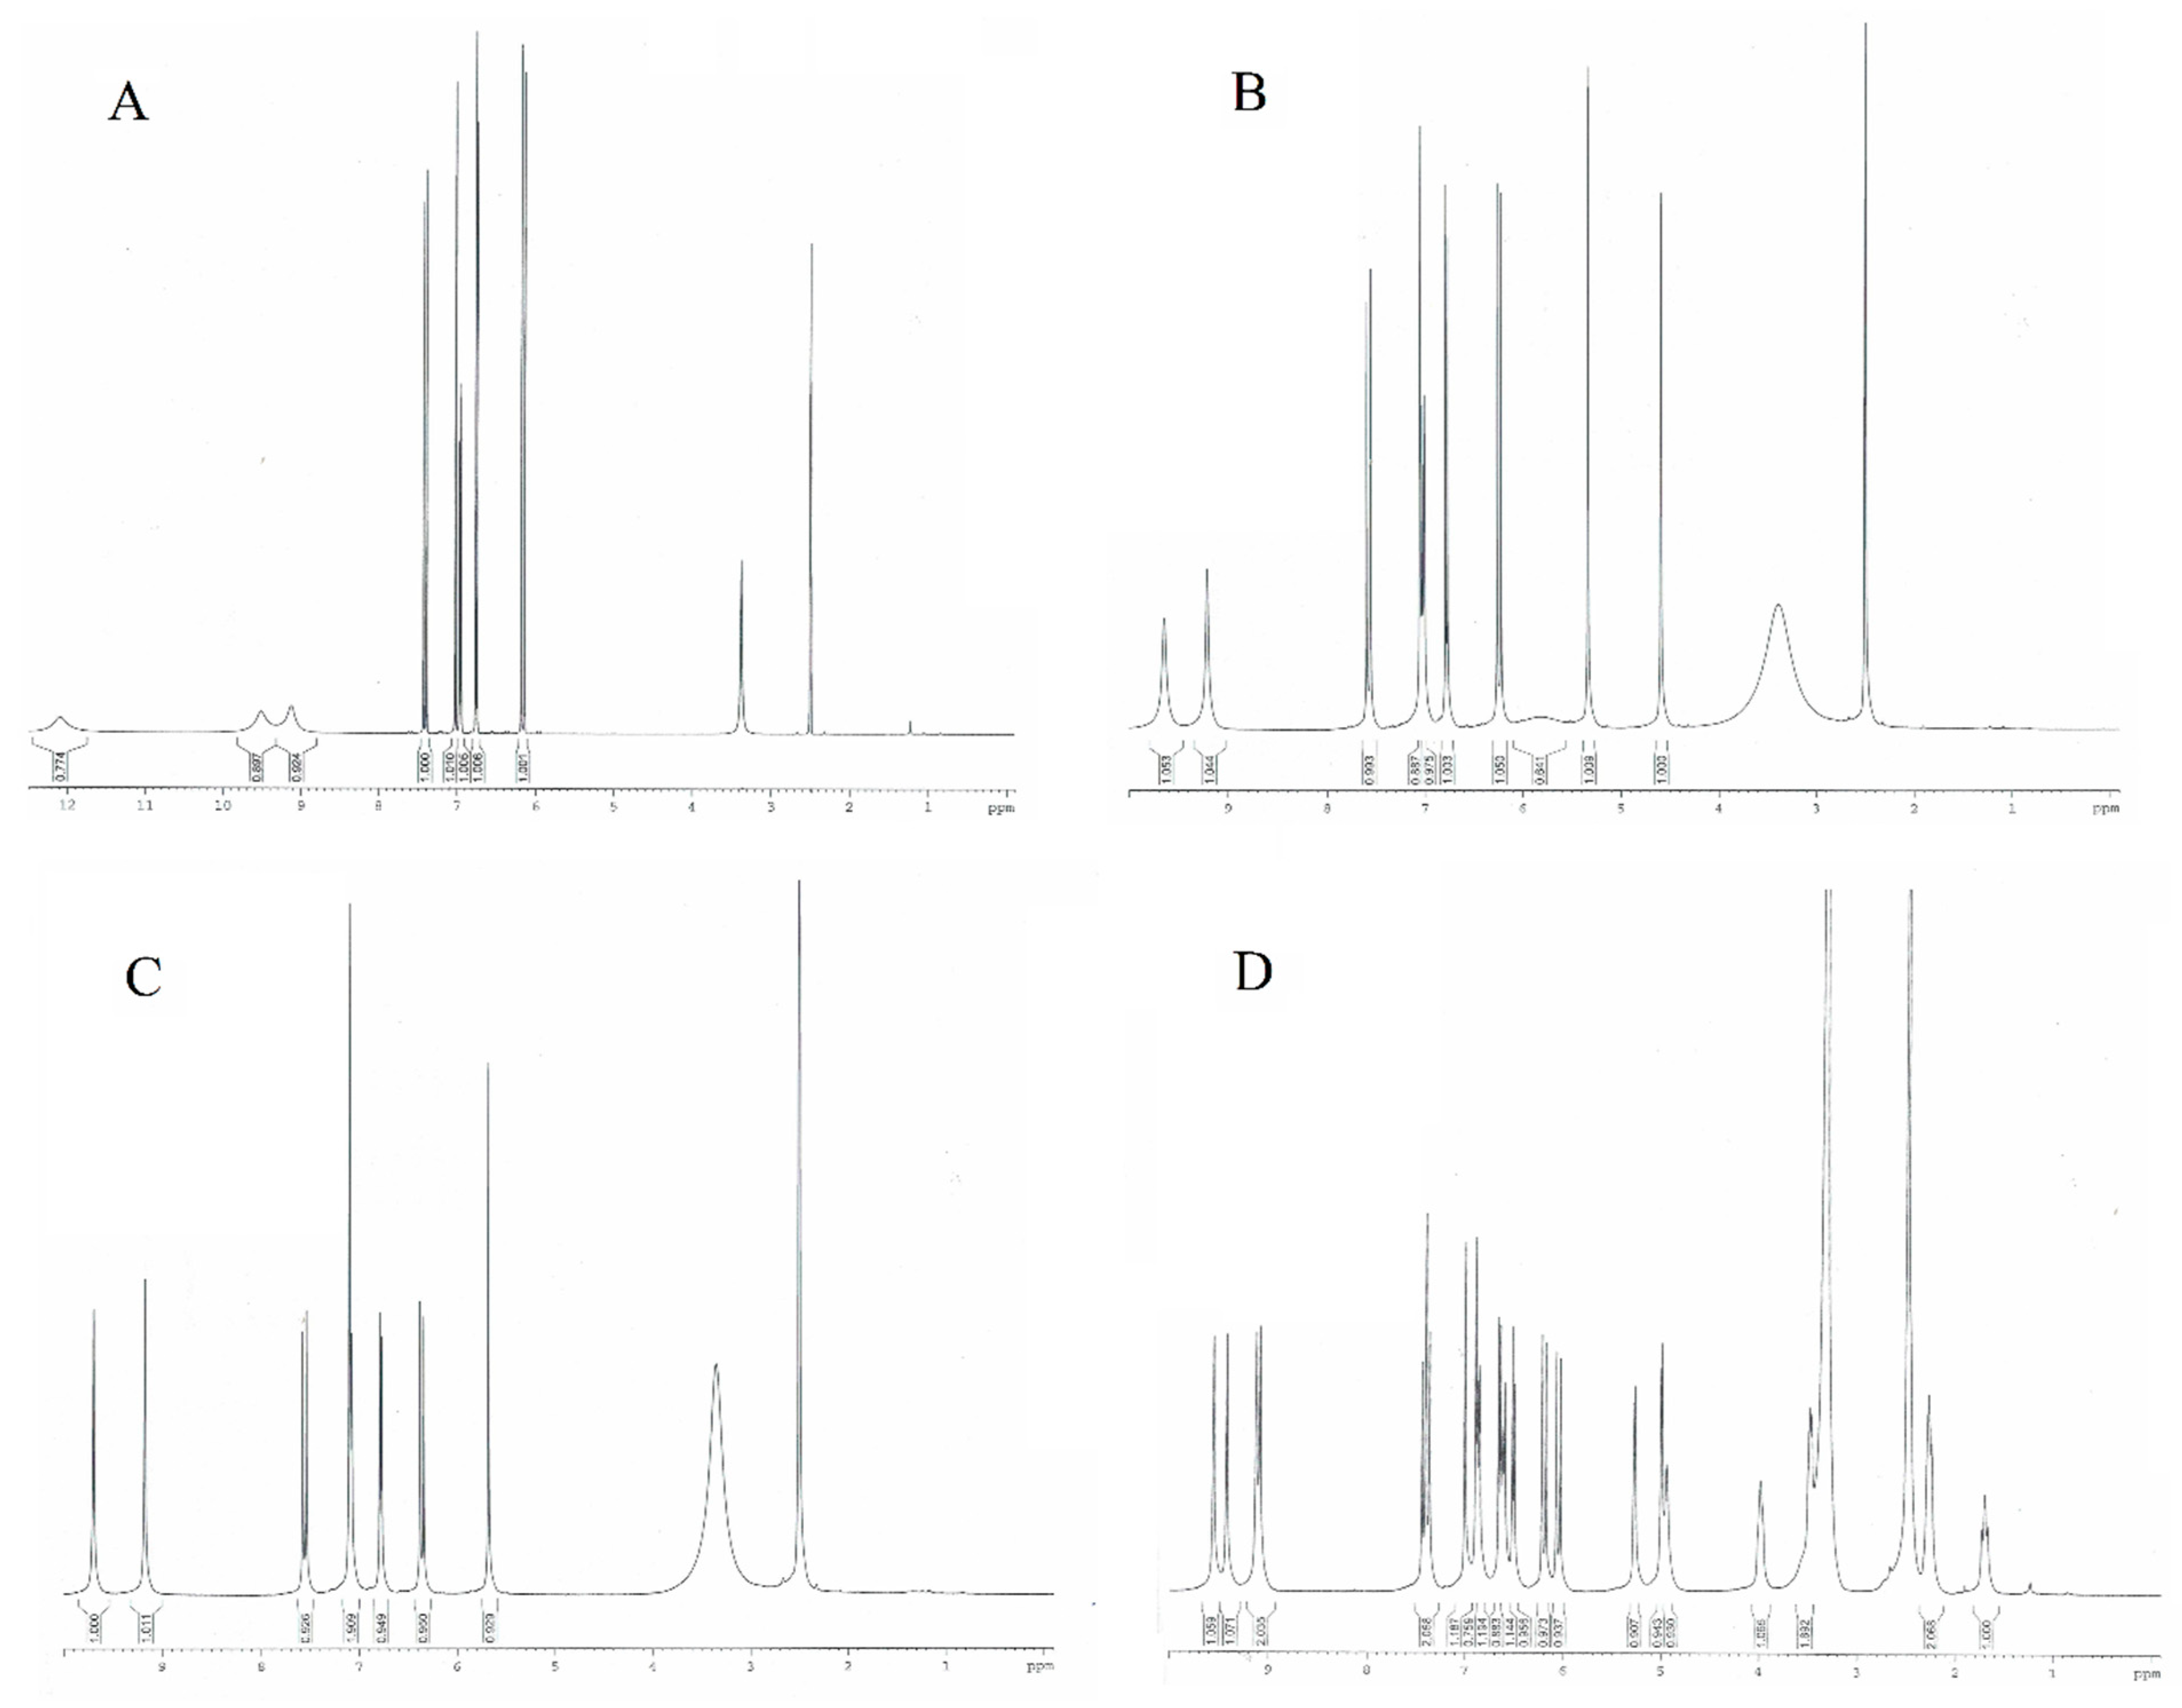
3.4. NMR Spectra
3.5. UV-VIS Spectra
3.6. Antioxidant Activity
3.7. Cytotoxicity
4. Conclusions
Author Contributions
Funding
Institutional Review Board Statement
Informed Consent Statement
Data Availability Statement
Conflicts of Interest
References
- Monteiro Espíndola, K.M.; Ferreira, R.G.; Mosquera Narvaez, L.E.; Rocha Silva Rosario, A.C.; Machado Da Silva, A.H.; Bispo Silva, A.G.; Oliveira Vieira, A.P.; Chagas Monteiro, M. Chemical and pharmacological aspects of caffeic acid and its activity in hepatocarcinoma. Front. Oncol. 2019, 9, 541. [Google Scholar] [CrossRef] [PubMed]
- Hsieh, C.Y.; Huang, Y.H.; Yeh, H.H.; Hong, P.Y.; Hsiao, C.J.; Hsieh, L.S. Phenylalanine, Tyrosine, and DOPA Are bona fide Substrates for Bambusa oldhamii BoPAL4. Catalysts 2021, 11, 1263. [Google Scholar] [CrossRef]
- Nia, N.N.; Hadjmohammadi, M.R. Amino acids- based hydrophobic natural deep eutectic solvents as a green acceptor phase in two-phase hollow fiber-liquid microextraction for the determination of caffeic acid in coffee, green tea, and tomato samples. Microchem. J. 2021, 164, 106021. [Google Scholar] [CrossRef]
- Singh, B.; Singh, J.; Singh, J.P.; Kaur, A.; Singh, N. Phenolic compounds in potato (Solanum tuberosum L.) peel and their health-promoting activities. Int. J. Food Sci. Technol. 2020, 55, 2273–2281. [Google Scholar] [CrossRef]
- El-Seedi, H.R.; El-Said, A.M.A.; Khalifa, S.A.M.; Göransson, U.; Bohlin, L.; Borg-Karlson, A.K.; Verpoorte, R. Biosynthesis, Natural Sources, Dietary Intake, Pharmacokinetic Properties, and Biological Activities of Hydroxycinnamic Acids. J. Agric. Food Chem. 2012, 60, 10877–10895. [Google Scholar] [CrossRef]
- Meinhart, A.D.; Damin, F.M.; Caldeirão, L.; de Jesus Filho, M.; da Silva, L.C.; da Silva Constant, L.; Teixeira Filho, J.; Wagner, R.; Teixeira Godoy, H. Study of new sources of six chlorogenic acids and caffeic acid. J. Food Compos. Anal. 2019, 82, 103244. [Google Scholar] [CrossRef]
- Phenol-Explorer, Database of Polyphenol Content in Foods, Version 3.6. Available online: http://phenol-explorer.eu/contents/polyphenol/457 (accessed on 4 February 2022).
- Riaz, U.; Kharal, M.A.; Murtaza, G.; Zaman, Q. Prospective Roles and Mechanisms of Caffeic Acid in Counter Plant Stress: A Mini Review. Artic. Pak. J. Agric. Res. 2018, 32, 8–19. [Google Scholar] [CrossRef]
- Kalinowska, M.; Gołębiewska, E.; Świderski, G.; Męczyńska-Wielgosz, S.; Lewandowska, H.; Pietryczuk, A.; Cudowski, A.; Astel, A.; Świsłocka, R.; Samsonowicz, M.; et al. Plant-Derived and Dietary Hydroxybenzoic Acids—A Comprehensive Study of Structural, Anti-/Pro-Oxidant, Lipophilic, Antimicrobial, and Cytotoxic Activity in MDA-MB-231 and MCF-7 Cell Lines. Nutrients 2021, 13, 3107. [Google Scholar] [CrossRef]
- Choudhary, S.; Mourya, A.; Ahuja, S.; Sah, S.P.; Kumar, A. Plausible anti-inflammatory mechanism of resveratrol and caffeic acid against chronic stress-induced insulin resistance in mice. Inflammopharmacology 2016, 24, 347–361. [Google Scholar] [CrossRef]
- Paciello, F.; Di Pino, A.; Rolesi, R.; Troiani, D.; Paludetti, G.; Grassi, C.; Fetoni, A.R. Anti-oxidant and anti-inflammatory effects of caffeic acid: In vivo evidences in a model of noise-induced hearing loss. Food Chem. Toxicol. 2020, 143, 111555. [Google Scholar] [CrossRef]
- Zielińska, D.; Zieliński, H.; Laparra-Llopis, J.M.; Szawara-Nowak, D.; Honke, J.; Giménez-Bastida, J.A. Caffeic Acid Modulates Processes Associated with Intestinal Inflammation. Nutrients 2021, 13, 554. [Google Scholar] [CrossRef] [PubMed]
- Kanimozhi, G.; Prasad, N.R. Anticancer Effect of Caffeic Acid on Human Cervical Cancer Cells. In Coffee in Health and Disease Prevention; Elsevier: Amsterdam, The Netherlands, 2015; pp. 655–661. [Google Scholar]
- Kabala-Dzik, A.; Rzepecka-Stojko, A.; Kubina, R.; Jastrzȩbska-Stojko, Ż.; Stojko, R.; Wojtyczka, R.D.; Stojko, J. Migration Rate Inhibition of Breast Cancer Cells Treated by Caffeic Acid and Caffeic Acid Phenethyl Ester: An In Vitro Comparison Study. Nutrients 2017, 9, 1144. [Google Scholar] [CrossRef] [PubMed]
- Rezaei-Seresht, H.; Cheshomi, H.; Falanji, F.; Movahedi-Motlagh, F.; Hashemian, M.; Mireskandari, E. Cytotoxic activity of caffeic acid and gallic acid against MCF-7 human breast cancer cells: An in silico and in vitro study. Avicenna J. Phytomed. 2019, 9, 574–586. [Google Scholar] [PubMed]
- Lima, V.N.; Oliveira-Tintino, C.D.M.; Santos, E.S.; Morais, L.P.; Tintino, S.R.; Freitas, T.S.; Geraldo, Y.S.; Pereira, R.L.S.; Cruz, R.P.; Menezes, I.R.A.; et al. Antimicrobial and enhancement of the antibiotic activity by phenolic compounds: Gallic acid, caffeic acid and pyrogallol. Microb. Pathog. 2016, 99, 56–61. [Google Scholar] [CrossRef] [PubMed]
- Kȩpa, M.; Miklasińska-Majdanik, M.; Wojtyczka, R.D.; Idzik, D.; Korzeniowski, K.; Smoleń-Dzirba, J.; Wasik, T.J. Antimicrobial potential of caffeic acid against staphylococcus aureus clinical strains. BioMed Res. Int. 2018, 2018, 7413504. [Google Scholar] [CrossRef] [PubMed]
- Khan, F.; Bamunuarachchi, N.I.; Tabassum, N.; Kim, Y.M. Caffeic Acid and Its Derivatives: Antimicrobial Drugs toward Microbial Pathogens. J. Agric. Food Chem. 2021, 69, 2979–3004. [Google Scholar] [CrossRef] [PubMed]
- Wu, Z.M.; Yu, Z.J.; Cui, Z.Q.; Peng, L.Y.; Li, H.R.; Zhang, C.L.; Shen, H.Q.; Yi, P.F.; Fu, B.D. In vitro antiviral efficacy of caffeic acid against canine distemper virus. Microb. Pathog. 2017, 110, 240–244. [Google Scholar] [CrossRef] [PubMed]
- Shen, J.; Wang, G.; Zuo, J. Caffeic acid inhibits HCV replication via induction of IFNα antiviral response through p62-mediated Keap1/Nrf2 signaling pathway. Antivir. Res. 2018, 154, 166–173. [Google Scholar] [CrossRef] [PubMed]
- Matboli, M.; Eissa, S.; Ibrahim, D.; Hegazy, M.G.A.; Imam, S.S.; Habib, E.K. Caffeic Acid Attenuates Diabetic Kidney Disease via Modulation of Autophagy in a High-Fat Diet/Streptozotocin- Induced Diabetic Rat. Sci. Rep. 2017, 7, 2263. [Google Scholar] [CrossRef] [PubMed]
- Xu, W.; Luo, Q.; Wen, X.; Xiao, M.; Mei, Q. Antioxidant and anti-diabetic effects of caffeic acid in a rat model of diabetes. Trop. J. Pharm. Res. 2020, 19, 1227–1232. [Google Scholar] [CrossRef]
- Yang, S.Y.; Hong, C.O.; Lee, G.P.; Kim, C.T.; Lee, K.W. The hepatoprotection of caffeic acid and rosmarinic acid, major compounds of Perilla frutescens, against t-BHP-induced oxidative liver damage. Food Chem. Toxicol. 2013, 55, 92–99. [Google Scholar] [CrossRef] [PubMed]
- Bispo, V.S.; Dantas, L.S.; Chaves Filho, A.B.; Pinto, I.F.D.; da Silva, R.P.; Otsuka, F.A.M.; Santos, R.B.; Santos, A.C.; Trindade, D.J.; Matos, H.R. Reduction of the DNA damages, Hepatoprotective Effect and Antioxidant Potential of the Coconut Water, ascorbic and Caffeic Acids in Oxidative Stress Mediated by Ethanol. An. Acad. Bras. Cienc. 2017, 89, 1095–1109. [Google Scholar] [CrossRef] [PubMed]
- Shokouh, P.; Jeppesen, P.B.; Hermansen, K.; Nørskov, N.P.; Laustsen, C.; Hamilton-Dutoit, S.J.; Qi, H.; Stødkilde-Jørgensen, H.; Gregersen, S. A Combination of Coffee Compounds Shows Insulin-Sensitizing and Hepatoprotective Effects in a Rat Model of Diet-Induced Metabolic Syndrome. Nutrients 2018, 10, 6. [Google Scholar] [CrossRef] [PubMed]
- Agunloye, O.M.; Oboh, G.; Ademiluyi, A.O.; Ademosun, A.O.; Akindahunsi, A.A.; Oyagbemi, A.A.; Omobowale, T.O.; Ajibade, T.O.; Adedapo, A.A. Cardio-protective and antioxidant properties of caffeic acid and chlorogenic acid: Mechanistic role of angiotensin converting enzyme, cholinesterase and arginase activities in cyclosporine induced hypertensive rats. Biomed. Pharmacother. 2019, 109, 450–458. [Google Scholar] [CrossRef] [PubMed]
- Silva, H.; Lopes, N.M.F. Cardiovascular Effects of Caffeic Acid and Its Derivatives: A Comprehensive Review. Front. Physiol. 2020, 11, 595516. [Google Scholar] [CrossRef] [PubMed]
- Medina, I.; Undeland, I.; Larsson, K.; Storrø, I.; Rustad, T.; Jacobsen, C.; Kristinová, V.; Gallardo, J.M. Activity of caffeic acid in different fish lipid matrices: A review. Food Chem. 2012, 131, 730–740. [Google Scholar] [CrossRef]
- Lobo, V.; Patil, A.; Phatak, A.; Chandra, N. Free radicals, antioxidants and functional foods: Impact on human health. Pharmacogn. Rev. 2010, 4, 118–126. [Google Scholar] [CrossRef] [PubMed]
- Damasceno, S.S.; Dantas, B.B.; Ribeiro-Filho, J.; Antônio, M.; Araújo, D.; da Costa, G.M. Chemical Properties of Caffeic and Ferulic Acids in Biological System: Implications in Cancer Therapy. A Review. Curr. Pharm. Des. 2017, 9, 3015–3023. [Google Scholar] [CrossRef] [PubMed]
- Waterhouse, A.L.; Sacks, G.L.; Jeffery, D.W. Non-flavonoid Phenolics. In Understanding Wine Chemistry; Wiley: Hoboken, NJ, USA, 2016; pp. 112–116. [Google Scholar]
- Mohamed, K.; Koriem, M. Caftaric acid: An overview on its structure, daily consumption, bioavailability and pharmacological effects. Biointerface Res. Appl. Chem. 2020, 10, 5616–5623. [Google Scholar]
- Koriem, K.M.M.; Arbid, M.S. Role of caftaric acid in lead-associated nephrotoxicity in rats via antidiuretic, antioxidant and anti-apoptotic activities. J. Complement. Integr. Med. 2017, 15, 20170024. [Google Scholar] [CrossRef]
- Vanzo, A.; Cecotti, R.; Vrhovsek, U.; Torres, A.M.; Mattivi, F.; Passamonti, S. The fate of trans-caftaric acid administered into the rat stomach. J. Agric. Food Chem. 2007, 55, 1604–1611. [Google Scholar] [CrossRef] [PubMed]
- Koriem, K.M.M.; Soliman, R.E. Chlorogenic and caftaric acids in liver toxicity and oxidative stress induced by methamphetamine. J. Toxicol. 2014, 2014, 583494. [Google Scholar] [CrossRef] [PubMed]
- Harnafi, H.; Ramchoun, M.; Tits, M.; Wauters, J.N.; Frederich, M.; Angenot, L.; Aziz, M.; Alem, C.; Amrani, S. Phenolic acid-rich extract of sweet basil restores cholesterol and triglycerides metabolism in high fat diet-fed mice: A comparison with fenofibrate. Biomed. Prev. Nutr. 2013, 3, 393–397. [Google Scholar] [CrossRef]
- Azay-Milhau, J.; Ferrare, K.; Leroy, J.; Aubaterre, J.; Tournier, M.; Lajoix, A.D.; Tousch, D. Antihyperglycemic effect of a natural chicoric acid extract of chicory (Cichorium intybus L.): A comparative in vitro study with the effects of caffeic and ferulic acids. J. Ethnopharmacol. 2013, 150, 755–760. [Google Scholar]
- Abd El-Twab, S.M.; Hussein, O.E.; Hozayen, W.G.; Bin-Jumah, M.; Mahmoud, A.M. Chicoric acid prevents methotrexate-induced kidney injury by suppressing NF-κB/NLRP3 inflammasome activation and up-regulating Nrf2/ARE/HO-1 signaling. Inflamm. Res. 2019, 68, 511–523. [Google Scholar] [CrossRef]
- Tsai, Y.L.; Chiu, C.C.; Yi-Fu Chen, J.; Chan, K.C.; Lin, S.D. Cytotoxic effects of Echinacea purpurea flower extracts and cichoric acid on human colon cancer cells through induction of apoptosis. J. Ethnopharmacol. 2012, 143, 914–919. [Google Scholar] [CrossRef] [PubMed]
- Xiao, H.; Xie, G.; Wang, J.; Hou, X.; Wang, X.; Wu, W.; Liu, X. Chicoric acid prevents obesity by attenuating hepatic steatosis, inflammation and oxidative stress in high-fat diet-fed mice. Food Res. Int. 2013, 54, 345–353. [Google Scholar] [CrossRef]
- Zhang, H.L.; Dai, L.H.; Wu, Y.H.; Yu, X.P.; Zhang, Y.Y.; Guan, R.F.; Liu, T.; Zhao, J. Evaluation of hepatocyteprotective and anti-hepatitis B virus properties of Cichoric acid from Cichorium intybus leaves in cell culture. Biol. Pharm. Bull. 2014, 37, 1214–1220. [Google Scholar] [CrossRef] [PubMed]
- Lin, Z.; Neamati, N.; Zhao, H.; Kiryu, Y.; Turpin, J.A.; Aberham, C.; Strebel, K.; Kohn, K.; Witvrouw, M.; Pannecouque, C.; et al. Chicoric acid analogues as HIV-1 integrase inhibitors. J. Med. Chem. 1999, 42, 1401–1414. [Google Scholar] [CrossRef] [PubMed]
- Siwe-Noundou, X.; Musyoka, T.M.; Moses, V.; Ndinteh, D.T.; Mnkandhla, D.; Hoppe, H.; Tastan Bishop, Ö.; Krause, R.W.M. Anti-HIV-1 integrase potency of methylgallate from Alchornea cordifolia using in vitro and in silico approaches. Sci. Rep. 2019, 9, 4718. [Google Scholar] [CrossRef]
- Gezer, C. Potential health effects of the popular compound of artichoke: Cynarin (CYN). Prog. Nutr. 2017, 19, 5–9. [Google Scholar]
- Jun, N.-J.; Jang, K.-C.; Kim, S.-C.; Moon, D.-Y.; Seong, K.-C.; Kang, K.-H.; Tandang, L.; Kim, P.-H.; Cho, S.-M.K.; Park, K.-H. Radical Scavenging Activity and Content of Cynarin (1,3-dicaffeoylquinic acid) in Artichoke (Cynara scolymus L.). J. Appl. Biol. Chem. 2007, 50, 244–248. [Google Scholar]
- Sun, Z.; Chen, J.; Ma, J.; Jiang, Y.; Wang, M.; Ren, G.; Chen, F. Cynarin-rich sunflower (Helianthus annuus) sprouts possess both antiglycative and antioxidant activities. J. Agric. Food Chem. 2012, 60, 3260–3265. [Google Scholar] [CrossRef] [PubMed]
- Xia, N.; Pautz, A.; Wollscheid, U.; Reifenberg, G.; Förstermann, U.; Li, H. Artichoke, Cynarin and Cyanidin Downregulate the Expression of Inducible Nitric Oxide Synthase in Human Coronary Smooth Muscle Cells. Molecules 2014, 19, 3668. [Google Scholar] [CrossRef] [PubMed]
- Li, H.; Xia, N.; Brausch, I.; Yao, Y.; Förstermann, U. Flavonoids from artichoke (Cynara scolymus L.) up-regulate endothelial-type nitric-oxide synthase gene expression in human endothelial cells. J. Pharmacol. Exp. Ther. 2004, 310, 926–932. [Google Scholar] [CrossRef] [PubMed]
- Adzet, T.; Camarasa, J.; Laguna, J.C. Hepatoprotective activity of polyphenolic compounds from Cynara scolymus against CCl4 toxicity in isolated rat hepatocytes. J. Nat. Prod. 1987, 50, 612–617. [Google Scholar] [CrossRef] [PubMed]
- Gebhardt, R. Antioxidative and protective properties of extracts from leaves of the artichoke (Cynara scolymus L.) against hydroperoxide-induced oxidative stress in cultured rat hepatocytes. Toxicol. Appl. Pharmacol. 1997, 144, 279–286. [Google Scholar] [CrossRef] [PubMed]
- Atasever, B.; Akgün Dar, K.; Kuruca, S.; Turan, N.; Seyhanli, V.; Meriçli, A. Effects of flavonoids obtained from cynara syriaca on leukemic cells. J. Fac. Pharm. Ankara 2003, 32, 143–150. [Google Scholar]
- Gezer, C.; Yücecan, S.; Rattan, S.I.S. Artichoke compound cynarin differentially affects the survival, growth, and stress response of normal, immortalized, and cancerous human cells. Turk. J. Biol. 2015, 39, 299–305. [Google Scholar] [CrossRef]
- Slanina, J.; Táborská, E.; Bochořáková, H.; Slaninová, I.; Humpa, O.; Robinson, W.E.; Schram, K.H. New and facile method of preparation of the anti-HIV-1 agent, 1,3-dicaffeoylquinic acid. Tetrahedron Lett. 2001, 42, 3383–3385. [Google Scholar] [CrossRef]
- Bradley, P. British Herbal Compendium; British Herbal Medicine Association: Exeter, UK, 2006; Volume 2. [Google Scholar]
- Dong, G.C.; Chuang, P.H.; Chang, K.C.; Jan, P.S.; Hwang, P.I.; Wu, H.B.; Yi, M.; Zhou, H.X.; Chen, H.M. Blocking effect of an immuno-suppressive agent, cynarin, on CD28 of T-cell receptor. Pharm. Res. 2009, 26, 375–381. [Google Scholar] [CrossRef]
- Weinhold, F.; Landis, C.R. Natural bond orbitals and extensions of localized bonding concepts. Chem. Educ. Res. Pract. 2001, 2, 91–104. [Google Scholar] [CrossRef]
- Breneman, C.M.; Wiberg, K.B. Determining atom-centered monopoles from molecular electrostatic potentials. The need for high sampling density in formamide conformational analysis. J. Comput. Chem. 1990, 11, 361–373. [Google Scholar] [CrossRef]
- Frish, M.J.; Trucks, G.W.; Schlegel, H.; Frisch, M.J.; Trucks, G.W.; Schlegel, H.B.; Scuseria, G.E.; Robb, M.A.; Cheeseman, J.R.; Scalmani, G.; et al. Gaussian 09, Revision A.02; Gaussian: Wallingford, CT, USA, 2009. [Google Scholar]
- Štarha, P.; Trávníček, Z.; Herchel, R.; Popa, I.; Suchý, P.; Vančo, J. Dinuclear copper(II) complexes containing 6-(benzylamino)purines as bridging ligands: Synthesis, characterization, and in vitro and in vivo antioxidant activities. J. Inorg. Biochem. 2009, 103, 432–440. [Google Scholar] [CrossRef] [PubMed]
- Xiong, S.L.; Li, A.; Huang, N.; Lu, F.; Hou, D. Antioxidant and immunoregulatory activity of different polysaccharide fractions from tuber of Ophiopogon japonicus. Carbohydr. Polym. 2011, 86, 1273–1280. [Google Scholar] [CrossRef]
- Freeman, H.C.; Hutchinson, N.D. The crystal structure of the anti-tumor agent 5-(3,3-dimethyl-1-triazenyl)imidazole-4-carboxamide (NSC-45388). Acta Crystall. Sec. B 1979, 35, 2051–2054. [Google Scholar] [CrossRef]
- Glossman-Mitnik, D. Computational Study of the Chemical Reactivity Properties of the Rhodamine B Molecule. Procedia Comput. Sci. 2013, 18, 816–825. [Google Scholar] [CrossRef]
- Varsanyi, G.; Kovner, M.A.; Lang, L. Assignments for Vibrational Spectra of 700 Benzene Derivatives (Buch, 1973) [WorldCat.org]; Akademiai Kiado: Budapest, Hungary, 1973. [Google Scholar]
- Liu, Q.; Wang, Y.; Xiao, C.; Wu, W.; Liu, X. Metabolism of chicoric acid by rat liver microsomes and bioactivity comparisons of chicoric acid and its metabolites. Food Funct. 2015, 6, 1928–1935. [Google Scholar] [CrossRef] [PubMed]
- McGrowder, D.A.; Miller, F.G.; Nwokocha, C.R.; Anderson, M.S.; Wilson-Clarke, C.; Vaz, K.; Lennox, A.J.; Brown, J. Medicinal herbs used in traditional management of breast cancer: Mechanisms of action. Medicines 2020, 7, 47. [Google Scholar] [CrossRef]
- Janda, K.; Gutowska, I.; Geszke-Moritz, M.; Jakubczyk, K. The common cichory (Cichorium intybus L.) as a source of extracts with health-promoting properties—A review. Molecules 2021, 26, 1814. [Google Scholar] [CrossRef]


| CFA | CTA | CA | CY | |
|---|---|---|---|---|
| Energy [hartree] | −648.8686 | −1179.9939 | −1752.3902 | −1869.9097 |
| Energy [eV] | −17,656.6036 | −32,109.2506 | −47,684.9381 | −50,882.8000 |
| Dipole moment [D] | 2.1285 | 3.0949 | 1.6335 | 3.7528 |
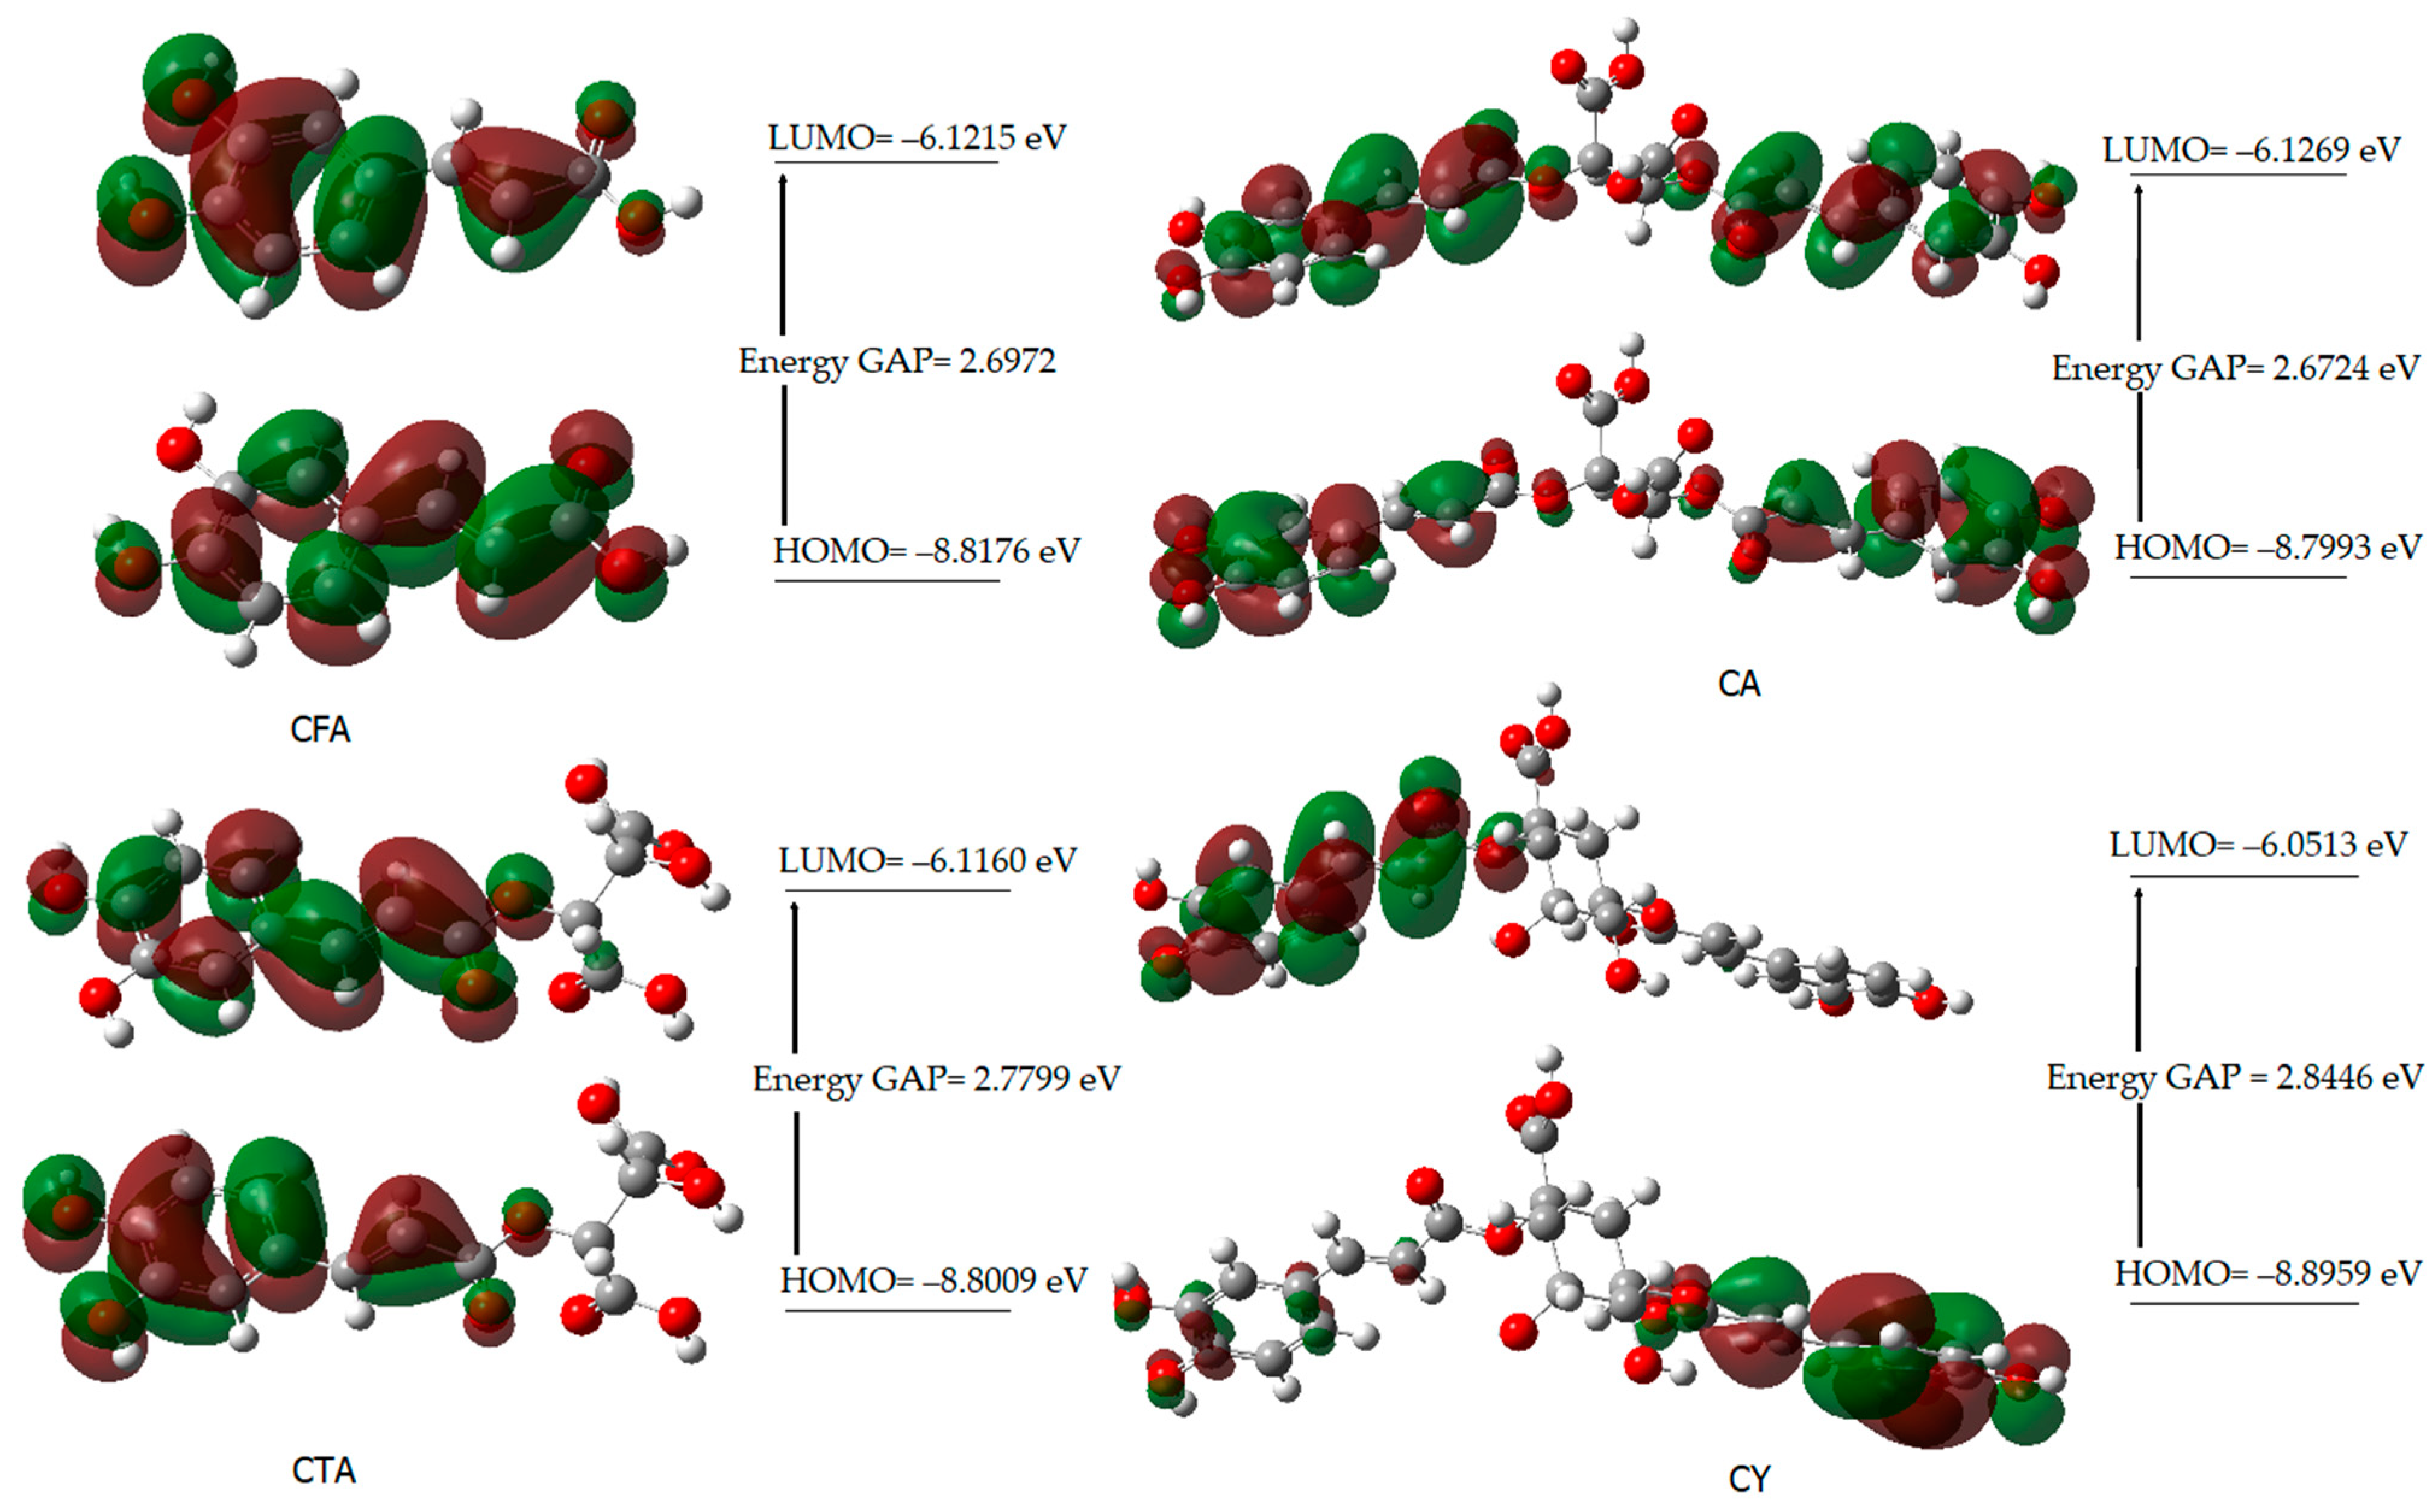
| HOMO [eV] | −8.8187 | −8.5289 | −8.7993 | −8.8959 |
| LUMO [eV] | −6.2477 | −6.1160 | −6.1269 | −6.0513 |
| Energy gap [eV] | 2.5709 | 2.4128 | 2.6724 | 2.8446 |
| Ionization potential, I = −EHOMO | 8.8187 | 8.5289 | 8.7993 | 8.8959 |
| Electron affinity, A = −ELUMO | 6.2477 | 6.1160 | 6.1269 | 6.0513 |
| Electronegativity, χ | 7.5332 | 7.3224 | 7.4631 | 7.4736 |
| Chemical potential, μ | −6.2477 | −6.1160 | −6.1269 | −6.0513 |
| Chemical hardness, η | 1.2855 | 1.2064 | 1.3362 | 1.4223 |
| Chemical softness, S | 0.3890 | 0.4145 | 0.3742 | 0.3515 |
| Electrophilicity index, ω | 100.3540 | 90.2539 | 100.3204 | 104.1770 |
| Aromaticity indices | ||||
| Aj | 0.991 | 0.993 | 0.993 | 0.993 |
| BAC | 0.875 | 0.885 | 0.884 | 0.886 |
| HOMA | 0.956 | 0.958 | 0.958 | 0.939 |
| EN | 0.020 | 0.025 | 0.025 | 0.045 |
| GEO | 0.020 | 0.016 | 0.016 | 0.016 |
| I6 | 92.51 | 93.30 | 93.29 | 93.39 |
| CFA | CTA | CA | CY | |||||
|---|---|---|---|---|---|---|---|---|
| NBO | CHelpG | NBO | CHelpG | NBO | CHelpG | NBO | CHelpG | |
| H1 | 0.207 | 0.090 | 0.207 | 0.103 | 0.208 | 0.087 | 0.207 | 0.127 |
| H2 | 0.222 | 0.155 | 0.204 | 0.217 | 0.204 | 0.237 | 0.205 | 0.150 |
| H3 | 0.205 | 0.182 | 0.203 | 0.262 | 0.202 | 0.224 | 0.203 | 0.199 |
| H4 | 0.488 | 0.362 | 0.469 | 0.298 | 0.469 | 0.345 | 0.469 | 0.375 |
| H5 | 0.482 | 0.378 | 0.469 | 0.302 | 0.468 | 0.315 | 0.469 | 0.369 |
| H6 | 0.215 | 0.098 | 0.214 | 0.035 | 0.214 | 0.114 | 0.216 | 0.138 |
| H7 | 0.211 | 0.207 | 0.213 | 0.183 | 0.214 | 0.093 | 0.208 | 0.092 |
| H8 | 0.481 | 0.359 | - | - | - | - | - | - |
| O1 | −0.662 | −0.513 | −0.649 | −0.452 | −0.649 | −0.554 | −0.650 | −0.529 |
| O2 | −0.705 | −0.515 | −0.657 | −0.483 | −0.657 | −0.447 | −0.658 | −0.610 |
| O3 | −0.618 | −0.599 | −0.603 | −0.582 | −0.605 | −0.571 | −0.611 | −0.539 |
| O4 | −0.689 | −0.589 | −0.564 | −0.602 | −0.555 | −0.534 | −0.585 | −0.478 |
| C1 | −0.107 | 0.226 | −0.112 | 0.216 | −0.118 | 0.328 | −0.120 | 0.259 |
| C2 | −0.168 | −0.195 | −0.171 | −0.163 | −0.171 | −0.070 | −0.173 | −0.096 |
| C3 | −0.231 | −0.195 | −0.259 | −0.382 | −0.259 | −0.556 | −0.260 | −0.330 |
| C4 | 0.295 | 0.324 | 0.294 | 0.325 | 0.294 | 0.493 | 0.294 | 0.251 |
| C5 | 0.249 | 0.231 | 0.275 | 0.442 | 0.271 | 0.354 | 0.272 | 0.608 |
| C6 | −0.225 | −0.408 | −0.225 | −0.604 | −0.214 | −0.525 | −0.215 | −0.582 |
| C7 | −0.095 | −0.042 | −0.073 | 0.098 | −0.075 | −0.230 | −0.083 | −0.178 |
| C8 | −0.316 | −0.419 | −0.315 | −0.419 | −0.314 | −0.145 | −0.305 | −0.264 |
| C9 | 0.760 | 0.854 | 0.778 | 0.904 | 0.777 | 0.784 | 0.771 | 0.743 |
| CFA | CTA | CA | CY | Assignments | [63] | ||||||||||||||||
|---|---|---|---|---|---|---|---|---|---|---|---|---|---|---|---|---|---|---|---|---|---|
| IRKBr | IRATR | Raman | DFT | Int. | IRKBr | IRATR | Raman | DFT | Int. | IRKBr | IRATR | Raman | DFT | Int. | IRKBr | IRATR | Raman | DFT | Int. | ||
| 3433 s | 3434 m | 3850 | 89.9 | 3487 s | 3485 m | 3835 | 64.4 | 3412 s | 3408 w | 3835 | 109.2 | 3398 vs | 3399 m | 3829 | 61.7 | νOHar | |||||
| 3236 s | 3228 w | 3783 | 160.6 | 3239 m | 3229 w | 3832 | 122.2 | 3359 s | 3352 w | 3352 w | 3831 | 240.4 | 3234 w | 3825 | 119.7 | νOHar | |||||
| 3770 | 119.9 | 3742 | 71.3 | 3755 | 92.2 | 3813 | 94.7 | νOHCOOH/νOHchin | |||||||||||||
| 3060 m | 3203 | 6.4 | 3063 w | 3062 vw | 3069 w | 3202 | 5.4 | 3061 w | 3203 | 5.9 | 3041 m | 3043 w | 3206 | 2.6 | ν(CH)ar + ν(CH)C=C | 2 | |||||
| 3025 m | 3186 | 4.9 | 3194 | 1.7 | 3195 | 4.0 | 3022 w | 3024 w | 3172 | 16.3 | ν(CH)ar + ν(CH)C=C | 20b | |||||||||
| 2924 m | 3153 | 9.5 | 2953 w | 2961 w | 3155 | 15.4 | 2954 w | 2963 w | 3154 | 24.5 | 2925 m | 2931 w | 3169 | 12.4 | ν(CH)ar | 20a | |||||
| 1758 s | 1758 m | 1757 vw | 1842 | 252.1 | 1748 m | 1746 w | 1835 | 236.0 | 1716 vs | 1716 s | 1715 w | νC=Otart /νC=Ochin | |||||||||
| 1707 vs | 1707 s | 1706 w | 1812 | 332.8 | 1718 s | 1716 m | 1824 | 352.5 | 1692 vs | 1692 m | 1698 w | 1822 | 254.4 | νC=Otart /νC=Ochin | |||||||
| 1644 vs | 1643 s | 1640 m | 1775 | 351.9 | 1647 vs | 1646 s | 1648 m | 1771 | 276.6 | 1682 vs | 1679 vs | 1681 s | 1765 | 495.5 | 1637 s | 1639 m | 1638 m | 1769 | 292.2 | νC=Ocaff, ν(C=C)C=C | |
| 1618 vs | 1619 s | 1612 vs | 1679 | 193.4 | 1678 | 228.2 | 1624 m | 1627 s | 1678 | 474.8 | 1609 s | 1609 s | 1609 s | 1685 | 318.2 | νC=CC=C | |||||
| 1600 s | 1600 s | 1594 m | 1643 | 163.8 | 1616 vs | 1616 s | 1617 vs | 1639 | 438.2 | 1606 s | 1604 m | 1609 vs | 1638 | 901.8 | 1598 vs | 1598 s | 1599 vs | 1646 | 621.1 | ν(CC)ar, ν(C=C)C=C | 8a |
| 1530 m | 1531 w | 1531 w | 1631 | 310.4 | 1518 s | 1518 s | 1518 vw | 1633 | 57.3 | 1515 s | 1515 m | 1515 w | 1632 | 106.3 | 1532 m | 1534 m | 1641 | 73.2 | νCCar, νC=CC=C, βCHar, | 8b | |
| 1557 | 187.9 | 1473 w | 1474 w | 1476 w | 1560 | 130.3 | 1484 w | 1489 w | 1482 w | 1559 | 266.5 | 1508 w | 1566 | 206.5 | β(CC)ar, β(CH)ar, ν(CC)ar, | 19a | |||||
| 1450 vs | 1449 vs | 1450 vw | 1472 | 13.1 | 1418 m | 1418 m | 1466 | 46.9 | 1447 w | 1466 | 94.7 | 1445 m | 1446 m | 1471 | 54.5 | ν(CC), β(CH)tart | 19b | ||||
| 1384 w | 1375 w | 1384 w | 1415 | 36.5 | 1384 m | 1385 w | β(CH)ar, β(CH)tart | ||||||||||||||
| 1353 m | 1353 w | 1352 w | 1404 | 16.6 | 1353 s | 1352 s | 1351 w | 1382 | 115.4 | 1362 s | 1362 m | 1363 w | 1381 | 340.7 | 1367 s | 1364 s | 1365 w | 1393 | 181.4 | ν(CC)ar, βOHar, β(CH)tart | 14 |
| 1323 m | 1324 w | 1325 vw | 1378 | 83.4 | 1337 w | 1336 w | 1342 vw | 1421 | 42.8 | 1378 | 9.1 | β(CH)tart | |||||||||
| 1296 s | 1296 s | 1298 vs | 1381 | 93.3 | 1381 | 340.7 | 1307 s | 1306 m | 1308 w | 1364 | 22.8 | βOHar, νCCar, β(CH)C=C | |||||||||
| 1354 | 25.1 | 1293 s | 1294 s | 1286 m | 1347 | 10.2 | 1302 s | 1300 m | 1303 m | 1362 | 9.9 | 1337 | 147.8 | defring, νCCar, βCHar, βOHar | |||||||
| 1280 vs | 1277 vs | 1285 m | 1312 | 260.5 | 1262 s | 1258 s | 1265 w | 1306 | 217.5 | 1280 m | 1281 w | 1271 w | 1333 | 216.7 | 1279 vs | 1277 vs | 1279 m | 1313 | 397.3 | ν(C−OH)caff, βCHar, βCHtart | |
| 1238 s | 1238 vs | 1234 w | 1305 | 43.0 | 1246 s | 1246 s | 1248 m | 1321 | 51.2 | 1241 s | 1239 s | 1290 | 86.6 | βCHtart | |||||||
| 1293 | 94.0 | 1285 | 124.1 | 1305 | 440.2 | 1268 | 37.6 | βCHar, βCHtart, ν(C−O) | |||||||||||||
| 1217 s | 1217 s | 1215 | 127.9 | 1209 | 54.1 | 1209 | 106.5 | 1214 | 71.5 | βOH, βCHar | |||||||||||
| 1191 | 33.7 | 1222 s | 1224 m | 1215 vw | 1193 | 3.5 | 1215 s | 1203 s | 1210 w | 1193 | 35.1 | 1205 s | 1202 vs | 1193 m | 1193 | 3.6 | defring, βCHar, β(CH)C=C | 9a | |||
| 1195 s | 1195 s | 1195 w | 1172 | 150.6 | defring, βOHtart | ||||||||||||||||
| 1174 m | 1174 m | 1186 m | 1171 | 126.1 | 1163 m | 1164 m | 1164 w | 1151 | 261.3 | 1166 m | 1168 m | 1169 w | 1190 | 473.4 | 1171 s | 1170 s | 1168 w | 1189 | 214.4 | βCHar, β(CH)C=C | 18a |
| 1140 | 1351.9 | 1157 s | 1157 s | 1132 | 871.5 | βCOH, βCHtart, βOHtart | |||||||||||||||
| 1120 m | 1120 m | 1107 w | 1121 | 55.3 | 1120 s | 1122 s | 1118 w | 1117 | 174.9 | 1120 s | 1121 m | 1125 w | 1116 | 334.2 | 1111 w | 1117 | 192.9 | βCHar, βOHar | 18b | ||
| 1020 | 31.0 | 1069 s | 1069 s | 1071 vw | 1015 | 28.4 | 1077 m | 1076 m | 1015 | 51.0 | 1082 s | βOHcaff, γ(CH)C=C | |||||||||
| 968 | 16.0 | 989 m | 989 m | 989 vw | 983 | 20.2 | 988 m | 989 w | 981 vw | 981 | 41.7 | defring, β(CH)C=C, νCCtart | |||||||||
| 974 m | 974 m | 975 w | 966 | 6.9 | 966 m | 964 w | 975 | 6.2 | 975 m | 972 m | 974 vw | 969 | 29.6 | 979 m | 979 m | 978 w | 974 | 1.9 | γ(CH)C=C, γ(CH)ar | 17b | |
| 936 w | 936 w | 954 vw | 950 | 1.7 | 943 w | 943 m | 925 | 1.1 | 926 w | 925 | 1.9 | 940 w | 962 w | 928 | 1.3 | γ(CH)ar | 17a | ||||
| 900 m | 898 m | 909 w | 909 w | 910 w | 890 w | 896 w | 897 vw | 919 | 9.7 | ν(CCO)caff, defring /defchin | |||||||||||
| 872 vw | 888 w | 888 w | 876 w | 876 w | 878 w | 887 | 4.3 | β(CH)C=C, defring /defchin | |||||||||||||
| 849 m | 850 m | 852 vw | 890 | 7.2 | 858 m | 858 m | 858 w | 888 | 6.5 | 866 w | 866 w | 862 w | 888 | 12.3 | 848 m | 848 m | 884 | 3.2 | γCHar, γ(CH)C=C | 5 | |
| 817 m | 816 m | 852 | 51.9 | 826 m | 826 s | 824 vw | 851 | 37.2 | 852 | 7.2 | 814 m | 824 m | 854 | 39.3 | γCHar, γ(CH)C=C | ||||||
| 801 w | 803 m | 802 w | 828 | 15.2 | 811 m | 813 m | 813 w | 806 | 26.5 | 803 m | 803 m | 808 w | 807 | 47.5 | 814 m | 808 | 30.2 | γCHar, | 10a | ||
| 780 w | 780 m | 779 vw | 808 | 18.4 | 768 w | 762 m | 805 | 27.2 | 764 w | 766 w | 765 vw | 788 | 49.6 | 787 w | 766 w | 771 w | 805 | 20.0 | defring, βOH, β(CH)C=C | 12 | |
| 736 w | 782 | 18.4 | 749 w | 749 w | 751 vw | 786 | 21.1 | 736 w | 736 w | 730 w | 746 | 5.9 | 740 w | 797 | 10.7 | defring, ν(CC)ar | |||||
| 718 w | 718 m | 721 vw | 743 | 9.4 | 715 vw | 738 | 5.2 | 769 | 52.8 | γ(C=O)tart, γ(C=O)chin | |||||||||||
| 699 w | 700 w | 751 | 10.5 | 697 w | 737 | 13.9 | 698 vw | 698 vw | 699 w | 736 | 2.2 | 707 w | 717 w | 729 w | 741 | 1.4 | γ(C=O)caff | ||||
| 686 vw | 710 | 4.0 | 674 m | 676 m | 699 | 0.3 | 679 w | 706 | 0.3 | 668 w | 682 | 0.1 | defring, | 4 | |||||||
| 648 w | 649 m | 657 | 21.7 | 642 w | 658 | 8.8 | 658 w | 661 w | 663 vw | 673 | 20.6 | 647 w | 649 m | 655 | 18.3 | β(C=O) | |||||
| 616 w | 610 | 67.3 | 617 m | 616 m | 596 vw | 598 | 22.4 | 596 w | 597 vw | 598 | 30.4 | 613 | 82.6 | defringou, γOH | 16a | ||||||
| 603 w | 603 m | 601 w | 599 | 18.2 | 595 w | 596 | 2.7 | 583 m | 585 w | 583 | 1.8 | 600 m | 590 | 23.9 | defring | 6a | |||||
| 576 m | 571 | 38.0 | 565 w | 567 vw | 578 | 41.9 | 581 | 79.9 | 568 m | 578 | 26.3 | defring | 6b | ||||||||
| 564 | 45.1 | 518 w | 549 | 38.8 | 502 w | 553 | 0.6 | 531 m | 502 | 6.9 | γOHcaff, γOHtart | ||||||||||
| 458 vw | 460 vw | 458 | 8.9 | 469 w | 452 | 4.3 | 450 w | 484 vw | 454 | 7.3 | 460 w | 458 w | 455 | 4.5 | γ(CC)ar, defringou | 16b | |||||
| 446 w | 434 | 67.7 | 435 w | 389 | 91.7 | 431 w | 436 vw | 432 | 7.8 | 421 w | 429 w | γOHar, γOHtart | |||||||||
| CA | CTA | CA | CY | |||||
|---|---|---|---|---|---|---|---|---|
| Exp. | Calc. | Exp. | Calc. | Exp. | Calc. | Exp. | Calc. | |
| H1 | 6.96 | 6.67 | 7.58 | 7.72 | 7.54 | 7.63 | 6.63 | 7.87, 8.00 |
| H2 | 6.75 | 6.47 | 6.78 | 7.03 | 7.10 | 6.90 | 6.51 | 7.26 |
| H3 | 7.02 | 7.53 | 7.05 | 7.05 | 7.08 | 6.90 | 7.00 | 7.21 |
| H4 | 9.51 | 3.90 | 9.65 | 4.93 | 9.70 | 4.66 | 9.56 | 5.28 |
| H5 | 9.12 | 4.97 | 9.21 | 4.61 | 9.18 | 4.31 | 9.42 | 5.06 |
| H6 | 7.41 | 7.71 | 7.02 | 8.03 | 6.78 | 7.84 | 6.20 | 8.23 |
| H7 | 6.17 | 6.17 | 6.24 | 6.70 | 6.38 | 6.57 | 6.06 | 6.86, 6.72 |
| H8 | 1.10 | 5.25 | - | - | - | - | - | |
| C1 | 125.71 | 132.75 | 125.37 | 133.41 | 125.23 | 131.83 | 125.25 | 114.97 |
| C2 | 121.16 | 126.72 | 121.54 | 125.35 | 115.81 | 123.80 | 120.42 | 106.43 |
| C3 | 115.13 | 121.63 | 114.93 | 122.38 | 115.26 | 120.58 | 115.85 | 107.39 |
| C4 | 145.57 | 155.83 | 146.48 | 155.49 | 147.04 | 153.81 | 148.27 | 134.73 |
| C5 | 144.59 | 149.80 | 145.65 | 150.42 | 145.62 | 149.56 | 145.57 | 130.55 |
| C6 | 115.76 | 124.91 | 115.87 | 126.68 | 121.74 | 125.48 | 115.53 | 108.94 |
| C7 | 148.14 | 157.11 | 148.72 | 156.63 | 148.87 | 155.96 | 145.33 | 135.54 |
| C8 | 114.65 | 116.09 | 112.92 | 116.92 | 112.37 | 114.05 | 114.19 | 99.64 |
| C9 | 167.91 | 175.12 | 165.67 | 174.00 | 165.53 | 172.88 | 165.64 | 155.24 |
| CFA | CTA | CA | CY | |
|---|---|---|---|---|
| λmax1 [nm] | 214.5 | 216.5 | 217.0 | 215.0 |
| λmax2 [nm] | 289.0 | - | - | 299.5 |
| λmax3 [nm] | 313.5 | 324.0 | 325.0 | 319.0 |
| IC50: | HO• [µM] | O2• [µM] |
|---|---|---|
| Caffeic acid | 45.714 ± 3.15 | 10.491 ± 1.20 |
| Cichoric acid | 20.768 ± 0.86 | 8.062 ± 0.59 |
| Caftaric acid | 39.180 ± 3.12 | 9.510 ± 0.96 |
| Cynarin | 31.741 ± 5.51 | 6.880 ± 0.31 |
Disclaimer/Publisher’s Note: The statements, opinions and data contained in all publications are solely those of the individual author(s) and contributor(s) and not of MDPI and/or the editor(s). MDPI and/or the editor(s) disclaim responsibility for any injury to people or property resulting from any ideas, methods, instructions or products referred to in the content. |
© 2024 by the authors. Licensee MDPI, Basel, Switzerland. This article is an open access article distributed under the terms and conditions of the Creative Commons Attribution (CC BY) license (https://creativecommons.org/licenses/by/4.0/).
Share and Cite
Świderski, G.; Gołębiewska, E.; Kalinowska, M.; Świsłocka, R.; Kowalczyk, N.; Jabłońska-Trypuć, A.; Lewandowski, W. Comparison of Physicochemical, Antioxidant, and Cytotoxic Properties of Caffeic Acid Conjugates. Materials 2024, 17, 2575. https://doi.org/10.3390/ma17112575
Świderski G, Gołębiewska E, Kalinowska M, Świsłocka R, Kowalczyk N, Jabłońska-Trypuć A, Lewandowski W. Comparison of Physicochemical, Antioxidant, and Cytotoxic Properties of Caffeic Acid Conjugates. Materials. 2024; 17(11):2575. https://doi.org/10.3390/ma17112575
Chicago/Turabian StyleŚwiderski, Grzegorz, Ewelina Gołębiewska, Monika Kalinowska, Renata Świsłocka, Natalia Kowalczyk, Agata Jabłońska-Trypuć, and Włodzimierz Lewandowski. 2024. "Comparison of Physicochemical, Antioxidant, and Cytotoxic Properties of Caffeic Acid Conjugates" Materials 17, no. 11: 2575. https://doi.org/10.3390/ma17112575