
Experimental Research on Crack Resistance of Steel–Polyvinyl Alcohol Hybrid Fiber-Reinforced Concrete
Abstract
:1. Introduction
2. Experimental Materials and Methods
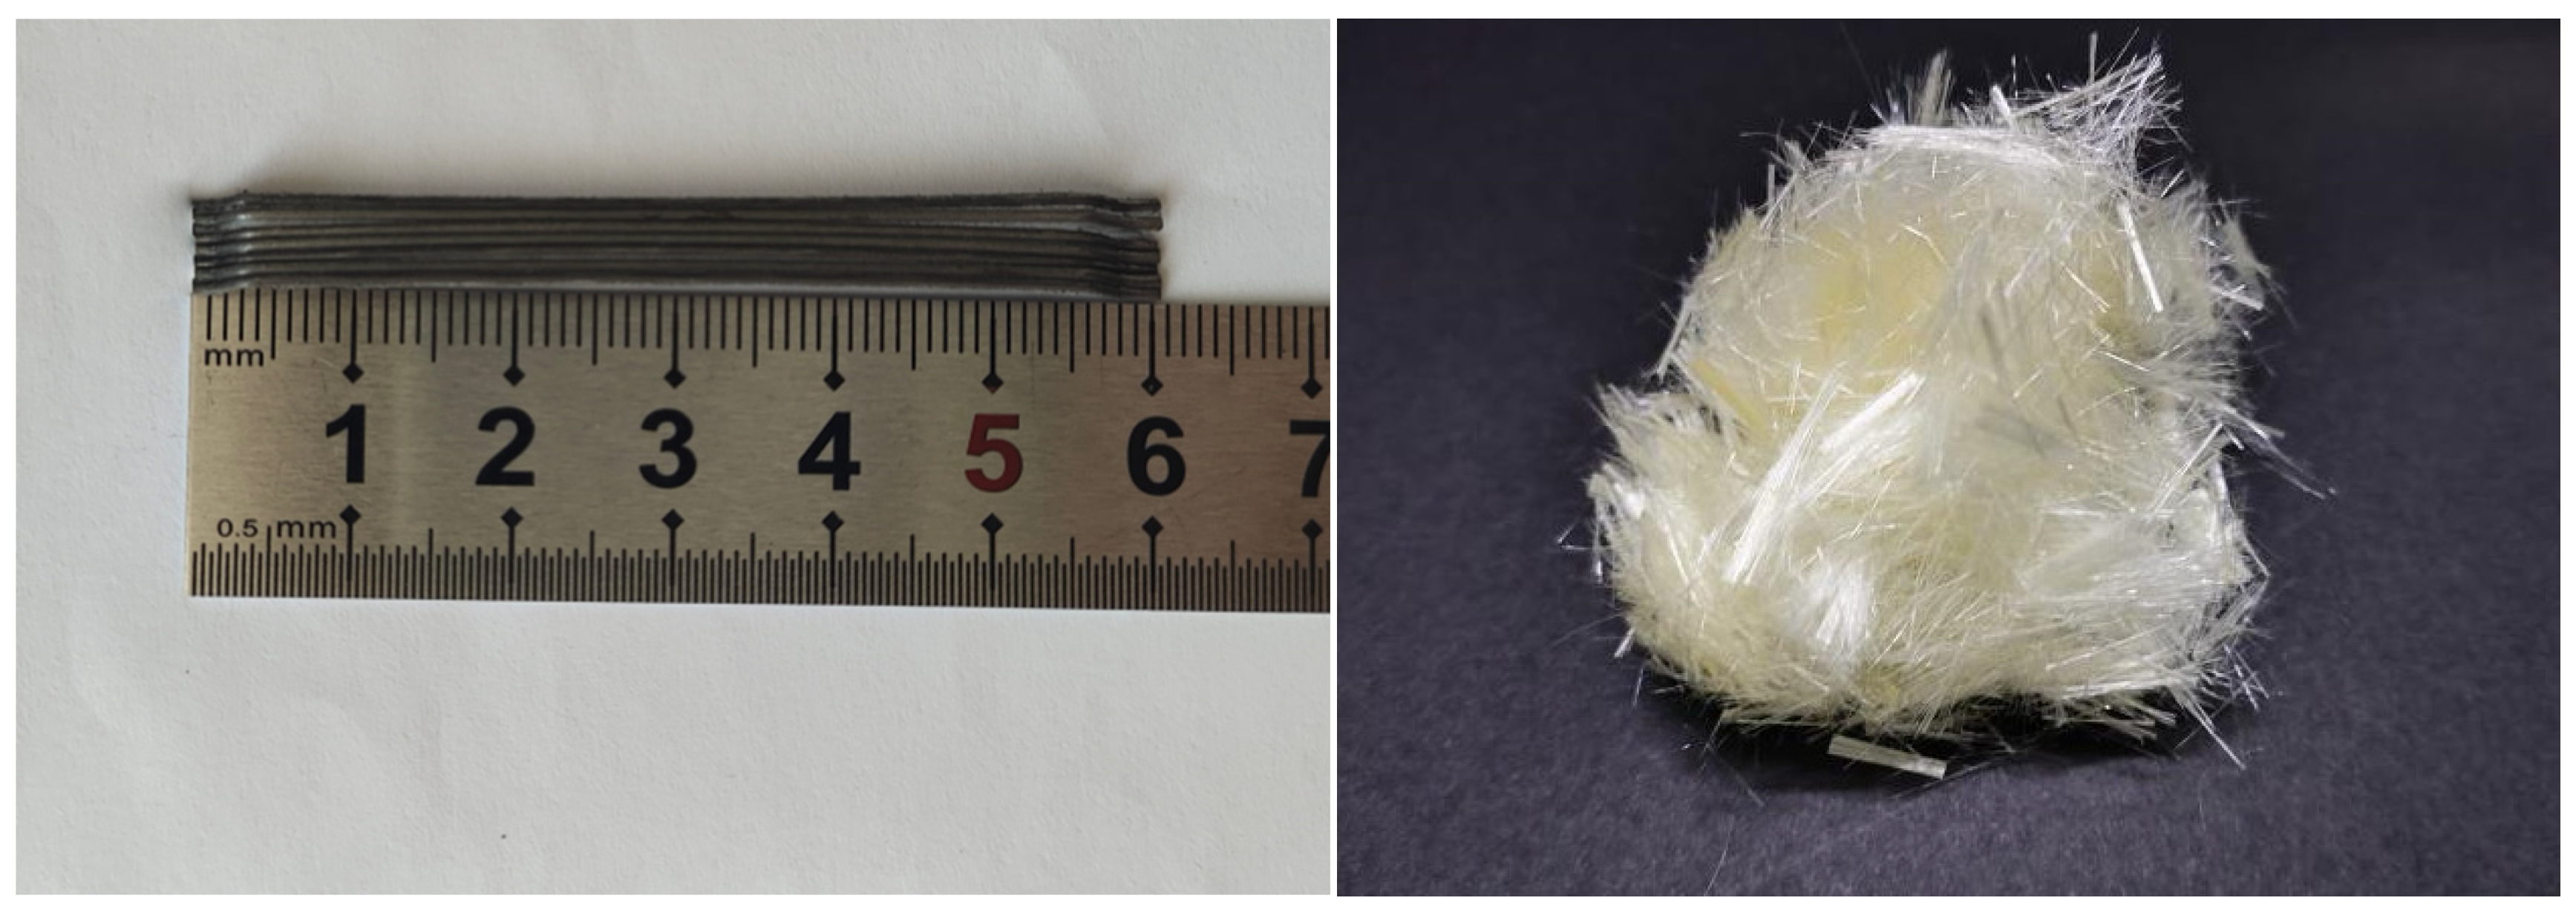
2.1. Experimental Materials
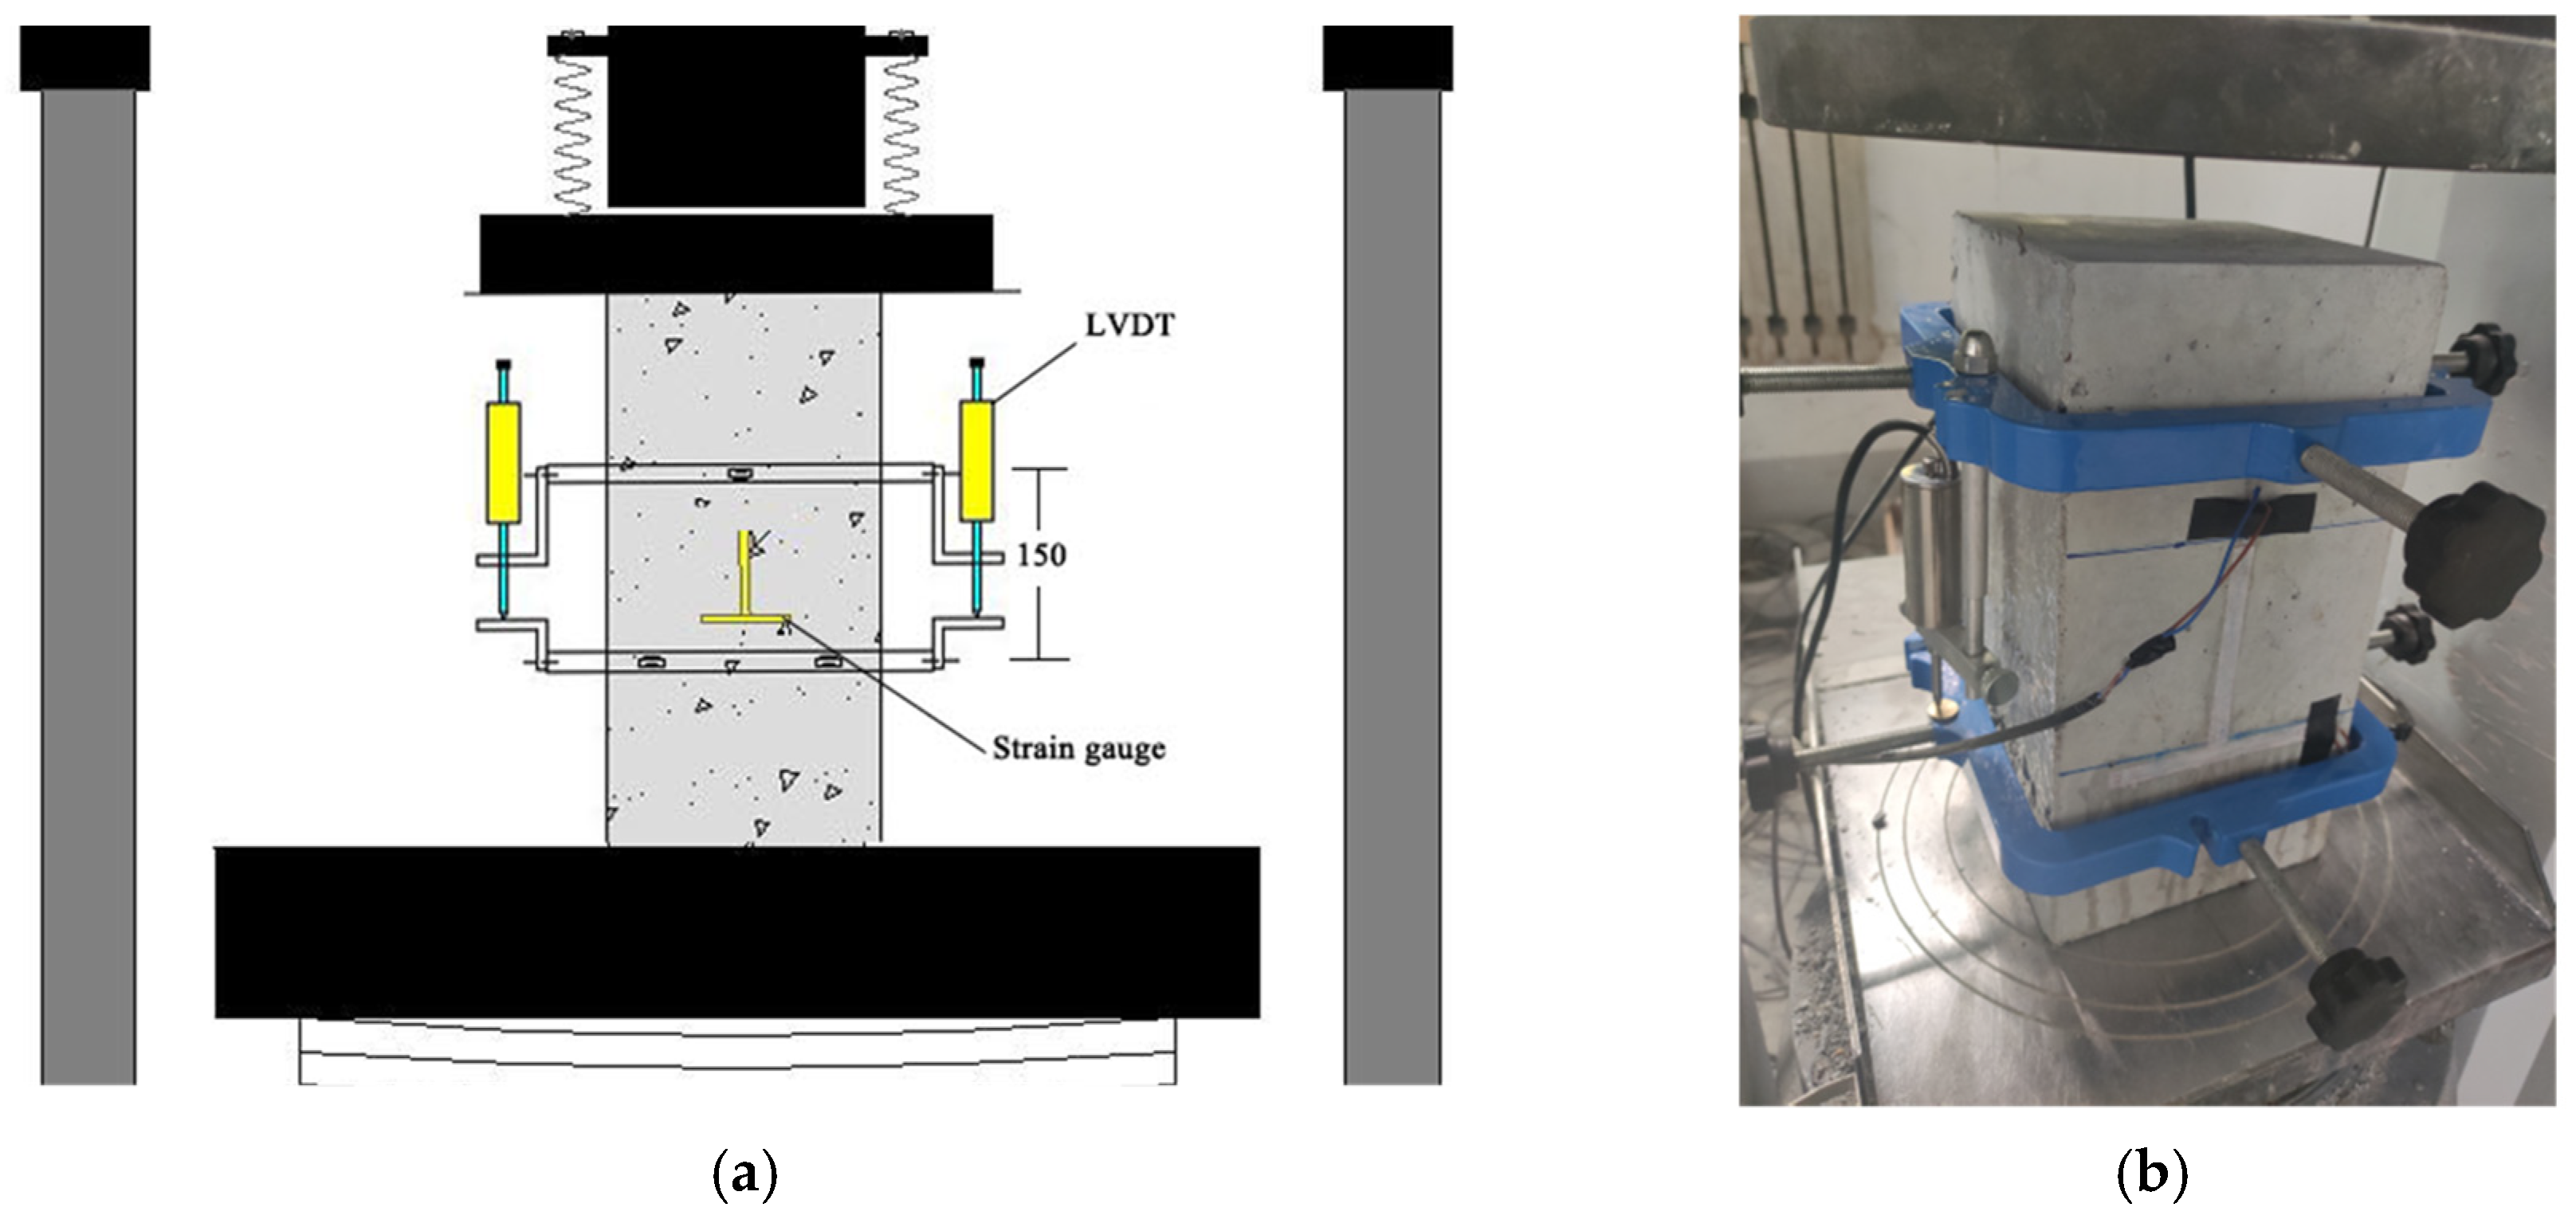
2.2. Experimental Methods
2.2.1. Test and Test
2.2.2. Uniaxial Compression Test
2.2.3. Autogenous Shrinkage and Drying Shrinkage Test
3. Results and Discussion
3.1. of Concrete
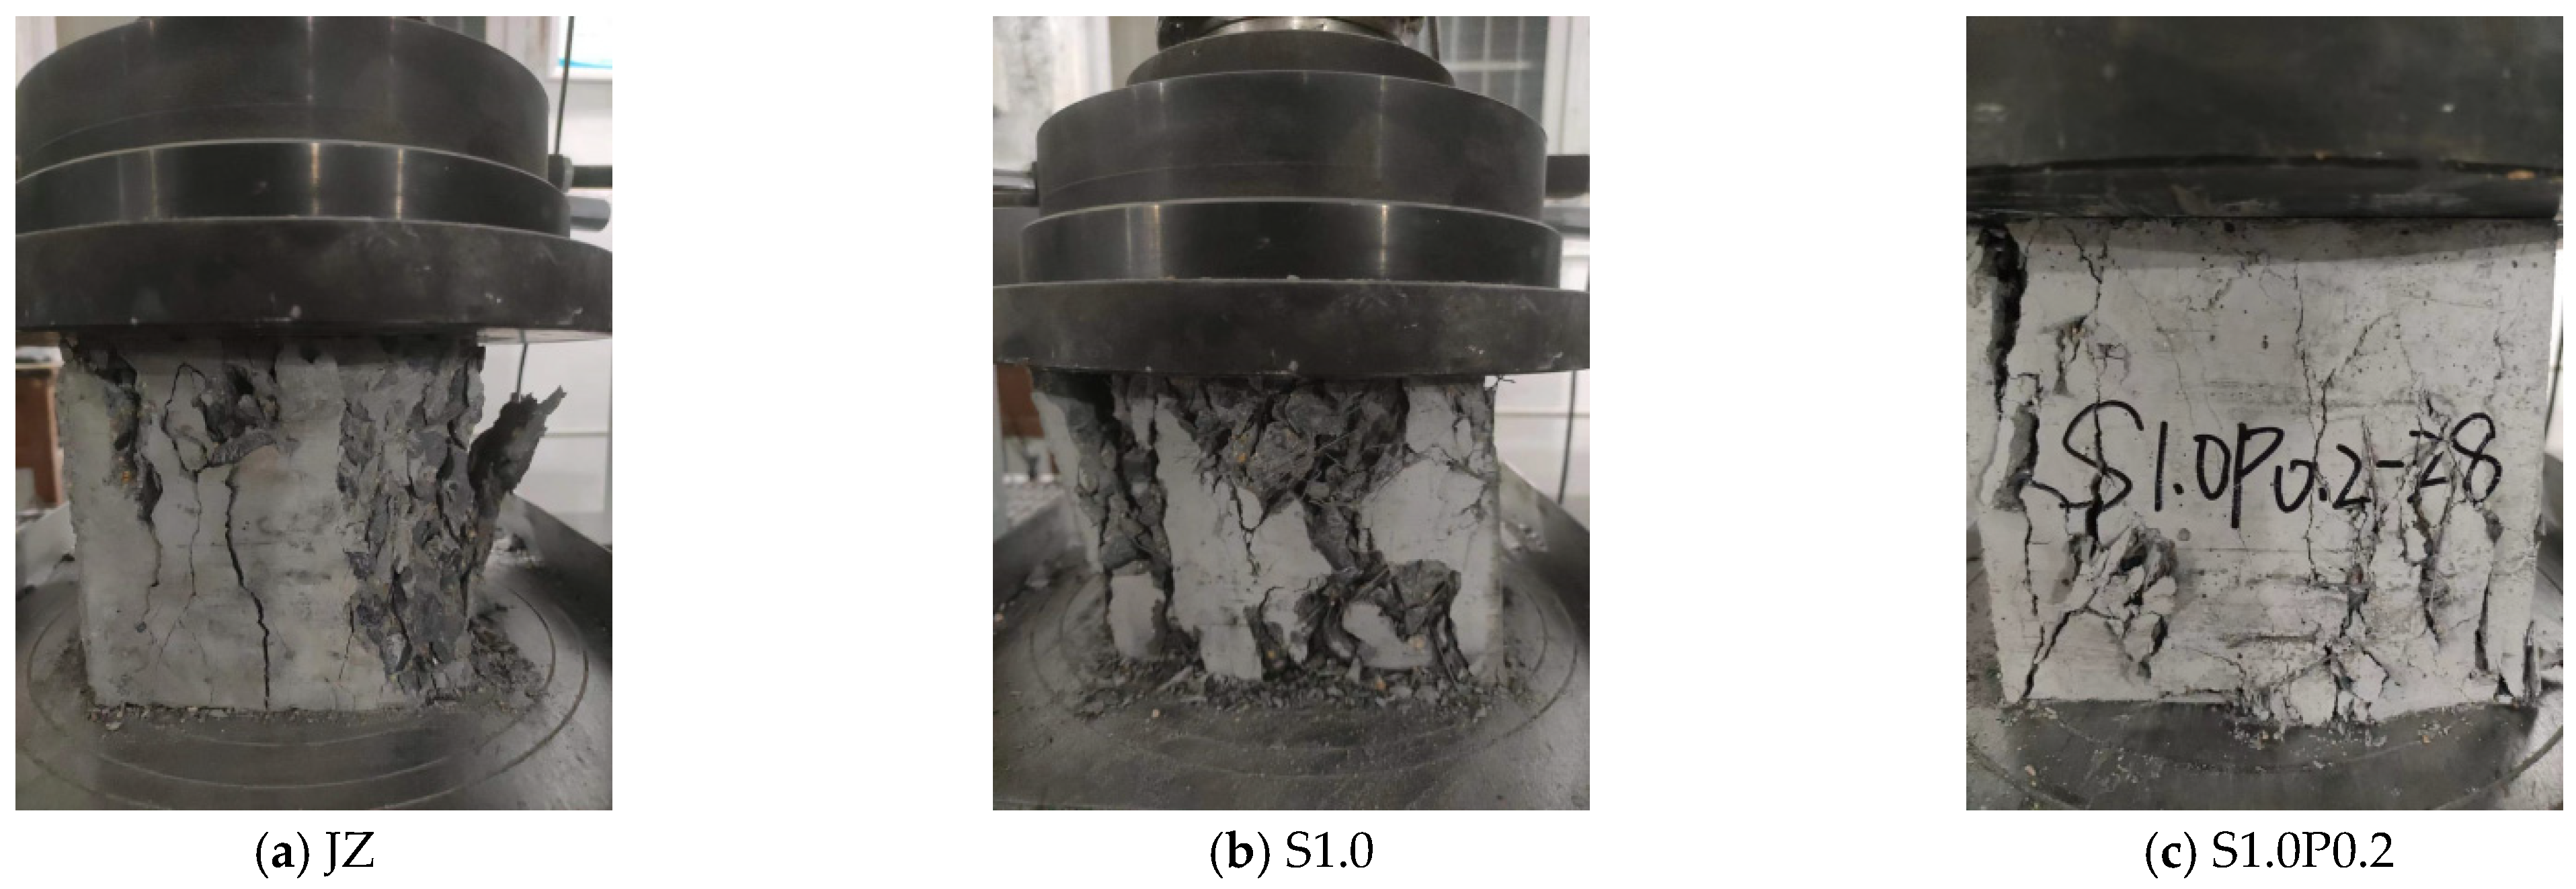
- (1)
- After the compressive failure of the reference concrete, the internal structure of the concrete was severely damaged, the surface was severely peeled off, and the integrity of the matrix was poor.
- (2)
- After the addition of steel fibers, the peeling of concrete was reduced, the integrity of the matrix was improved, but the internal truss system of the concrete could be clearly seen. In the areas the steel fiber truss system did not cover, the concrete still had damage.
- (3)
- The matrix integrity of the S-PVA HFRC was the best. After the PVA fiber was added to SFRC, the matrix integrity was greatly improved. Although the structure of the concrete matrix was damaged, there was little surface peeling.
3.1.1. Variation Trend of in SFRC
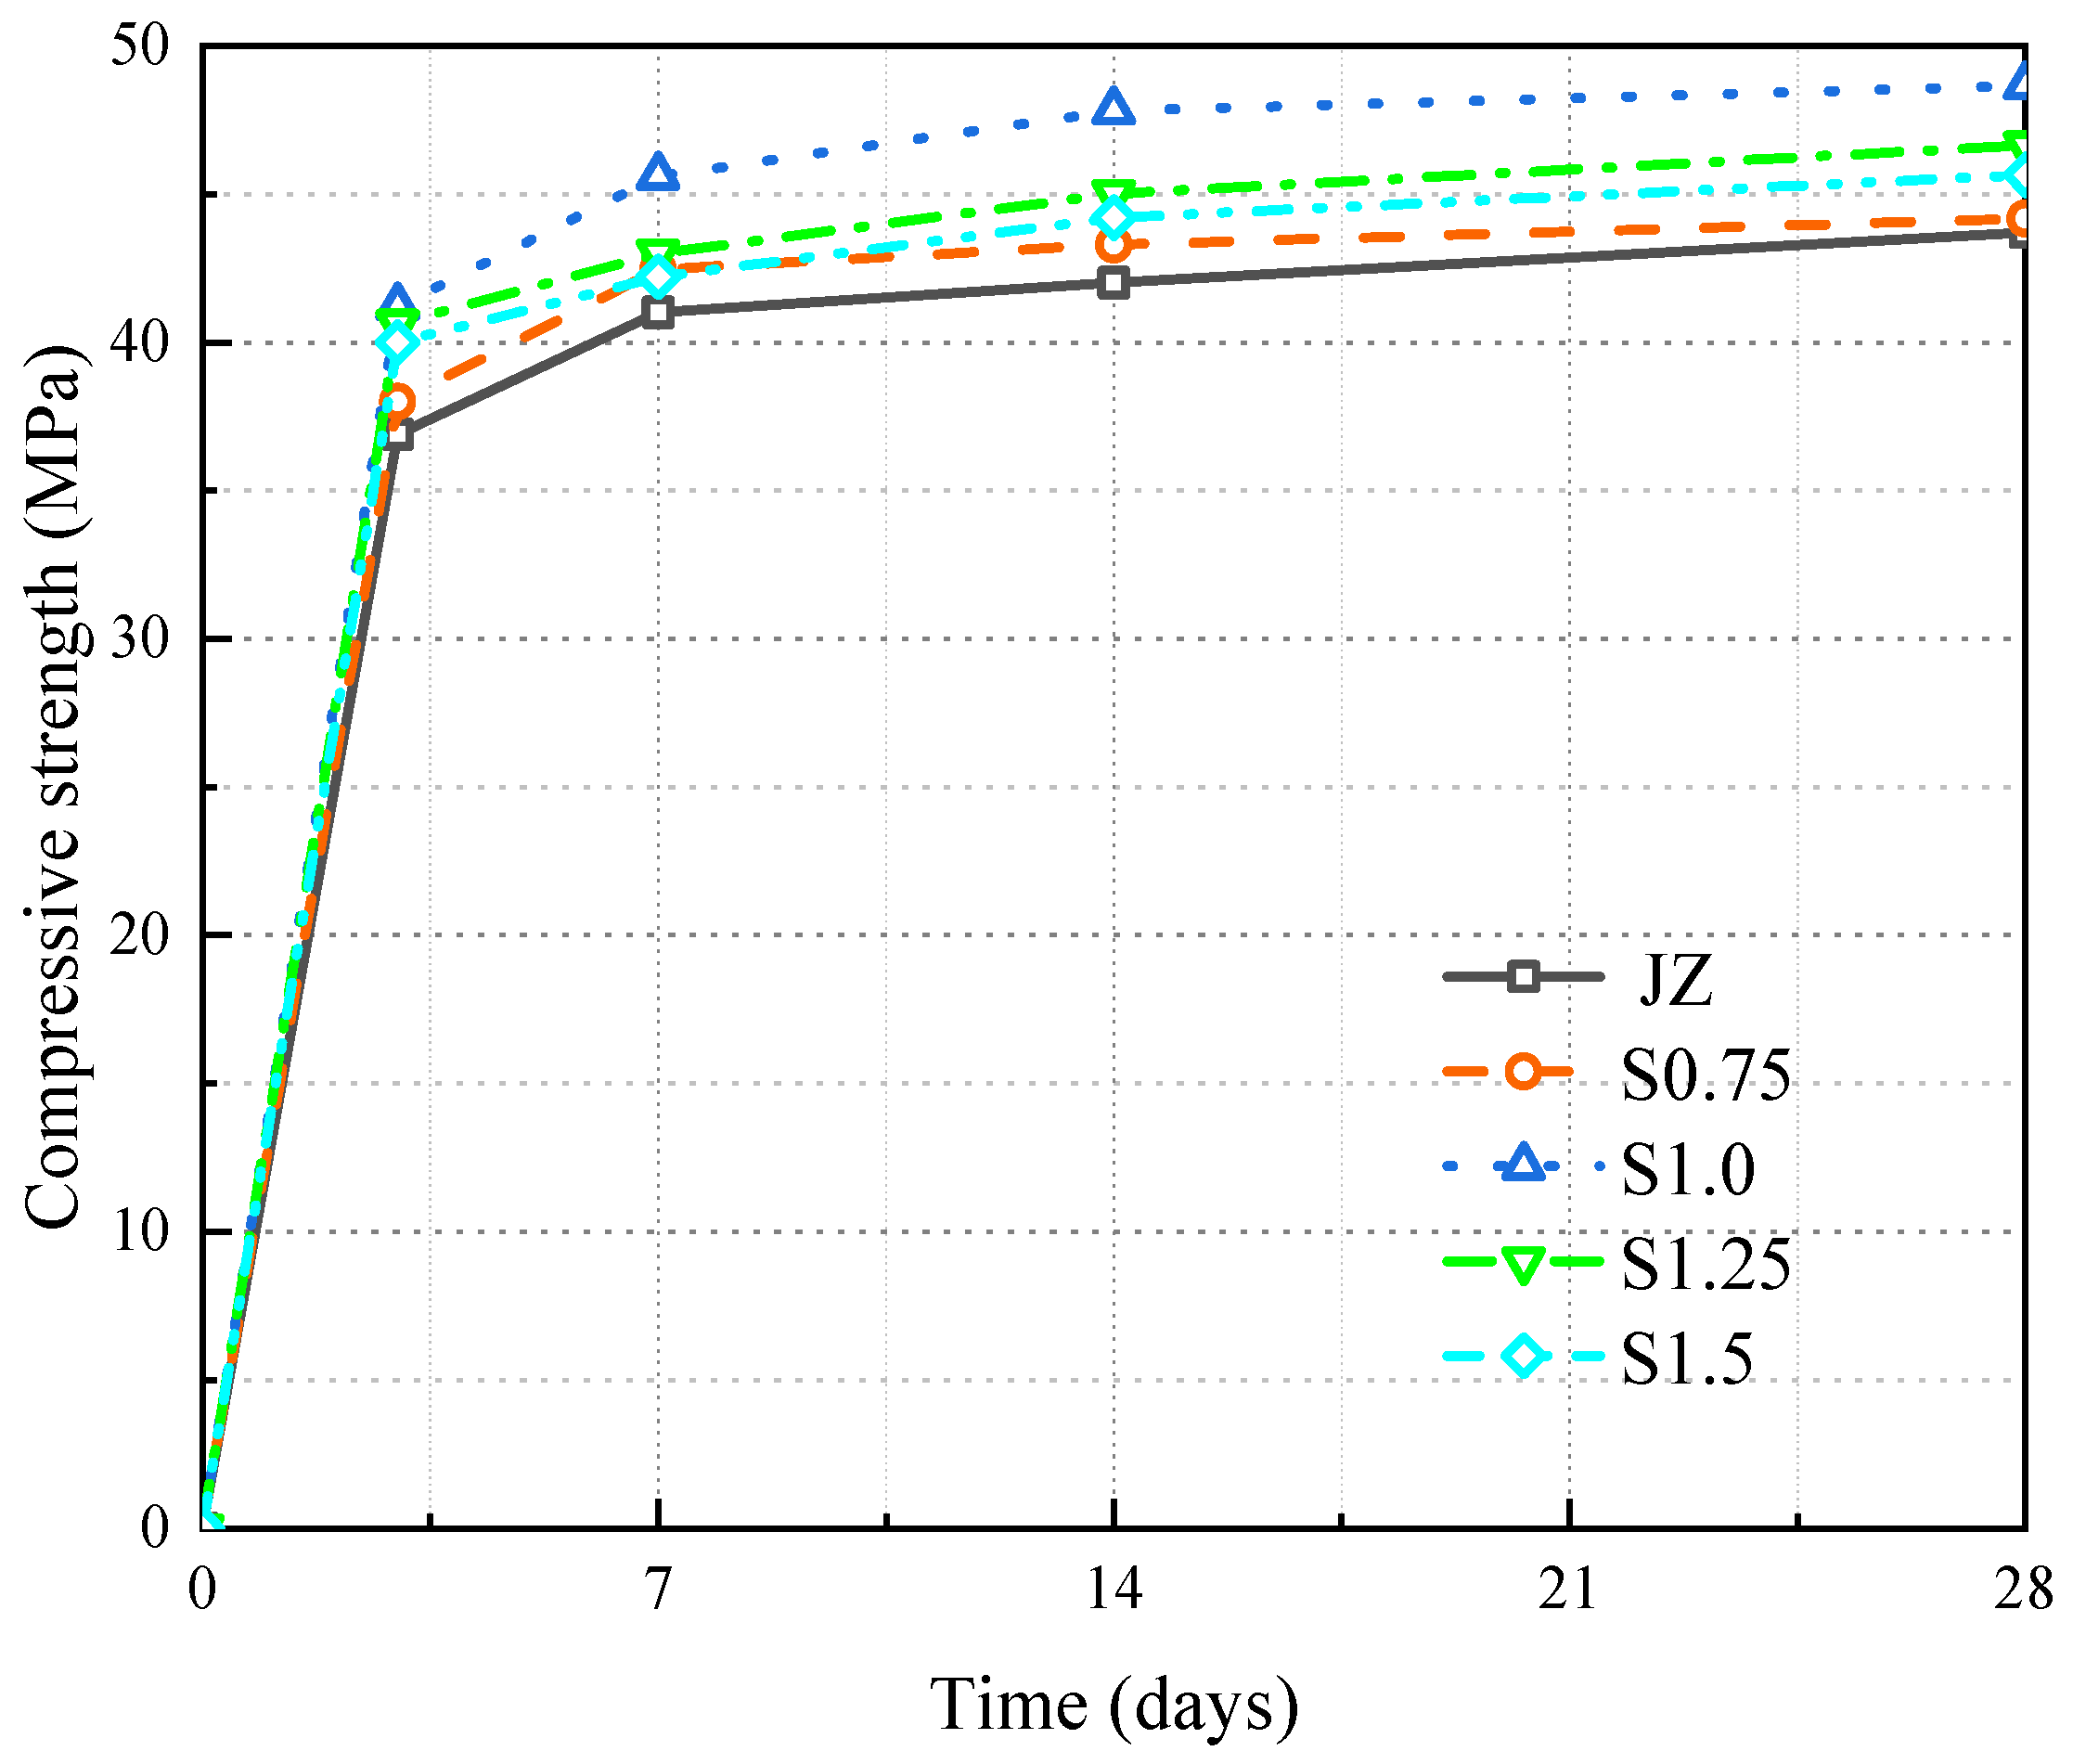
- (1)
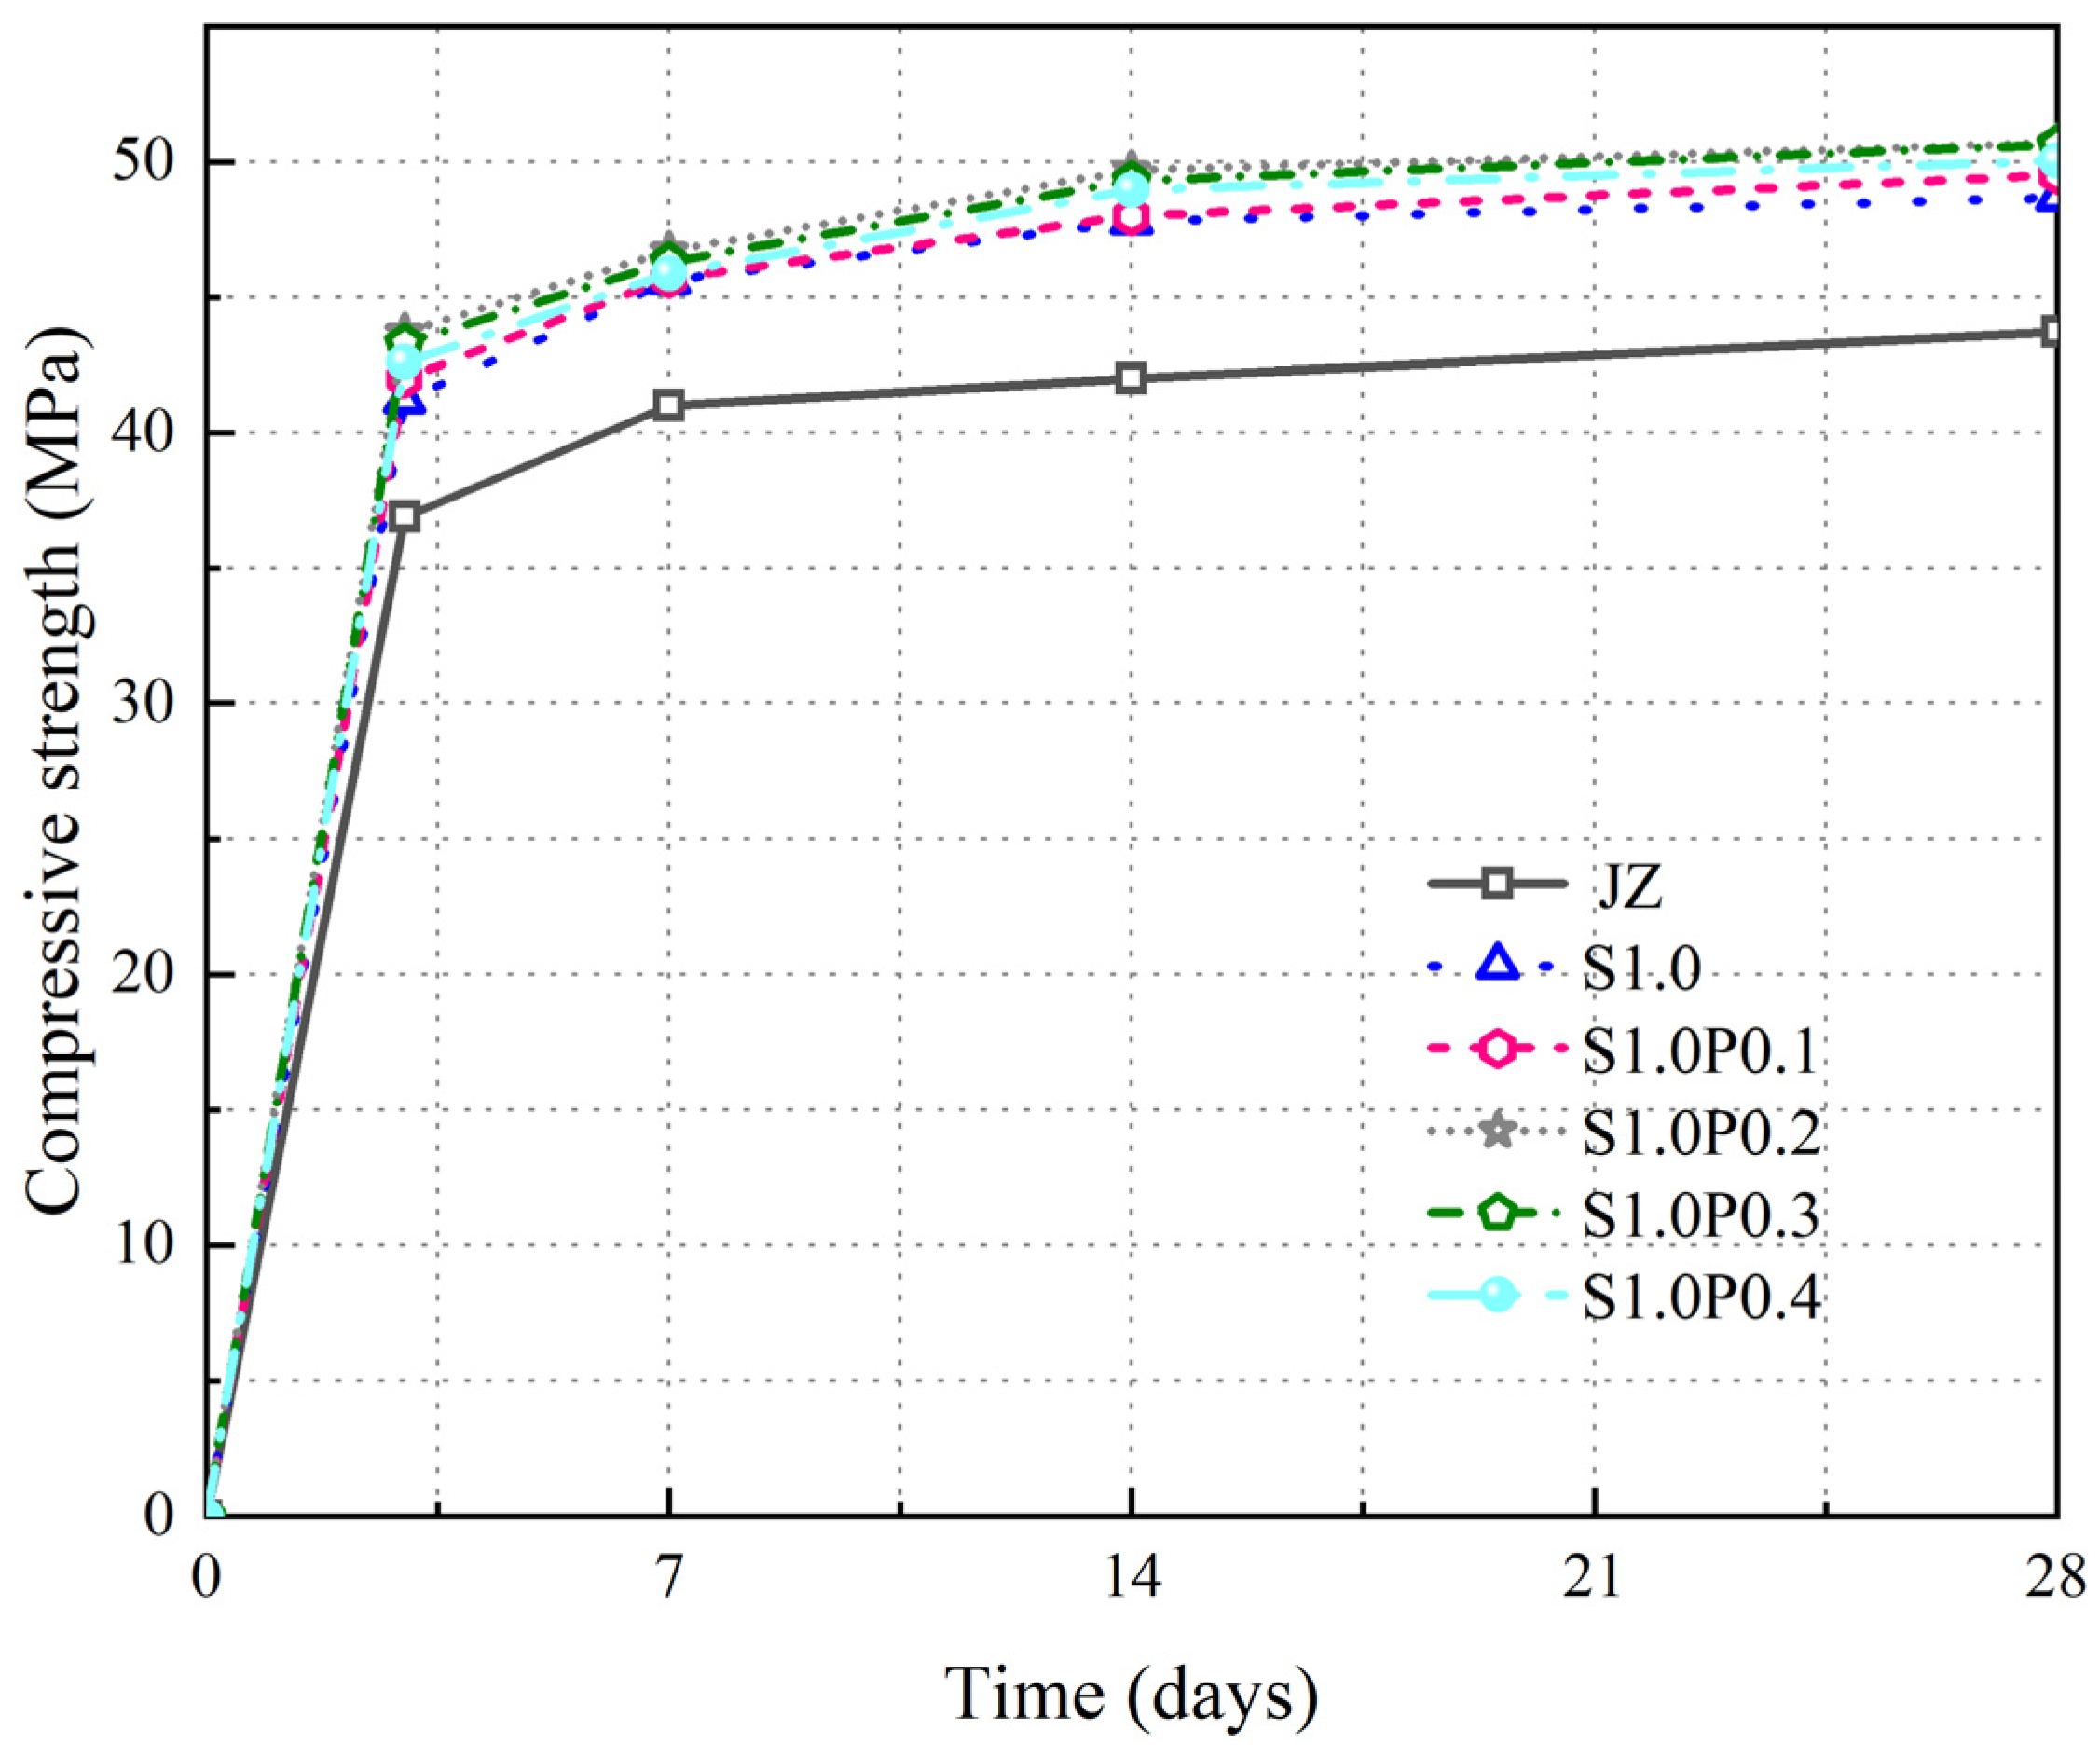
- As the age increased, the of the concrete gradually increased. It was also found that the strength of concrete increased fastest between 3 and 7 days of age. At 7 days, it reached over 80% of the at 28 days.
- (2)
- At each age, as the content of steel fiber increased, the first rose and then fell, peaking when the steel fiber content was 1.0%. At 28 days, compared to the of JZ, S1.0 increased from 43.7 MPa to 48.66 MPa, an increase of 11.4%.
3.1.2. Variation of in S-PVA HFRC
- (1)
- With the increase in age, the of S-PVA HFRC continued to increase.
- (2)
- At different ages, S-PVA HF further increased the of the single steel fiber-mixed concrete. At different ages, the of S-PVA HFRC was highest when the steel fiber content was 1.0% and the PVA fiber content was 0.2%, which was 16% higher than the baseline concrete at 28 days. However, when the PVA fiber content was greater than 0.2%, the of SFRC decreased.
- (1)
- The of S-PVA HFRC consistently increased with age.
- (2)
- S-PVA HF enhanced the of single steel fiber-mixed concrete at various ages. The peak for S-PVA HFRC occurred at 1.0% steel fiber content and 0.2% PVA fiber content, surpassing baseline concrete by 16% at 28 days. However, increasing PVA fiber content beyond 0.2% led to a decreased concrete .
3.2. of Concrete
- (1)
- After the test of the reference concrete, the crack width was the largest, and the concrete matrix was divided into two parts.
- (2)
- After the test of SFRC, the upper part of the concrete specimen in contact with the pad was crushed, the crack width was smaller, the crack line was relatively straight, and the degree of bending was not large.
- (3)
- After the test of the S-PVA HFRC, the lower part of the concrete specimen in contact with the pad was crushed. Meanwhile, the cracks below developed from bottom to top, the crack width was smaller, and the crack line was more fluctuating.
3.2.1. Variation of in SFRC
- (1)
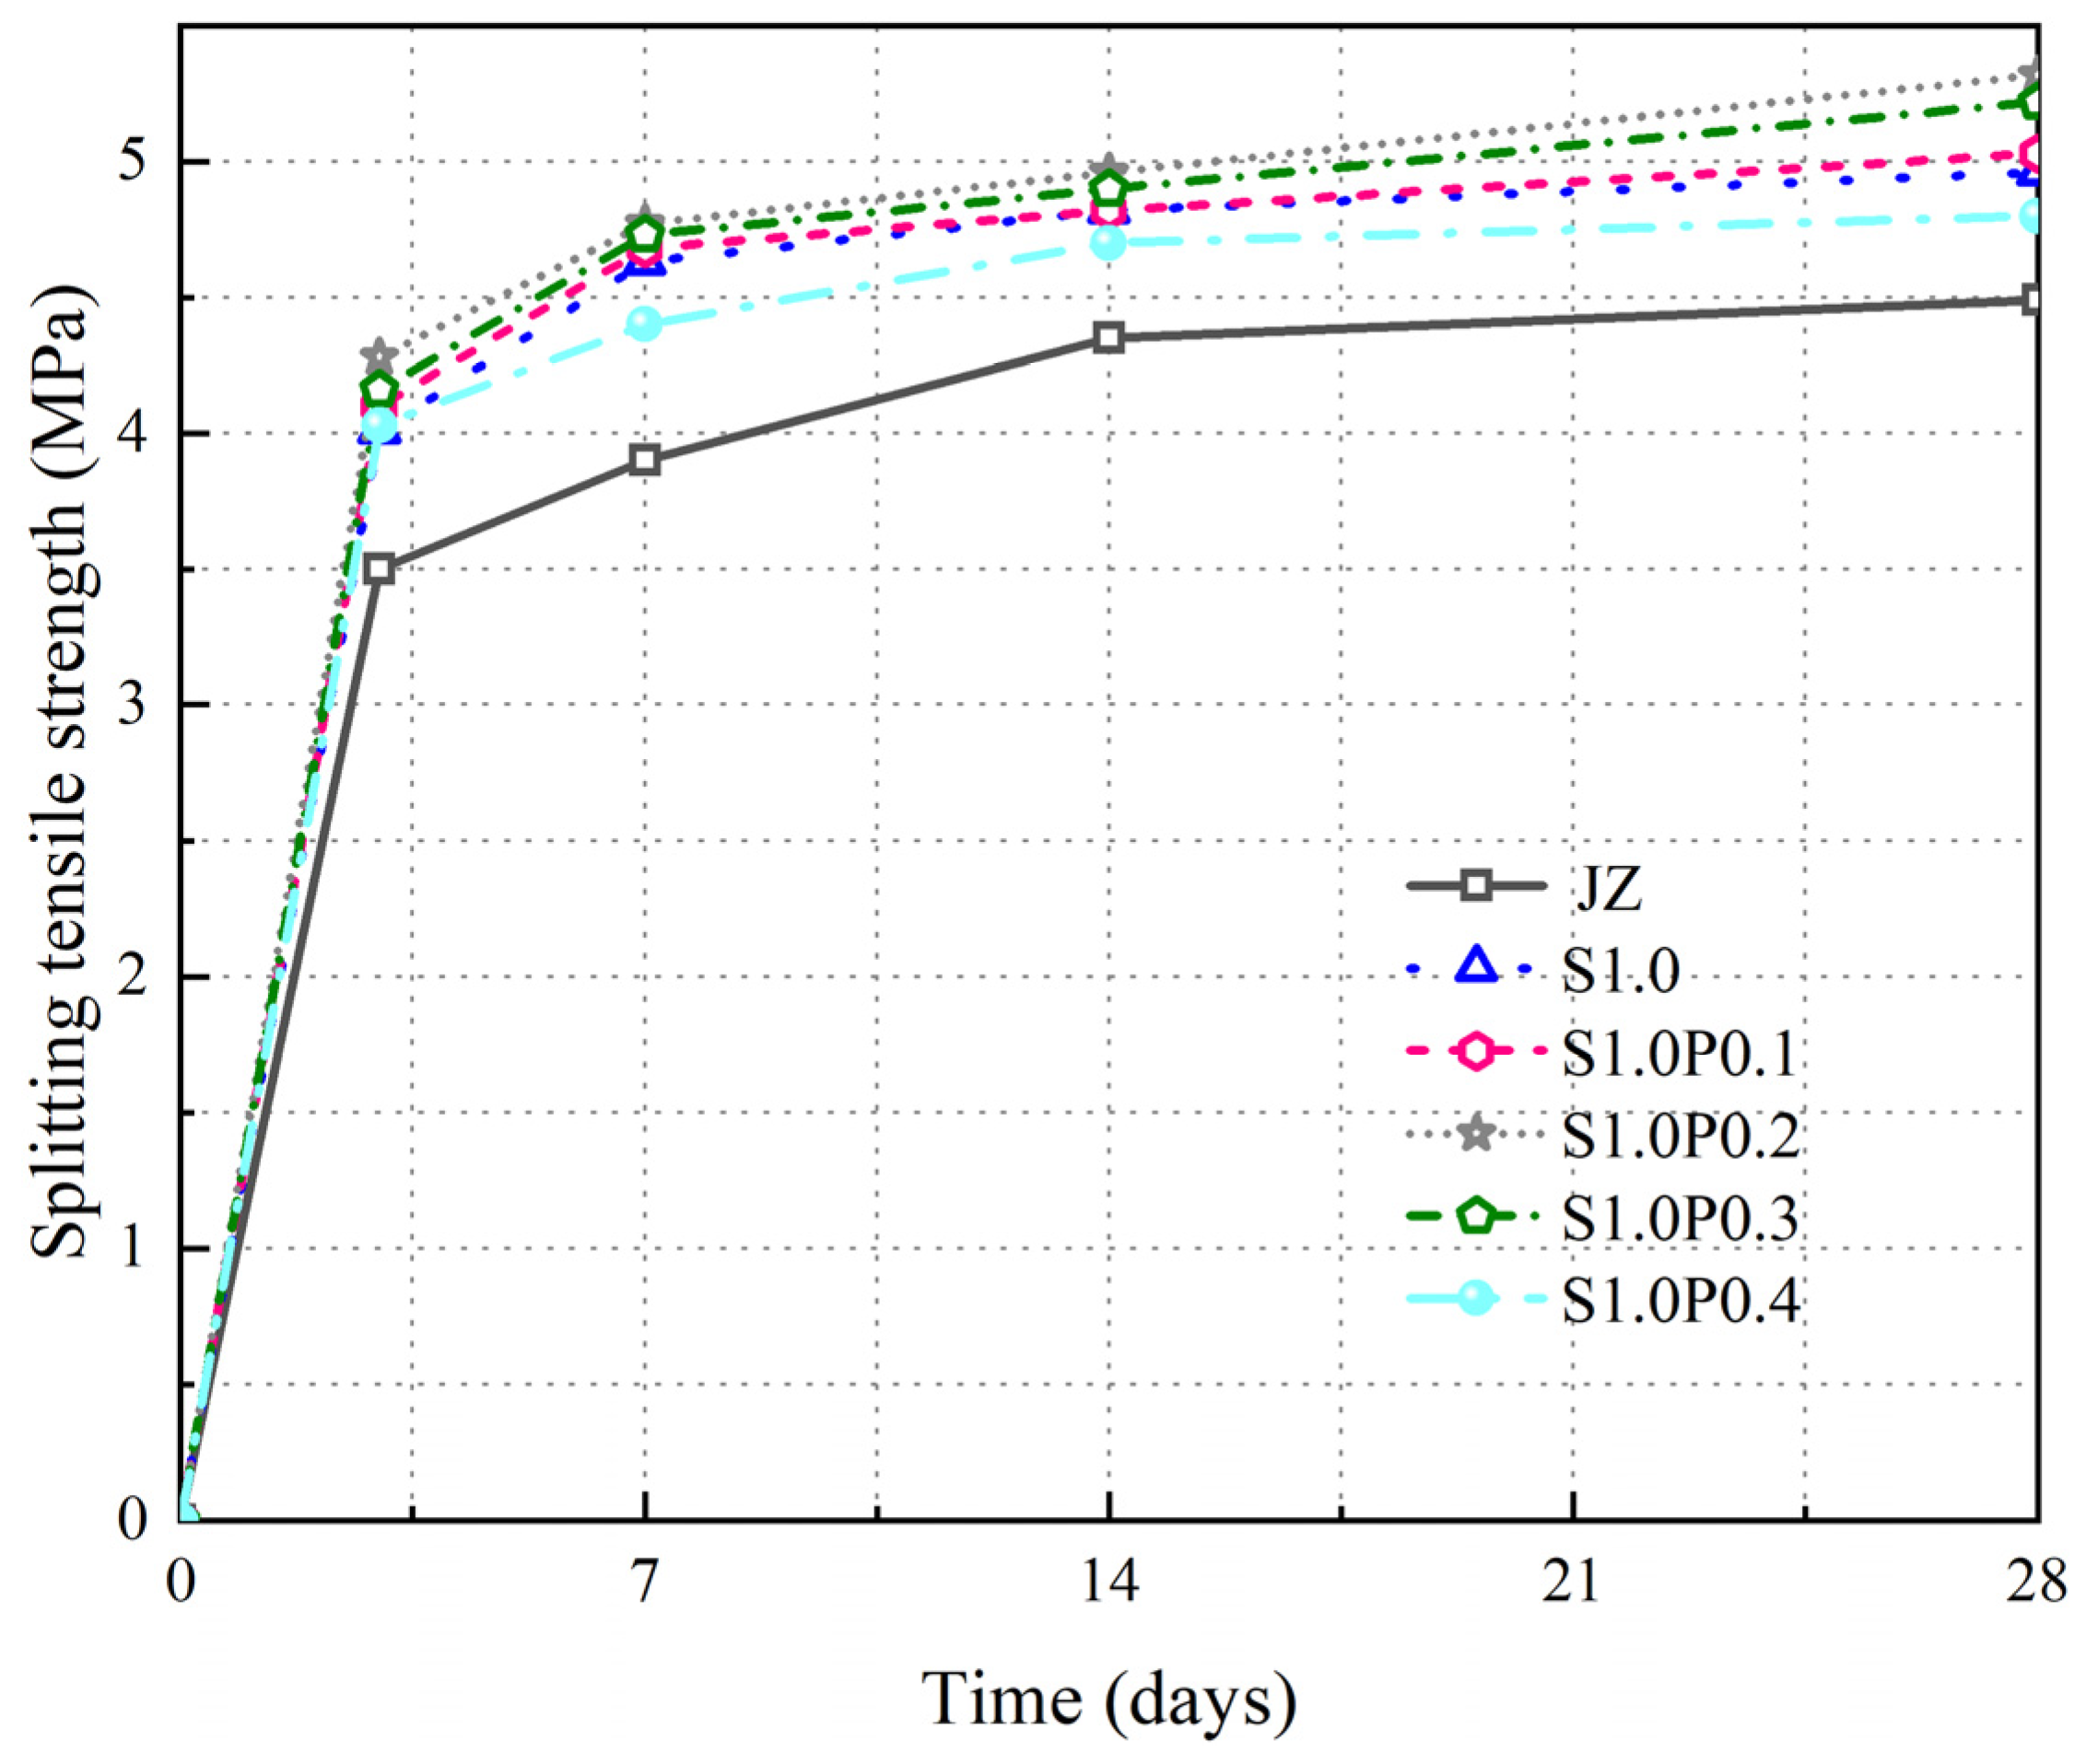
- With an increasing age, there was a gradual rise in the of the concrete. Notably, the most rapid increase occurred between days 3 and 7, reaching over 80% of the concrete’s at day 28.
- (2)
- At each age, initially increased followed by a decrease as the steel fiber content grew. The peak was reached at 1.0% steel fiber content. At day 28, in comparison to JZ, the of S1.0 rose from 4.49 MPa to 4.96 MPa, marking a 10.5% increase.
3.2.2. Changes in the of S-PVA HFRC
- (1)
- The of S-PVA HFRC steadily increased as curing time extended.
- (2)
- S-PVA HF additionally enhanced for concrete featuring single steel fibers. Across different curing durations, the peak fts for S-PVA HFRC emerged at 1.0% steel fiber content and 0.2% PVA fiber content. This combination resulted in an 18.5% strength increase over the base concrete after 28 days of curing. However, surpassing 0.2% PVA fiber content led to a reduced of concrete.
3.3. Stress–Strain Relationship of Concrete
3.3.1. Analysis of Apparent Shape in Uniaxial Compression Test of SFRC
- (1)
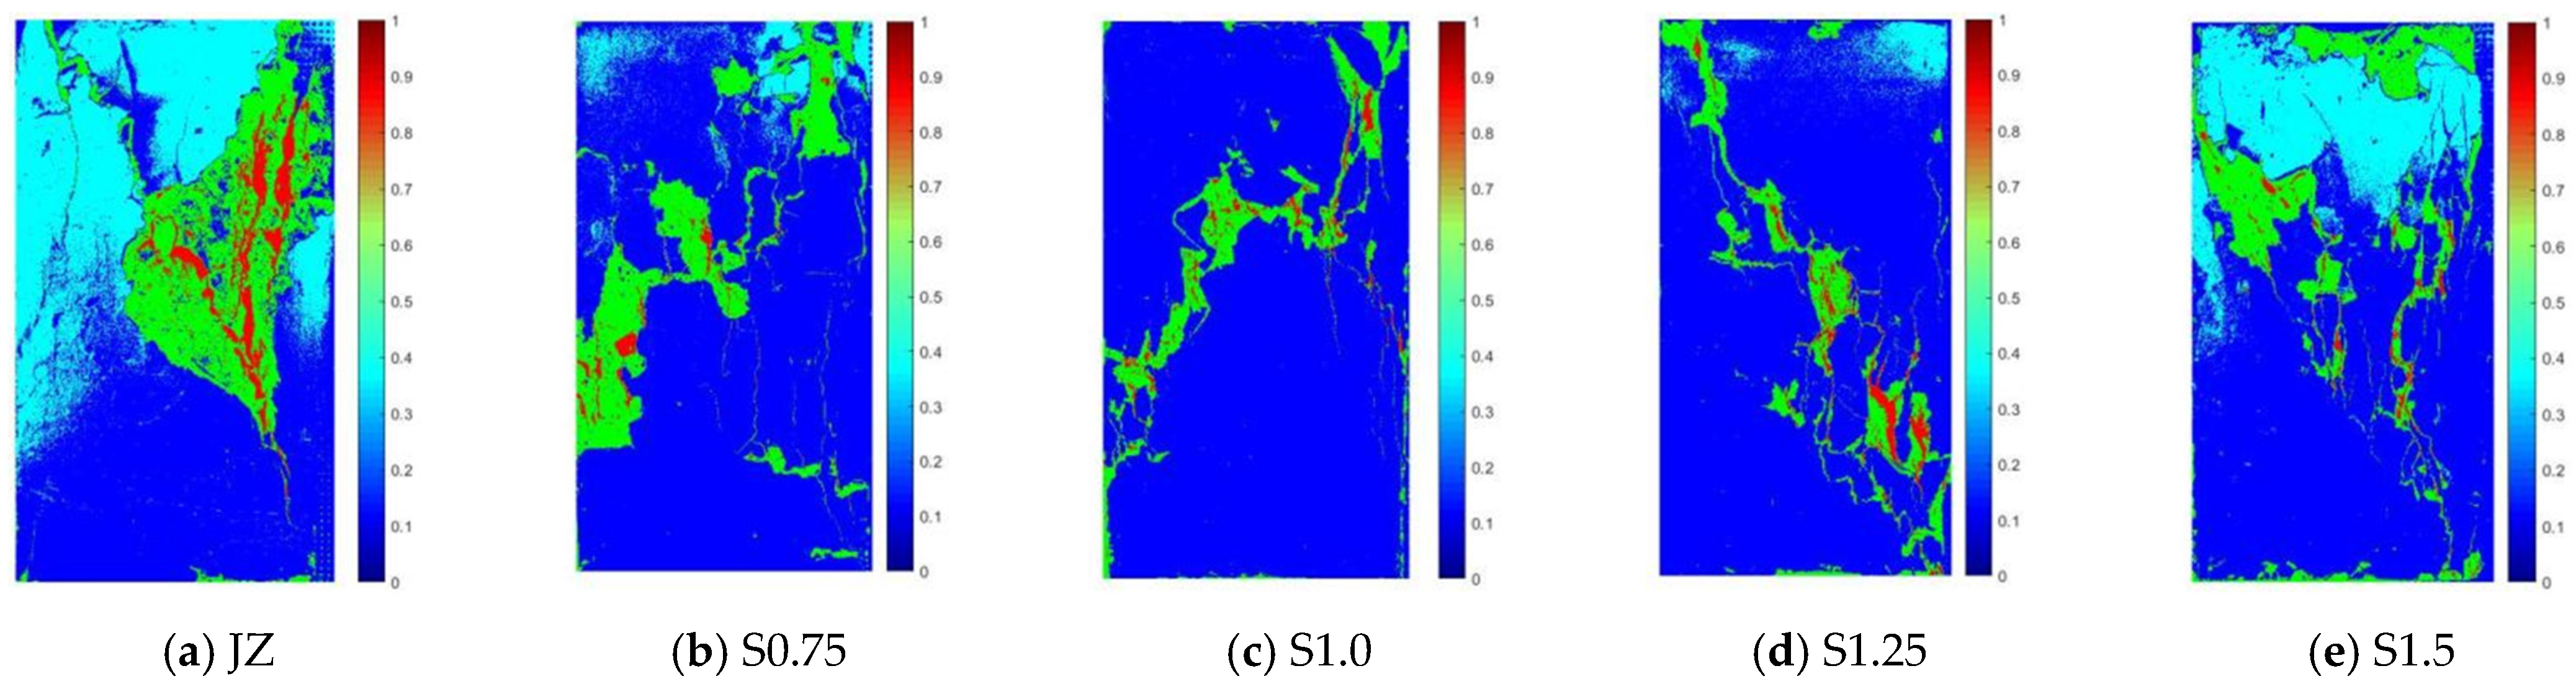
- Both the reference concrete and SFRC generated “X”-shaped through-cracks along the diagonal direction after being compressed. Many minute cracks perpendicular to the main crack appeared near the main crack.
- (2)
- After JZ concrete was compressed, there were a lot of spalling on the surface, and the crack area was the largest. After the addition of steel fibers, the crack area was significantly reduced. The crack area and crack depth of S1.0 and S1.25 concrete were the smallest.
3.3.2. Analysis of the Apparent Morphology of the Uniaxial Compression Test of S-PVA HFRC
3.3.3. Stress–Strain Relationship of SFRC
- (1)
- With increasing steel fiber content, the peak strain rose gradually, while peak stress exhibited an initial rise followed by a decrease. Notably, the introduction of steel fibers minimally affected ; it remained nearly identical in the curve’s initial ascent, while exerting a considerable influence on the descending phase.
- (2)
- The area enclosed by the curve and initially expanded and then contracted as the steel fiber content increased, as indicated in Table 3.
- (1)
- With prolonged curing age, the area encompassed by the S1.0 curve progressively enlarged, accompanied by improved . Nevertheless, the fundamental trajectory of the curve remained largely consistent.
- (2)
- The peak stress exhibited a gradual increment, and the incline of the curve’s rising segment experienced a slight rise. Simultaneously, the of the concrete increased, as delineated in Table 4.
3.3.4. Stress–Strain Relationship of S-PVA HFRC
- (1)
- PVA fibers exerted a certain positive influence on peak stress, albeit with limitations. However, they notably augmented the slope of the curve’s rising segment. Peak stress for S1.0P0.1 and S1.0P0.4 was slightly below that of S1.0.
- (2)
- At the 28-day mark, for S-PVA HFRC initially increased and then decreased with the rising PVA dosage. The largest for S-PVA HFRC occurred at 1.0% steel fiber content and 0.2% PVA fiber content, as detailed in Table 4.
- (1)
- The area enclosed by the S1.0P0.2 curve progressively expanded, concurrently improving as the curing age increased.
- (2)
- A gradual escalation was discerned in peak stress and the slope of the curve’s ascending portion. likewise increased, as highlighted in Table 5. Notably, the curve’s overall trajectory closely aligned with that of S1.0.
3.4. Concrete Shrinkage Performance
3.4.1. Early Shrinkage Behavior of SFRC
- (1)
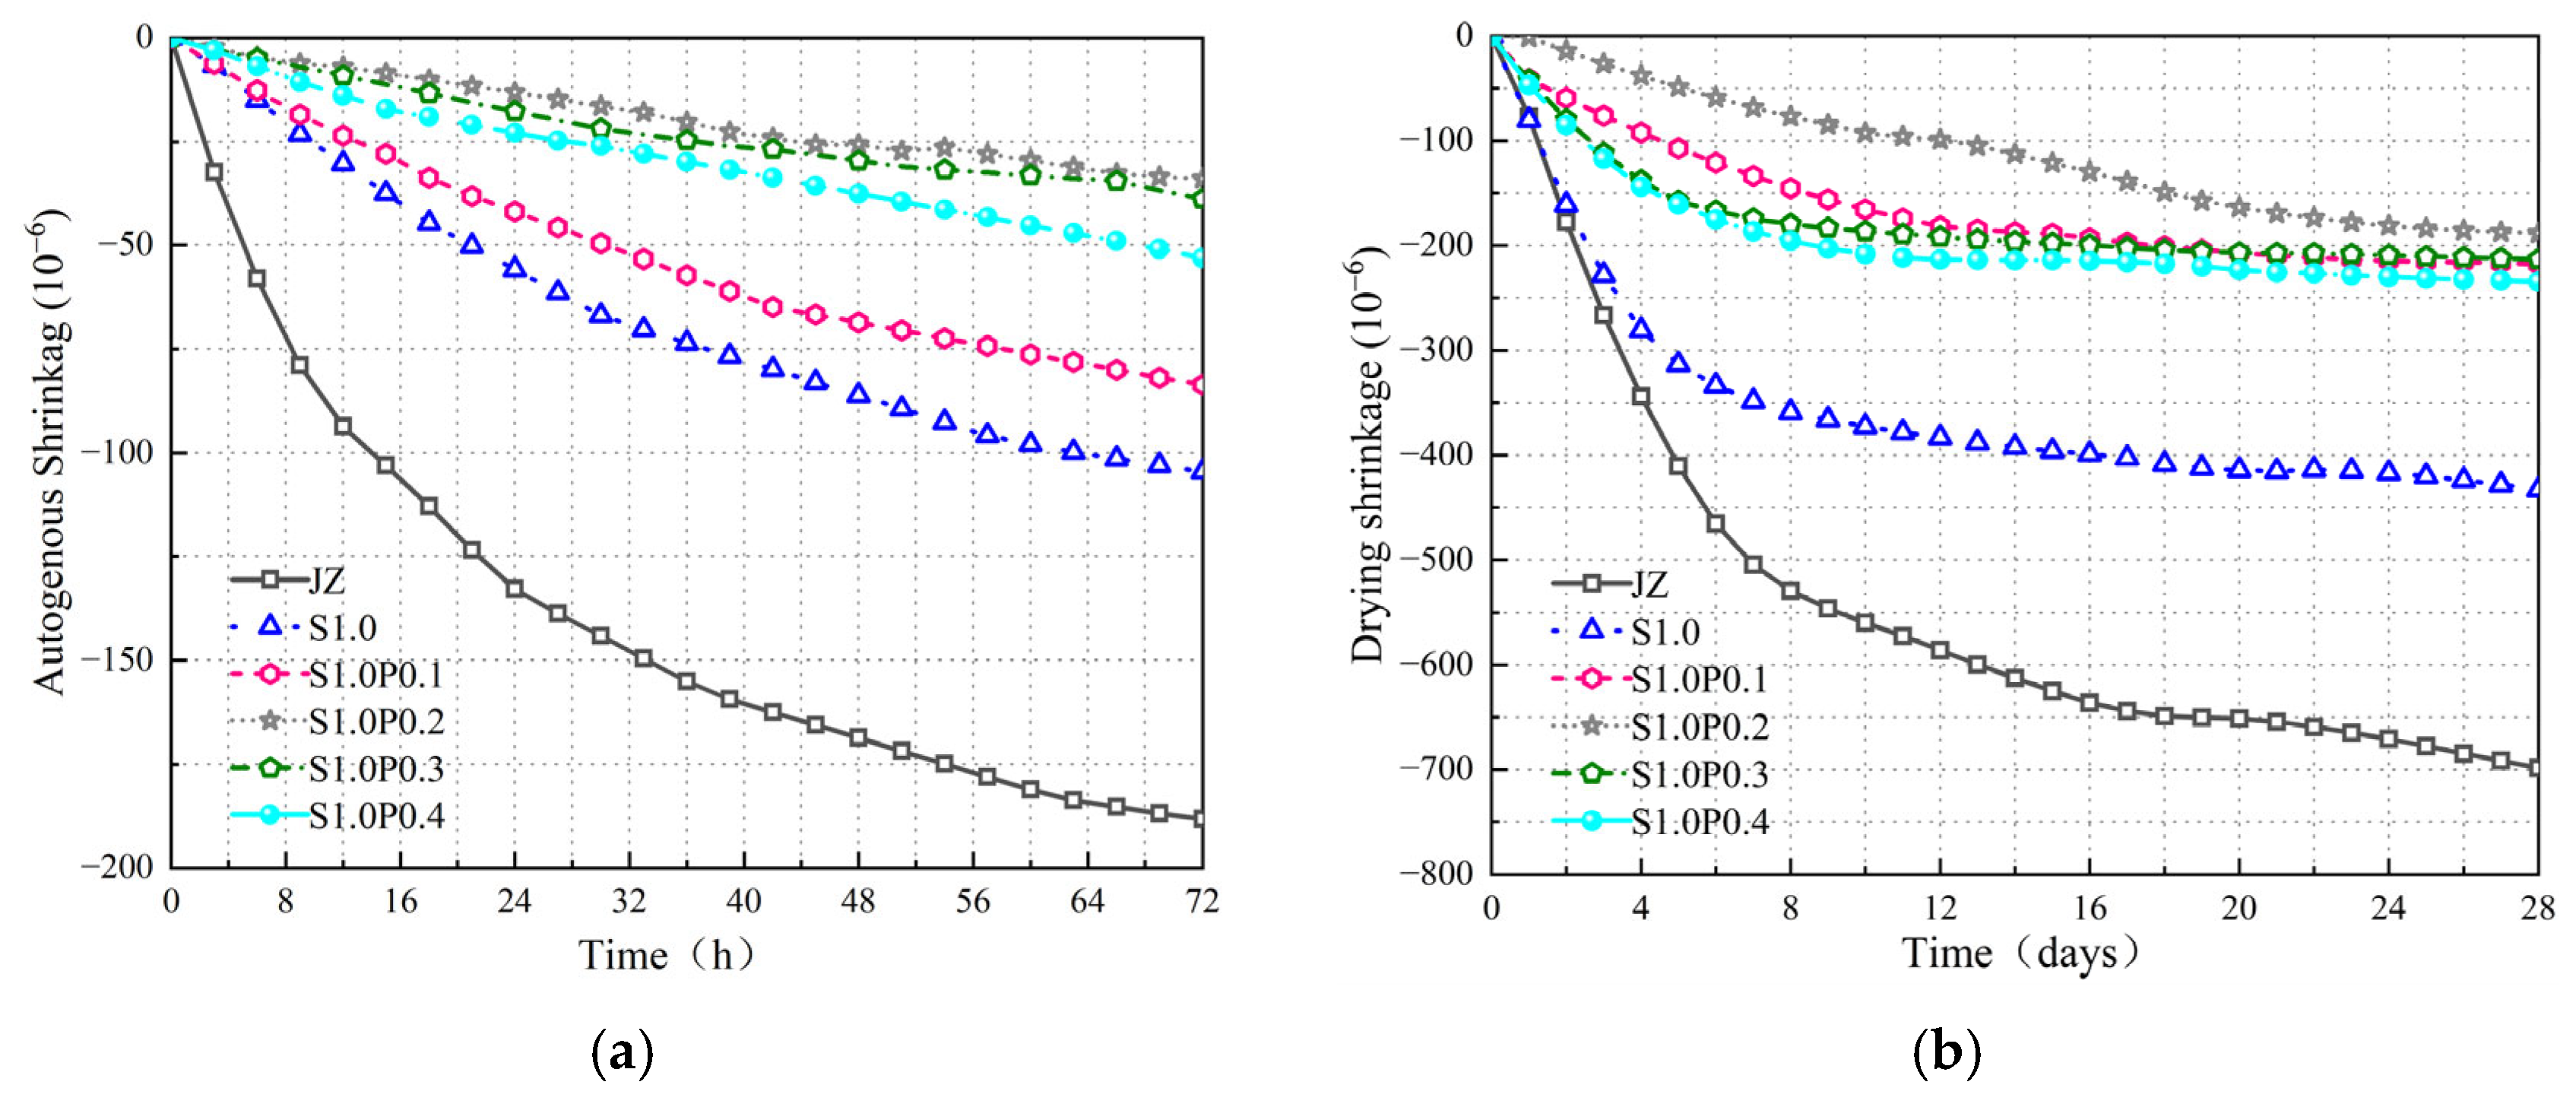
- Figure 18a shows that most of the concrete’s occurred within the first three days after initial setting. As cement hydration progressed, the of concrete exhibited a trend of rapid decrease followed by a slower decrease.
- (2)
- Figure 18b indicates that the of concrete lasted for a relatively long duration, and there was still occurring at 28 days.
- (3)
- The inclusion of steel fibers reduced both the and of concrete. With an increase in the amount of steel fiber content, the and initially decreased and then increased. Among them, S1.0 had the smallest rate, and at 28 days, compared to JZ, S1.0 showed a reduction of 44.5% and 38% in and rates, respectively.
3.4.2. Early Shrinkage Behavior of S-PVA HFRC
- (1)
- The and trends of S-PVA HFRC were not significantly different from those of SFRC.
- (2)
- However, the inclusion of S-PVA HF further reduced the concrete shrinkage. As the content of PVA fibers in the hybrid mix increased, and initially decreased and then increased. The minimum shrinkage occurred when the concrete contained 1.0% steel fibers and 0.2% PVA fibers. Compared to S1.0, and were reduced by 67.6% and 56.5%, respectively.
4. Comprehensive Evaluation of Concrete Cracking Resistance Performance
4.1. Variation Law of Cracking Resistance Performance in SFRC
- (1)
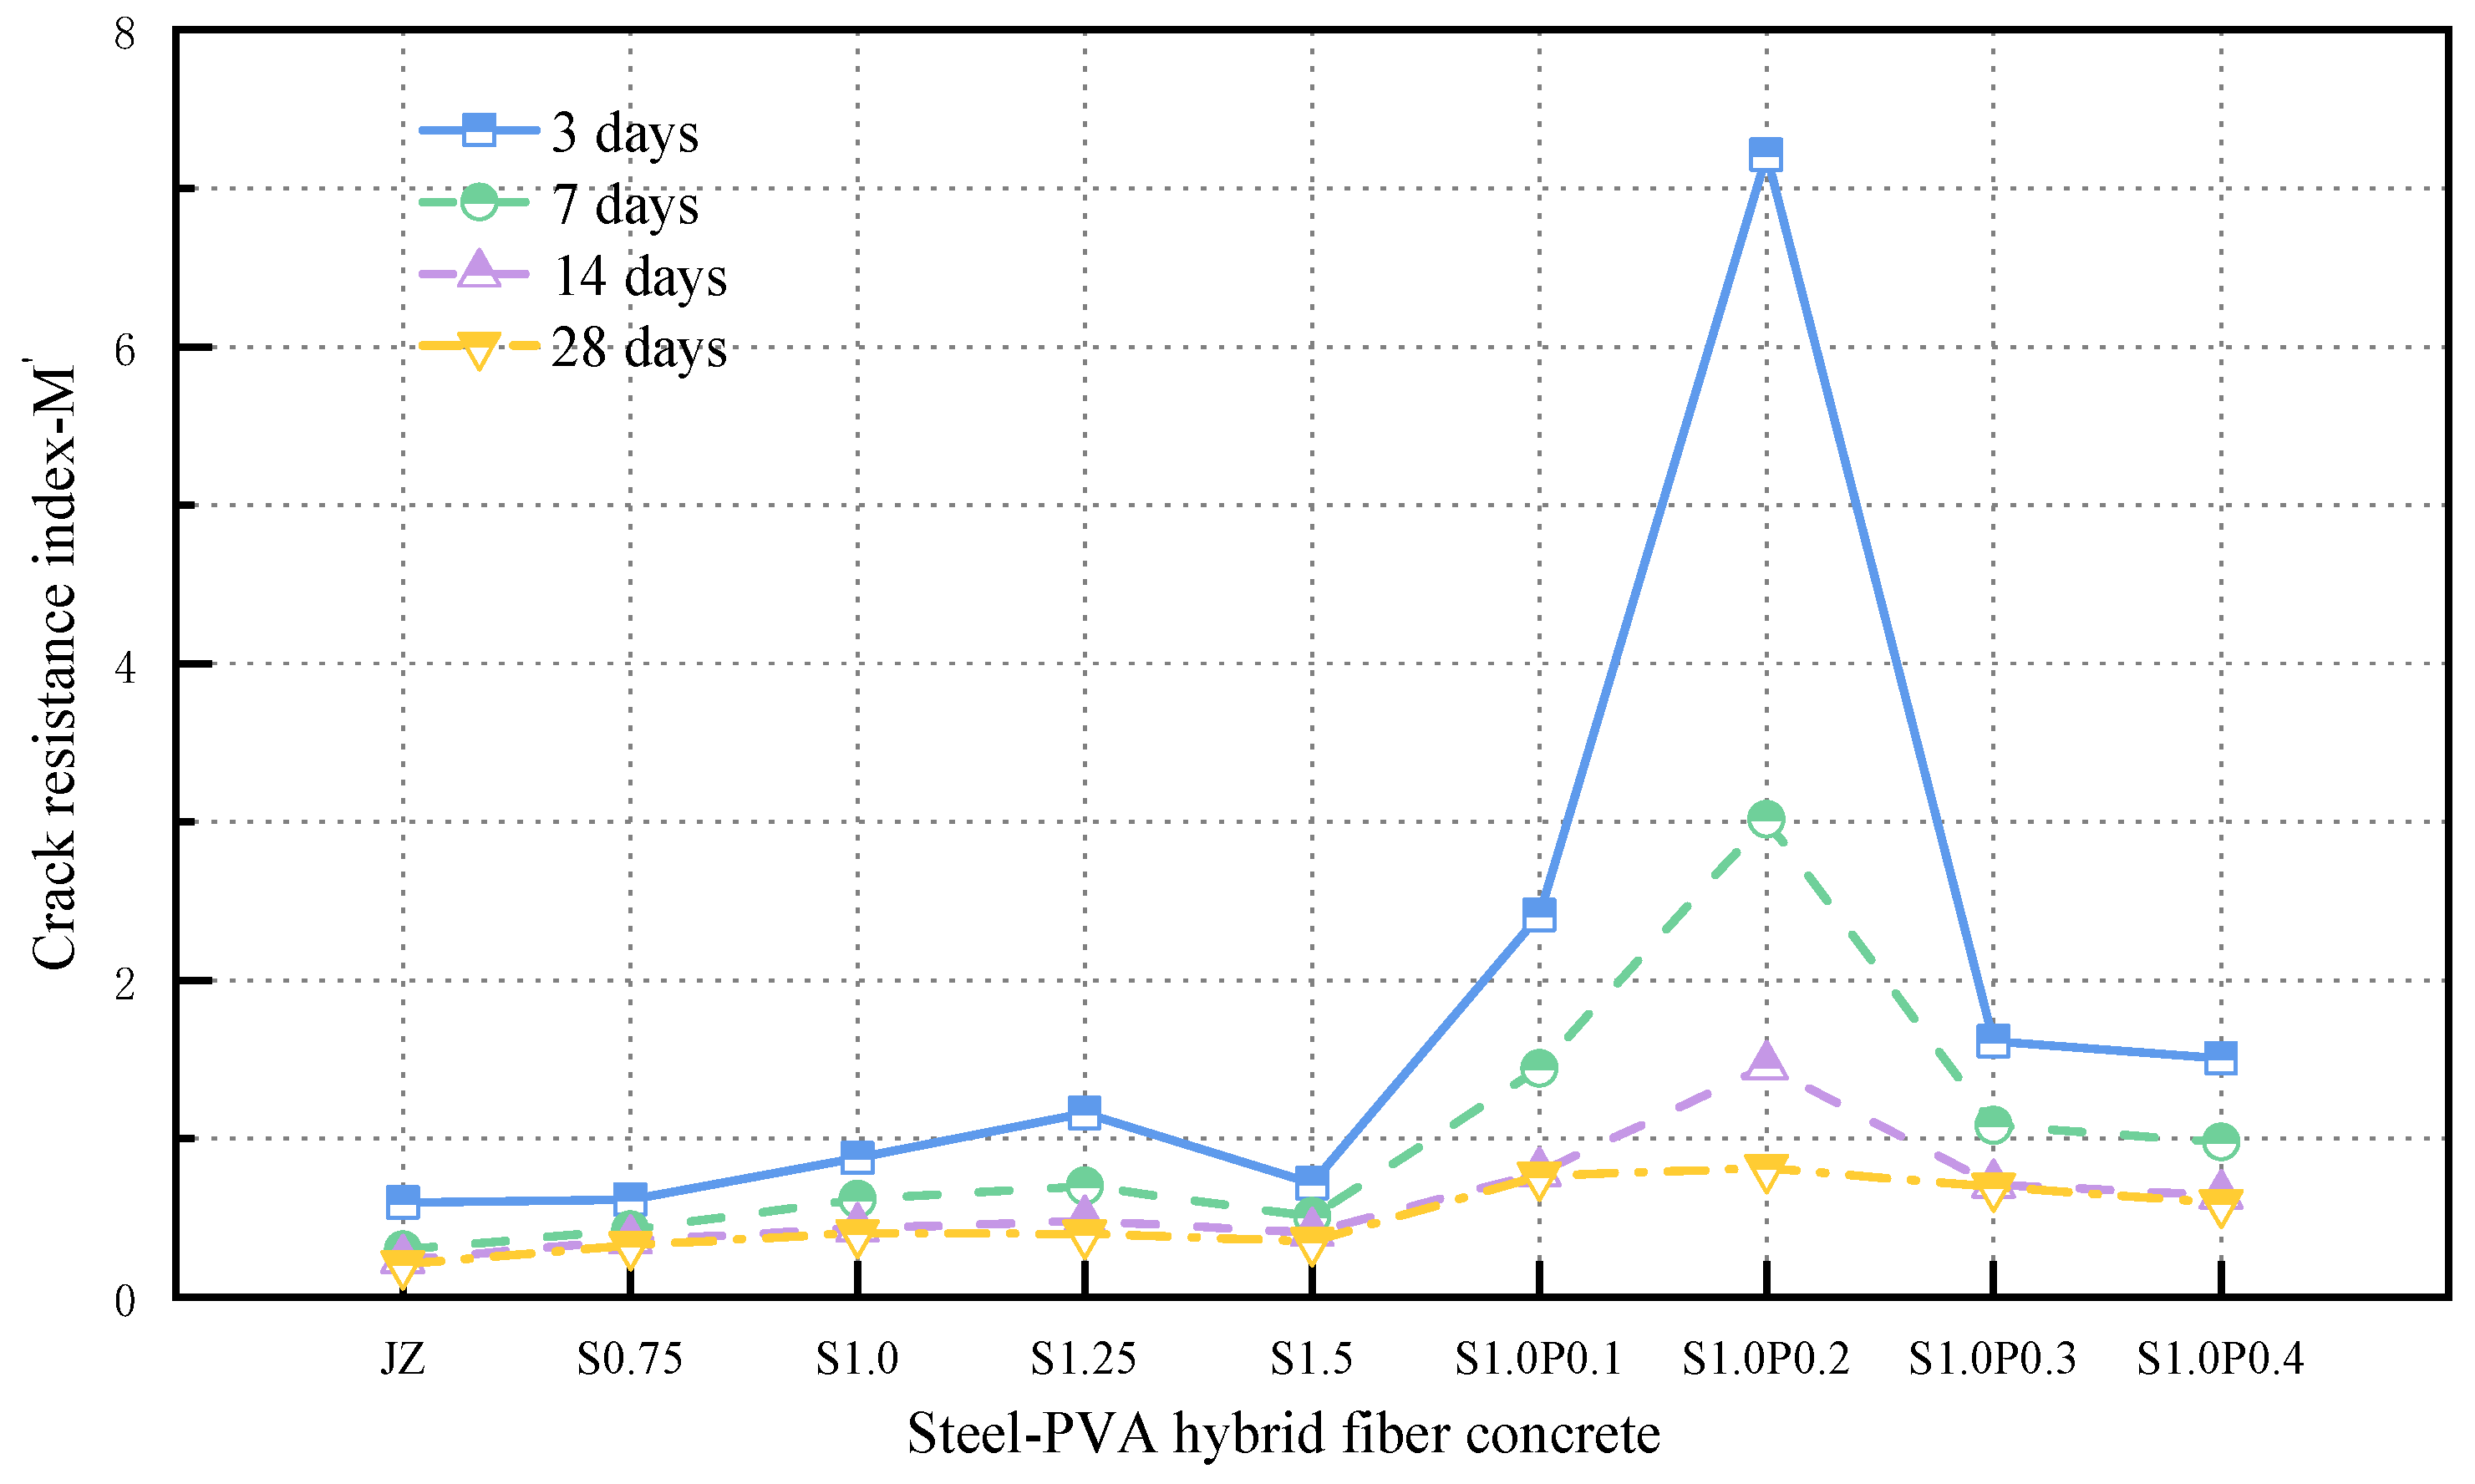
- At different curing ages, the cracking resistance performance index of concrete generally decreased as the curing age increased.
- (2)
- At the same curing age, the cracking resistance performance index first increased and then decreased with an increase in the steel fiber content. At 1.0% steel fiber content, the cracking resistance performance index of the SFRC was the highest. Compared to JZ, the cracking resistance performance at 3 days, 7 days, 14 days, and 28 days improved by 52.5%, 96.9%, 64.7%, and 90%, respectively.
4.2. Variation Law of Cracking Resistance Performance in S-PVA HFRC
- (1)
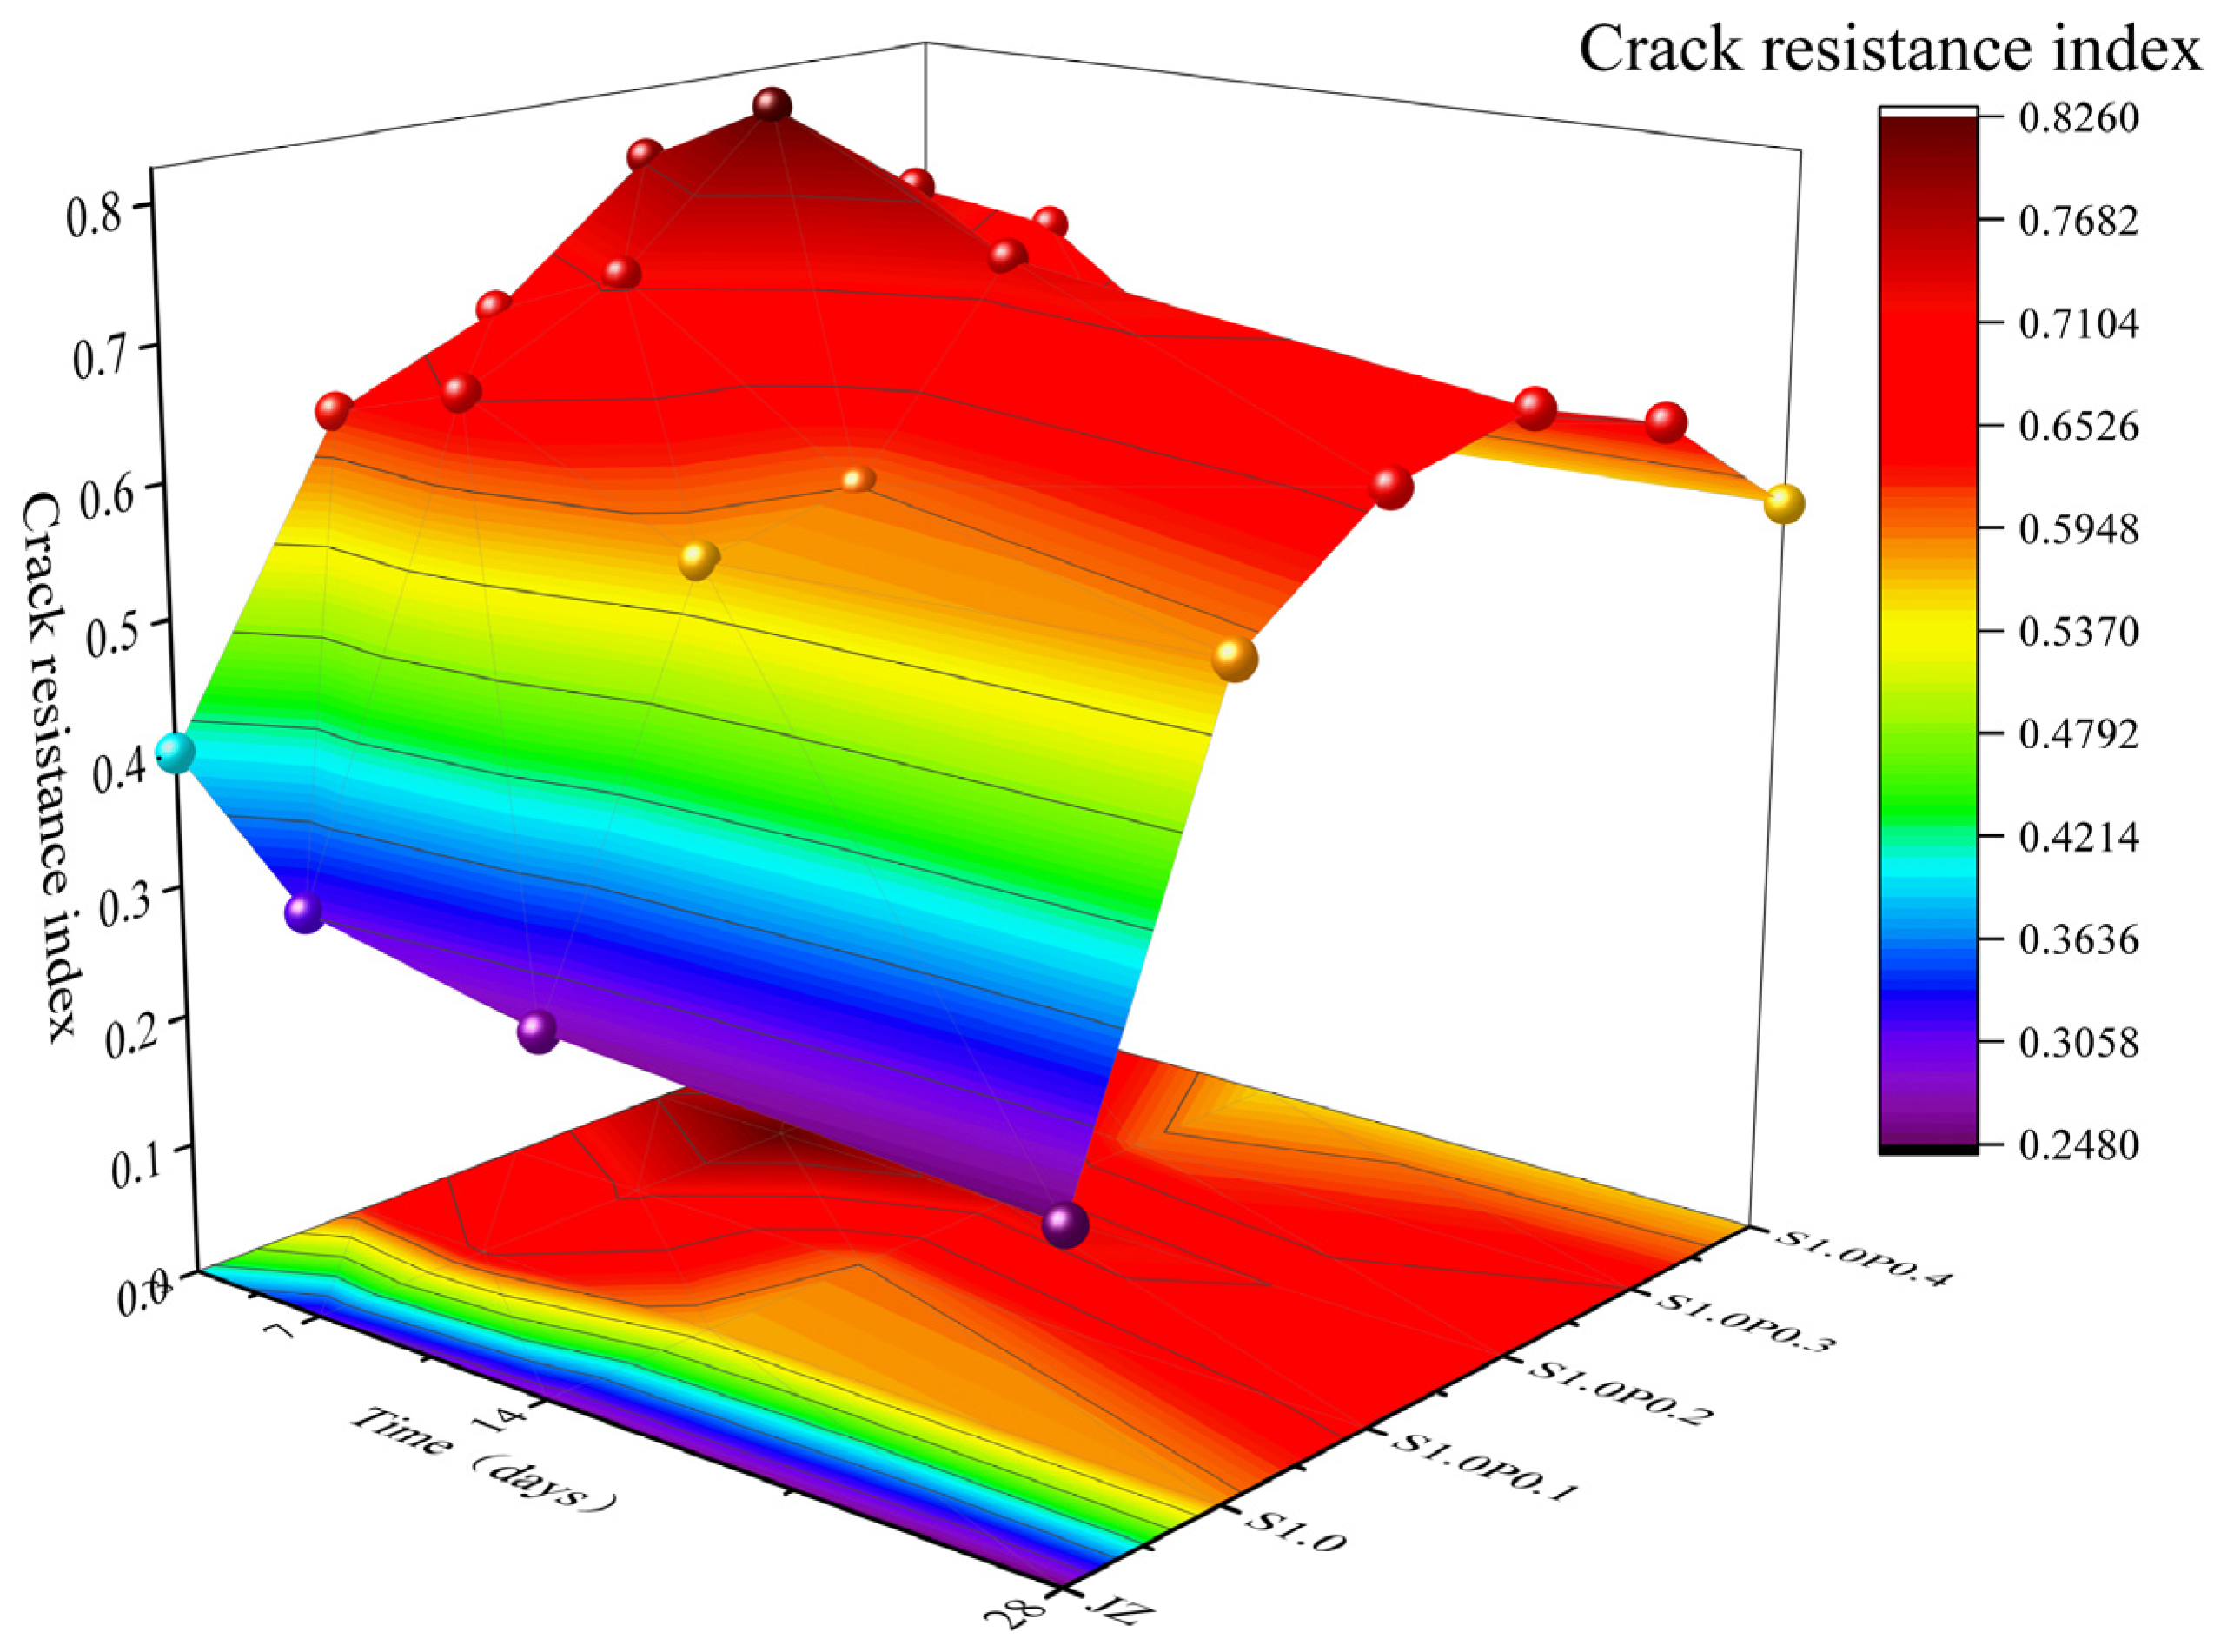
- With the increase in curing age, the cracking resistance performance index of S-PVA HFRC gradually decreased.
- (2)
- At the same curing age, as the PVA fiber content increased in the steel–PVA hybrid mix, the cracking resistance performance first increased and then decreased. At 0.2% PVA fiber content, S-PVA HFRC exhibited the best cracking resistance performance. Compared to S1.0, the cracking resistance performance at 3 days, 7 days, 14 days, and 28 days improved by 24.5%, 26.1%, 30%, and 19.3%, respectively. Compared to the reference concrete, the maximum improvement reached 143%.
4.3. Cracking Resistance Performance Evaluation
- (1)
- With the increase in curing age, the cracking resistance index gradually decreased.
- (2)
- The concrete’s cracking resistance performance was optimal when it contained 0.2% PVA fiber and 1.0% steel fiber in the hybrid mix.
5. Conclusions
- Beyond three days of curing, the cracking resistance performance of concrete decreases with an increase in curing age.
- The concrete exhibits the highest cracking resistance performance at 1.0% steel fiber content and 0.2% PVA fiber content in the mix. Compared to the reference concrete, the maximum improvement is 143%. This combination is recommended for enhancing the cracking resistance of panel concrete.
- The evaluation model of the multi-factor cracking resistance index based on AHP is reliable, as confirmed by the validation of the cracking resistance index calculated using the cracking factor.
- Considering the complexity of the actual working conditions of panel concrete in real water conservancy projects, more experimental studies close to the actual situation on the cracking resistance of concrete under constraint conditions are needed. This will also be the direction of future research.
Author Contributions
Funding
Institutional Review Board Statement
Informed Consent Statement
Data Availability Statement
Conflicts of Interest
Abbreviations
| AHP | Analytic Hierarchy Process |
| S-PVA HF | Steel–PVA hybrid fibers |
| SFRC | Steel fiber-reinforced concrete |
| HFRC | Hybrid fiber-reinforced concrete |
| CFRD | Concrete-faced rockfill dam |
| Compressive strength | |
| Axial compressive strength | |
| Splitting tensile strength | |
| Elastic modulus of concrete | |
| Area under the full axial load displacement curve with axial deformation from 0 to L0 × 1.0%mm (compression energy). | |
| Autogenous shrinkage | |
| Drying shrinkage |
References
- Wang, Z.J.; Liu, S.H.; Vallejo, L.; Wang, L.J. Numerical analysis of the causes of face slab cracks in Gongboxia rockfill dam. Eng. Geol. 2014, 181, 224–232. [Google Scholar] [CrossRef]
- de Pinto, N.L.S. Very high CFRDs: Behaviour and design features. Int. J. Hydropower Dams 2008, 15, 43–49. [Google Scholar]
- Zhou, W.; Hua, J.; Chang, X.; Zhou, C. Settlement analysis of the Shuibuya concrete-face rockfill dam. Comput. Geotech. 2011, 38, 269–280. [Google Scholar] [CrossRef]
- Qu, Y.Q.; Zou, D.G.; Kong, X.J.; Liu, J.M.; Zhang, Y.; Yu, X. Seismic damage performance of the steel fiber reinforced face slab in the concrete-faced rockfill dam. Soil Dyn. Earthq. Eng. 2019, 119, 320–330. [Google Scholar] [CrossRef]
- Baak, S.H.; Cho, G.C.; Song, K.I. Stability analysis on the concrete slab of the highest concrete-faced rock-fill dam in South Korea. Geomech. Eng. 2017, 13, 881–892. [Google Scholar]
- The 14th Five Year Plan for Water Safety Assurance. China Water Resour. 2022, 2, 11–24. (In Chinese)
- Yousefieh, N.; Joshaghani, A.; Hajibandeh, E.; Shekarchi, M. Influence of fibers on drying shrinkage in restrained concrete. Constr. Build. Mater. 2017, 148, 833–845. [Google Scholar] [CrossRef]
- Noushini, A.; Samali, B.; Vessalas, K. Effect of polyvinyl alcohol (PVA) fibre on dynamic and material properties of fibre reinforced concrete. Constr. Build. Mater. 2013, 49, 374–383. [Google Scholar] [CrossRef]
- Banthia, N.; Gupta, R. Influence of polypropylene fiber geometry on plastic shrinkage cracking in concrete. Cem. Concr. Res. 2006, 36, 1263–1267. [Google Scholar] [CrossRef]
- Zhang, P.; Wang, K.X.; Wang, J.; Guo, J.J.; Hu, S.W.; Ling, Y.F. Mechanical properties and prediction of fracture parameters of geopolymer/alkali-activated mortar modified with PVA fiber and nano-SiO2. Ceram. Int. 2020, 46, 20027–20037. [Google Scholar] [CrossRef]
- Zhang, P.; Zheng, Y.X.; Wang, K.J.; Zhang, K.X. Combined influence of nano-CaCO3 and polyvinyl alcohol fibers on fresh and mechanical performance of concrete incorporating fly ash. Struct. Concr. 2019, 21, 724–734. [Google Scholar] [CrossRef]
- Han, J.H.; Zhao, M.M.; Chen, J.Y.; Lan, X.F. Effects of steel fiber length and coarse aggregate maximum size on mechanical properties of steel fiber reinforced concrete. Constr. Build. Mater. 2019, 209, 577–591. [Google Scholar] [CrossRef]
- Dong, S.; Zhao, Q.; Zhu, H. Mechanical properties and constitutive model of steel fiber-reinforced rubberized concrete. Constr. Build. Mater. 2022, 327, 126720. [Google Scholar] [CrossRef]
- Fu, C.Q.; Ye, H.L.; Wang, K.J.; Zhu, K.Q.; He, C.Y. Evolution of mechanical properties of steel fiber-reinforced rubberized concrete (FR-RC). Compos. B Eng. 2019, 160, 158–166. [Google Scholar] [CrossRef]
- Mo, K.H.; Yeoh, K.H.; Bashar, I.I.; Alengaram, U.J.; Jumaat, M.Z. Shear behaviour and mechanical properties of steel fibre-reinforced cement-based and geopolymer oil palm shell lightweight aggregate concrete. Constr. Build. Mater. 2017, 148, 369–375. [Google Scholar] [CrossRef]
- Abbass, W.; Khan, M.I.; Mourad, S. Evaluation of mechanical properties of steel fiber reinforced concrete with different strengths of concrete. Constr. Build. Mater. 2018, 168, 556–569. [Google Scholar] [CrossRef]
- Chylík, R.; Fládr, J.; Bílý, P.; Trtík, T.; Vráblík, L. An analysis of the applicability of existing shrinkage prediction models to concretes containing steel fibres or crumb rubber. J. Build. Eng. 2019, 24, 100729. [Google Scholar] [CrossRef]
- Al-Kamyani, Z.; Figueiredo, F.P.; Hu, H.; Guadagnini, M.; Pilakoutas, K. Shrinkage and flexural behaviour of free and restrained hybrid steel fibre reinforced concrete. Constr. Build. Mater. 2018, 189, 1007–1018. [Google Scholar] [CrossRef]
- Han, J.H.; Liu, Z.Y.; Zhang, C.F. Experimental study on impact resistance of steel-fiber-reinforced two-grade aggregate concrete. Constr. Build. Mater. 2023, 373, 130901. [Google Scholar] [CrossRef]
- Bandelj, B.; Saje, D.; Šušteršič, J.; Lopatič, J.E.; Saje, F. Free shrinkage of high performance steel fiber reinforced concrete. J. Test. Eval. 2011, 39, 166–176. [Google Scholar] [CrossRef]
- Miao, B.; Chern, J.C.; Yang, C.A. Influences of fiber content on properties of self-compacting steel fiber reinforced concrete. J. Chin. Inst. Eng. 2003, 26, 523–530. [Google Scholar] [CrossRef]
- Zheng, X.Y.; Ji, T.; Easa, S.M.; Zhang, B.B.; Jiang, Z.L. Tensile basic creep behavior of lightweight aggregate concrete reinforced with steel fiber. Constr. Build. Mater. 2019, 200, 356–367. [Google Scholar] [CrossRef]
- Shen, D.; Liu, C.; Kang, J.; Yang, Q.; Li, M.; Li, C.; Zeng, X. Early-age autogenous Shrinkage and tensile creep of hooked-end steel fiber reinforced concrete with different thermal treatment temperatures. Cem. Concr. Compos. 2022, 131, 104550. [Google Scholar] [CrossRef]
- Shen, D.; Kang, J.; Yi, X.; Zhou, L.; Shi, X. Effect of double hooked-end steel fiber on early-age cracking potential of high strength concrete in restrained ring specimens. Constr. Build. Mater. 2019, 223, 1095–1105. [Google Scholar] [CrossRef]
- Wang, J.Q.; Dai, Q.L.; Si, R.Z.; Guo, S.C. Investigation of properties and performances of Polyvinyl Alcohol (PVA) fiber-reinforced rubber concrete. Construct. Build. Mater. 2018, 193, 631–642. [Google Scholar] [CrossRef]
- Wang, Z.B.; Li, P.F.; Han, Y.D.; Hao, R.S.; Liu, W.K. Dynamic compressive properties of seawater coral aggregate concrete (SCAC) reinforced with mono or hybrid fibers. Constr. Build. Mater. 2022, 340, 127801. [Google Scholar] [CrossRef]
- Junwei, Z.; Shijie, L.; Hongjian, P. Experimental investigation of multiscale hybrid fibres on the mechanical properties of high-performance concrete. Constr. Build. Mater. 2021, 299, 123895. [Google Scholar] [CrossRef]
- Wang, L.; Zhou, S.H.; Shi, Y.; Tang, S.W.; Chen, E. Effect of silica fume and PVA fiber on the abrasion resistance and volume stability of concrete. Compos. B Eng. 2017, 130, 28–37. [Google Scholar] [CrossRef]
- Wang, Q.; Zhou, Z.H.; Zhang, J.; Fang, Z.S.; Lai, M.H. Impact of polyvinyl alcohol fiber on the full life-cycle shrinkage of cementitious composite. J. Build. Eng. 2023, 63, 105463. [Google Scholar] [CrossRef]
- Vafaei, D.; Ma, X.; Hassanli, R.; Duan, J.; Zhuge, Y. Microstructural behaviour and shrinkage properties of high-strength fiber-reinforced seawater sea-sand concrete. Constr. Build. Mater. 2022, 320, 126222. [Google Scholar] [CrossRef]
- Pan, Z.; Zhu, Y.; Zhang, D.; Chen, N.; Yang, Y.; Cai, X. Effect of expansive agents on the workability, crack resistance and durability of shrinkage-compensating concrete with low contents of fibers. Constr. Build. Mater. 2020, 259, 119768. [Google Scholar] [CrossRef]
- Afroughsabet, V.; Teng, S. Experiments on drying shrinkage and creep of high performance hybrid-fiber-reinforced concrete. Cem. Concr. Compos. 2020, 106, 103481. [Google Scholar] [CrossRef]
- Passuello, A.; Moriconi, G.; Shah, S.P. Cracking behavior of concrete with shrinkage reducing admixtures and PVA fibers. Cem. Concr. Compos. 2009, 31, 699–704. [Google Scholar] [CrossRef]
- Wang, L.; He, T.S.; Zhou, Y.X.; Tang, S.W.; Tan, J.J.; Liu, Z.T.; Su, J.W. The influence of fiber type and length on the cracking resistance, durability and pore structure of face slab concrete. Constr. Build. Mater. 2021, 282, 122706. [Google Scholar] [CrossRef]
- Sun, L.; Hao, Q.; Zhao, J.; Wu, D.; Yang, F. Stress strain behavior of hybrid steel-PVA fiber reinforced cementitious composites under uniaxial compression. Constr. Build. Mater. 2018, 188, 349–360. [Google Scholar] [CrossRef]
- Xiao, L.; Chen, P.; Huang, J.; Peng, S.; Yang, Z. Compressive behavior of reinforced steel-PVA hybrid fiber concrete short columns after high temperature exposure. Constr. Build. Mater. 2022, 342, 127935. [Google Scholar] [CrossRef]
- SL228-2013; Code for Design of Concrete Face Rockfill Dams. Chinese National Standard: Beijing, China, 2015.
- DL/T 5330−2015; Code for Mix Proportion Design of Hydraulic Concrete. Chinese National Standard: Beijing, China, 2015.
- JG/T 472-2015; Steel Fiber Reinforced Concrete. Chinese National Standard: Beijing, China, 2015.
- SL352-2020; Hydraulic Concrete Specification Concrete Test. Chinese National Standard: Beijing, China, 2020.
- GB/T 50082-2009; Standard for Test Methods of Long-Term Performance and Durability of Ordinary Concrete. Chinese National Standard: Beijing, China, 2009.
- Shi, X.; Park, P.; Rew, Y.; Huang, K.; Sim, C. Constitutive behaviors of steel fiber reinforced concrete under uniaxial compression and tension. Constr. Build. Mater. 2020, 233, 117316. [Google Scholar] [CrossRef]
- Iqbal, S.; Ali, I.; Room, S.; Khan, S.A.; Ali, A. Enhanced mechanical properties of fiber reinforced concrete using closed steel fibers. Mater. Struct. 2019, 52, 56. [Google Scholar] [CrossRef]
- Ran, J.; Li, T.; Chen, D.; Shang, L.; Li, W.; Zhu, Q. Mechanical properties of concrete reinforced with corrugated steel fiber under uniaxial compression and tension. Structures 2021, 34, 1890–1902. [Google Scholar] [CrossRef]
- Feng, Z.B.; Hou, H.Y.; Lan, H.F. Understanding university students’ perceptions of classroom environment: A synergistic approach integrating grounded theory (GT) and analytic hierarchy process (AHP). J. Build. Eng. 2024, 83, 108446. [Google Scholar] [CrossRef]
- Saaty, T.L. Decision Making for Leaders: The Analytic Hierarchy Process for Decisions in a Complex World; RWS Publications: Pittsburgh, PA, USA, 1990. [Google Scholar]


| Name | Density [g/cm3] | Diameter [mm] | Length [mm] | Elastic Modulus [GPa] | Tensile Strength [MPa] | Elongation [%] |
|---|---|---|---|---|---|---|
| RECS-15-12 | 1.3 | 0.031 | 12 | 41 | 1650 | 6 |
| Test Piece Number | Water/Binder Ratio | Sand Rate | The Quantity of Materials Used for 1 m3 of Concrete. [Unit: kg/m3] | ||||||||
|---|---|---|---|---|---|---|---|---|---|---|---|
| Water | Cement | Fly Ash | Sand | Small Stones | Large Stones | Steel Fiber | PVA Fiber | Water Reducing Agent | |||
| JZ | 0.4 | 0.35 | 160 | 320 | 80 | 644 | 657.8 | 538.2 | 0 | 0 | 0.40% |
| S0.75 | 0.4 | 0.35 | 160 | 320 | 80 | 623.42 | 636.78 | 521 | 58.8 | 0 | 0.40% |
| S1.0 | 0.4 | 0.35 | 160 | 320 | 80 | 616.53 | 629.74 | 515.24 | 78.5 | 0 | 0.40% |
| S1.25 | 0.4 | 0.35 | 160 | 320 | 80 | 609.67 | 622.73 | 509.51 | 98.1 | 0 | 0.40% |
| S1.5 | 0.4 | 0.35 | 160 | 320 | 80 | 602.79 | 615.71 | 503.76 | 117.75 | 0 | 0.40% |
| S1.0P0.1 | 0.4 | 0.35 | 160 | 320 | 80 | 616.07 | 629.28 | 514.86 | 78.5 | 1.3 | 0.40% |
| S1.0P0.2 | 0.4 | 0.35 | 160 | 320 | 80 | 615.62 | 628.81 | 514.48 | 78.5 | 2.6 | 0.40% |
| S1.0P0.3 | 0.4 | 0.35 | 160 | 320 | 80 | 615.16 | 628.35 | 514.1 | 78.5 | 3.9 | 0.40% |
| S1.0P0.4 | 0.4 | 0.35 | 160 | 320 | 80 | 614.71 | 627.88 | 513.72 | 78.5 | 5.2 | 0.40% |
| [kN∙mm] | JZ | S0.75 | S1.0 | S1.25 | S1.5 | S1.0P0.1 | S1.0P0.2 | S1.0P0.3 | S1.0P0.4 |
|---|---|---|---|---|---|---|---|---|---|
| 3 days | 350.3 | 550.6 | 658.4 | 627.3 | 580.4 | 702.1 | 832.7 | 813.2 | 753.2 |
| 7 days | 422.3 | 630.3 | 763.1 | 743.2 | 693.2 | 803.6 | 921.0 | 912.6 | 852.3 |
| 14 days | 539.8 | 691.2 | 865.8 | 791.6 | 734.0 | 928.3 | 1038.8 | 1022.6 | 899.2 |
| 28 days | 554.9 | 710.5 | 911.3 | 813.8 | 754.5 | 965.5 | 1095.5 | 1072.3 | 935.2 |
| [GPa] | JZ | S0.75 | S1.0 | S1.25 | S1.5 | S1.0P0.1 | S1.0P0.2 | S1.0P0.3 | S1.0P0.4 |
|---|---|---|---|---|---|---|---|---|---|
| 3 days | 21.3 | 21.0 | 20.0 | 22.3 | 22.0 | 22.3 | 22.3 | 23.0 | 22.8 |
| 7 days | 23.9 | 23.1 | 21.5 | 23.8 | 24.0 | 24.2 | 23.1 | 25.0 | 24.1 |
| 14 days | 26.1 | 25.1 | 28.2 | 26.3 | 26.3 | 32.8 | 30.2 | 35.2 | 34.2 |
| 28 days | 27.5 | 27.3 | 28.3 | 27.6 | 28.3 | 30.1 | 34.7 | 35.1 | 34.5 |
| Indicator | |||||
|---|---|---|---|---|---|
| 1 | 1 | 1 | 9/5 | 9/3 | |
| 1 | 1 | 1 | 9/5 | 9/3 | |
| 1 | 1 | 1 | 9/5 | 9/3 | |
| 5/9 | 5/9 | 5/9 | 1 | 5/3 | |
| 3/9 | 3/9 | 3/9 | 3/5 | 1 |
Disclaimer/Publisher’s Note: The statements, opinions and data contained in all publications are solely those of the individual author(s) and contributor(s) and not of MDPI and/or the editor(s). MDPI and/or the editor(s) disclaim responsibility for any injury to people or property resulting from any ideas, methods, instructions or products referred to in the content. |
© 2024 by the authors. Licensee MDPI, Basel, Switzerland. This article is an open access article distributed under the terms and conditions of the Creative Commons Attribution (CC BY) license (https://creativecommons.org/licenses/by/4.0/).
Share and Cite
Wu, J.; Zhang, W.; Han, J.; Liu, Z.; Liu, J.; Huang, Y. Experimental Research on Crack Resistance of Steel–Polyvinyl Alcohol Hybrid Fiber-Reinforced Concrete. Materials 2024, 17, 3097. https://doi.org/10.3390/ma17133097
Wu J, Zhang W, Han J, Liu Z, Liu J, Huang Y. Experimental Research on Crack Resistance of Steel–Polyvinyl Alcohol Hybrid Fiber-Reinforced Concrete. Materials. 2024; 17(13):3097. https://doi.org/10.3390/ma17133097
Chicago/Turabian StyleWu, Jingjiang, Wenjie Zhang, Juhong Han, Zheyuan Liu, Jie Liu, and Yafei Huang. 2024. "Experimental Research on Crack Resistance of Steel–Polyvinyl Alcohol Hybrid Fiber-Reinforced Concrete" Materials 17, no. 13: 3097. https://doi.org/10.3390/ma17133097