Deformation Behavior of AZ31 Magnesium Alloy with Pre-Twins under Biaxial Tension

Abstract
1. Introduction
2. Experiments and Methods
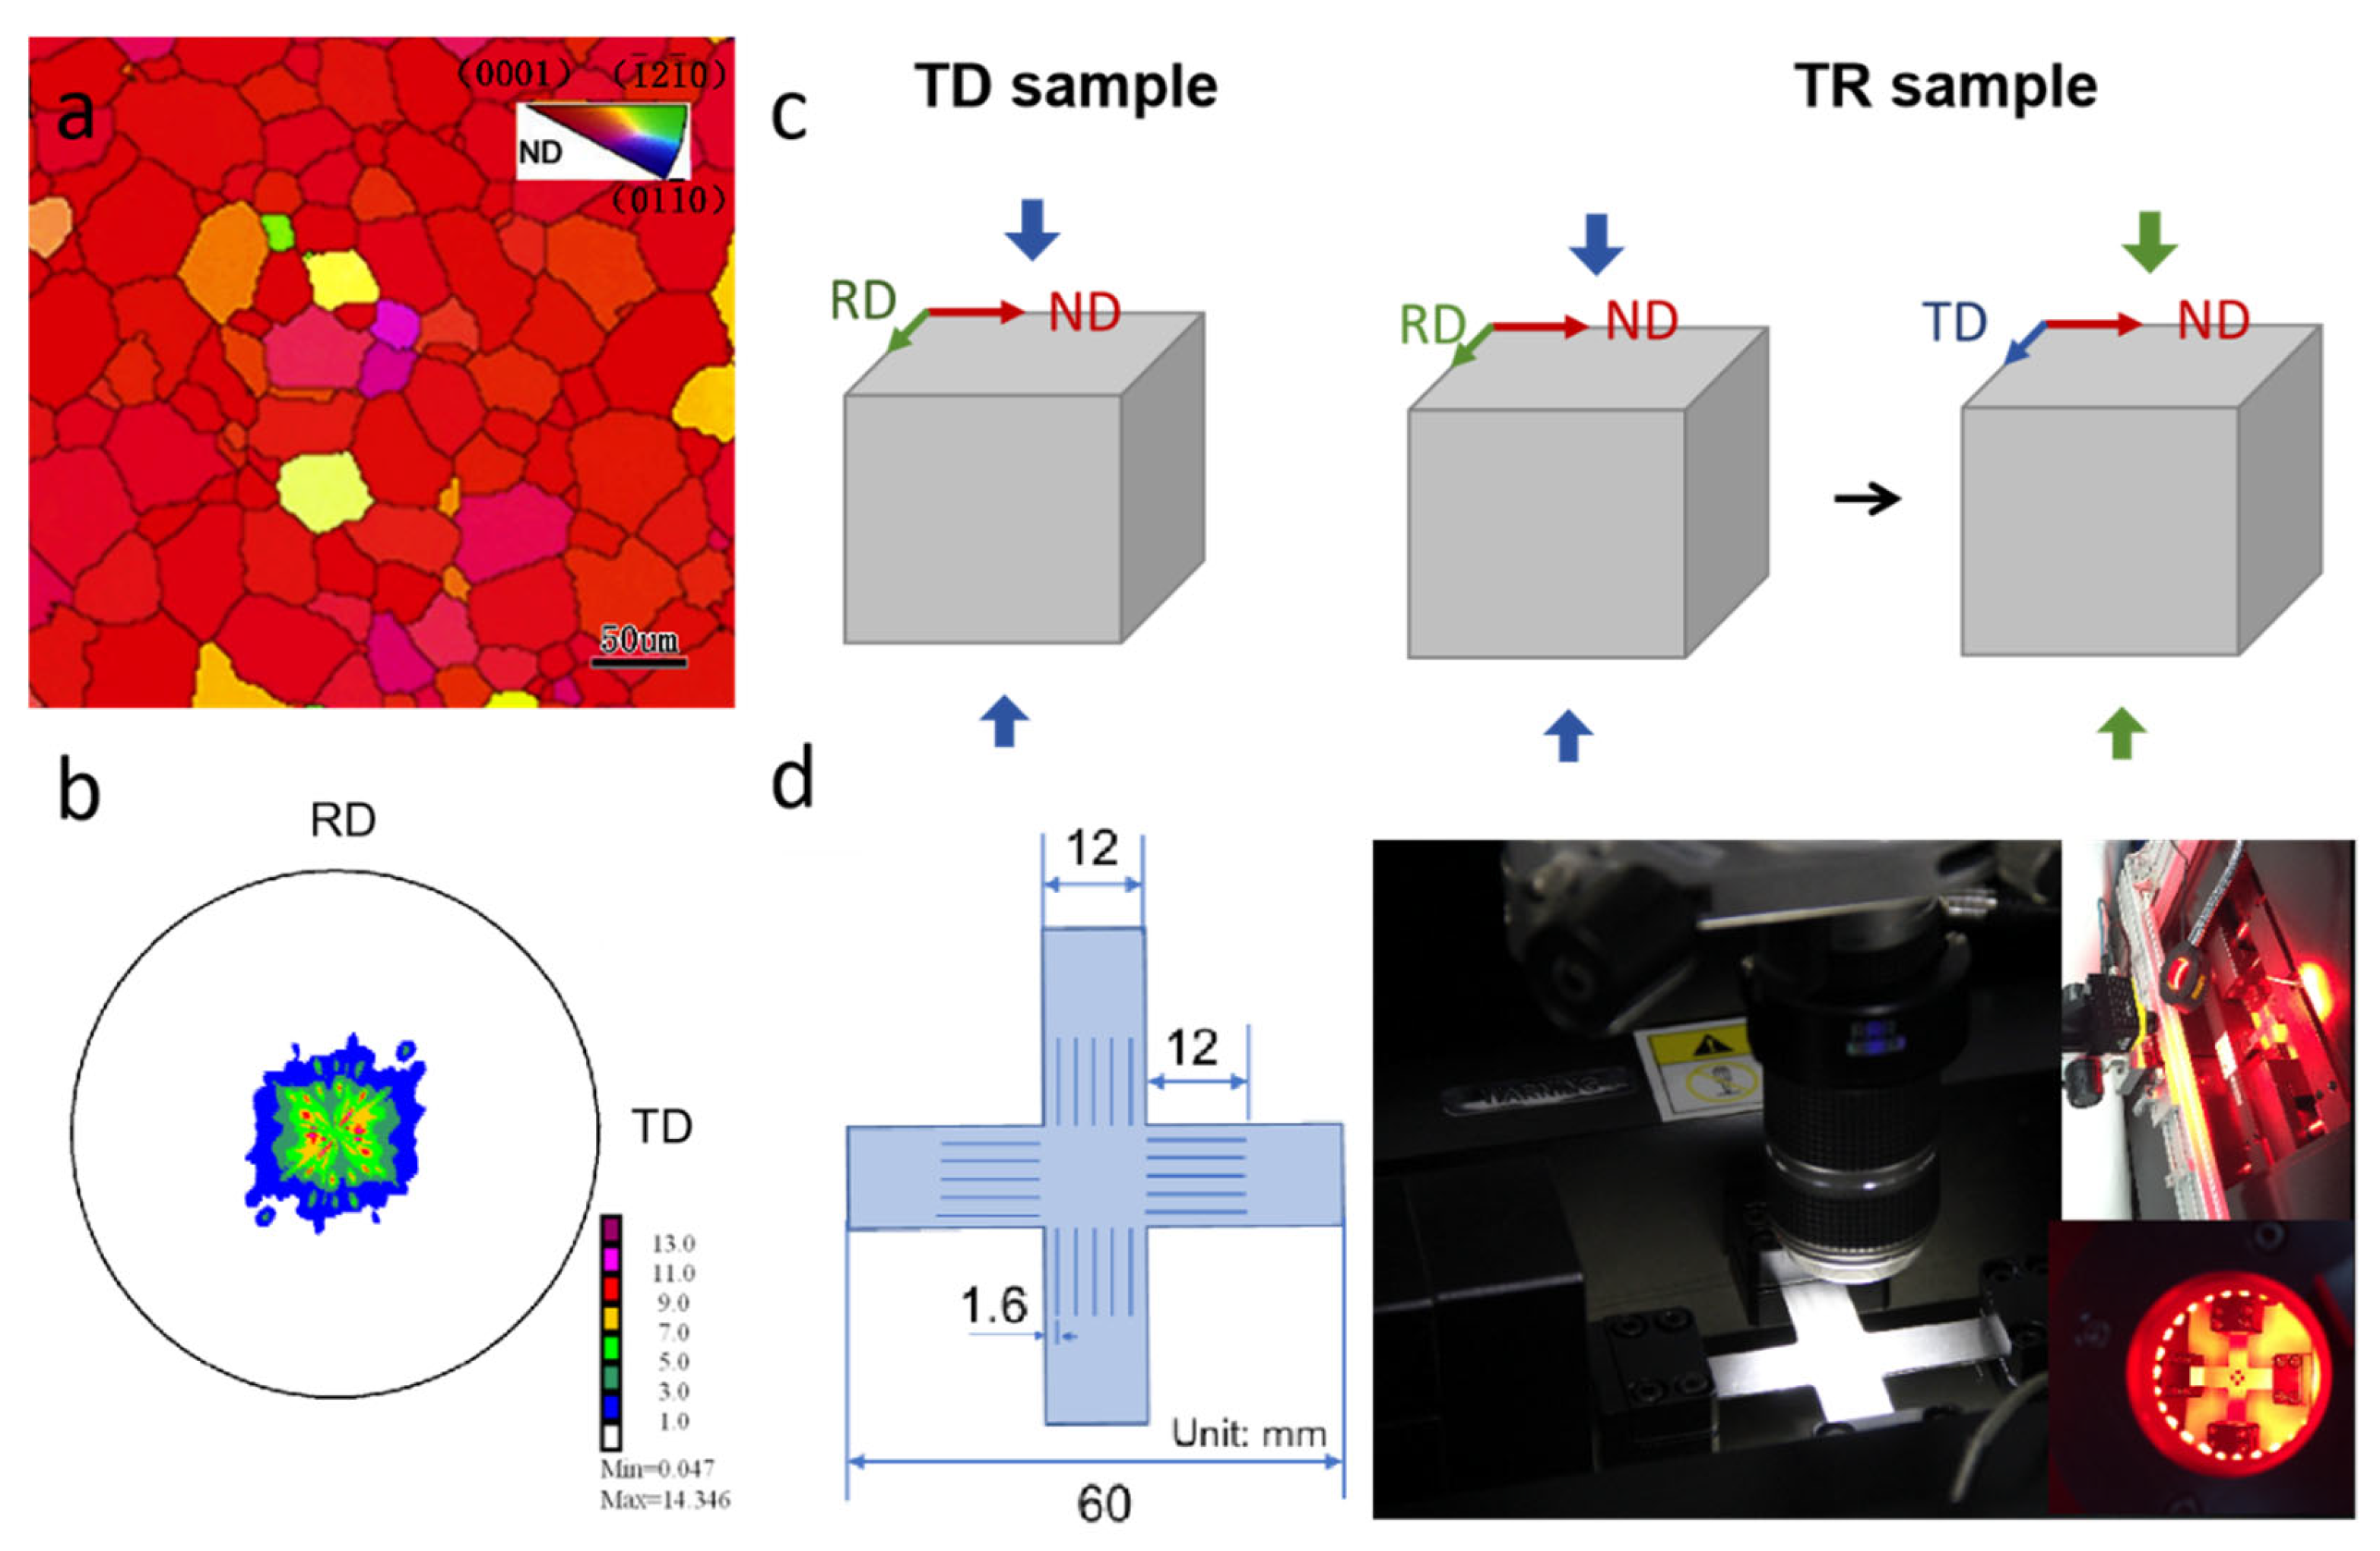
2.1. Material and Mechanical Tests
2.2. Characterization of Microstructure and Texture
3. Results
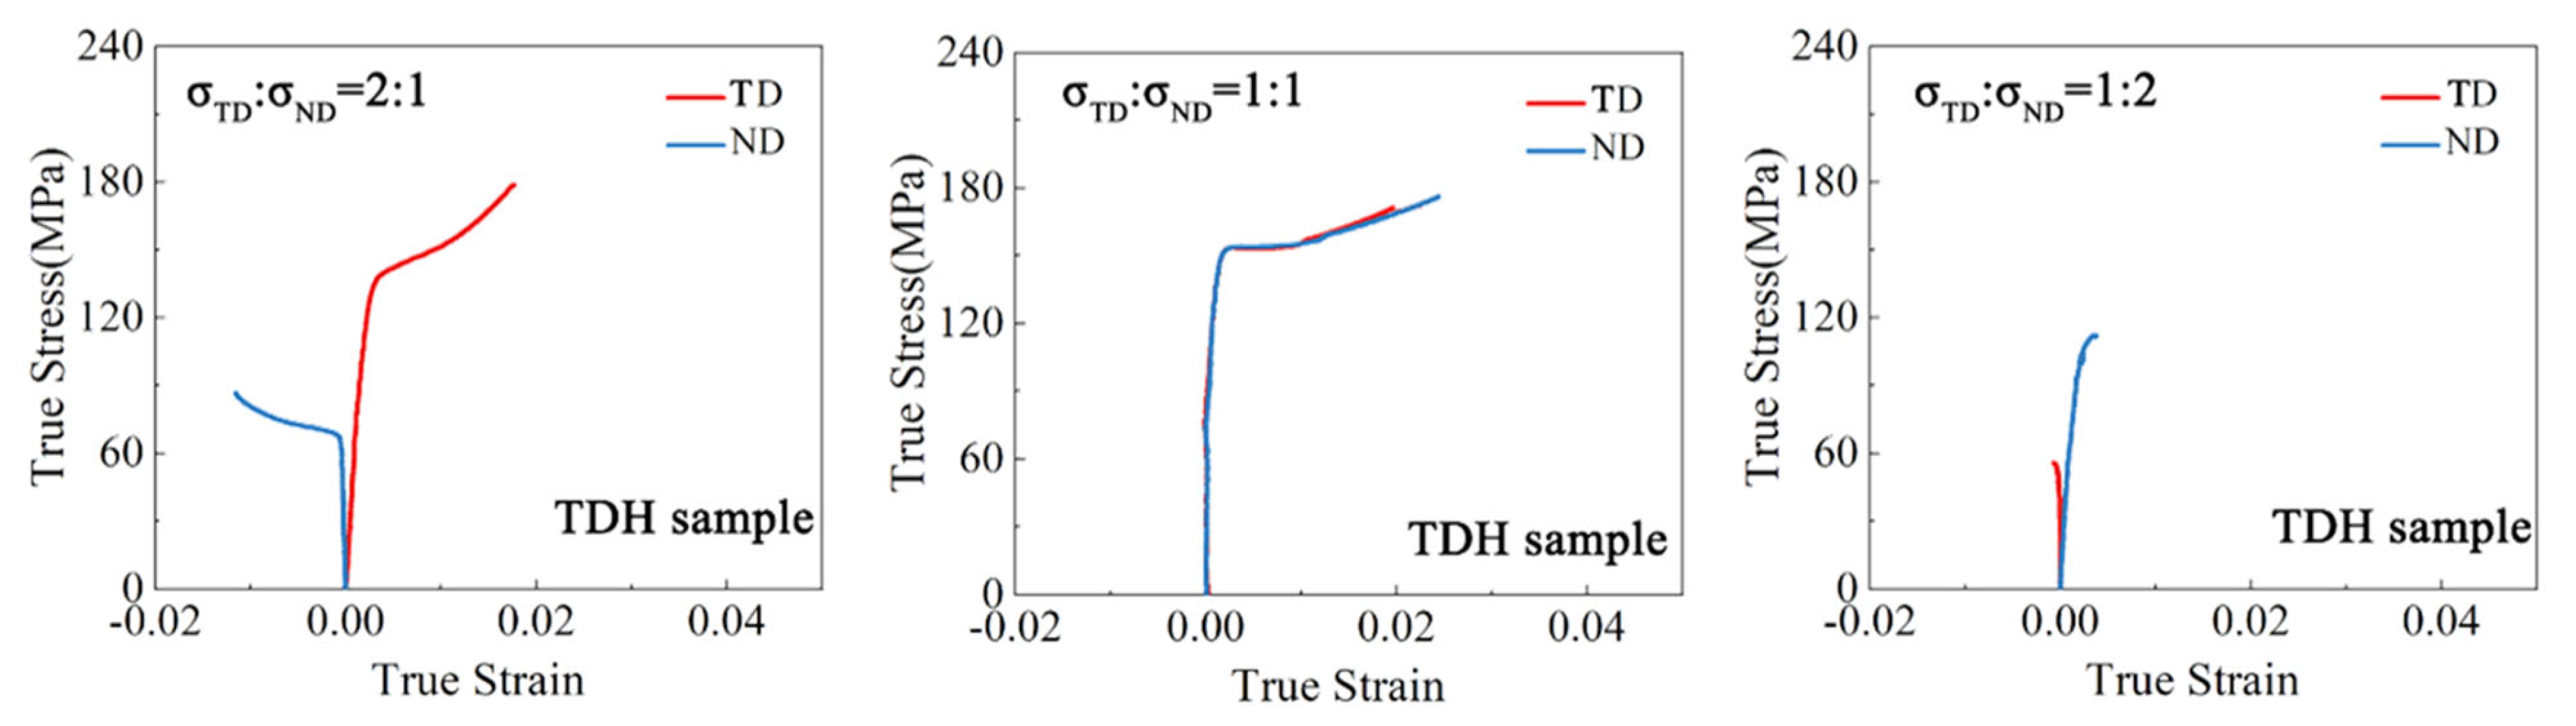
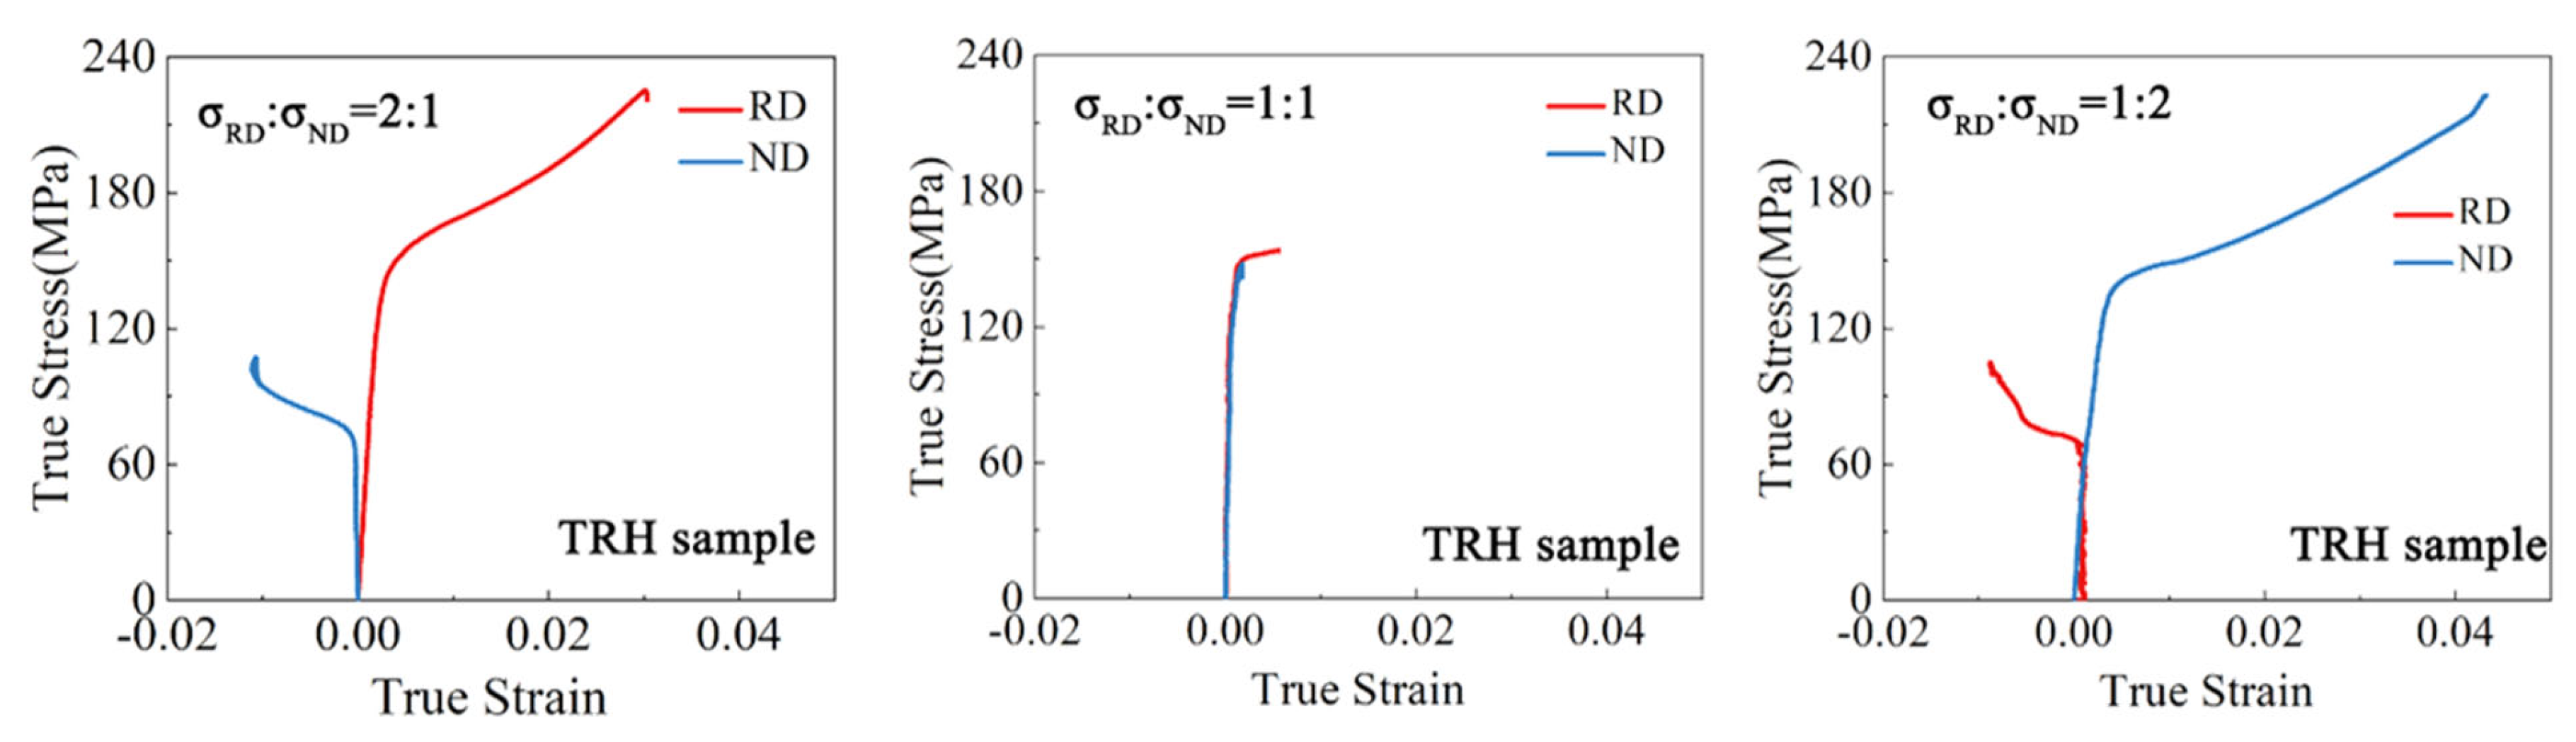
3.1. Mechanical Behavior
3.2. Evolution of Microstructure
3.2.1. Initial Microstructure
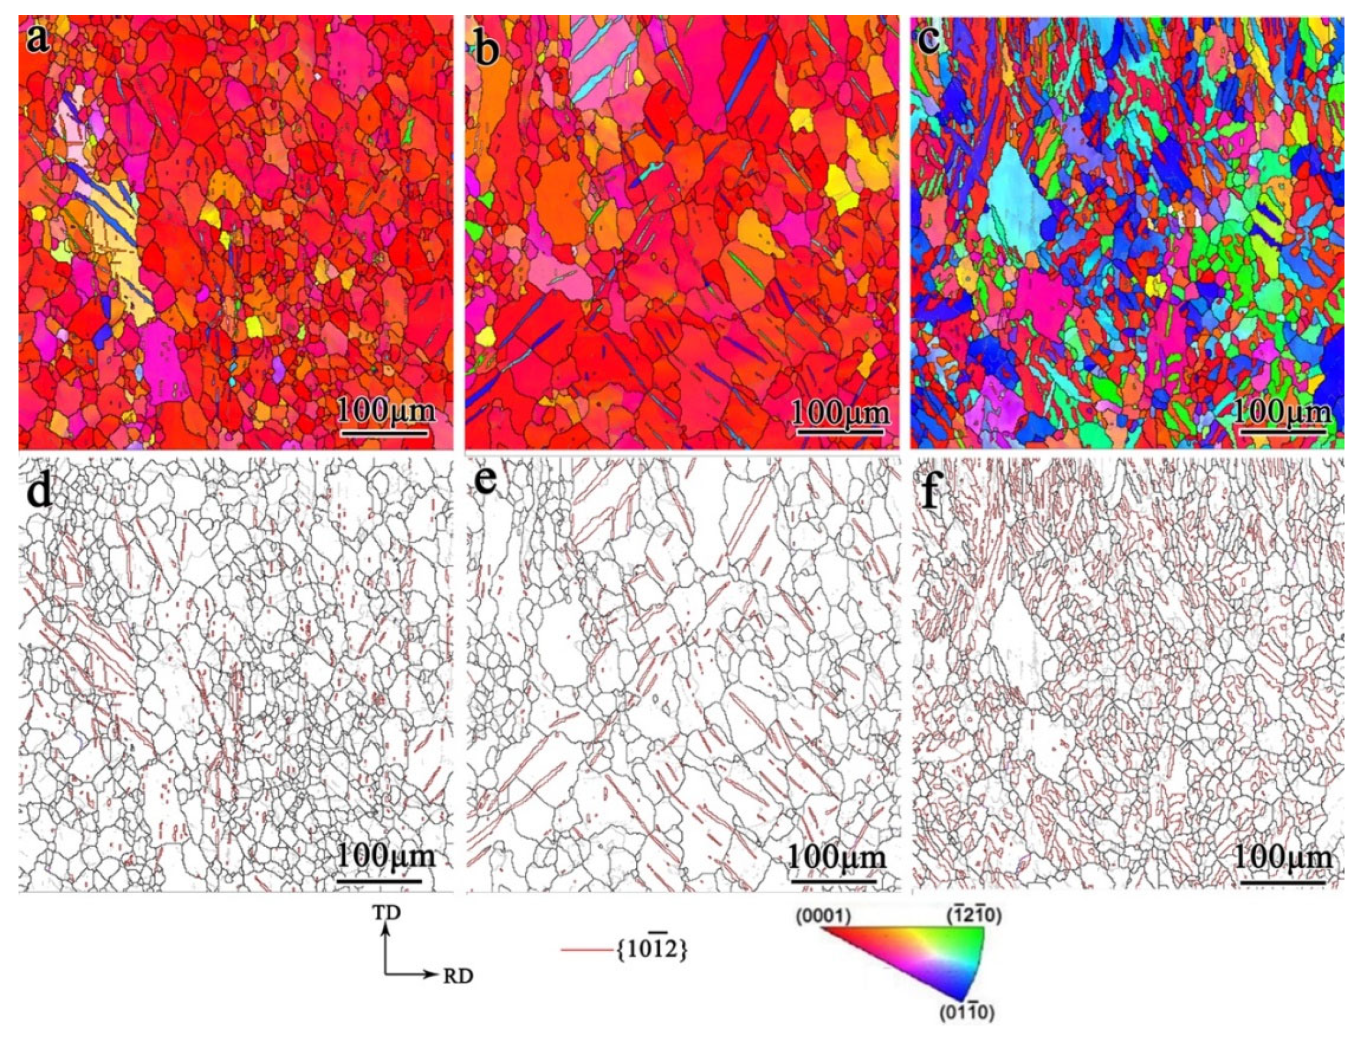
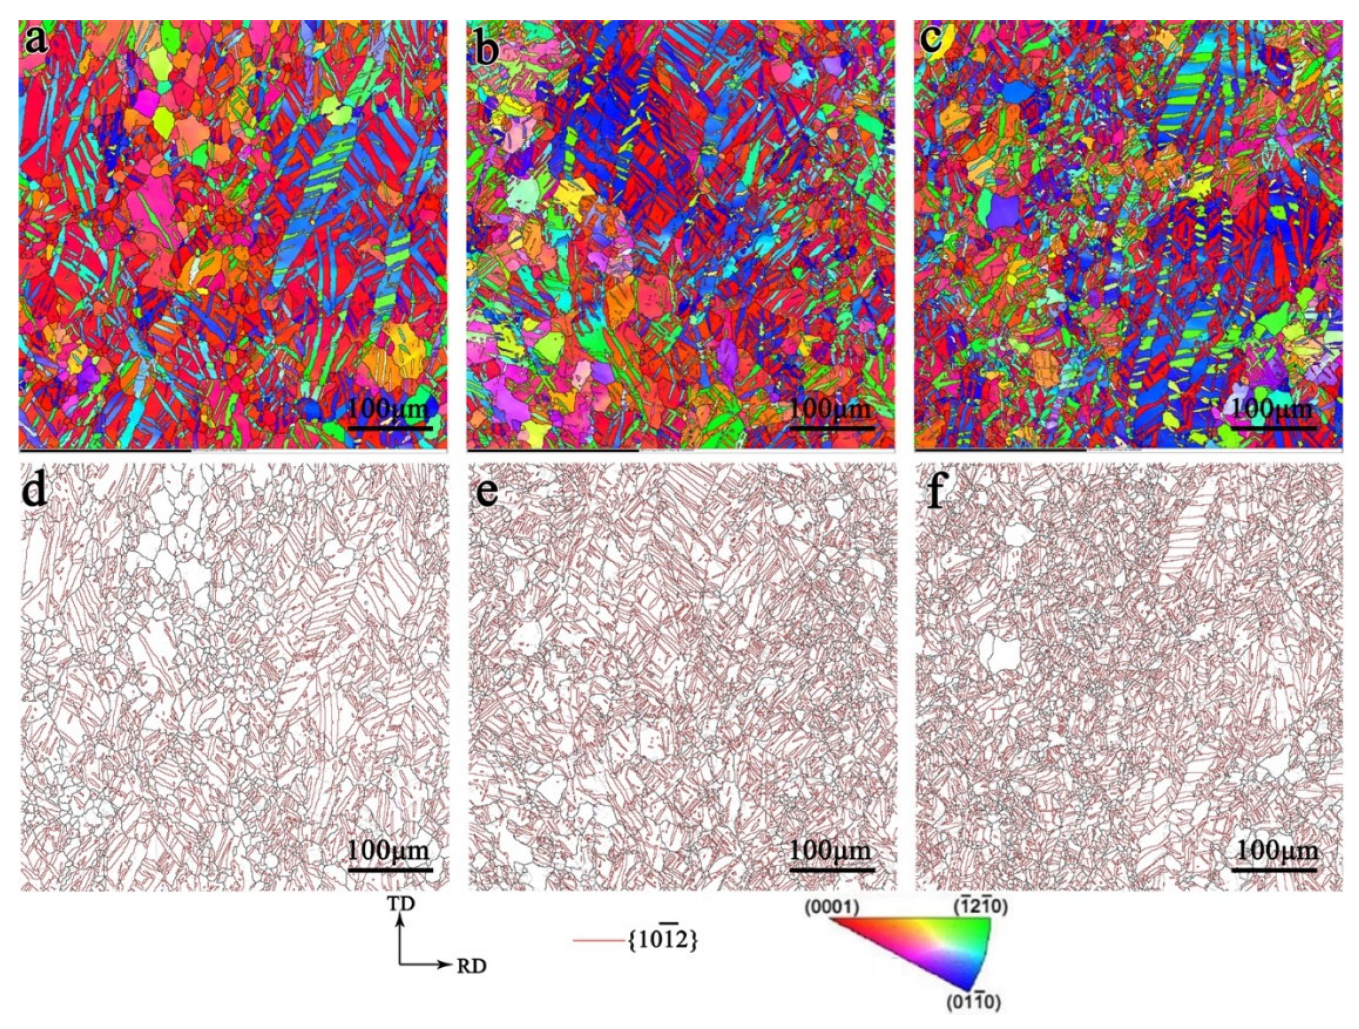
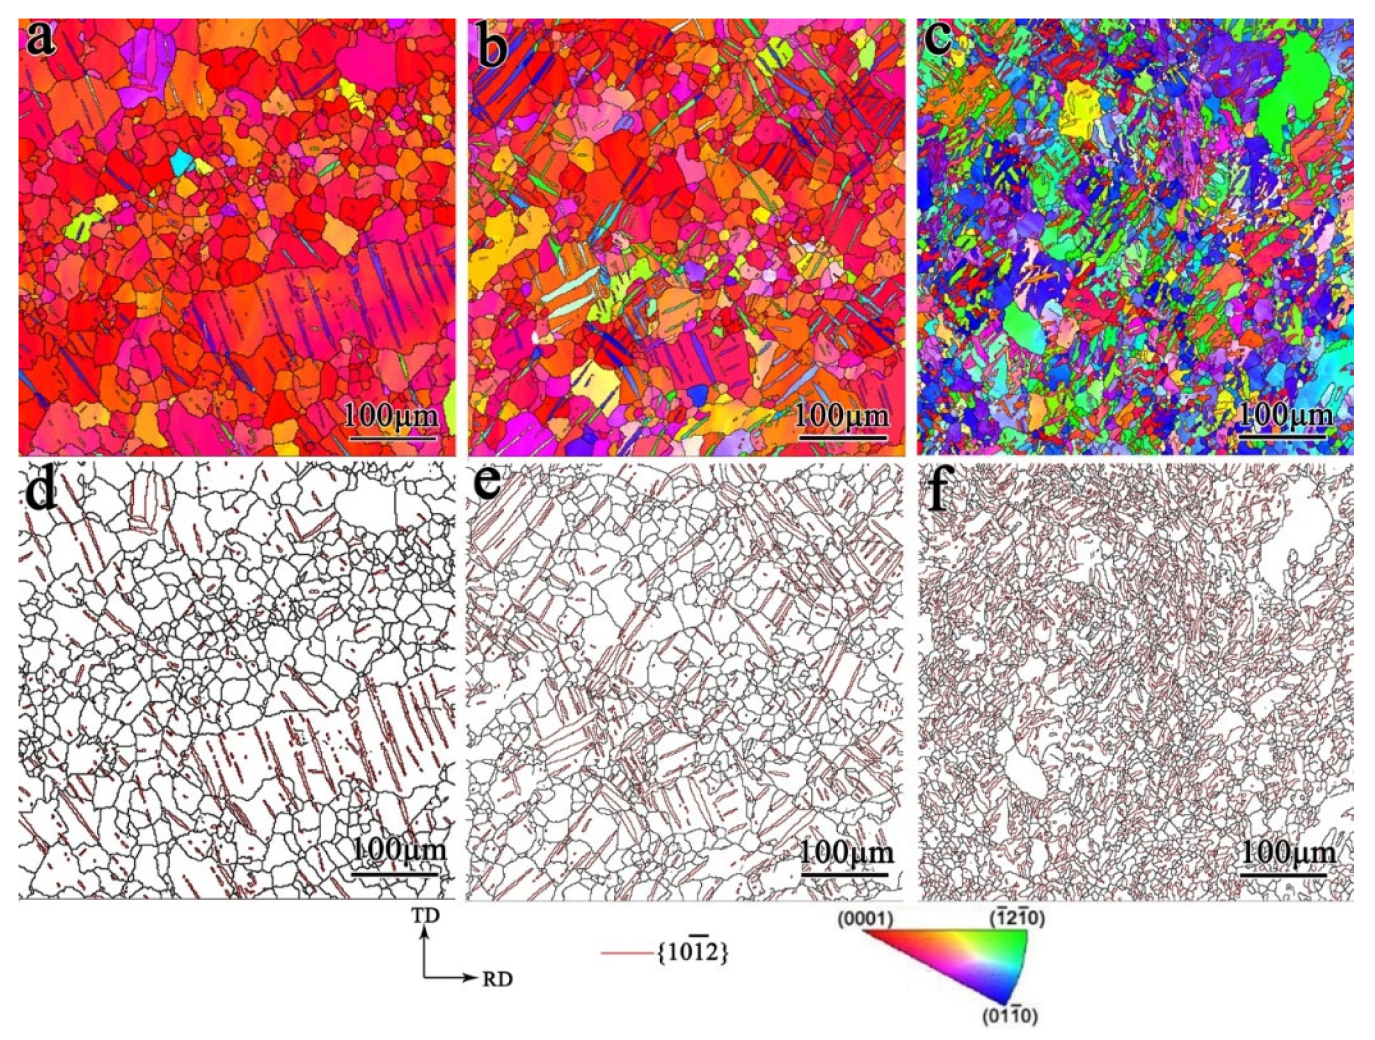
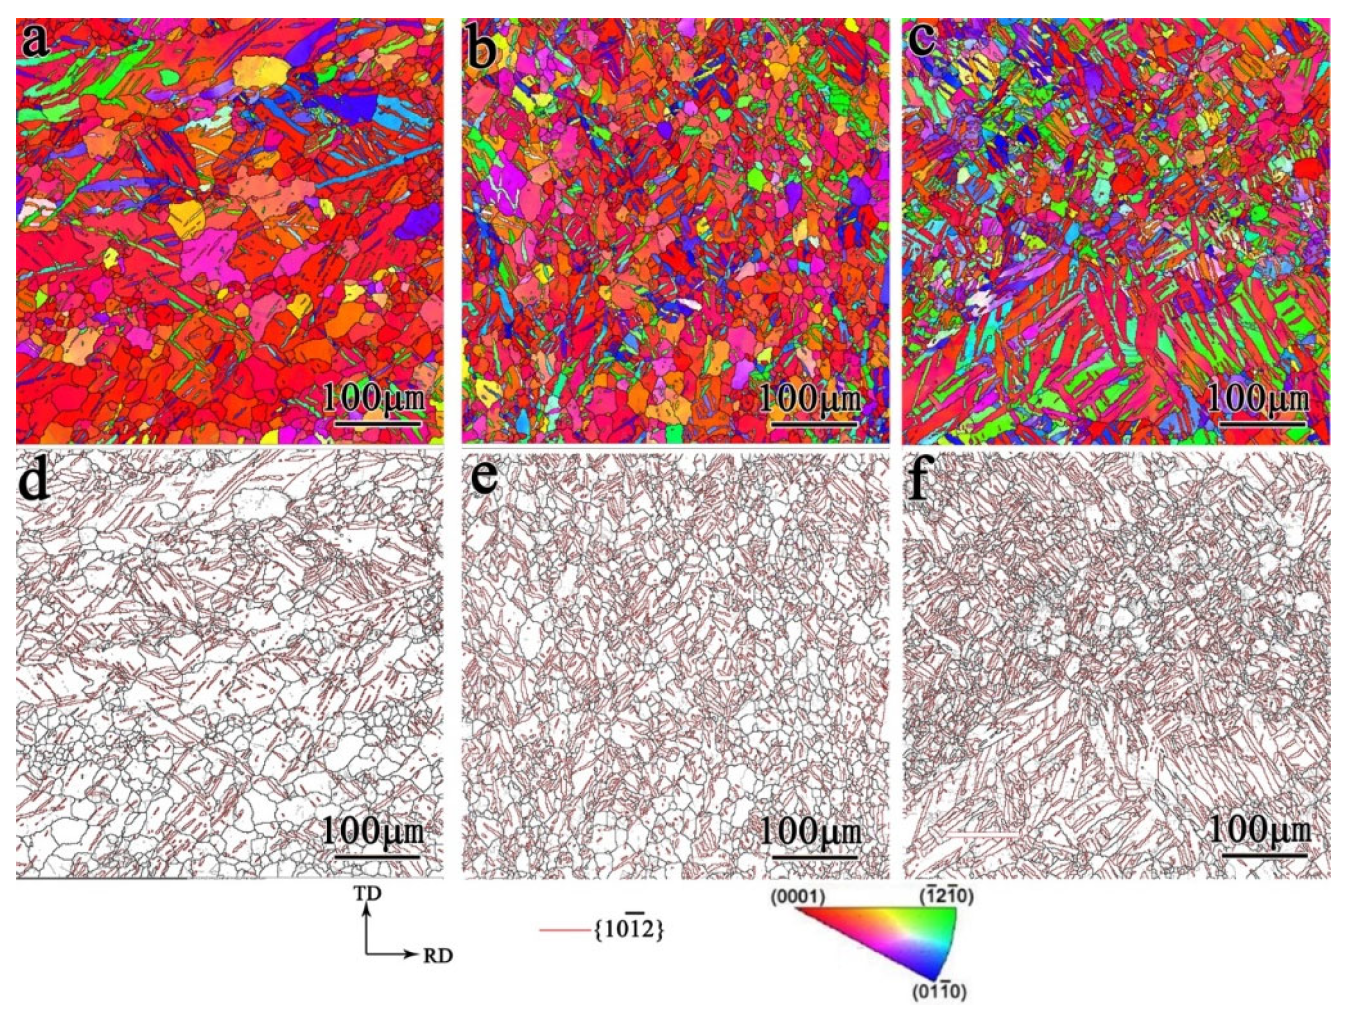
3.2.2. Microstructure of the Deformed Sample
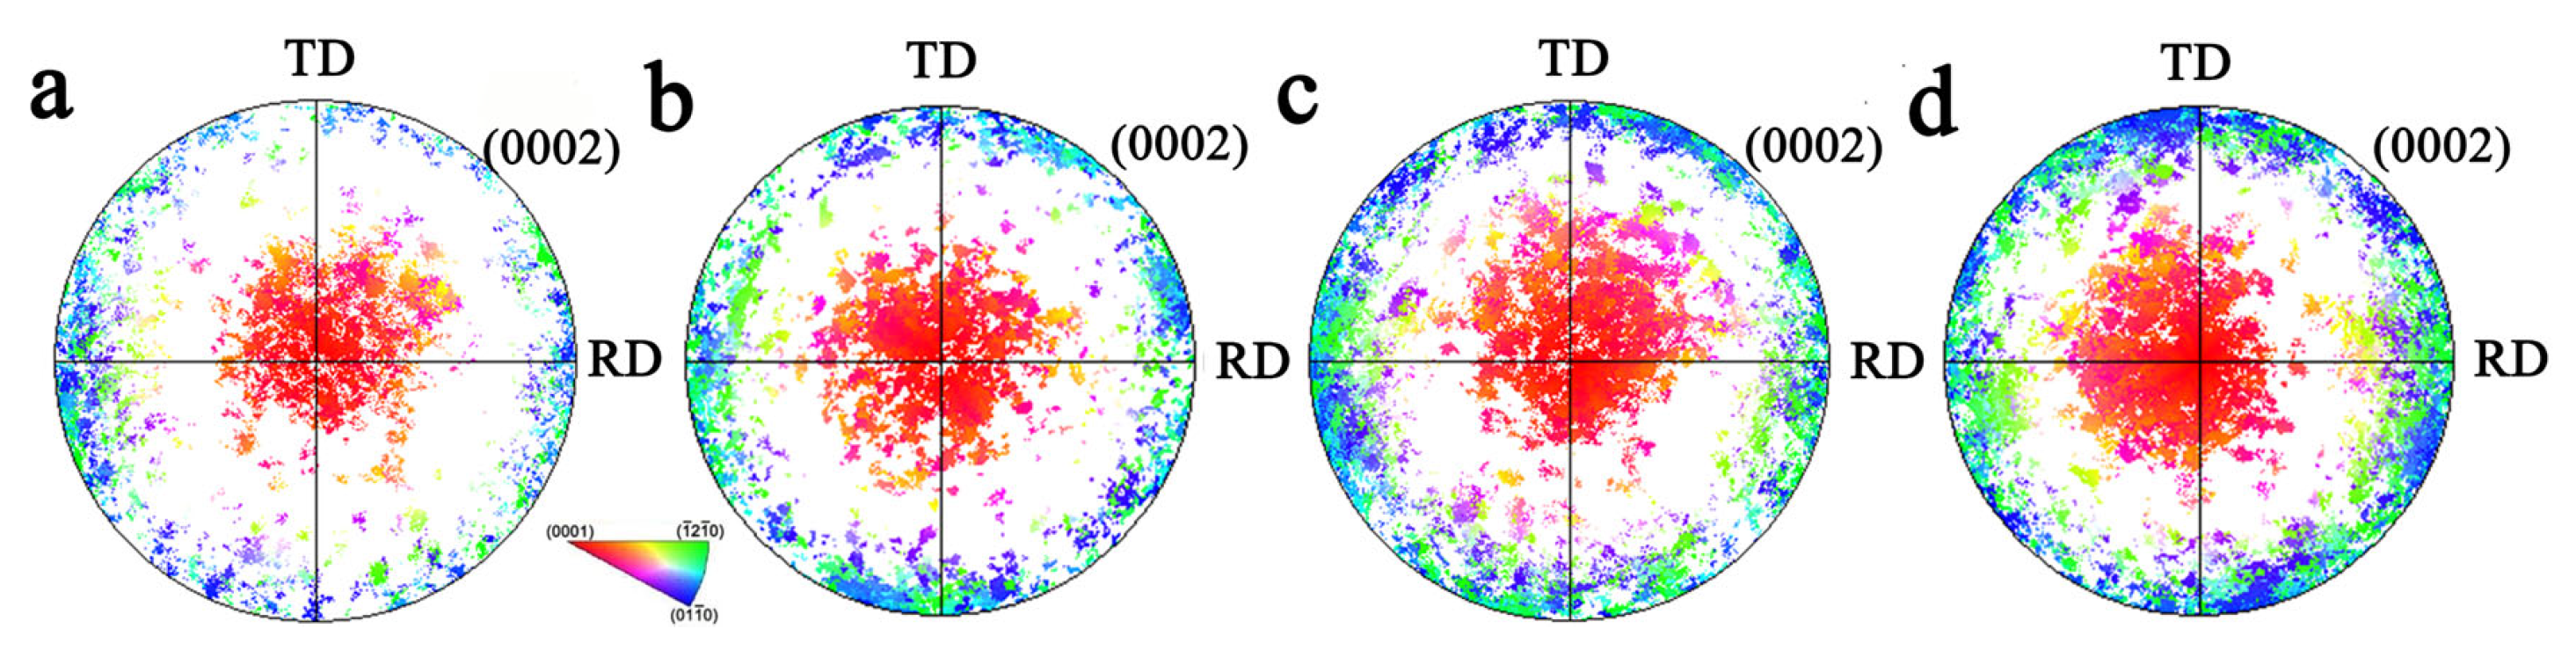
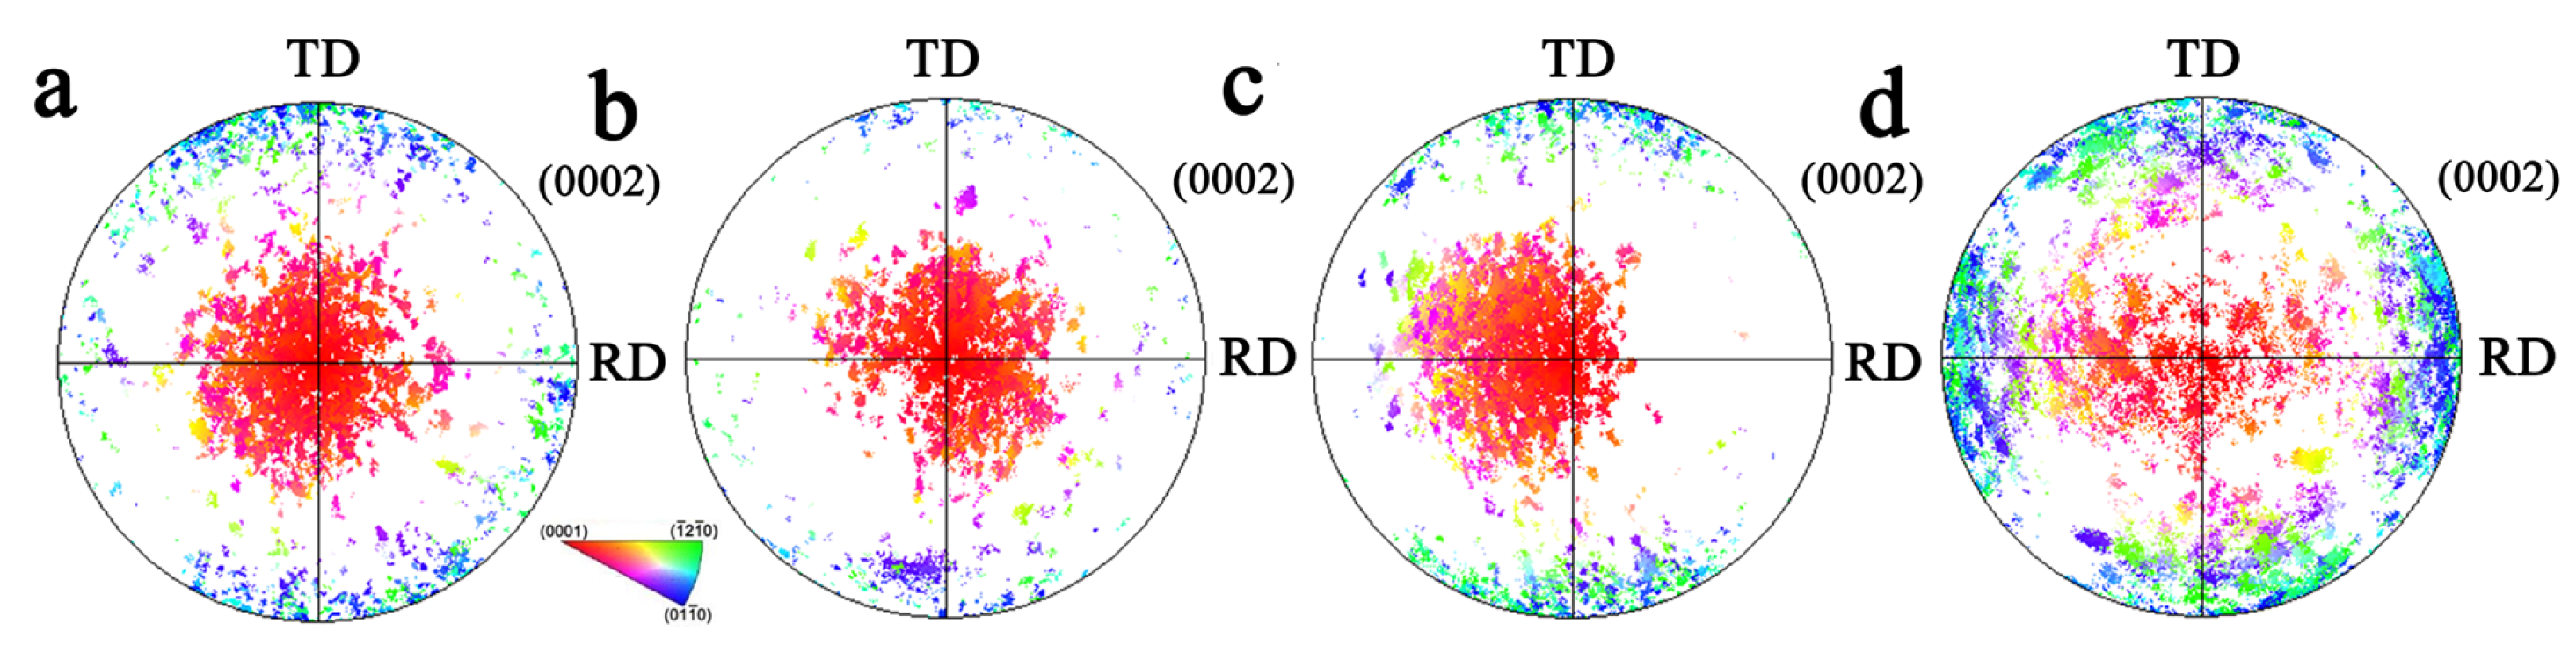
3.3. Texture Evolution
4. Discussion
4.1. Competition Behavior between Twinning and Detwinning
4.2. Effect of the Solute Atom on Twinning and Detwinning Behavior
5. Conclusions
- Significant hardening was observed under biaxial tension. The yield values in the direction of larger stress values were higher than those under uniaxial loading conditions. The solute atom segregation at twin boundaries generates a more obvious strengthening effect, noting that, for the TRH sample, the strength effect of the RD yield stress = 2:1 was higher than that of the ND yield stress under stress ratio = 1:2.
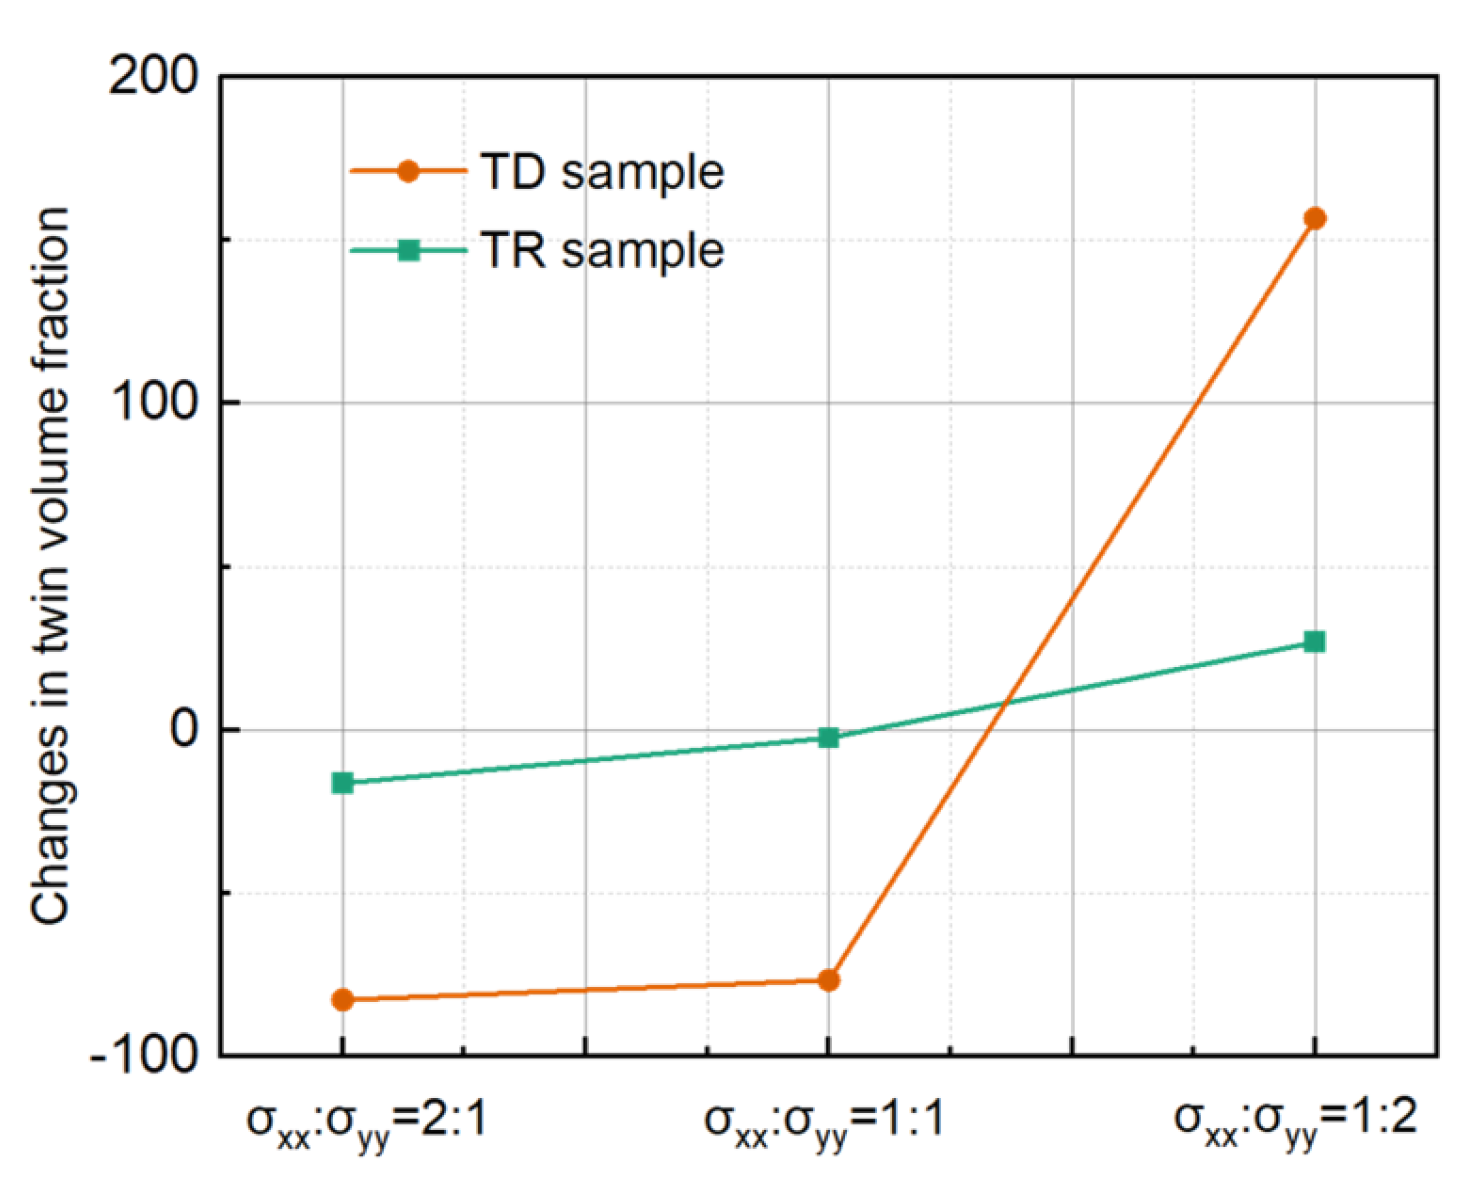
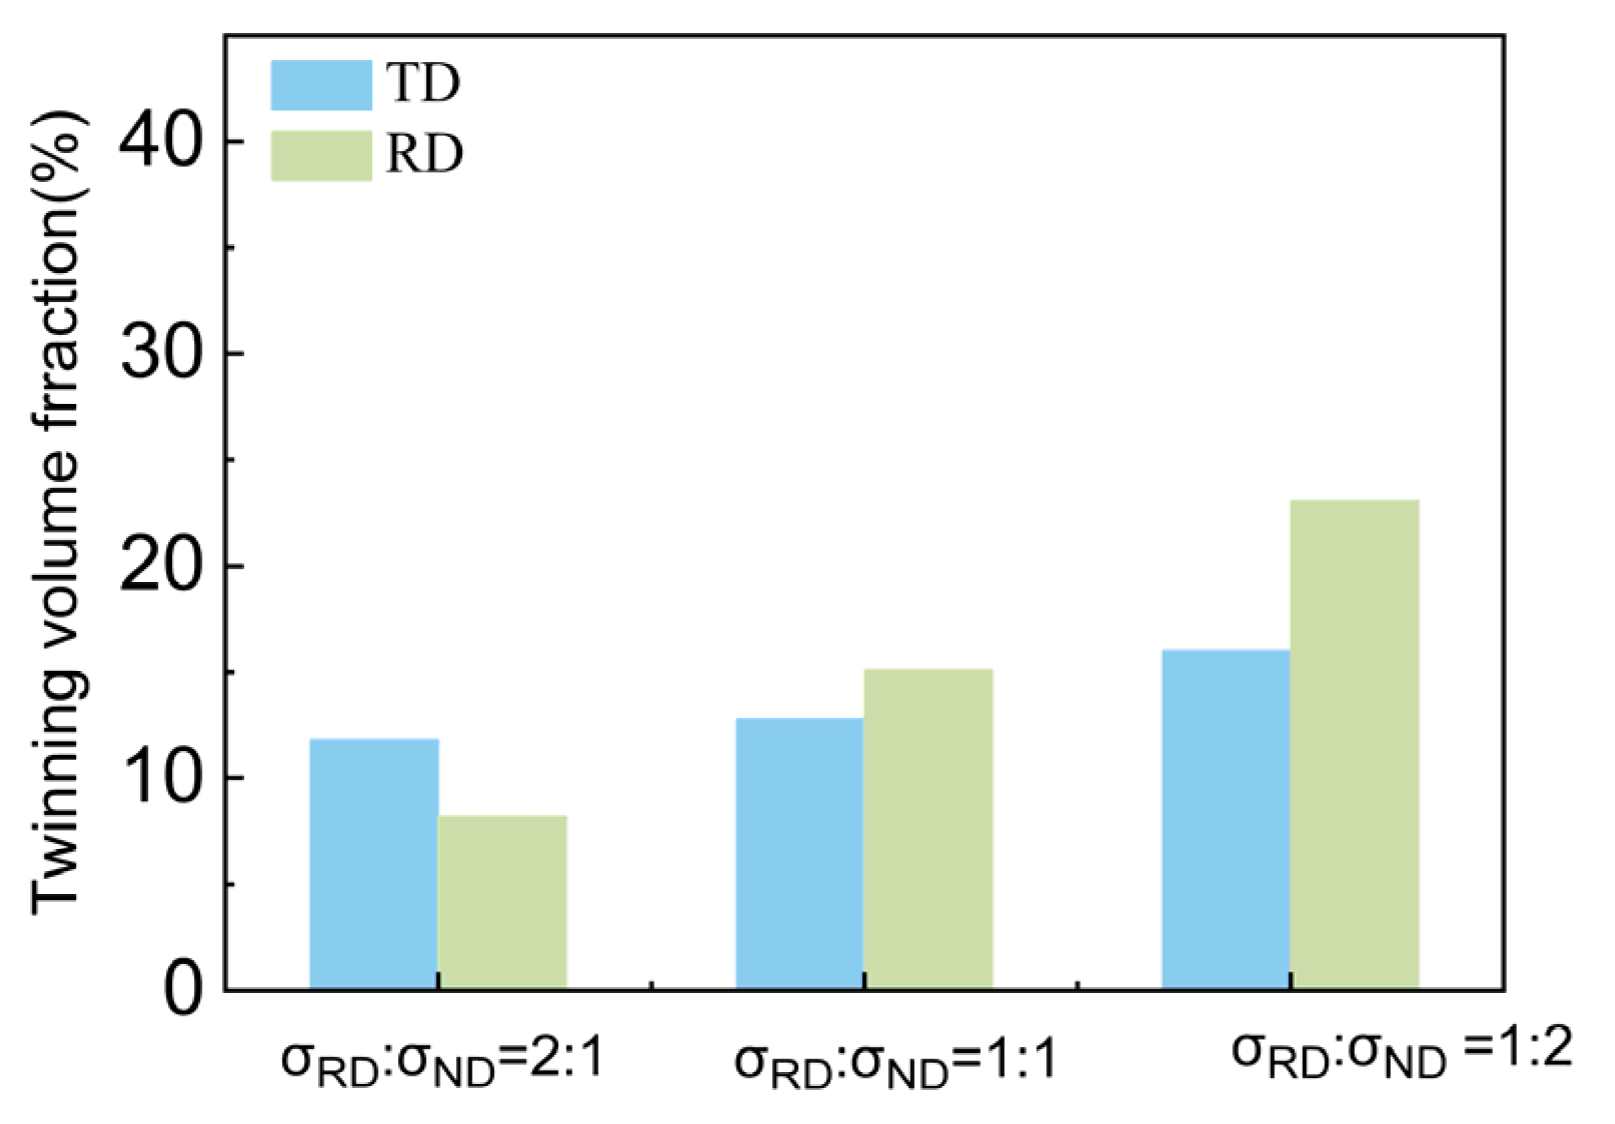
- There is a complex competition between twinning and detwinning under biaxal tension along the ND and TD of the pre-twinned samples with the variation in the stress ratio along the TD and RD. The variation in the twin volume fractions for all samples under biaxial tension firstly decreases and then increases, with a higher stress ratio along the ND. As for the TDH sample, the changes in the twin volume fraction were lower than that of the TD sample. However, the amplitude of variation in the twin volume fraction of the TRH sample is higher than that of the TR sample. This is because the relative activity of detwinning decreases and that of twinning increases, as ND stress mainly leads to the growth of pre-twins and TD often promotes detwinning of primary twins. With a higher stress ratio along the ND, the activity of twinning deformation increases and that of detwinning decreases.
Author Contributions
Funding
Institutional Review Board Statement
Data Availability Statement
Conflicts of Interest
References
- Yang, B.; Llorca, J. Origin of nucleation and growth of extension twins in grains unsuitably oriented for twinning during deformation of Mg-1%Al. J. Magnes. Alloys 2024, 12, 1186–1203. [Google Scholar] [CrossRef]
- Panchal, M.; Kaushik, L.; Kim, M.-S.; Renganayagalu, R.K.; Choi, S.-H.; Singh, J. Effect of pre-twinning and heat treatment on formability of AZX311 Mg alloy. J. Magnes. Alloys 2024, 12, 1154–1169. [Google Scholar] [CrossRef]
- He, J.; Wang, L.; Liu, J.; Wu, H.; Wang, H.; Cheng, W.; She, J.; Huang, G.; Zheng, L.; Shin, K.S. Effect of induced screw twisted strain on the twin orientation regulation and the ductility of pre-twined ZM21 Mg alloys. Mater. Sci. Eng. A 2024, 892, 146095. [Google Scholar] [CrossRef]
- Somekawa, H.; Ueji, R.; Singh, A. Mechanical response in tension of twin-induced Mg alloys in wide strain rate regimes. Mater. Sci. Eng. A 2024, 897, 146319. [Google Scholar] [CrossRef]
- Hou, X.; Liu, X.; Wang, D.; Liu, Y.; Zhao, Q.; Sun, Z.; Shang, Z.; Sun, Z. Insight into double twinning behavior of Mg–Gd rolled alloy at the nano scale: Role of micro-texture entropy. J. Alloys Compd. 2024, 983, 173835. [Google Scholar] [CrossRef]
- Liu, X.; Wan, Q.-H.; Zhu, B.-W.; Liu, W.-H.; Li, L.-X.; Xu, C.-C.; Guo, P.-C. Effect of low-angle grain boundary and twin on precipitation mechanism in pre-rolled AZ91 magnesium alloy. J. Mater. Sci. 2024, 59, 3662–3675. [Google Scholar] [CrossRef]
- Bong, H.J.; Lee, J.; Lee, M.-G. Modeling crystal plasticity with an enhanced twinning–detwinning model to simulate cyclic behavior of AZ31B magnesium alloy at various temperatures. Int. J. Plast. 2022, 150, 103190. [Google Scholar] [CrossRef]
- Zou, J.; Ma, L.; Zhu, Y.; Qin, L.; Yuan, Y. Gradient microstructure and superior strength–ductility synergy of AZ61 magnesium alloy bars processed by radial forging with different deformation temperatures. J. Mater. Sci. Technol. 2024, 170, 65–77. [Google Scholar] [CrossRef]
- Kim, Y.J.; Kim, H.J.; Park, S.H. Deformation mechanisms and mechanical properties of rolled AZ31 alloy subjected to precompression and subsequent annealing: Effect of annealing temperature. Mater. Sci. Eng. A 2024, 899, 146424. [Google Scholar] [CrossRef]
- Wang, H.; Zhang, D.; Qiu, C.; Chen, D. Cyclic deformation behavior of a high-strength low-alloy (HSLA) magnesium alloy with heterostructures. J. Magnes. Alloys, 2024; in press. [Google Scholar] [CrossRef]
- Zhu, Y.; Hou, D.; Li, Q. Quasi in-situ EBSD analysis of twinning-detwinning and slip behaviors in textured AZ31 magnesium alloy subjected to compressive-tensile loading. J. Magnes. Alloys 2022, 10, 956–964. [Google Scholar] [CrossRef]
- Gong, W.; Zheng, R.; Harjo, S.; Kawasaki, T.; Aizawa, K.; Tsuji, N. In-situ observation of twinning and detwinning in AZ31 alloy. J. Magnes. Alloys 2022, 10, 3418–3432. [Google Scholar] [CrossRef]
- Wang, Z.; Wu, S.; Lei, Y.; Kan, Q.; Kang, G. Damage evolution of extruded magnesium alloy from deformation twinning and dislocation slipping in uniaxial stress-controlled low cycle fatigue. Int. J. Fatigue 2022, 164, 107124. [Google Scholar] [CrossRef]
- Zhao, L.; Guan, B.; Xin, Y.; Huang, X.; Liu, C.; Wu, P.; Liu, Q. A quantitative study on mechanical behavior of Mg alloys with bimodal texture components. Acta Mater. 2021, 214, 117013. [Google Scholar] [CrossRef]
- Cheng, Y.; Fu, Y.; Xin, Y.; Chen, G.; Wu, P.; Huang, X.; Liu, Q. {10–12} twinning behavior under biaxial tension of Mg–3Al–1Zn plate. Int. J. Plast. 2020, 102754. [Google Scholar] [CrossRef]
- Yaghoobi, M.; Chen, Z.; Murphy-Leonard, A.D.; Sundararaghavan, V.; Daly, S.; Allison, J.E. Deformation twinning and detwinning in extruded Mg-4Al: In-situ experiment and crystal plasticity simulation. Int. J. Plast. 2022, 155, 103345. [Google Scholar] [CrossRef]
- Guo, X.; Cheng, Y.; Xin, Y.; Wu, W.; Ma, C.; An, K.; Liaw, P.K.; Wu, P.; Liu, Q. Crystal plasticity modeling of low-cycle fatigue behavior of an Mg-3Al-1Zn alloy based on a model, including twinning and detwinning mechanisms. J. Mech. Phys. Solids 2022, 168, 105030. [Google Scholar] [CrossRef]
- Maghsoudi, M.; Ovri, H.; Krekeler, T.; Ziehmer, M.; Lilleodden, E.T. Effect of Gd solutes on the micromechanical response of twinning and detwinning in Mg. Acta Mater. 2023, 258, 119202. [Google Scholar] [CrossRef]
- Fallahi, H. Evolution of primary and secondary twins during tensile cyclic loading in magnesium alloy ZM21 by quasi in situ EBSD. Mater. Sci. Eng. A 2022, 857, 144057. [Google Scholar] [CrossRef]


| Al | Zn | Mn | Cu | Ni | Si | Fe | Mg |
|---|---|---|---|---|---|---|---|
| 2.47 | 0.93 | 0.3 | 0.005 | 0.002 | 0.06 | 0.002 | Bal |
| Sample Name | Treatments |
|---|---|
| TD sample | TD compression |
| TR sample | Cross compression along the TD and RD |
| TDH sample | TD compression and aging at 180 °C for about 0.5 h |
| TRH sample | Cross compression along the TD and RD +aging at 180 °C for about 0.5 h |
| TD/RD | ND | |||
|---|---|---|---|---|
| YS/MPa | UTS/MPa | YS/MPa | UTS/MPa | |
| TD sample | 38.2 | 270.8 | 70.6 | 325.9 |
| TR sample | 108.5 | 334.0 | 111.8 | 307.2 |
| TDH sample | 96.3 | 321.1 | 109.2 | 332.8 |
| TRH sample | 123.8 | 382.0 | 136.0 | 424.8 |
Disclaimer/Publisher’s Note: The statements, opinions and data contained in all publications are solely those of the individual author(s) and contributor(s) and not of MDPI and/or the editor(s). MDPI and/or the editor(s) disclaim responsibility for any injury to people or property resulting from any ideas, methods, instructions or products referred to in the content. |
© 2024 by the authors. Licensee MDPI, Basel, Switzerland. This article is an open access article distributed under the terms and conditions of the Creative Commons Attribution (CC BY) license (https://creativecommons.org/licenses/by/4.0/).
Share and Cite
Dai, H.; Sun, M.; Cheng, Y. Deformation Behavior of AZ31 Magnesium Alloy with Pre-Twins under Biaxial Tension. Materials 2024, 17, 3377. https://doi.org/10.3390/ma17133377
Dai H, Sun M, Cheng Y. Deformation Behavior of AZ31 Magnesium Alloy with Pre-Twins under Biaxial Tension. Materials. 2024; 17(13):3377. https://doi.org/10.3390/ma17133377
Chicago/Turabian StyleDai, Hanshu, Mengmeng Sun, and Yao Cheng. 2024. "Deformation Behavior of AZ31 Magnesium Alloy with Pre-Twins under Biaxial Tension" Materials 17, no. 13: 3377. https://doi.org/10.3390/ma17133377
APA StyleDai, H., Sun, M., & Cheng, Y. (2024). Deformation Behavior of AZ31 Magnesium Alloy with Pre-Twins under Biaxial Tension. Materials, 17(13), 3377. https://doi.org/10.3390/ma17133377