
Effect of Temperature on Passive Film Characteristics of LPBF (Laser Powder-Bed Fusion) Processing on UNS-S31603


Abstract
1. Introduction
2. Materials and Methods
3. Results
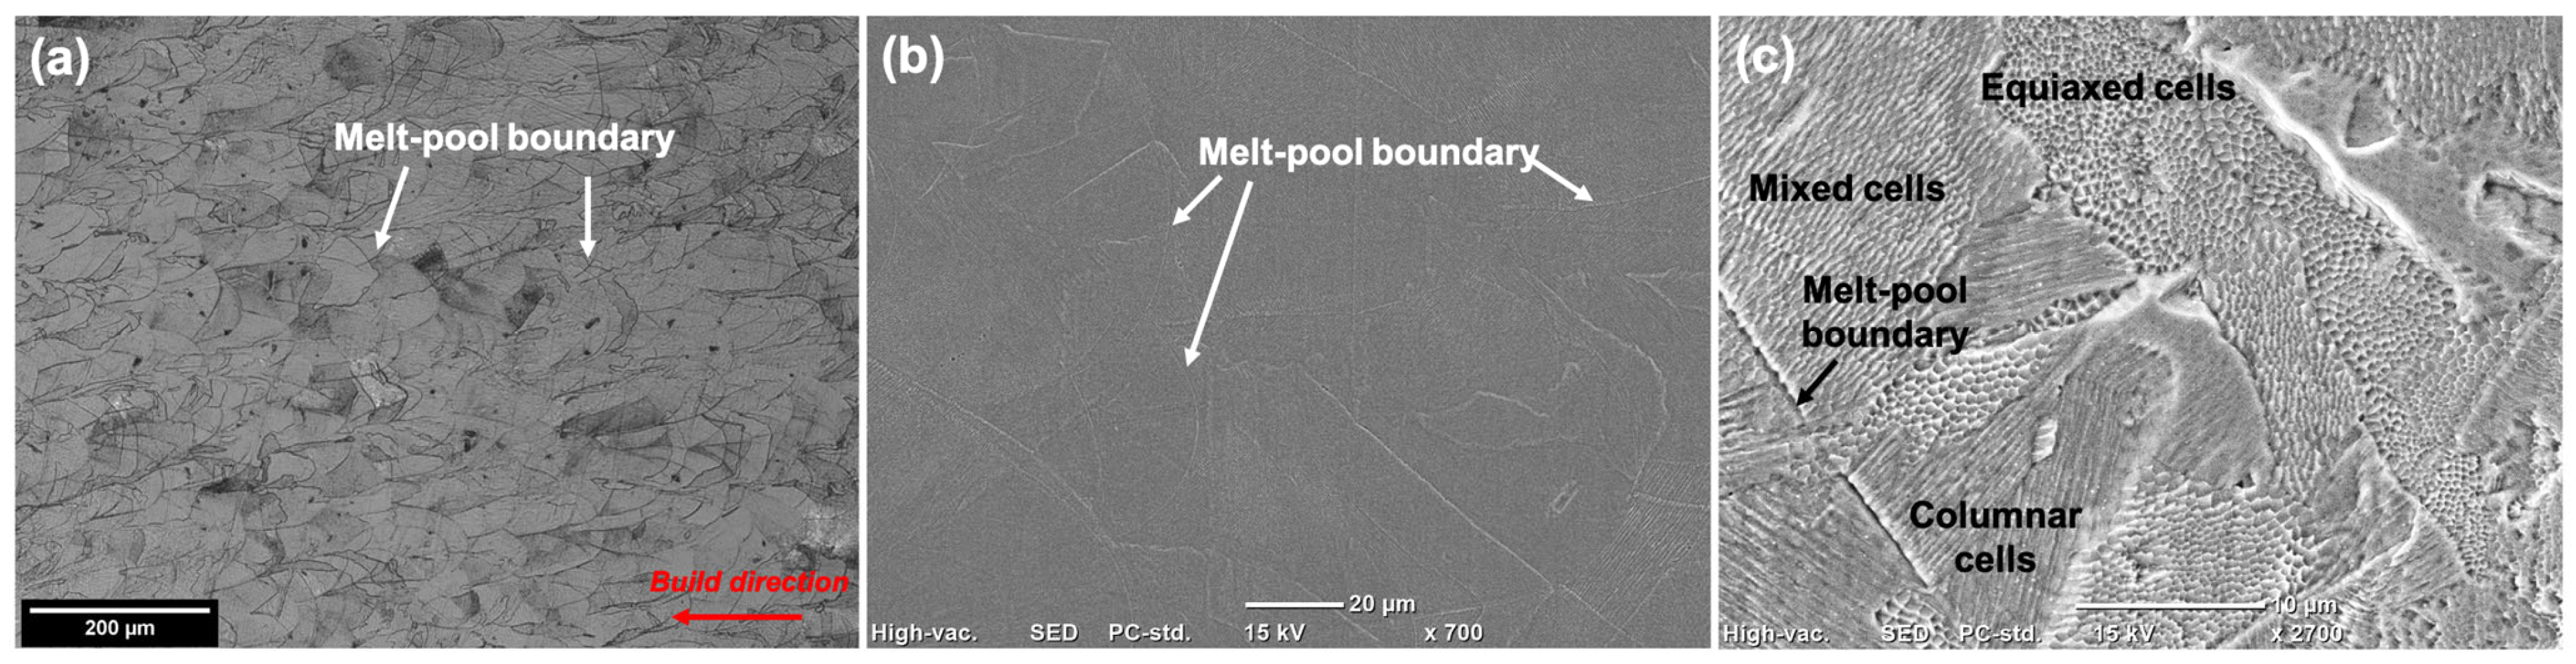
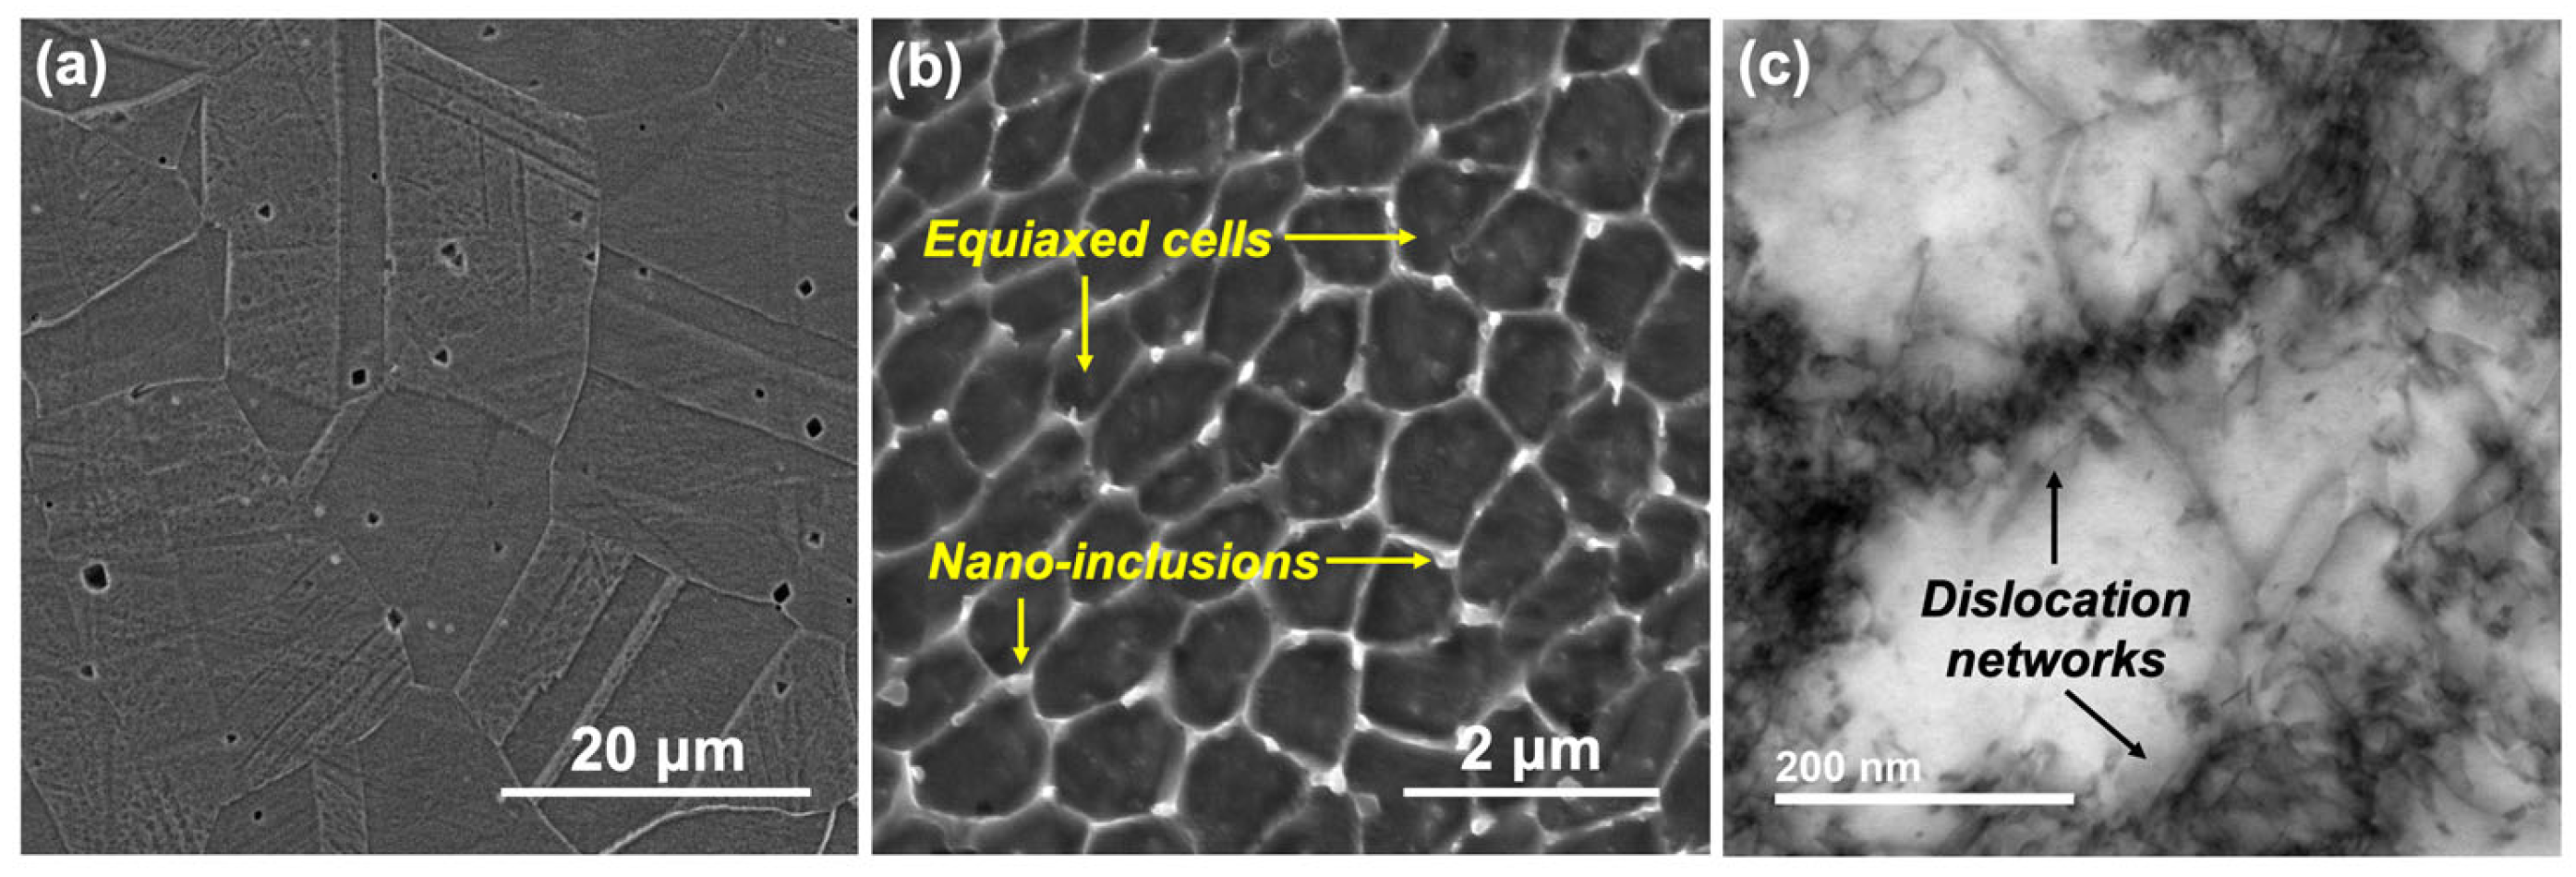
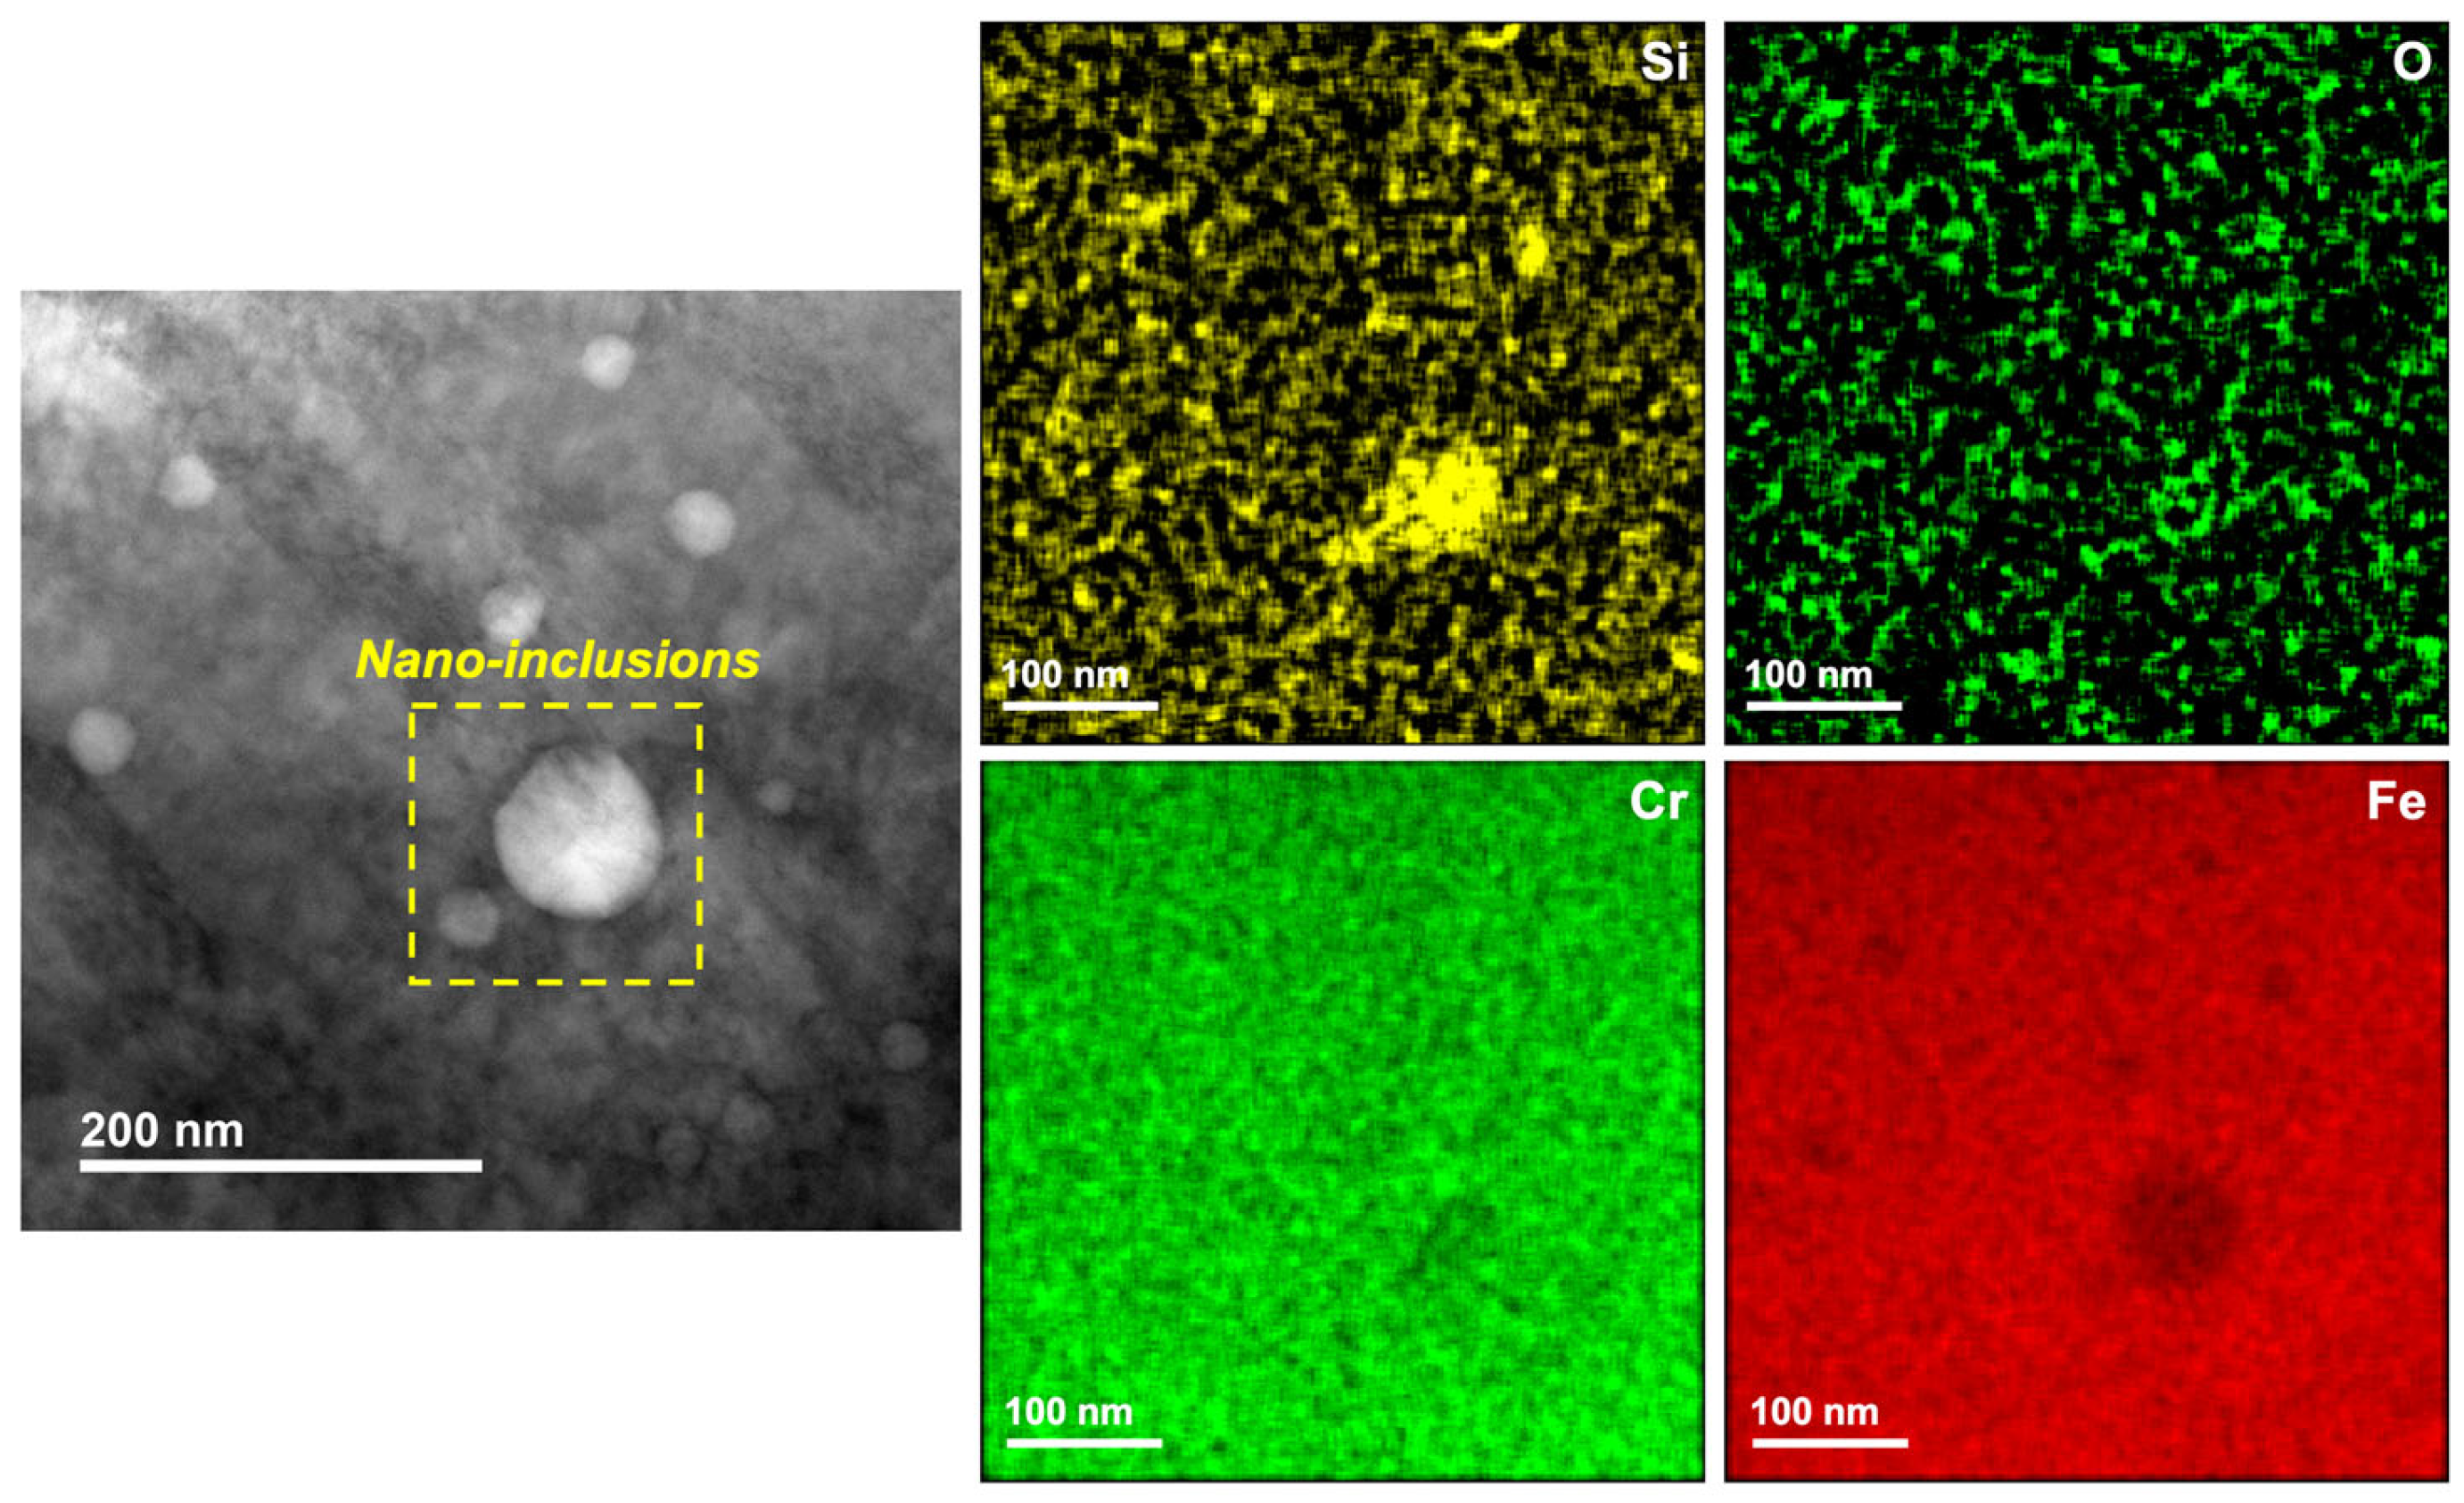
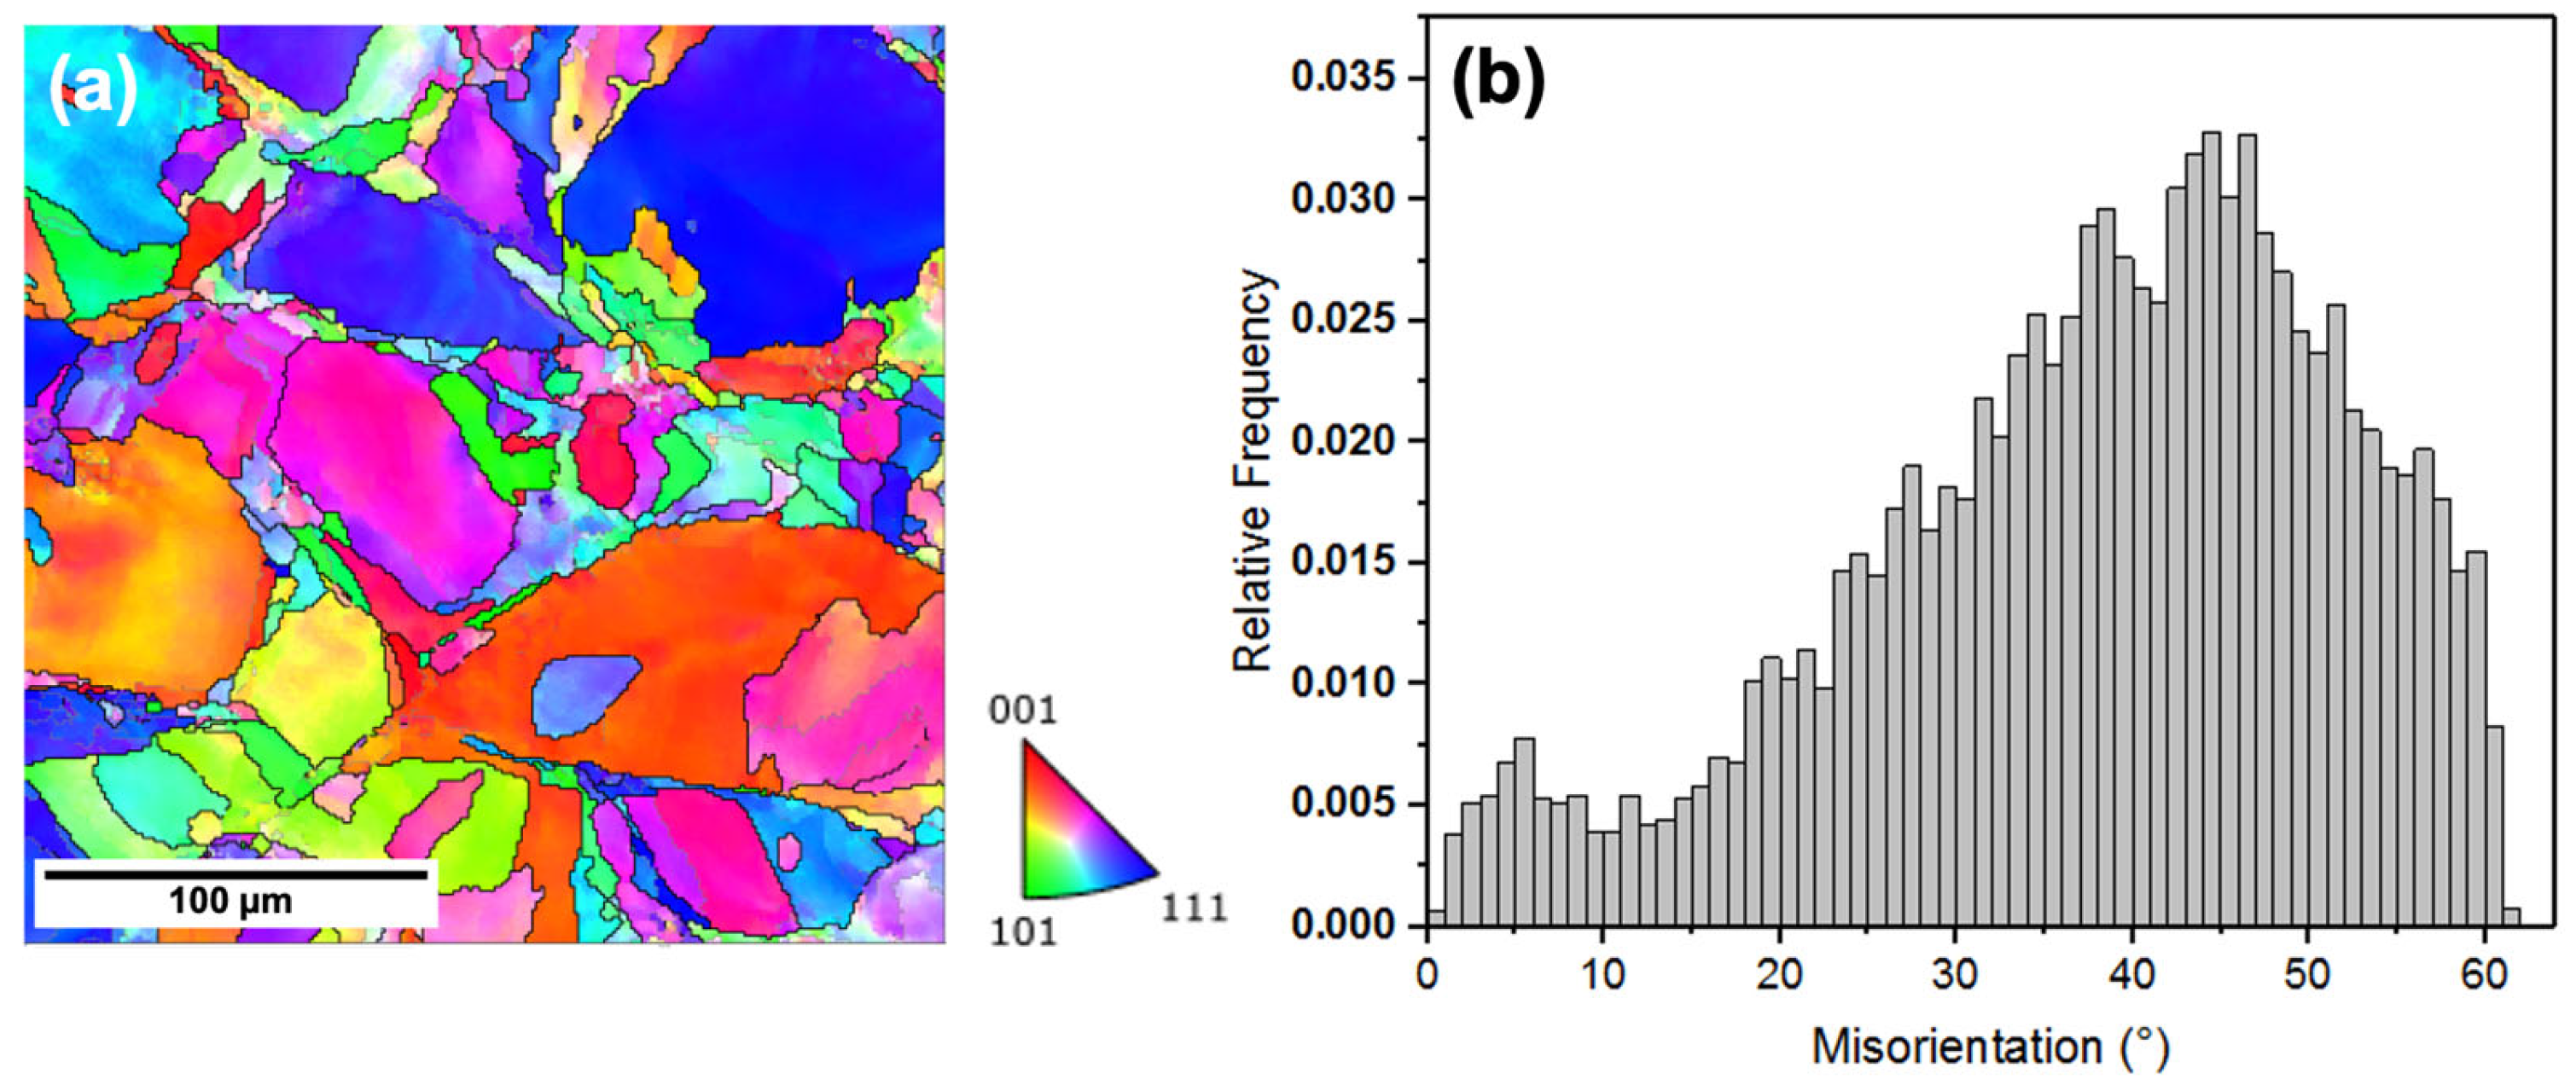
3.1. Microstructure
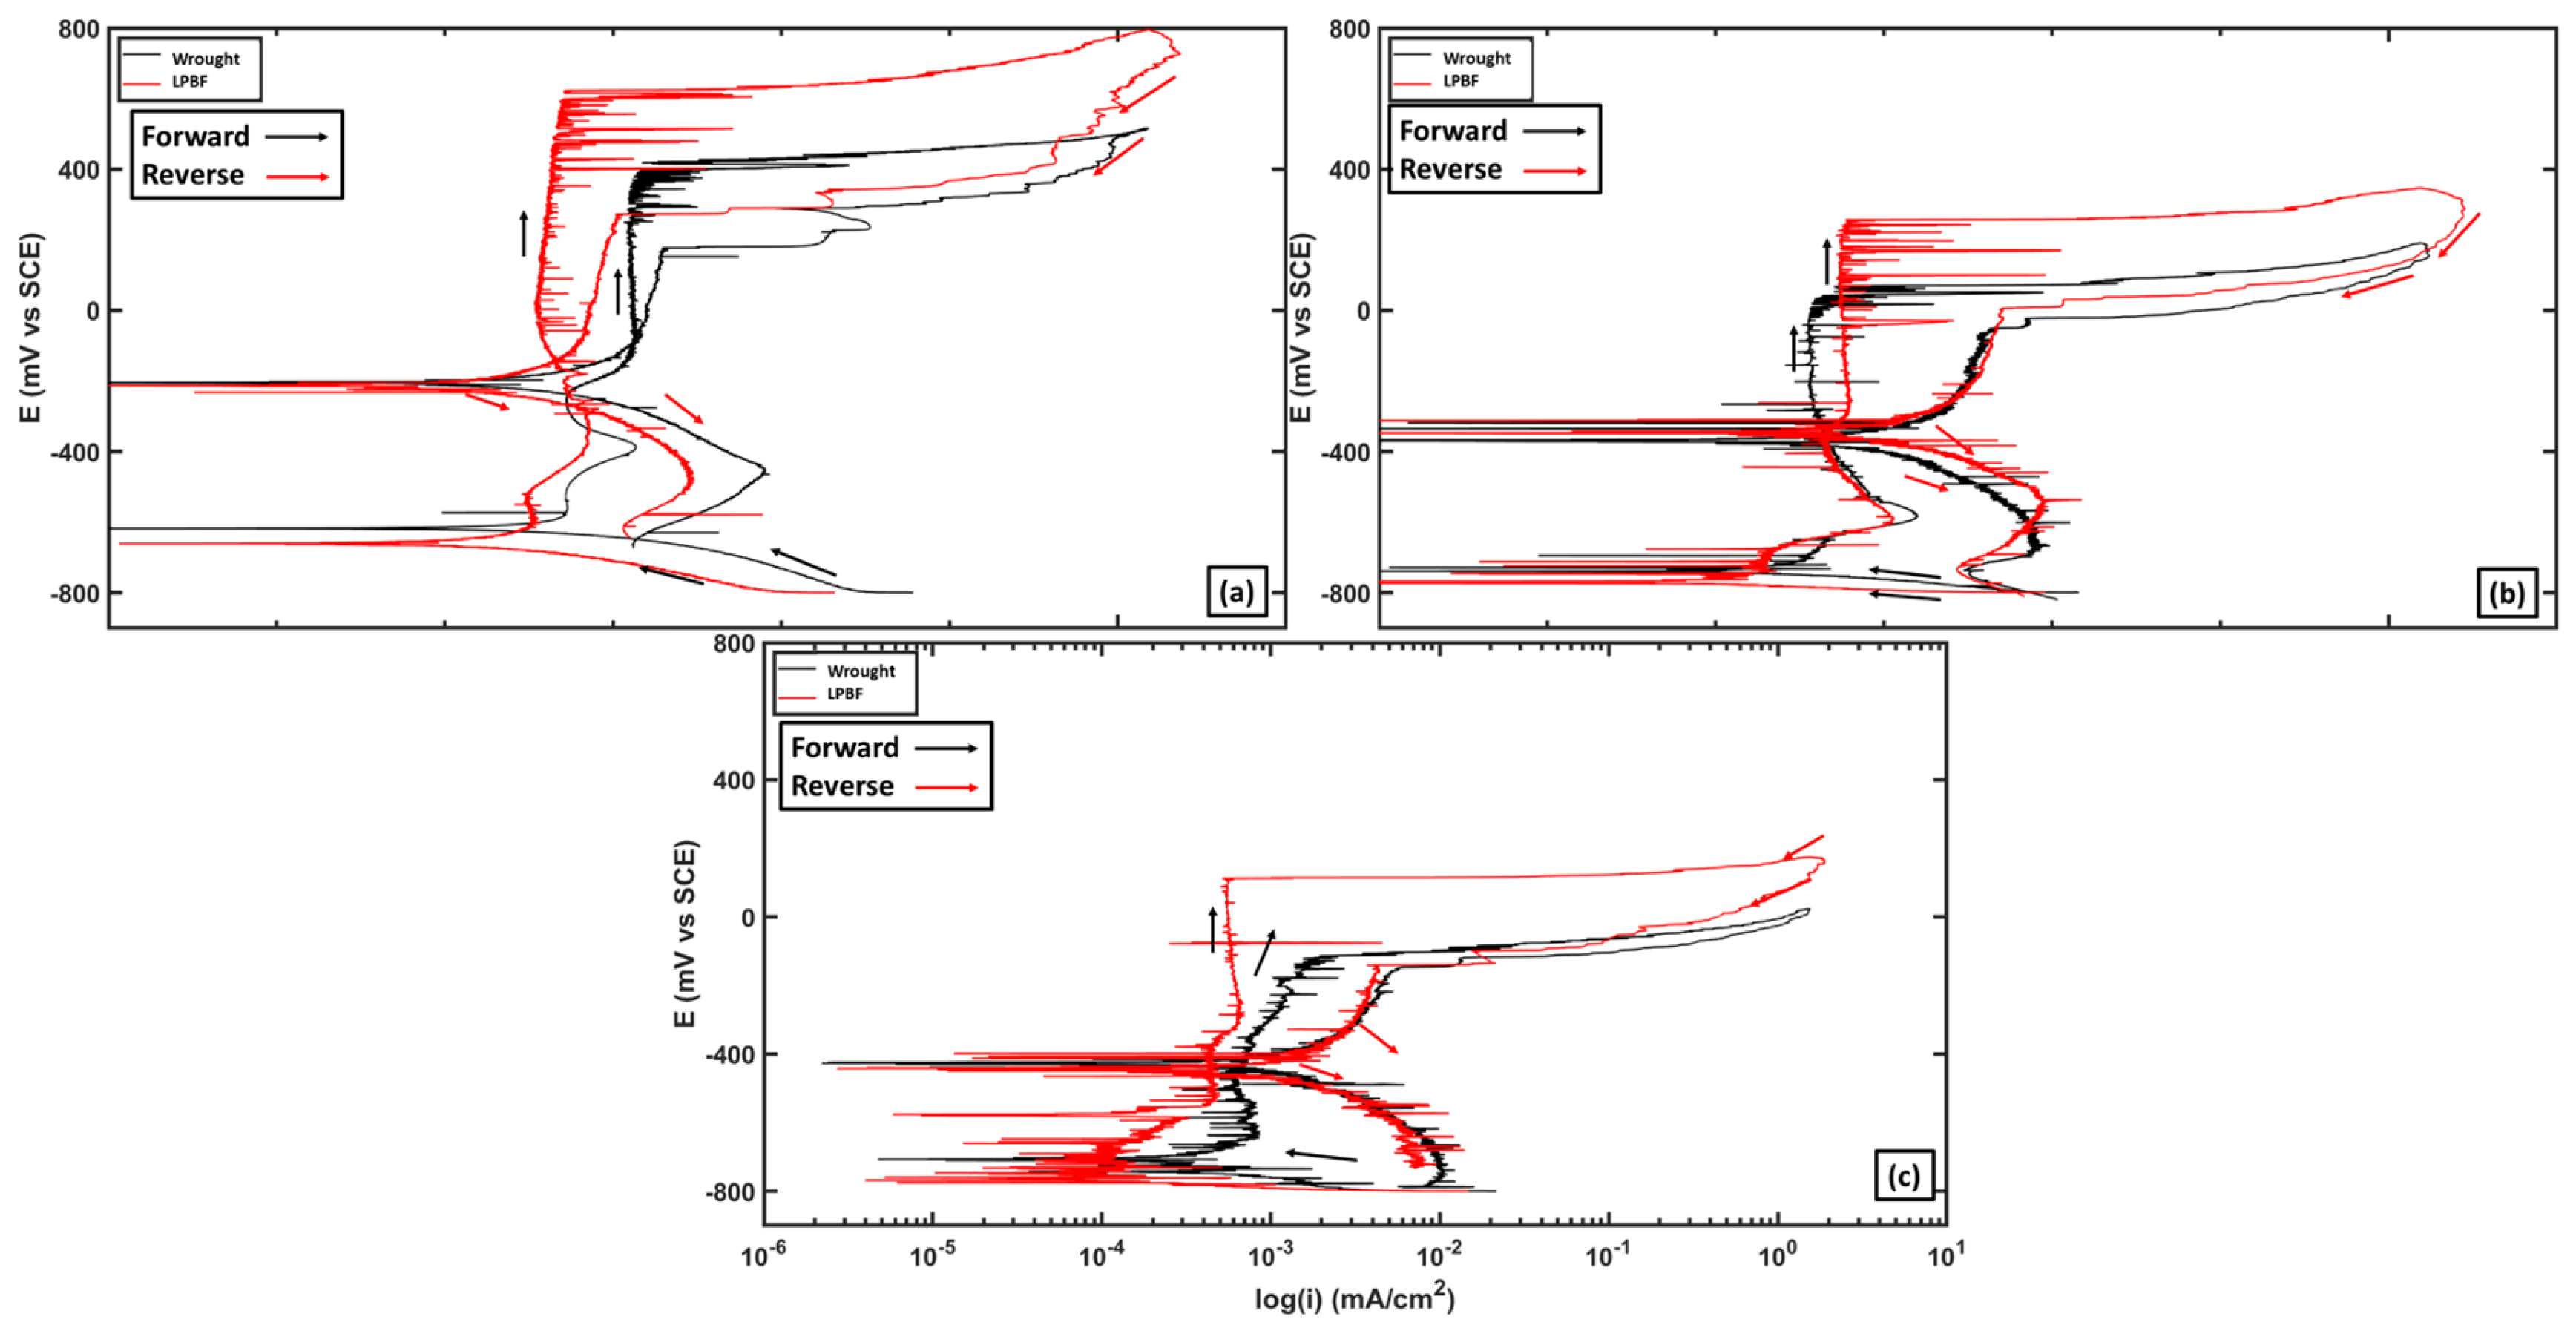
3.2. DC Electrochemical Testing
3.3. AC Electrochemical Testing
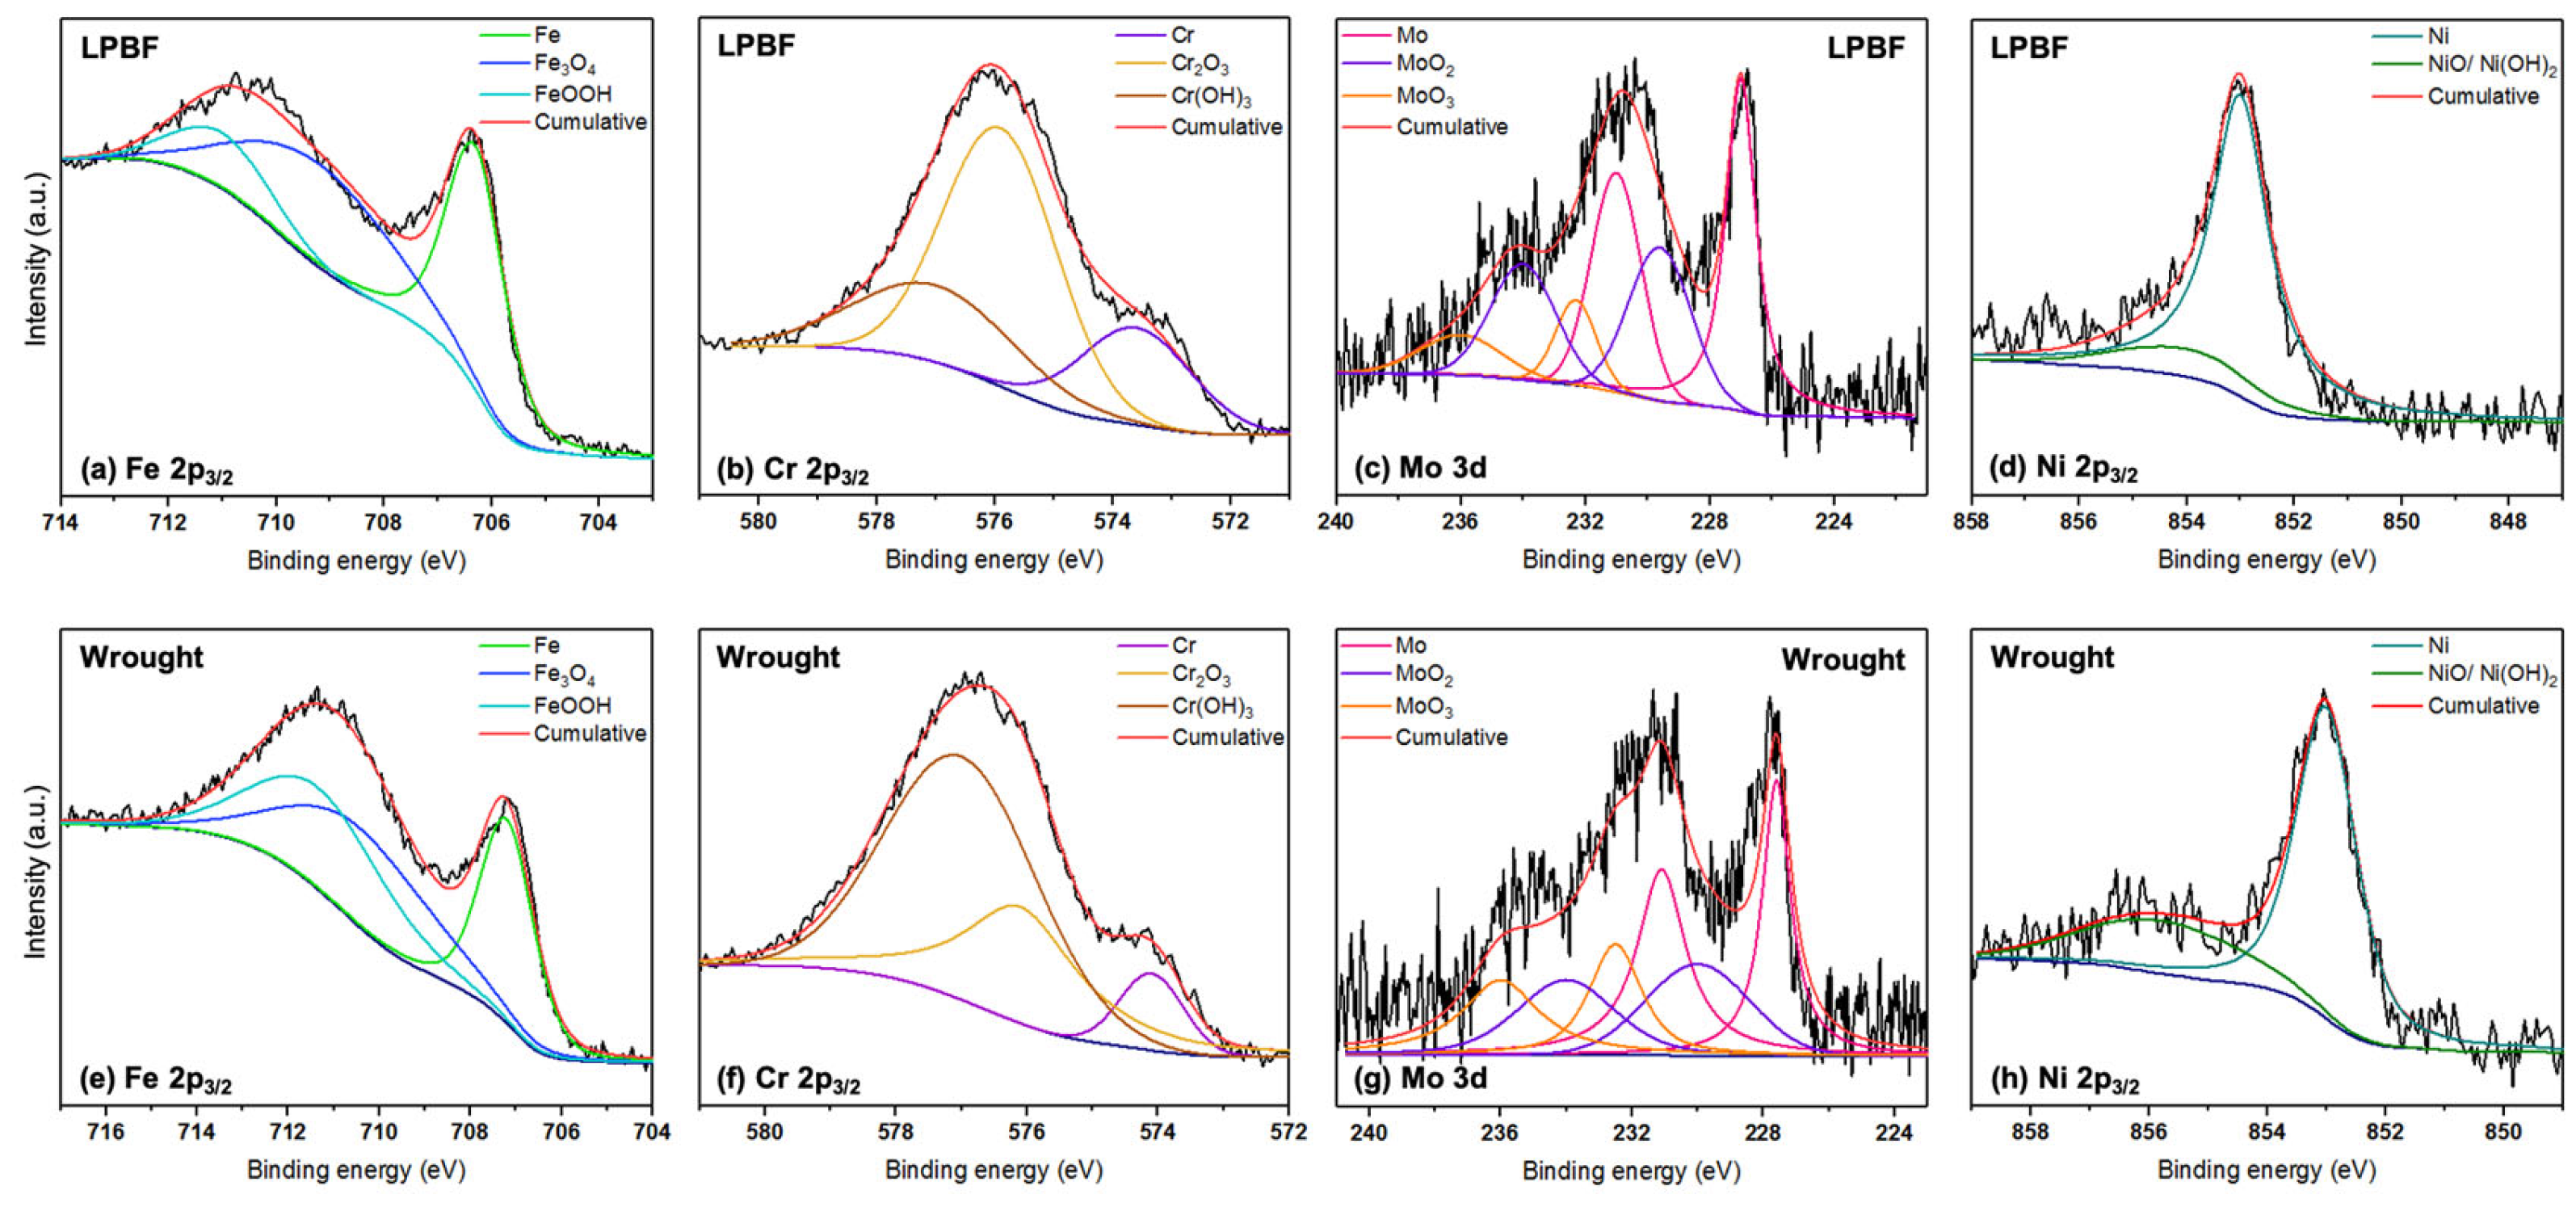
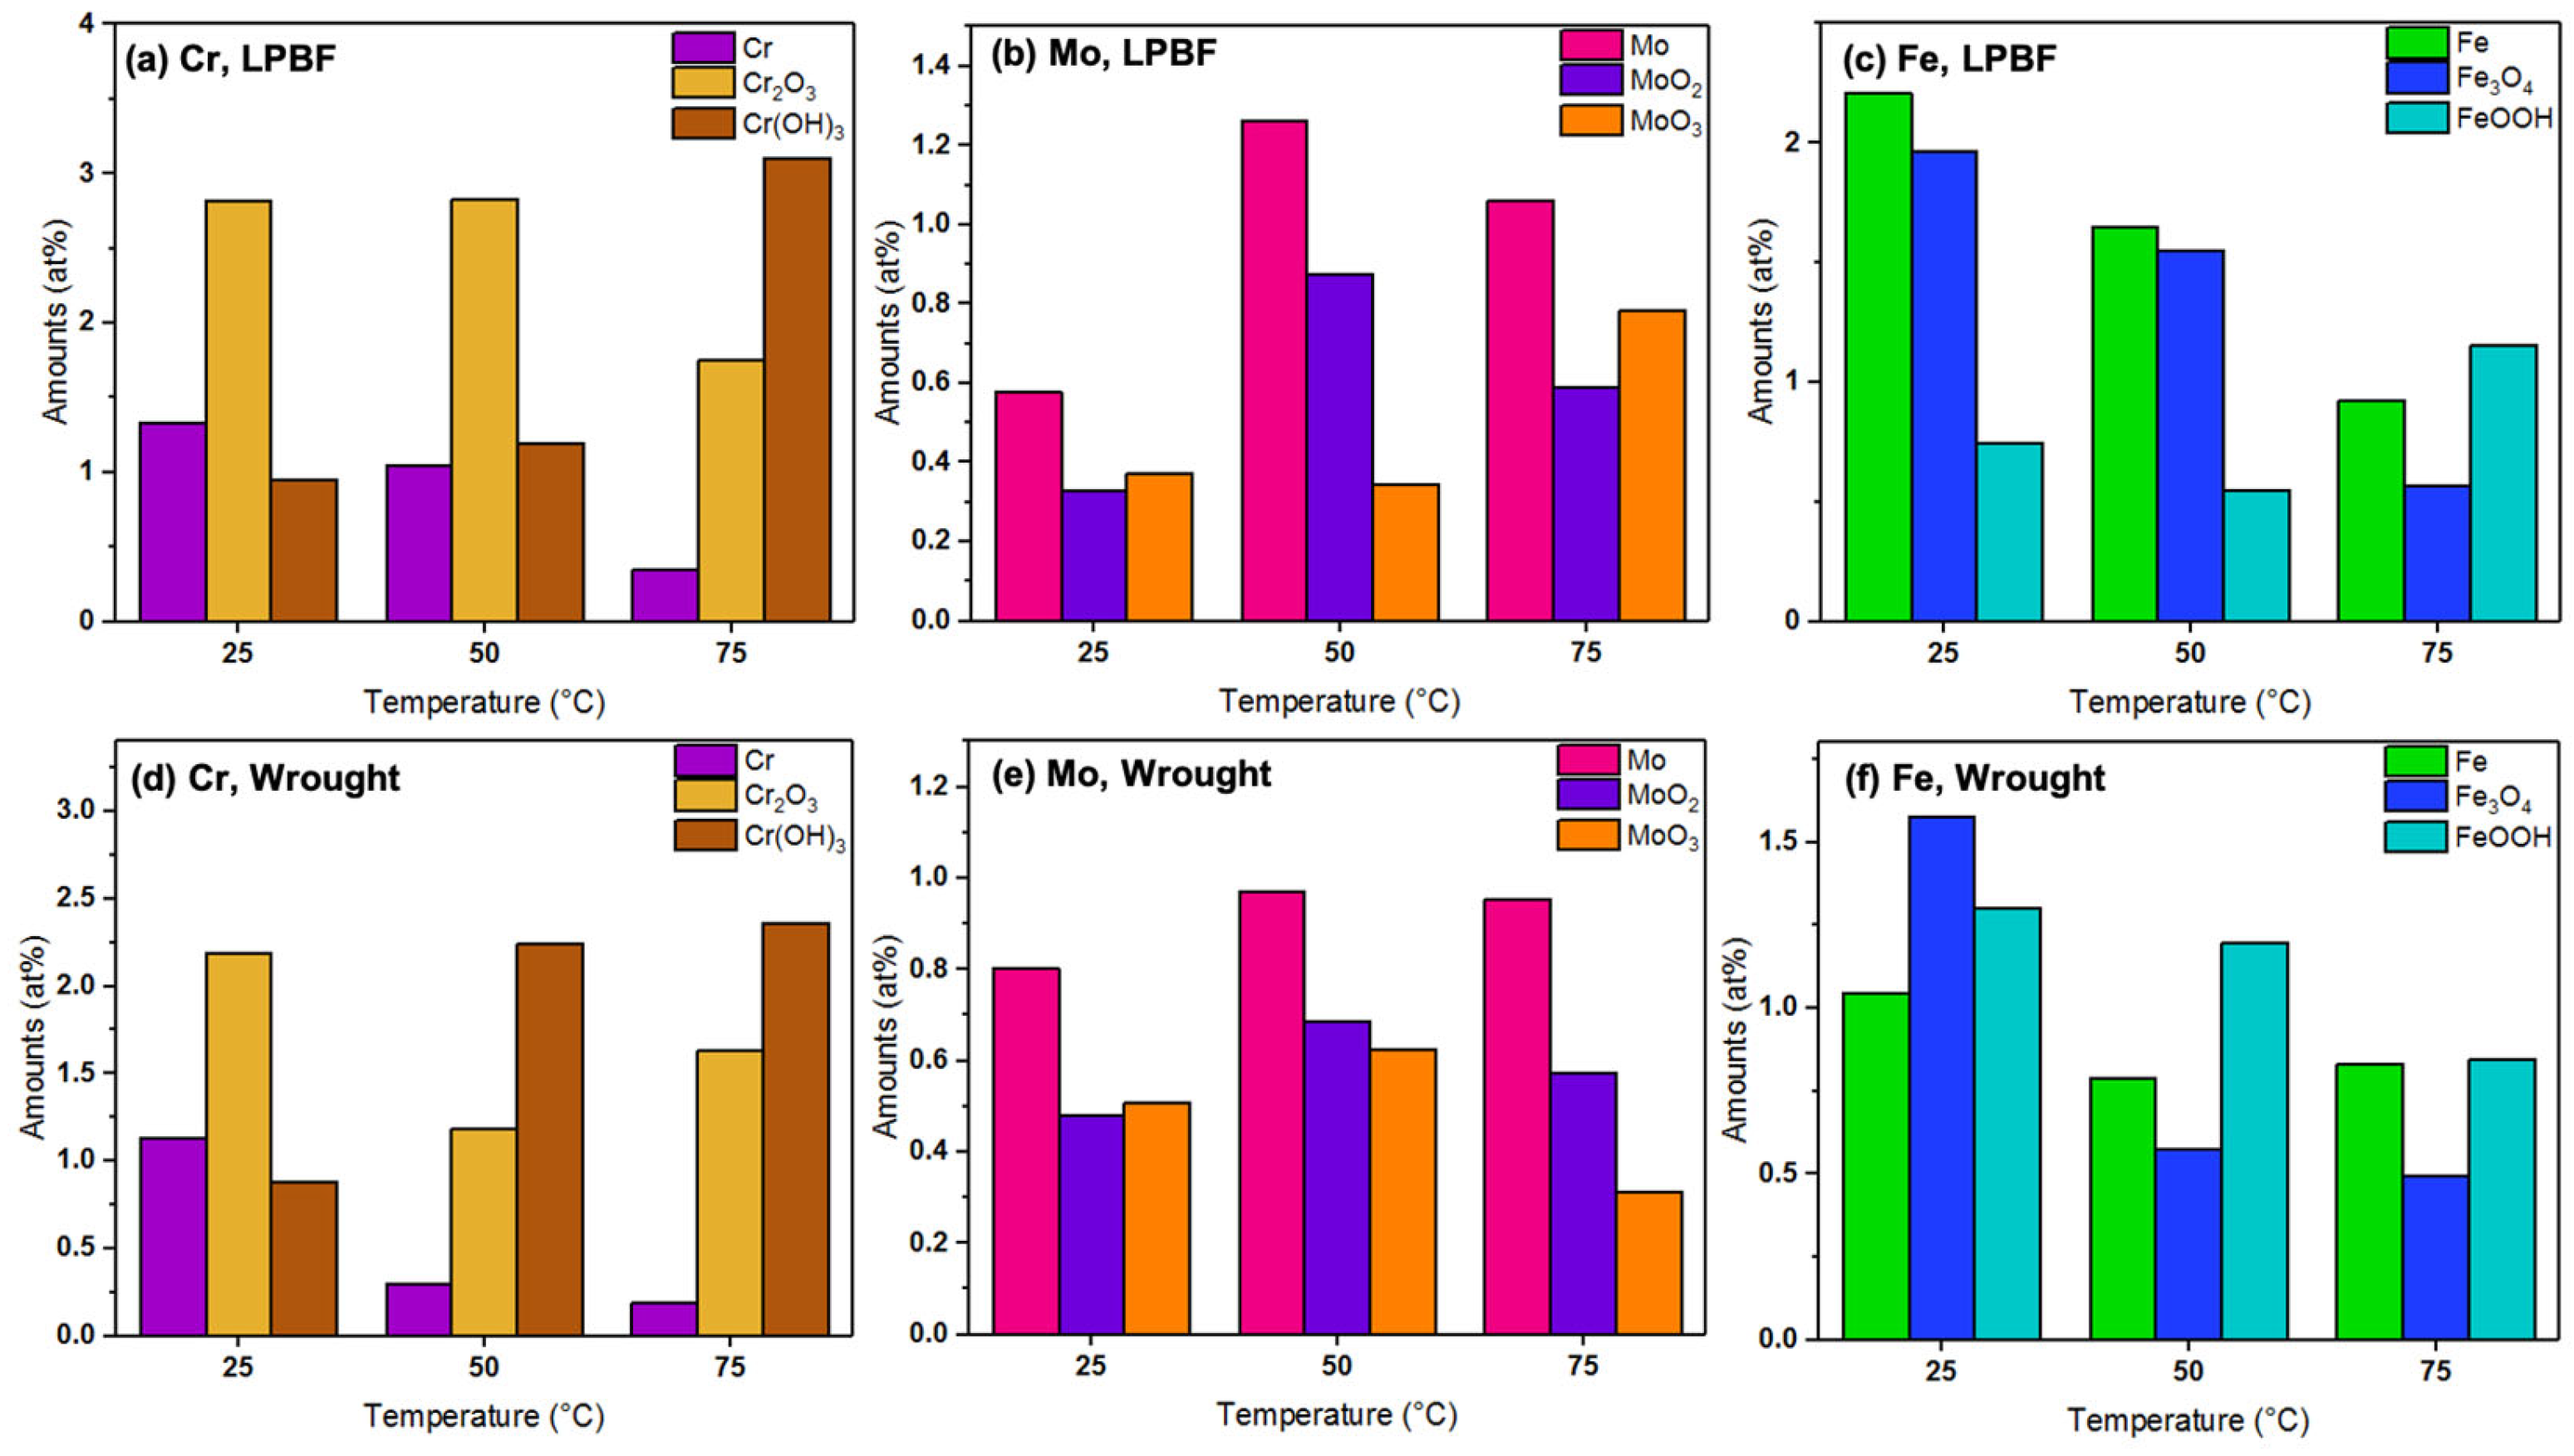
3.4. XPS Measurements
4. Discussion
5. Conclusions
- (i)
- Comparing the microstructure of LPBF 316L with wrought showed that the size of the features formed in the LPBF samples were about two orders of magnitude lower than those in the wrought samples, and they showed various morphologies, such as equiaxed and columnar. There was an absence of anodic MnS inclusions in the LPBF samples, with the presence of silicon/Cr oxide nano-inclusions distributed along the cell boundaries instead. Additionally, dislocation networks were found to be present at the cell boundaries.
- (ii)
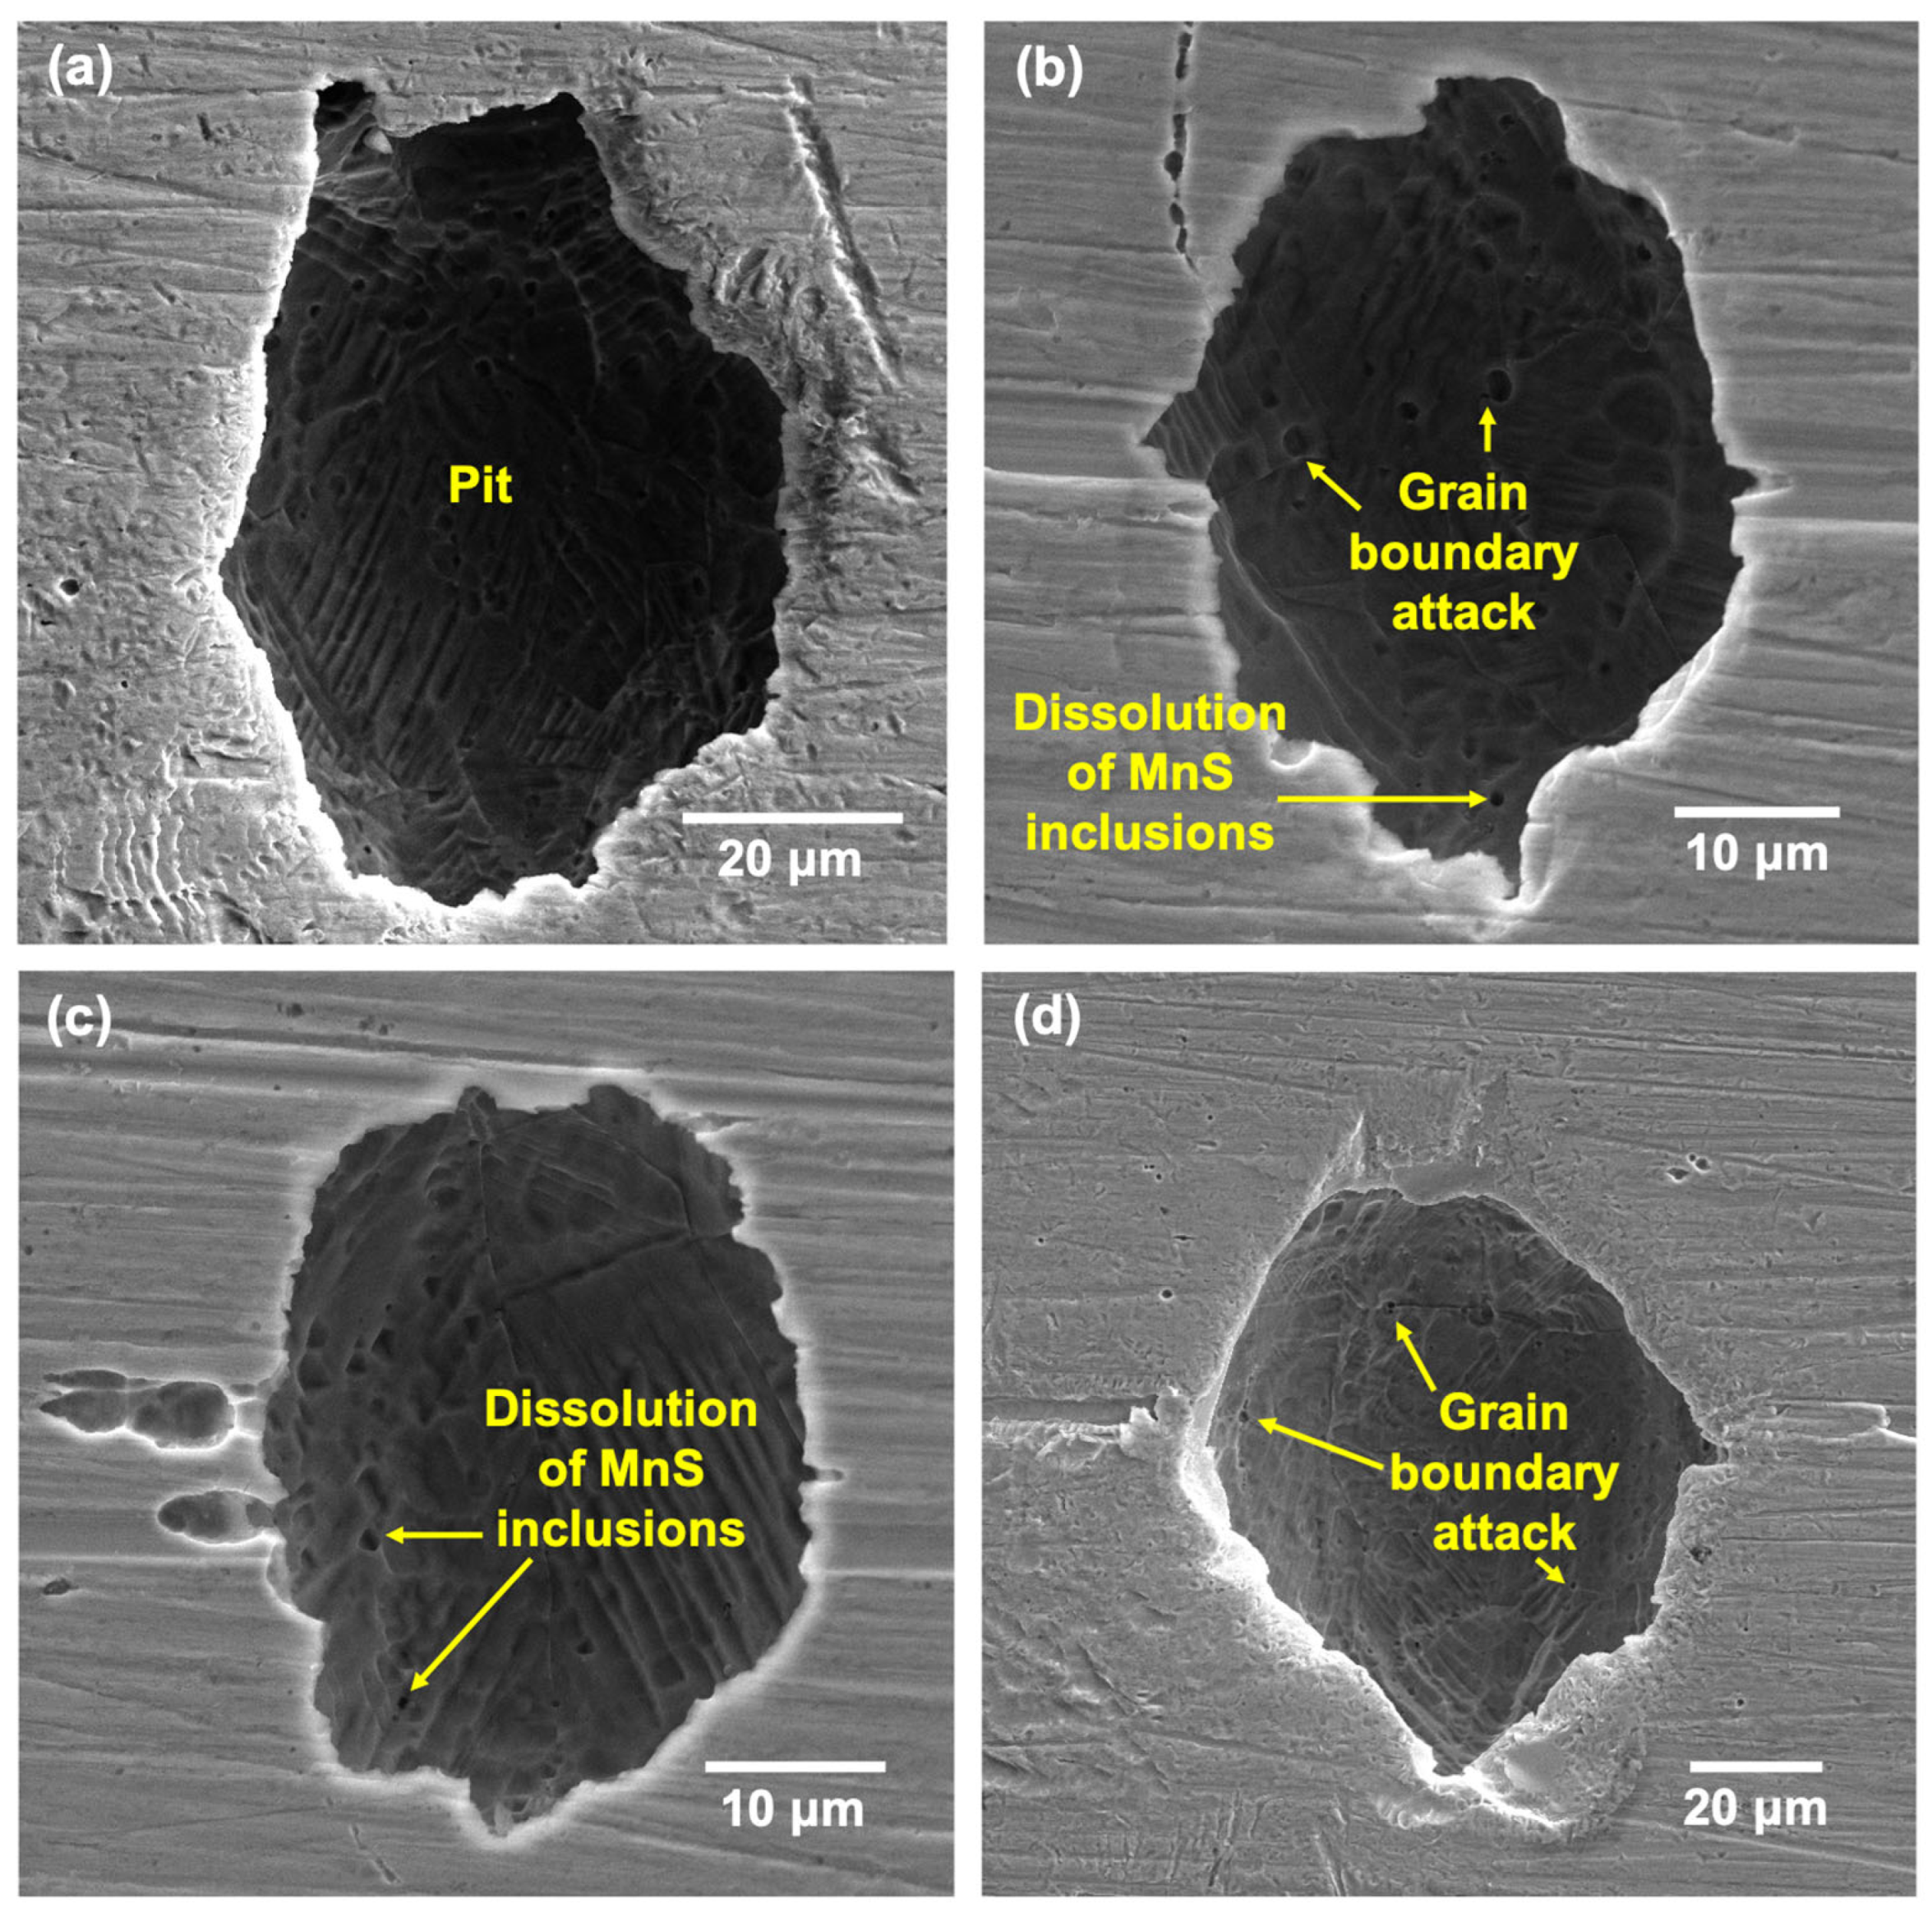
- Cyclic potentiodynamic polarization showed that the 170 W samples showed a higher initial resistance to the onset of localized corrosion compared with wrought 316L. The LPBF samples were more susceptible to metastable pitting over a larger range of potentials compared with the wrought samples. But for the LPBF samples, once pitting has begun, the amount of accumulated damage was higher compared with the wrought 316L.
- (iii)
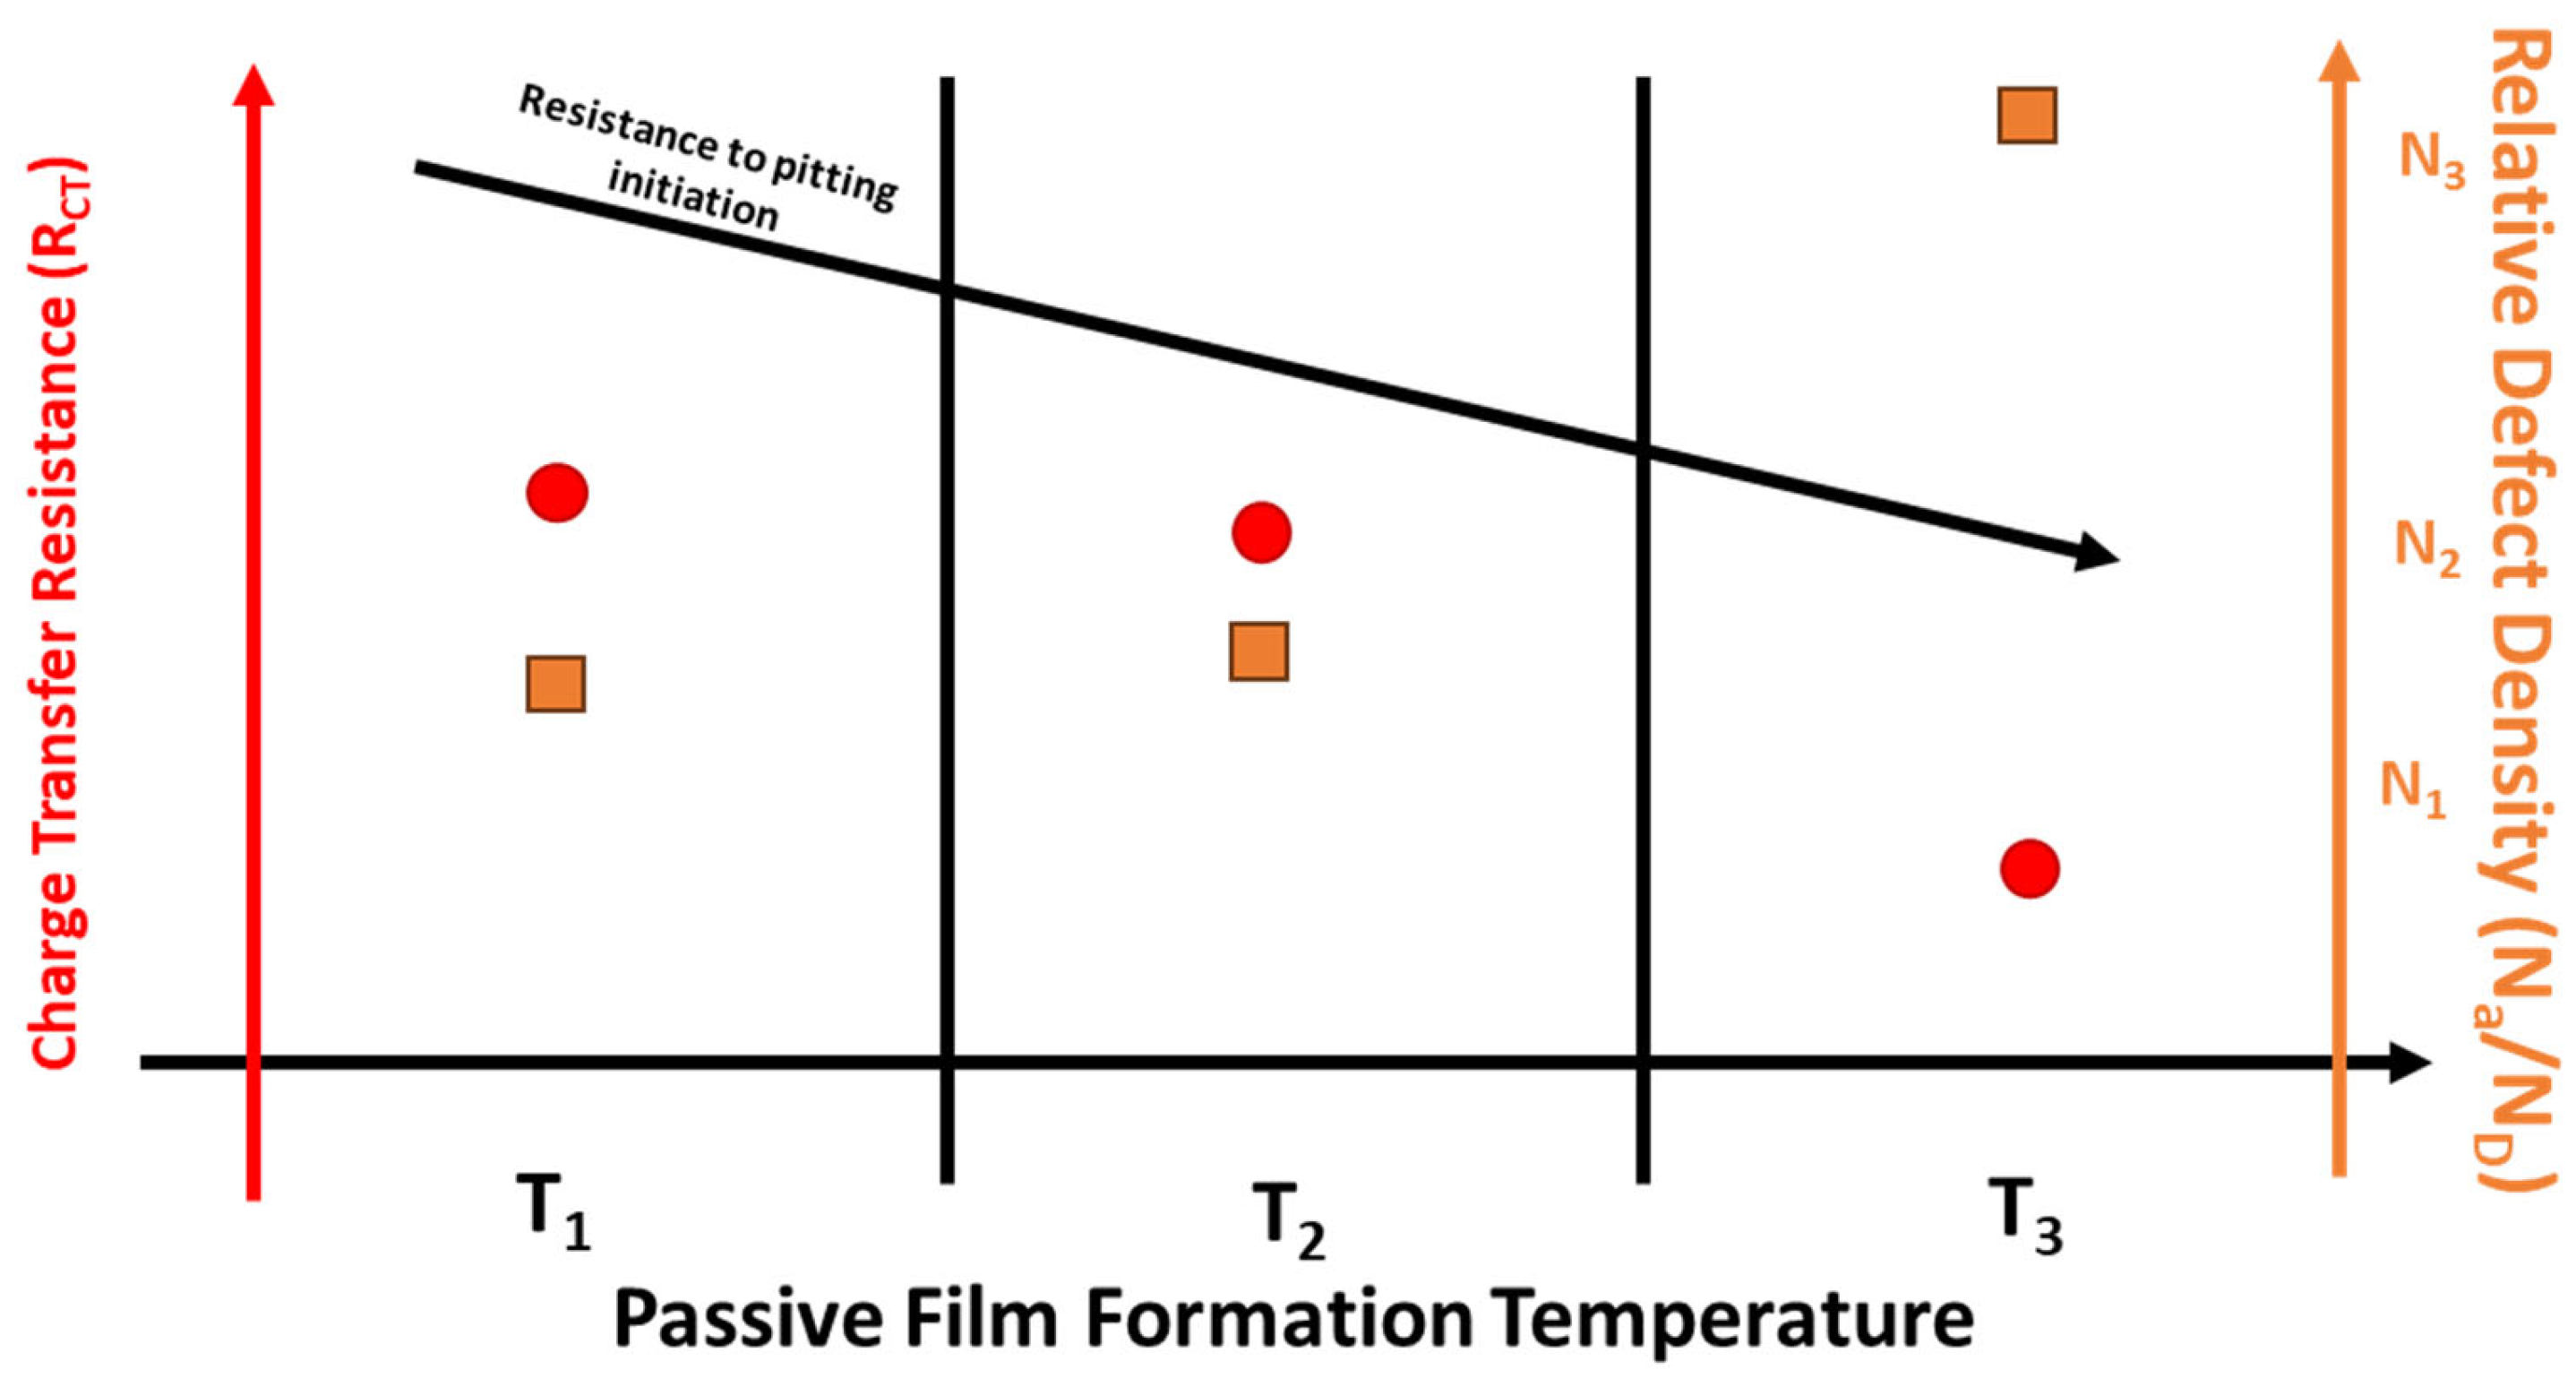
- EIS testing showed that the film formed at OCP on 170 W samples provided more protection compared with film formed on the wrought samples. Mott–Schottky analysis showed that both wrought and 170 W showed a transition of n-type to p-type around OCP. The calculated donor densities were similar for both wrought and LPBF 316L and increased with increasing formation temperature.
- (iv)
- XPS results revealed that the amounts of Cr and Fe oxides and hydroxides were higher on the passive films formed on the LPBF samples at all tested temperatures when compared with the wrought samples, which made the film more corrosion resistant and was the reason for its improved stability.
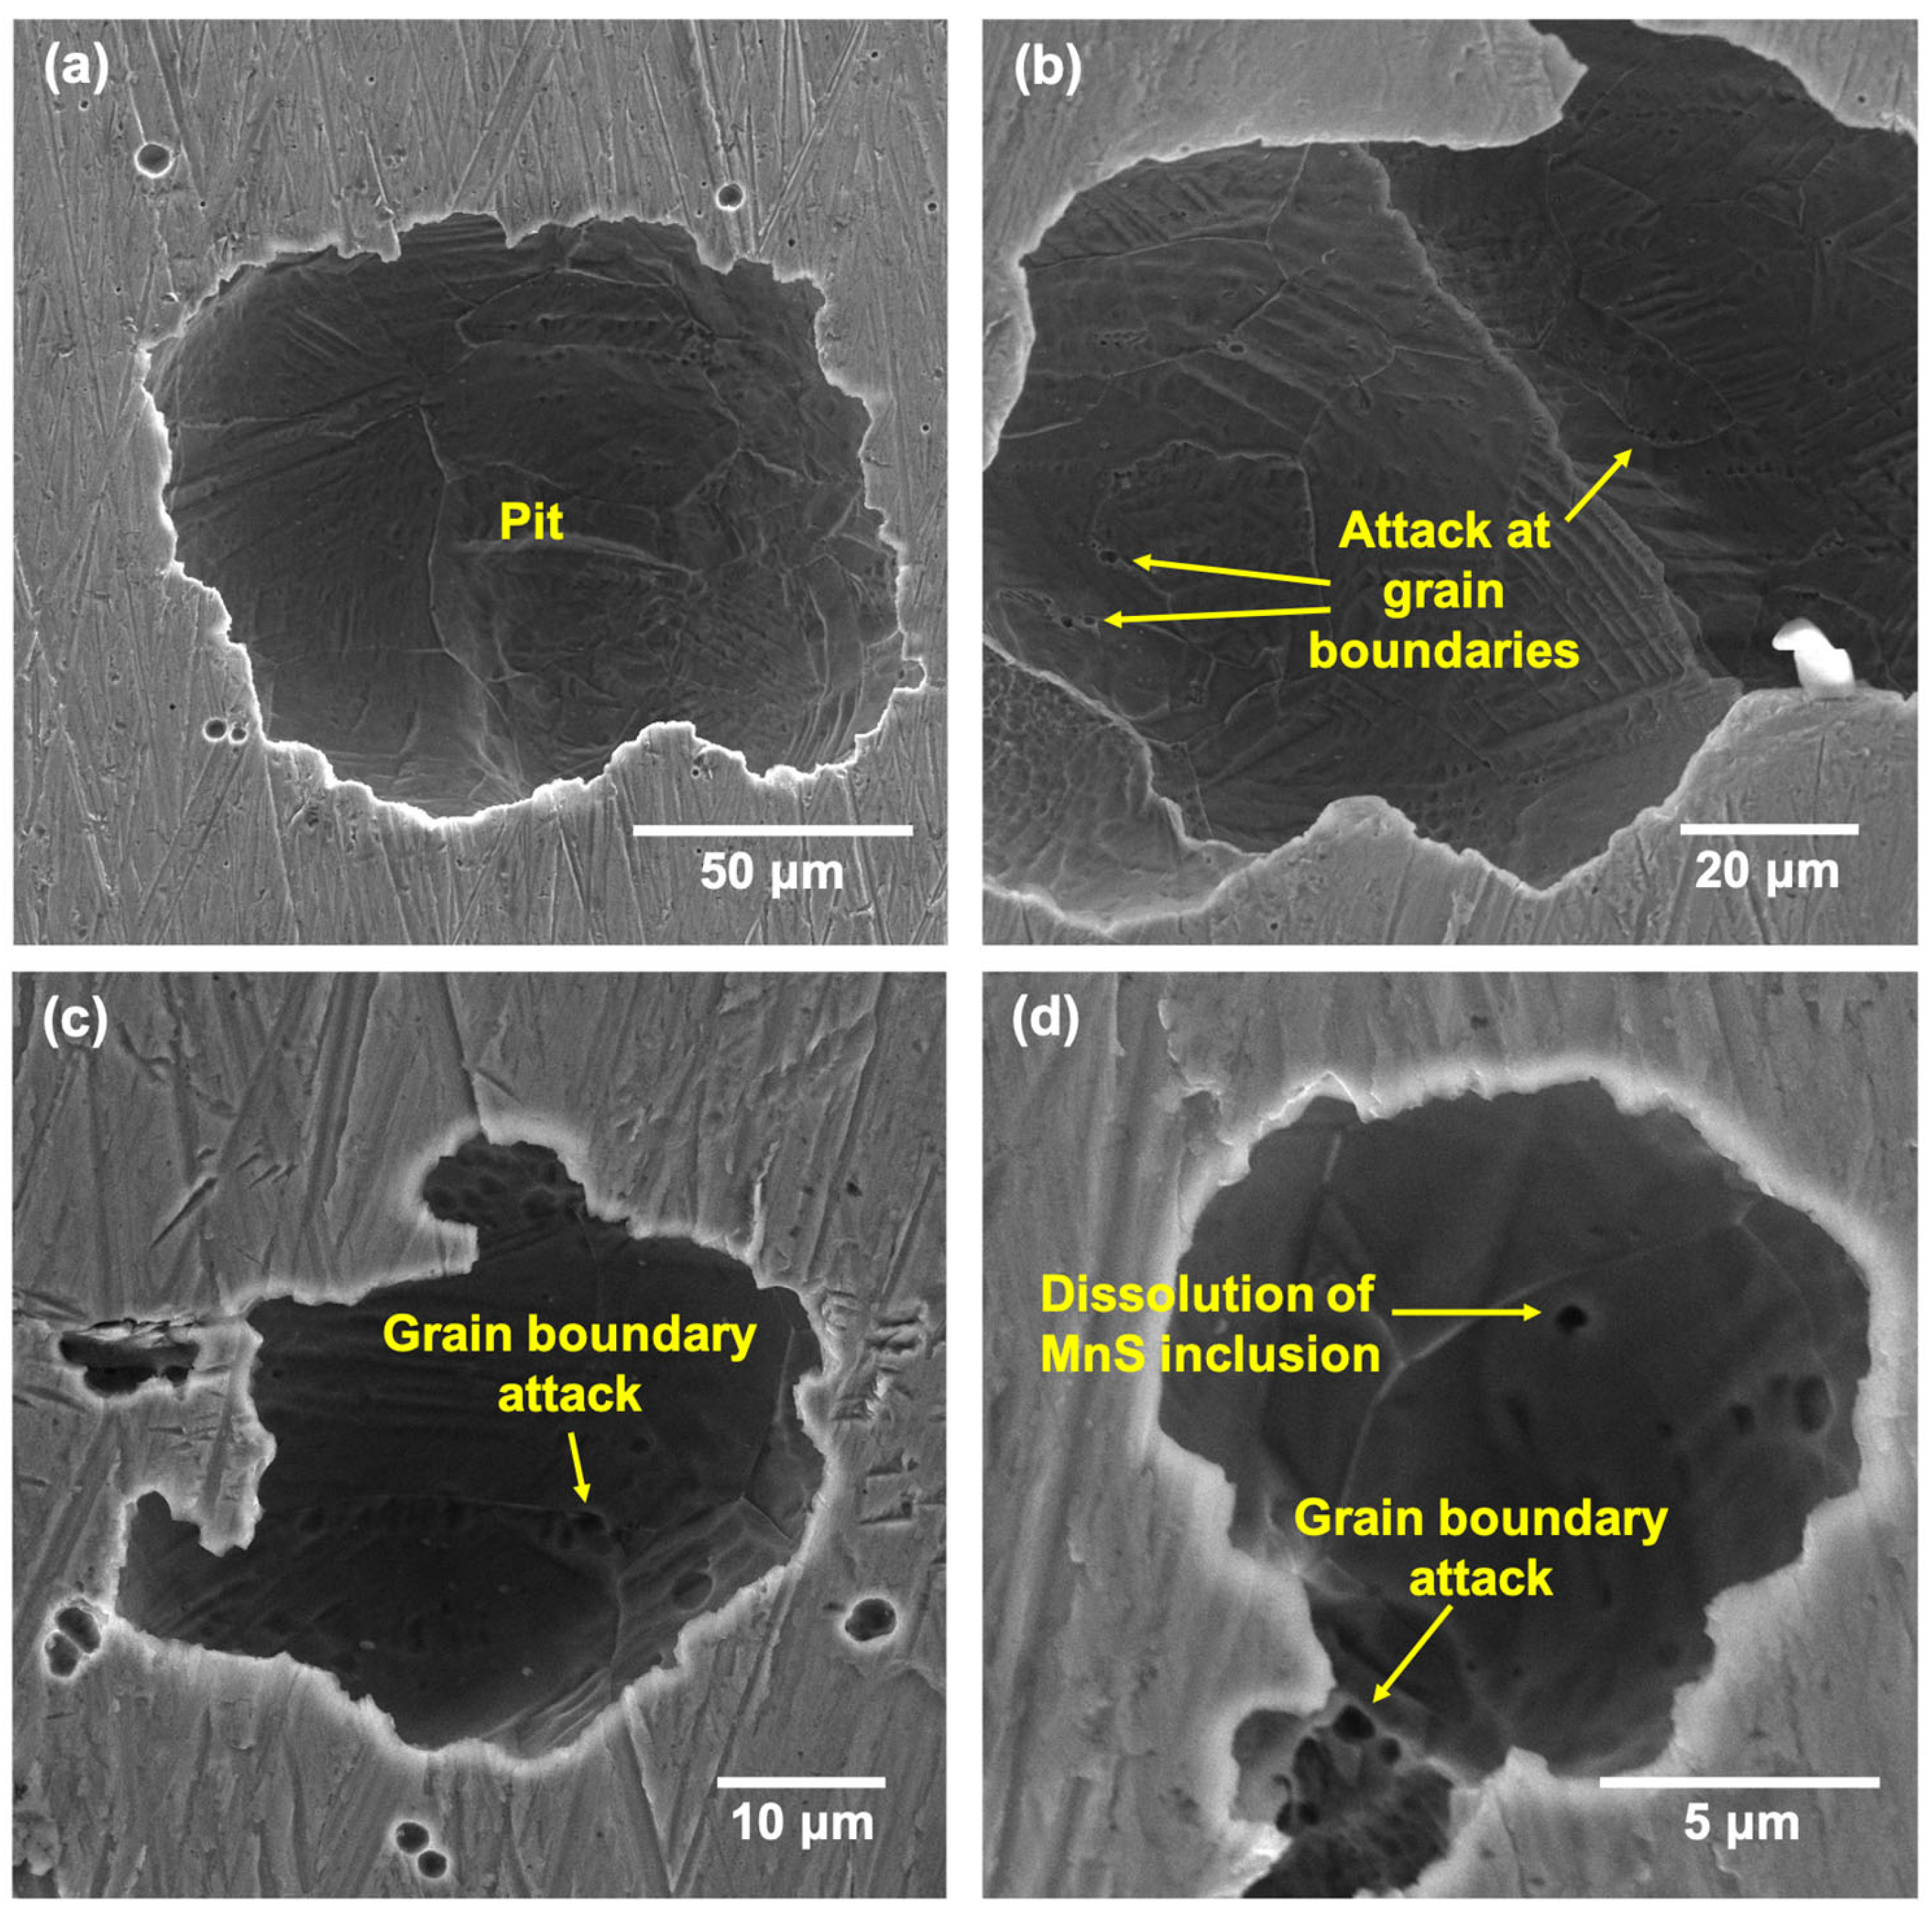
- (v)
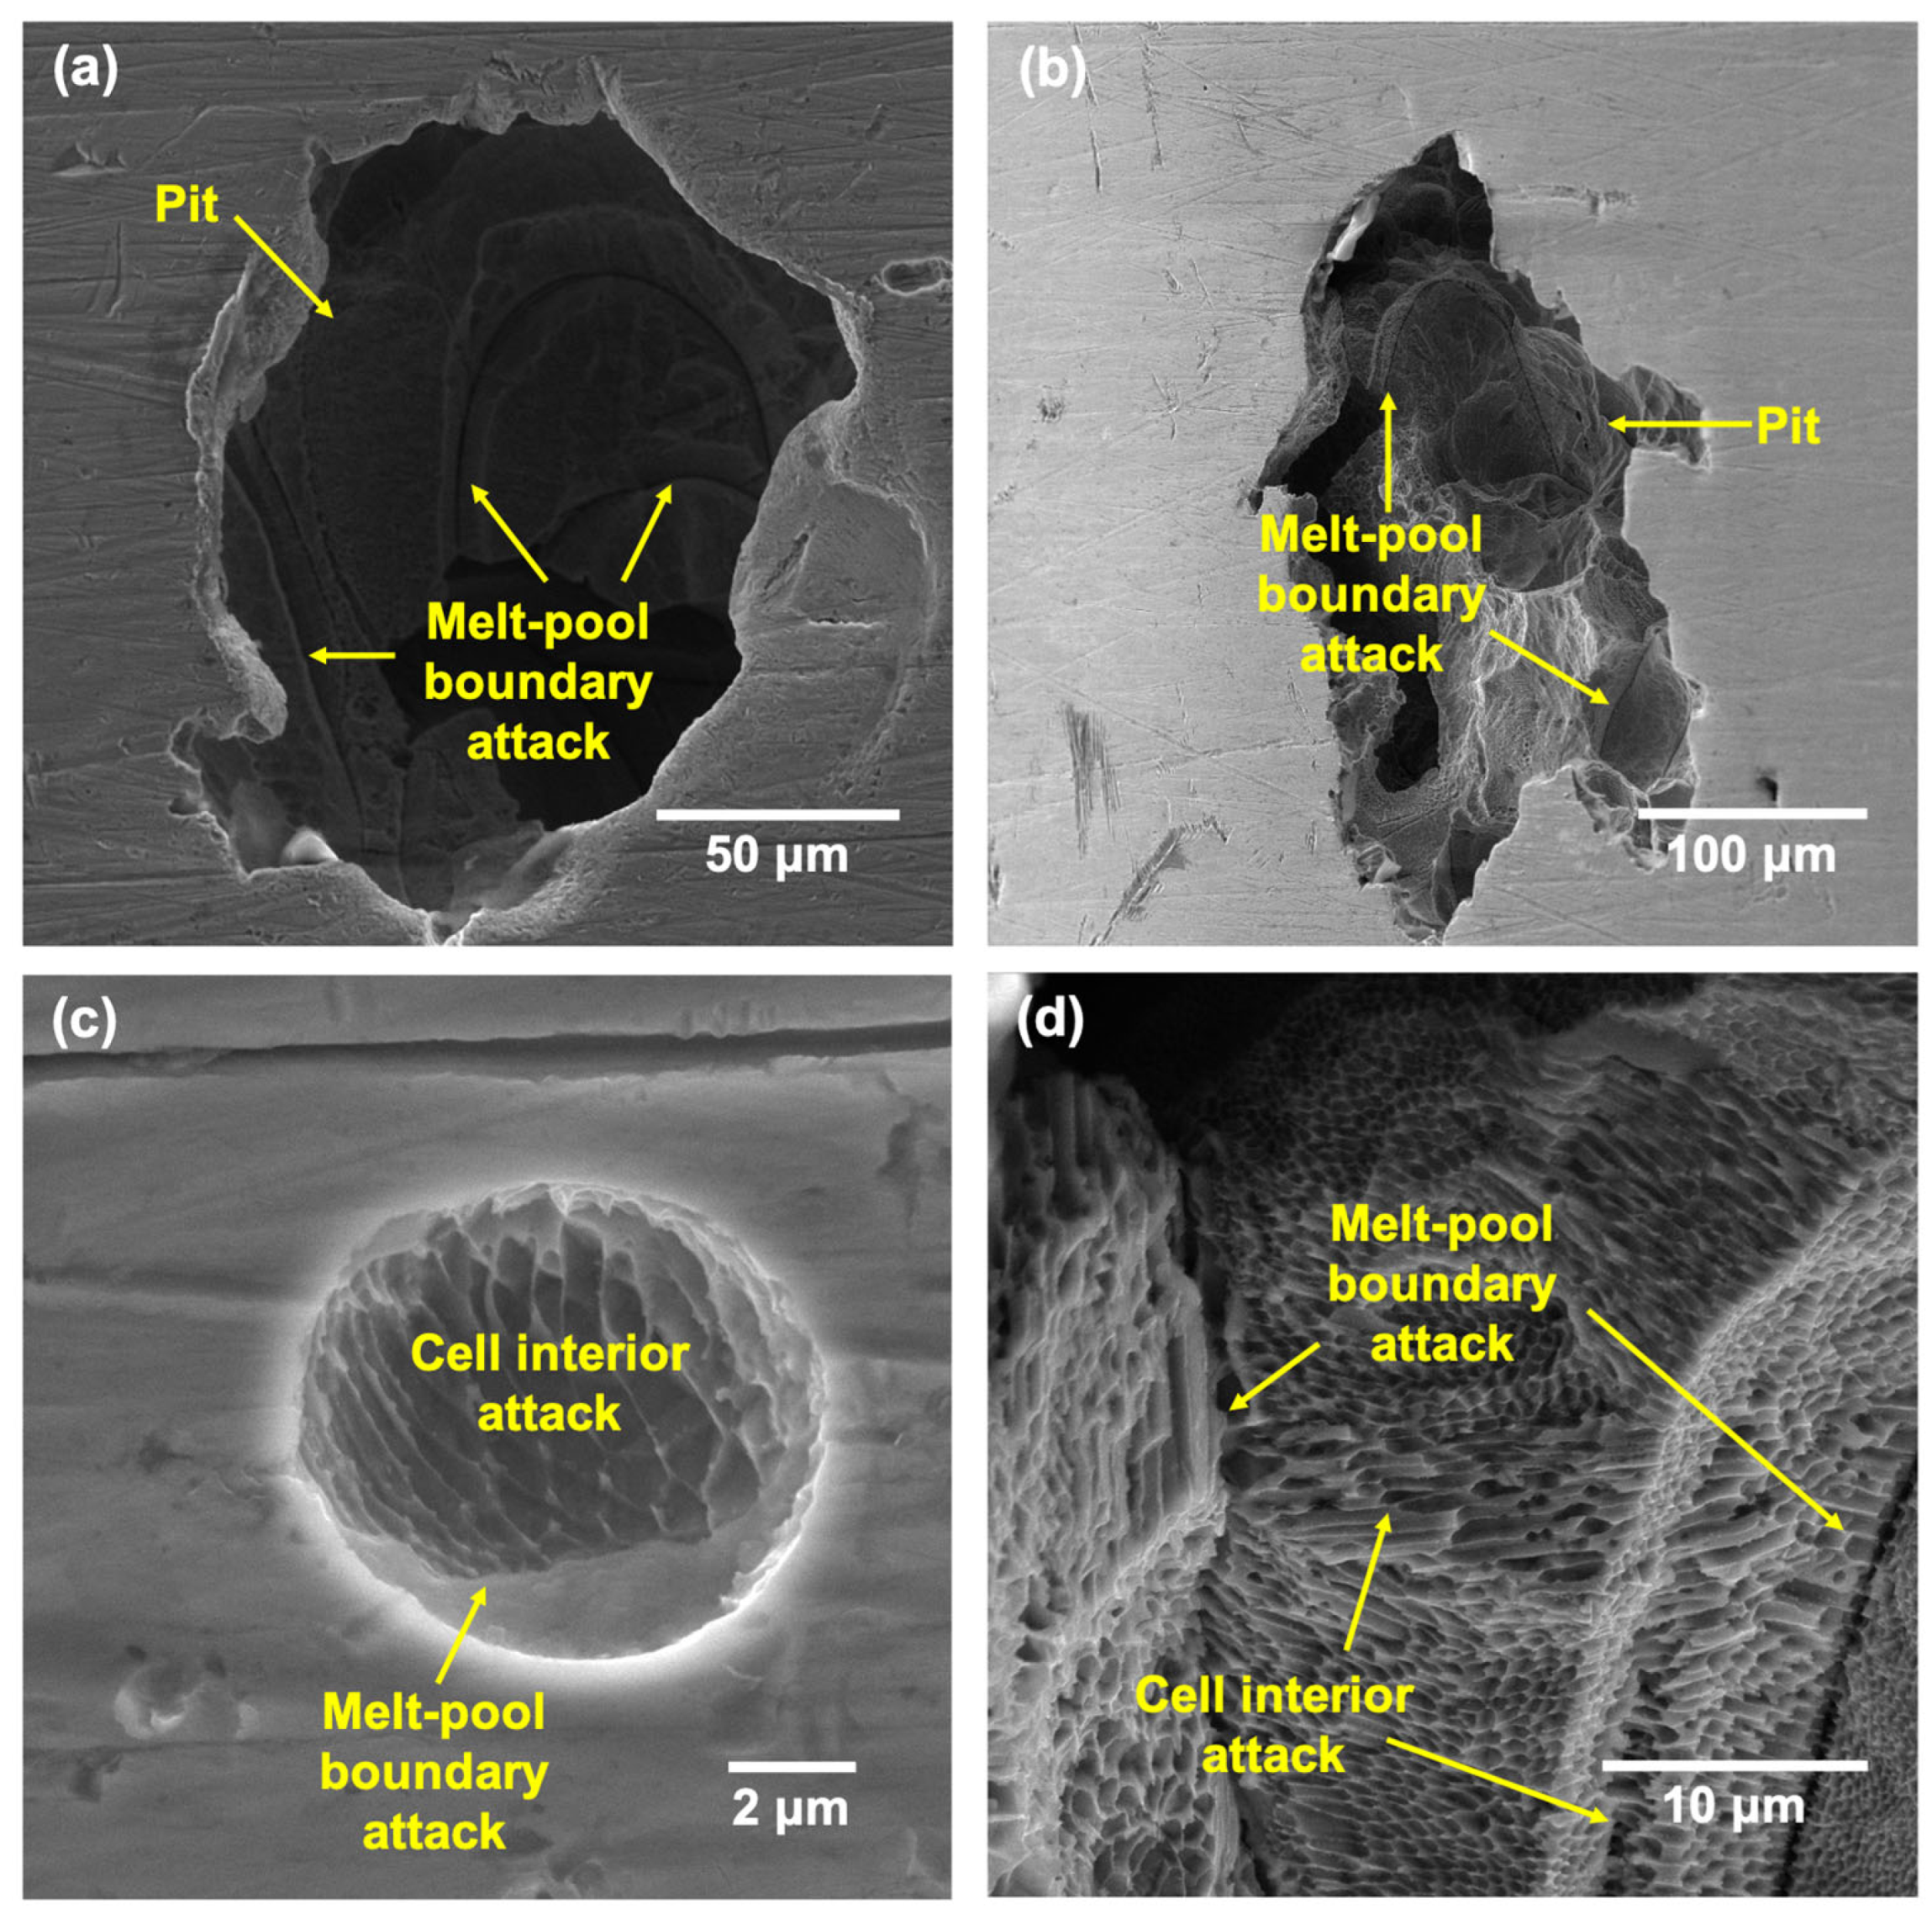
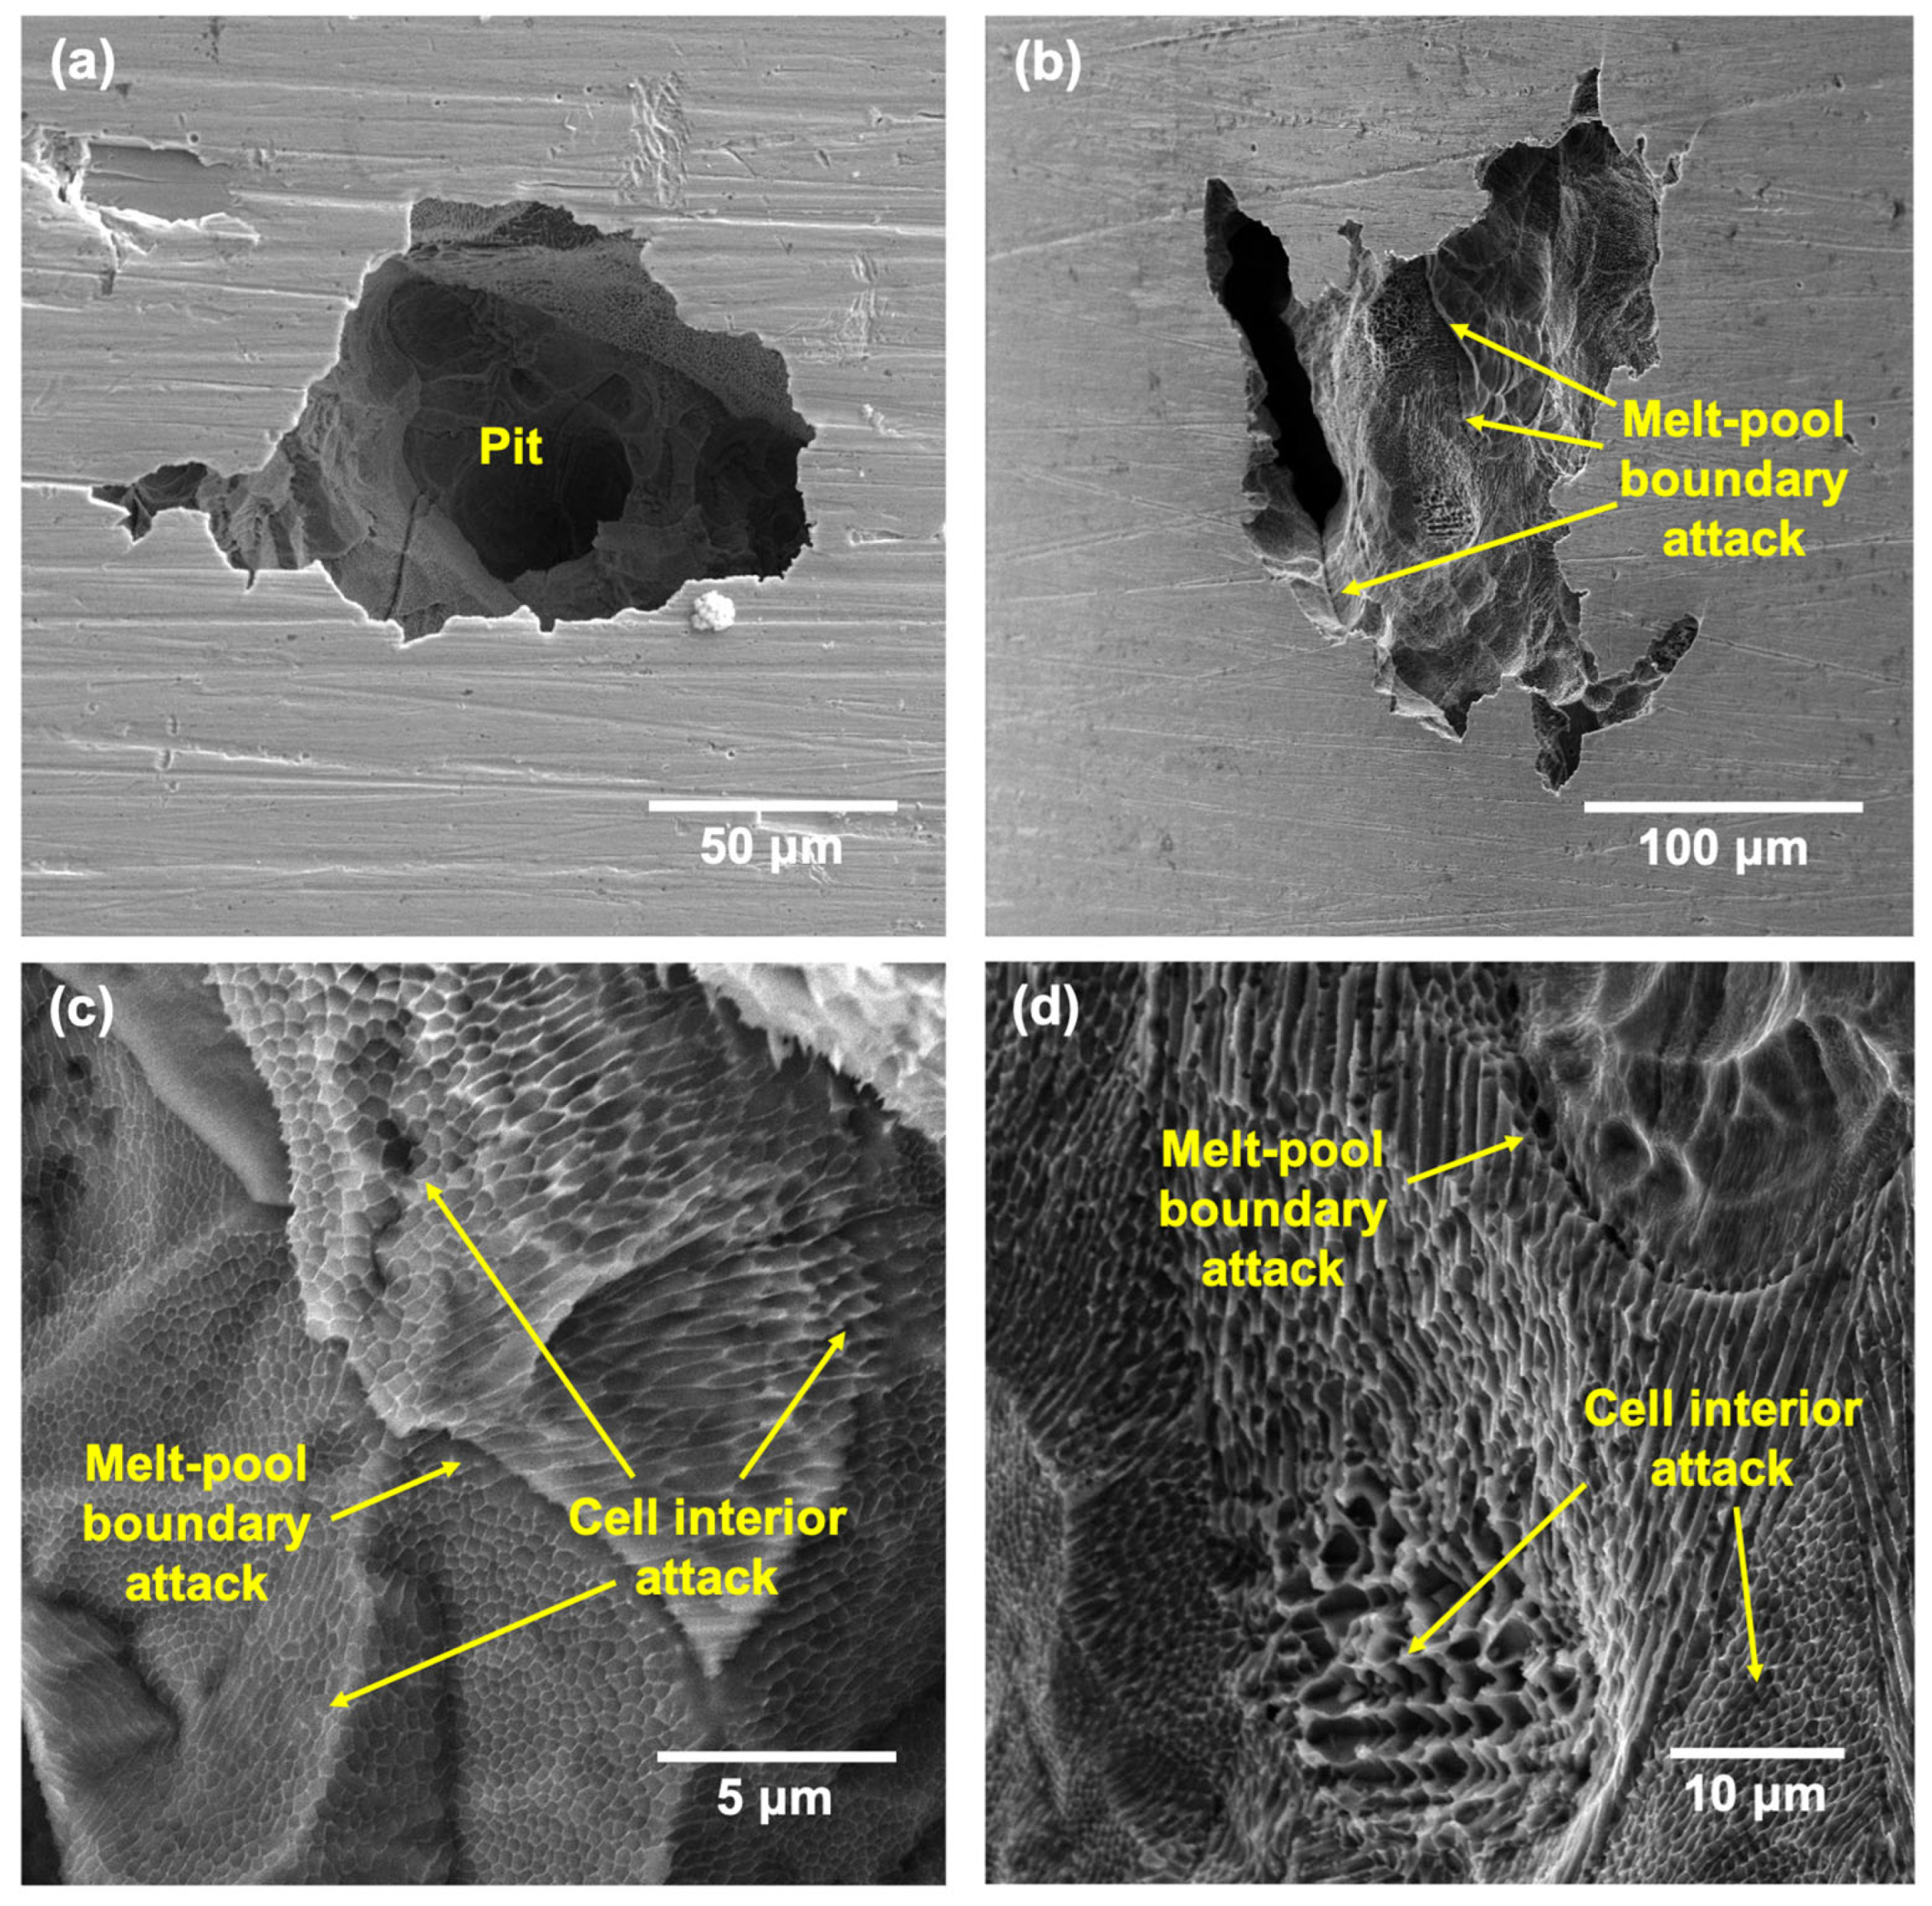
- Pits formed on the LPBF showed attack on deposited layers underneath the tested surface once the top surface dissolved, with melt-pool boundaries and cell interiors being the preferential regions of attack due to being depleted in Cr and Mo.
Supplementary Materials
Author Contributions
Funding
Institutional Review Board Statement
Informed Consent Statement
Data Availability Statement
Conflicts of Interest
References
- Bajaj, P.; Hariharan, A.; Kini, A.; Kürnsteiner, P.; Raabe, D.; Jägle, E.A. Steels in additive manufacturing: A review of their microstructure and properties. Mater. Sci. Eng. A 2020, 772, 138633. [Google Scholar] [CrossRef]
- Konyashin, I.; Hinners, H.; Ries, B.; Kirchner, A.; Klöden, B.; Kieback, B.; Nilen, R.; Sidorenko, D. Additive manufacturing of WC-13%Co by selective electron beam melting: Achievements and challenges. Int. J. Refract. Met. Hard Mater. 2019, 84, 105028. [Google Scholar] [CrossRef]
- Murr, L.E.; Martinez, E.; Amato, K.N.; Gaytan, S.M.; Hernandez, J.; Ramirez, D.A.; Shindo, P.W.; Medina, F.; Wicker, R.B. Fabrication of Metal and Alloy Components by Additive Manufacturing: Examples of 3D Materials Science. J. Mater. Res. Technol. 2012, 1, 42–54. [Google Scholar] [CrossRef]
- Kellens, K.; Mertens, R.; Paraskevas, D.; Dewulf, W.; Duflou, J.R. Environmental impact of additive manufacturing processes: Does AM contribute to a more sustainable way of part manufacturing? Procedia Cirp 2017, 61, 582–587. [Google Scholar] [CrossRef]
- Bikas, H.; Stavropoulos, P.; Chryssolouris, G. Additive manufacturing methods and modelling approaches: A critical review. Int. J. Adv. Manuf. Technol. 2016, 83, 389–405. [Google Scholar] [CrossRef]
- Chen, Q.; Thouas, G.A. Metallic implant biomaterials. Mater. Sci. Eng. R Rep. 2015, 87, 1–57. [Google Scholar] [CrossRef]
- Feng, Z.; Cheng, X.; Dong, C.; Xu, L.; Li, X. Passivity of 316L stainless steel in borate buffer solution studied by Mott–Schottky analysis, atomic absorption spectrometry and X-ray photoelectron spectroscopy. Corros. Sci. 2010, 52, 3646–3653. [Google Scholar] [CrossRef]
- Nicic, I.; Macdonald, D.D. The passivity of Type 316L stainless steel in borate buffer solution. J. Nucl. Mater. 2008, 379, 54–58. [Google Scholar] [CrossRef]
- Lorang, G.; Belo, M.D.C.; Simões, A.M.P.; Ferreira, M.G.S. Chemical Composition of Passive Films on AISI 304 Stainless Steel. J. Electrochem. Soc. 1994, 141, 3347–3356. [Google Scholar] [CrossRef]
- Bedmar, J.; Riquelme, A.; Rodrigo, P.; Torres, B.; Rams, J. Comparison of Different Additive Manufacturing Methods for 316L Stainless Steel. Materials 2021, 14, 6504. [Google Scholar] [CrossRef]
- Gong, H.; Snelling, D.; Kardel, K.; Carrano, A. Comparison of Stainless Steel 316L Parts Made by FDM- and SLM-Based Additive Manufacturing Processes. JOM 2019, 71, 880–885. [Google Scholar] [CrossRef]
- Sander, G.; Thomas, S.; Cruz, V.; Jurg, M.; Birbilis, N.; Gao, X.; Brameld, M.; Hutchinson, C.R. On The Corrosion and Metastable Pitting Characteristics of 316L Stainless Steel Produced by Selective Laser Melting. J. Electrochem. Soc. 2017, 164, C250–C257. [Google Scholar] [CrossRef]
- Salman, O.; Gammer, C.; Chaubey, A.; Eckert, J.; Scudino, S. Effect of heat treatment on microstructure and mechanical properties of 316L steel synthesized by selective laser melting. Mater. Sci. Eng. A 2019, 748, 205–212. [Google Scholar] [CrossRef]
- Röttger, A.; Boes, J.; Theisen, W.; Thiele, M.; Esen, C.; Edelmann, A.; Hellmann, R. Microstructure and mechanical properties of 316L austenitic stainless steel processed by different SLM devices. Int. J. Adv. Manuf. Technol. 2020, 108, 769–783. [Google Scholar] [CrossRef]
- Huang, Y.; Yang, S.; Gu, J.; Xiong, Q.; Duan, C.; Meng, X.; Fang, Y. Microstructure and wear properties of selective laser melting 316L. Mater. Chem. Phys. 2020, 254, 123487. [Google Scholar]
- Man, C.; Dong, C.; Liu, T.; Kong, D.; Wang, D.; Li, X. The enhancement of microstructure on the passive and pitting behaviors of selective laser melting 316L SS in simulated body fluid. Appl. Surf. Sci. 2019, 467, 193–205. [Google Scholar] [CrossRef]
- Chao, Q.; Cruz, V.; Thomas, S.; Birbilis, N.; Collins, P.; Taylor, A.; Hodgson, P.D.; Fabijanic, D. On the enhanced corrosion resistance of a selective laser melted austenitic stainless steel. Scr. Mater. 2017, 141, 94–98. [Google Scholar] [CrossRef]
- Wranglen, G. Pitting and sulphide inclusions in steel. Corros. Sci. 1974, 14, 331–349. [Google Scholar] [CrossRef]
- ASTM A666/A666M-24; Standard Specification for Annealed or Cold-Worked Austenitic Stainless Steel Sheet, Strip, Plate, and Flat Bar. ASTM International: West Conshohocken, PA, USA, 2024.
- Cheng, C.-H.; Case, R.; Ning, J. Development of a Reference Electrode for Study of Supercritical CO2 Corrosion. In Proceedings of the CORROSION 2018, Phoenix, AZ, USA, 15–19 April 2018; OnePetro: Richardson, TX, USA, 2018. [Google Scholar]
- Fattah-Alhosseini, A.; Soltani, F.; Shirsalimi, F.; Ezadi, B.; Attarzadeh, N. The semiconducting properties of passive films formed on AISI 316 L and AISI 321 stainless steels: A test of the point defect model (PDM). Corros. Sci. 2011, 53, 3186–3192. [Google Scholar] [CrossRef]
- Simoes, A.; Ferreira, M.; Rondot, B.; Belo, M.D.C. Study of Passive Films Formed on AISI 304 Stainless Steel by Impedance Measurements and Photoelectrochemistry. J. Electrochem. Soc. 1990, 137, 82–87. [Google Scholar] [CrossRef]
- Narayanan, D.; Martinez, A.; Martin, U.; Mansoor, B.; Case, R.; Castaneda, H. Localized corrosion in selective laser melted SS316L in CO2 and H2S brines at elevated temperatures. NPJ Mater. Degrad. 2024, 8, 50. [Google Scholar] [CrossRef] [PubMed]
- Zhao, C.; Bai, Y.; Zhang, Y.; Wang, X.; Xue, J.M.; Wang, H. Influence of scanning strategy and building direction on microstructure and corrosion behaviour of selective laser melted 316L stainless steel. Mater. Des. 2021, 209, 109999. [Google Scholar] [CrossRef]
- Klapper, H.S.; Stevens, J. Influence of alloying elements on the pitting corrosion resistance of CrMn-stainless steels in simulated drilling environments. In NACE CORROSION; NACE: Houston, TX, USA, 2015. [Google Scholar]
- Klapper, H.S.; Rebak, R.B. Assessing the Pitting Corrosion Resistance of Oilfield Nickel Alloys at Elevated Temperatures by Electrochemical Methods. Corrosion 2017, 73, 666–673. [Google Scholar] [CrossRef] [PubMed]
- Mohammadi, F.; Nickchi, T.; Attar, M.; Alfantazi, A. EIS study of potentiostatically formed passive film on 304 stainless steel. Electrochim. Acta 2011, 56, 8727–8733. [Google Scholar] [CrossRef]
- Rondelli, G.; Torricelli, P.; Fini, M.; Giardino, R. In vitro corrosion study by EIS of a nickel-free stainless steel for orthopaedic applications. Biomaterials 2005, 26, 739–744. [Google Scholar] [CrossRef] [PubMed]
- Hsu, C.; Mansfeld, F. Concerning the conversion of the constant phase element parameter Y0 into a capacitance. Corrosion 2001, 57, 747–748. [Google Scholar] [CrossRef]
- Ningshen, S.; Mudali, U.K.; Mittal, V.; Khatak, H. Semiconducting and passive film properties of nitrogen-containing type 316LN stainless steels. Corros. Sci. 2007, 49, 481–496. [Google Scholar] [CrossRef]
- Mills, P.; Sullivan, J.L. A study of the core level electrons in iron and its three oxides by means of X-ray photoelectron spectroscopy. J. Phys. D Appl. Phys. 1983, 16, 723–732. [Google Scholar] [CrossRef]
- Marcus, P.; Grimal, J. The anodic dissolution and passivation of NiCrFe alloys studied by ESCA. Corros. Sci. 1992, 33, 805–814. [Google Scholar] [CrossRef]
- Allen, G.C.; Curtis, M.T.; Hooper, A.J.; Tucker, P.M. X-ray photoelectron spectroscopy of iron–oxygen systems. J. Chem. Soc. Dalton Trans. 1974, 14, 1525–1530. [Google Scholar] [CrossRef]
- Grimai, J.; Marcus, P. XPS study of the segregation of sulphur on Ni-21Cr-8Fe (100) alloy. Surf. Sci. 1991, 249, 171–179. [Google Scholar] [CrossRef]
- Grohmann, I.; Kemnitz, E.; Lippitz, A.; Unger, W.E.S. Curve fitting of Cr 2p photoelectron spectra of Cr2O3 and CrF3. Surf. Interface Anal. 1995, 23, 887–891. [Google Scholar] [CrossRef]
- Desimoni, E.; Malitesta, C.; Zambonin, P.G.; Riviere, J.C. An X-ray photoelectron spectroscopic study of some chromium–oxygen systems. Surf. Interface Anal. 1988, 13, 173–179. [Google Scholar] [CrossRef]
- Brox, B.; Olefjord, I. ESCA studies of MoO2 and MoO3. Surf. Interface Anal. 1988, 13, 3–6. [Google Scholar] [CrossRef]
- Poole, R.T.; Kemeny, P.C.; Liesegang, J.; Jenkin, J.G.; Leckey, R.C.G. High resolution photoelectron studies of the d bands of some metals. J. Phys. F Met. Phys. 1973, 3, L46–L48. [Google Scholar] [CrossRef]
- Seifert, G.; Finster, J.; Müller, H. SW Xα calculations and x-ray photoelectron spectra of molybdenum(II) chloride cluster compounds. Chem. Phys. Lett. 1980, 75, 373–377. [Google Scholar] [CrossRef]
- Chowdari, B.; Tan, K.; Chia, W.; Gopalakrishnan, R. X-ray photoelectron spectroscopic studies of molybdenum phosphate glassy system. J. Non-Cryst. Solids 1990, 119, 95–102. [Google Scholar] [CrossRef]
- Ozkar, S.; Ozin, G.A.; Prokopowicz, R.A. Photooxidation of hexacarbonylmolybdenum(0) in sodium zeolite Y to yield redox-interconvertible molybdenum(VI) oxide and molybdenum(IV) oxide monomers. Chem. Mater. 1992, 4, 1380–1388. [Google Scholar] [CrossRef]
- Löchel, B.P.; Strehblow, H.-H. Breakdown of Passivity of Nickel by Fluoride: II. Surface Analytical Studies. J. Electrochem. Soc. 1984, 131, 713–723. [Google Scholar] [CrossRef]
- McIntyre, N.S.; Cook, M.G. X-ray photoelectron studies on some oxides and hydroxides of cobalt, nickel, and copper. Anal. Chem. 1975, 47, 2208–2213. [Google Scholar] [CrossRef]
- Kong, D.; Dong, C.; Ni, X.; Zhang, L.; Luo, H.; Li, R.; Wang, L.; Man, C.; Li, X. The passivity of selective laser melted 316L stainless steel. Appl. Surf. Sci. 2020, 504, 144495. [Google Scholar] [CrossRef]
- Hariharan, K.; Guo, X.; Huang, H.-L.; Sridhar, N.; Srinivasan, J.; Hwang, J.; Frankel, G.S.; Schindelholz, E.J. Inter-melt pool corrosion and repassivation of SS316L stainless steel processed by laser powder bed fusion. Corros. Sci. 2024, 226, 111668. [Google Scholar] [CrossRef]
- Narayanan, D.; Brooks, R.; Vaughan, M.; Mansoor, B.; Karaman, I.; Case, R.; Castaneda, H. Corrosion Assessment of Additively Manufactured Stainless Steel 316L in 3.5 Wt% NaCl. In AMPP CORROSION; AMPP: Houston, TX, USA, 2023. [Google Scholar]
- Narayanan, D.; Chen, L.; Mansoor, B.; Castaneda, H. A new insight into pitting initiation in selective laser melted 316L stainless steel. Mater. Lett. 2023, 333, 133562. [Google Scholar] [CrossRef]
- Racot, A.; Aubert, I.; Touzet, M.; Thiebaut, S.; Demesy, M. Statistical analysis of the pitting corrosion induced by potentiostatic pulse tests of wrought and SLM 316L stainless steels. Corros. Sci. 2022, 197, 110036. [Google Scholar] [CrossRef]
- Ke, R.; Alkire, R. Surface Analysis of Corrosion Pits Initiated at MnS Inclusions in 304 Stainless Steel. J. Electrochem. Soc. 1992, 139, 1573–1580. [Google Scholar] [CrossRef]
- Choundraj, J.D.; Kelly, R.G.; Monikandan, R.; Singh, P.M.; Kacher, J. Influence of native oxide film on corrosion behavior of additively manufactured stainless steel 316L. Corros. Sci. 2023, 217, 111098. [Google Scholar] [CrossRef]
- Nie, J.; Wei, L.; Jiang, Y.; Li, Q.; Luo, H. Corrosion mechanism of additively manufactured 316 L stainless steel in 3.5 wt.% NaCl solution. Mater. Today Commun. 2021, 26, 101648. [Google Scholar] [CrossRef]
- Yoo, Y.R.; Jang, S.G.; Nam, H.S.; Shim, G.T.; Cho, H.H.; Kim, J.G.; Kim, Y.S. Influence of Co content on the biocompatibility and bio-corrosion of super ferritic stainless steels. Met. Mater. Int. 2008, 14, 729–738. [Google Scholar] [CrossRef]


| Sample | Fe (%) | Cr (%) | Ni (%) | Mo (%) | Mn (%) | |||||
|---|---|---|---|---|---|---|---|---|---|---|
| Avg. | (SD) | Avg. | (SD) | Avg. | (SD) | Avg. | (SD) | Avg. | (SD) | |
| Wrought | 58.8 | 1.15 | 17.5 | 0.17 | 11.9 | 0.10 | 2.4 | 0.32 | 1.1 | 0.10 |
| LPBF | 58.7 | 0.35 | 17.3 | 0.15 | 12.8 | 0.30 | 2.4 | 0.22 | 1.5 | 0.21 |
| Sample | Temperature (°C) | Ecorr (mV vs. SCE) | EB (mV vs. SCE) | ERP (mV vs. SCE) | PSF | CB (C/cm2) |
|---|---|---|---|---|---|---|
| Wrought | 25 | −610.08 | 425.69 | −30.72 | 0.44 | 1.81 |
| 50 | −683.07 | 138.44 | −320.65 | 0.56 | 2.44 | |
| 75 | −708.55 | −114.00 | −402.87 | 0.49 | 1.69 | |
| LPBF | 25 | −609.31 | 585.07 | −130.72 | 0.60 | 5.87 |
| 50 | −709.66 | 223.60 | −263.63 | 0.52 | 5.66 | |
| 75 | −737.89 | 42.53 | −375.95 | 0.54 | 2.87 |
| Sample | Temperature (°C) | Rs (Ω-cm2) | Rf (kΩ-cm2) | Rct (kΩ-cm2) | Qf (F-cm−2-s−n) | nf | Cf (F-cm−2-s−n) | Qdl (F-cm−2-s−n) | ndl |
|---|---|---|---|---|---|---|---|---|---|
| Wrought | 25 | 12.49 | 24.41 | 62.01 | 1.11 × 10⁻⁴ | 0.88 | 1.28 × 10⁻⁴ | 5.47 × 10⁻⁴ | 0.88 |
| 50 | 9.37 | 6.36 | 80.25 | 1.55 × 10⁻⁴ | 0.84 | 1.54 × 10⁻⁴ | 5.75 × 10⁻⁴ | 0.88 | |
| 75 | 5.31 | 0.77 | 8.56 | 2.18 × 10⁻⁴ | 0.77 | 1.76 × 10⁻⁴ | 7.12 × 10⁻⁴ | 0.89 | |
| LPBF | 25 | 14.32 | 25.59 | 74.03 | 1.28 × 10⁻⁴ | 0.87 | 1.53 × 10⁻⁴ | 4.52 × 10⁻⁴ | 0.95 |
| 50 | 10.59 | 7.30 | 71.40 | 1.57 × 10⁻⁴ | 0.85 | 1.61 × 10⁻⁴ | 4.67 × 10⁻⁴ | 0.88 | |
| 75 | 7.84 | 1.17 | 20.85 | 2.57 × 10⁻⁴ | 0.81 | 2.12 × 10⁻⁴ | 4.61 × 10⁻⁴ | 0.86 |
| Sample | Temperature (°C) | NA (#/cm3) a | ND (#/cm3) a |
|---|---|---|---|
| Wrought | 25 | 5.50 × 10¹⁹ | 2.67 × 10¹⁹ |
| 50 | 4.33 × 10²⁰ | 2.02 × 10²⁰ | |
| 75 | 1.12 × 10²¹ | 5.23 × 10²⁰ | |
| LPBF | 25 | 3.76 × 10¹⁹ | 1.80 × 10¹⁹ |
| 50 | 1.18 × 10²⁰ | 6.27 × 10¹⁹ | |
| 75 | 7.10 × 10²⁰ | 2.47 × 10²⁰ |
| Samples: | LPBF | Wrought | ||||||
|---|---|---|---|---|---|---|---|---|
| Element | Peak | Binding Energy (eV) | 25 °C (at%) | 50 °C (at%) | 75 °C (at%) | 25 °C (at%) | 50 °C (at%) | 75 °C (at%) |
| Fe 2p3/2 | Fe metal | 706.5 | 44.9 | 44.0 | 35 | 26.6 | 30.8 | 38.3 |
| Fe3O4 | 709.2 | 39.9 | 41.4 | 21.4 | 40.2 | 22.5 | 22.8 | |
| FeOOH | 711 | 15.2 | 14.6 | 43.6 | 33.2 | 46.7 | 38.9 | |
| Cr 2p3/2 | Cr metal | 573.9 | 26.1 | 20.6 | 6.6 | 26.9 | 8.1 | 4.6 |
| Cr2O3 | 576.1 | 55.3 | 55.9 | 33.7 | 52.2 | 31.2 | 39.0 | |
| Cr(OH)3 | 577 | 18.6 | 23.5 | 59.7 | 20.9 | 60.7 | 56.4 | |
| Mo 3d | Mo 3d5/2 Mo 3d3/2 MoO2 3d5/2 MoO2 3d3/2 MoO3 3d5/2 MoO3 3d3/2 | 227.4 231.0 230 234.2 232.3 236 | 45.2 25.6 29.2 | 50.8 35.3 13.9 | 43.6 24.2 32.2 | 44.8 26.9 28.3 | 42.6 30.1 27.3 | 51.7 31.2 17.1 |
| Ni 2p3/2 | Ni metal | 853 | 85.1 | 86.9 | 76.7 | 71.2 | 73.2 | 75.3 |
| NiO/Ni(OH)2 | 855.6 | 14.9 | 13.1 | 23.3 | 28.8 | 26.8 | 24.7 | |
Disclaimer/Publisher’s Note: The statements, opinions and data contained in all publications are solely those of the individual author(s) and contributor(s) and not of MDPI and/or the editor(s). MDPI and/or the editor(s) disclaim responsibility for any injury to people or property resulting from any ideas, methods, instructions or products referred to in the content. |
© 2024 by the authors. Licensee MDPI, Basel, Switzerland. This article is an open access article distributed under the terms and conditions of the Creative Commons Attribution (CC BY) license (https://creativecommons.org/licenses/by/4.0/).
Share and Cite
Goldsberry, R.; Narayanan, D.; Case, R.; Mansoor, B.; Castaneda, H. Effect of Temperature on Passive Film Characteristics of LPBF (Laser Powder-Bed Fusion) Processing on UNS-S31603. Materials 2024, 17, 3420. https://doi.org/10.3390/ma17143420
Goldsberry R, Narayanan D, Case R, Mansoor B, Castaneda H. Effect of Temperature on Passive Film Characteristics of LPBF (Laser Powder-Bed Fusion) Processing on UNS-S31603. Materials. 2024; 17(14):3420. https://doi.org/10.3390/ma17143420
Chicago/Turabian StyleGoldsberry, Reece, Deeparekha Narayanan, Raymundo Case, Bilal Mansoor, and Homero Castaneda. 2024. "Effect of Temperature on Passive Film Characteristics of LPBF (Laser Powder-Bed Fusion) Processing on UNS-S31603" Materials 17, no. 14: 3420. https://doi.org/10.3390/ma17143420
APA StyleGoldsberry, R., Narayanan, D., Case, R., Mansoor, B., & Castaneda, H. (2024). Effect of Temperature on Passive Film Characteristics of LPBF (Laser Powder-Bed Fusion) Processing on UNS-S31603. Materials, 17(14), 3420. https://doi.org/10.3390/ma17143420