
Synthesis and Characterisation of Nanocrystalline CoxFe1−xGDC Powders as a Functional Anode Material for the Solid Oxide Fuel Cell
 , and
, and 
Abstract
:
1. Introduction
2. Materials and Methods
2.1. Material
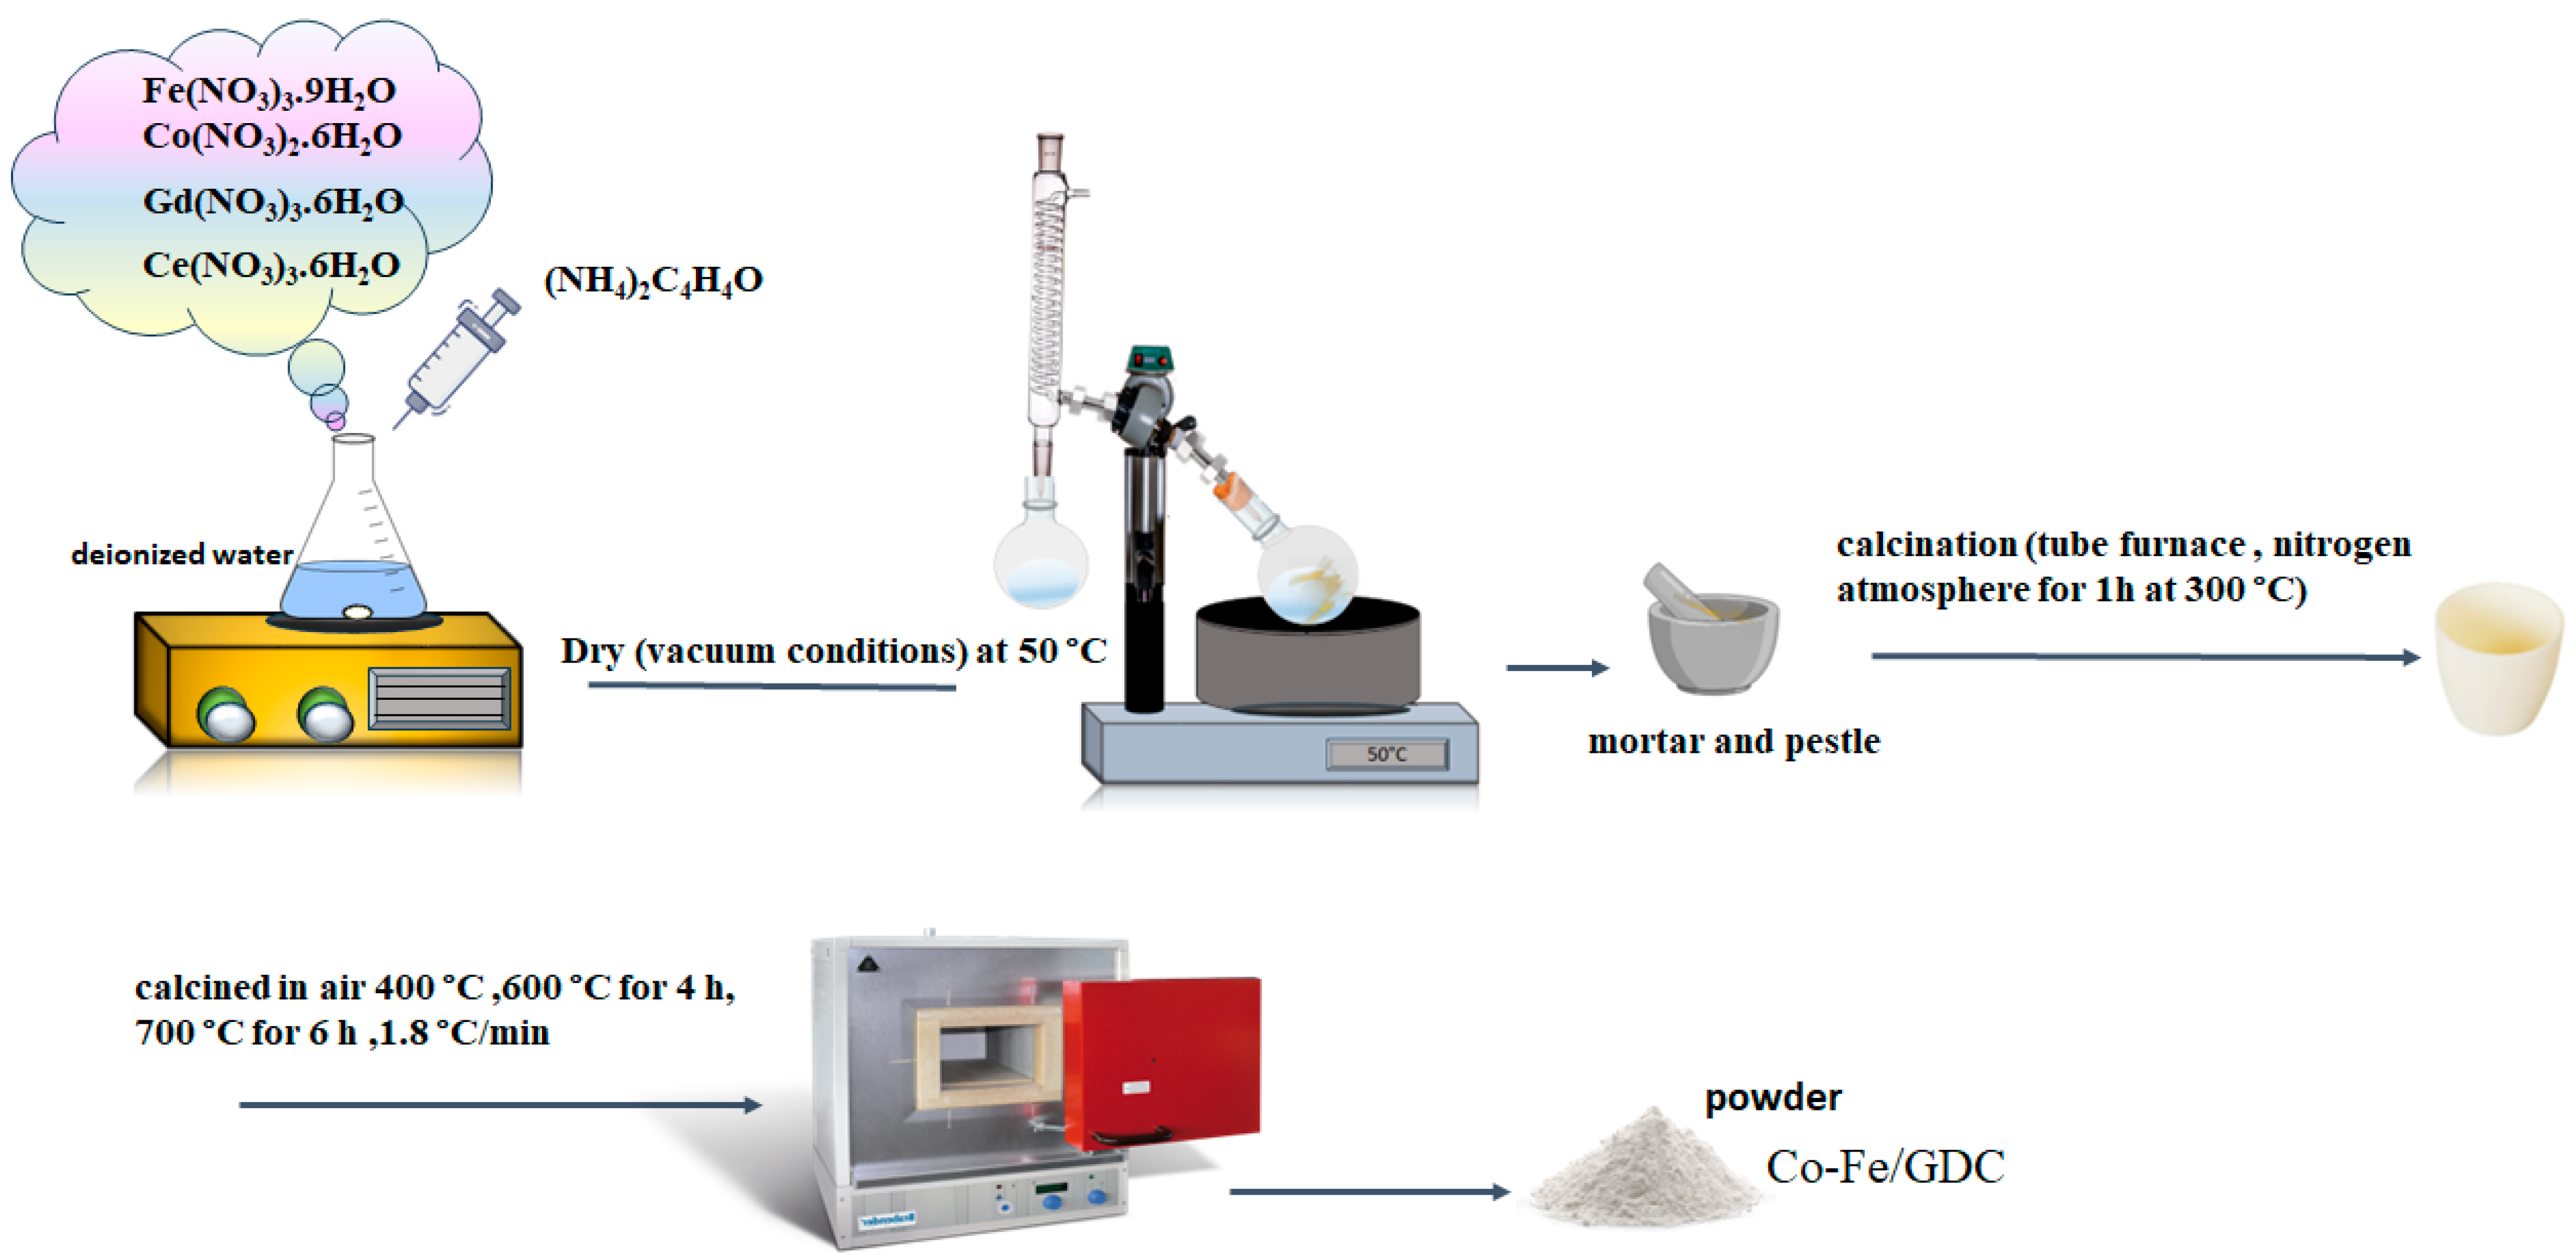
2.2. Powder Synthesis
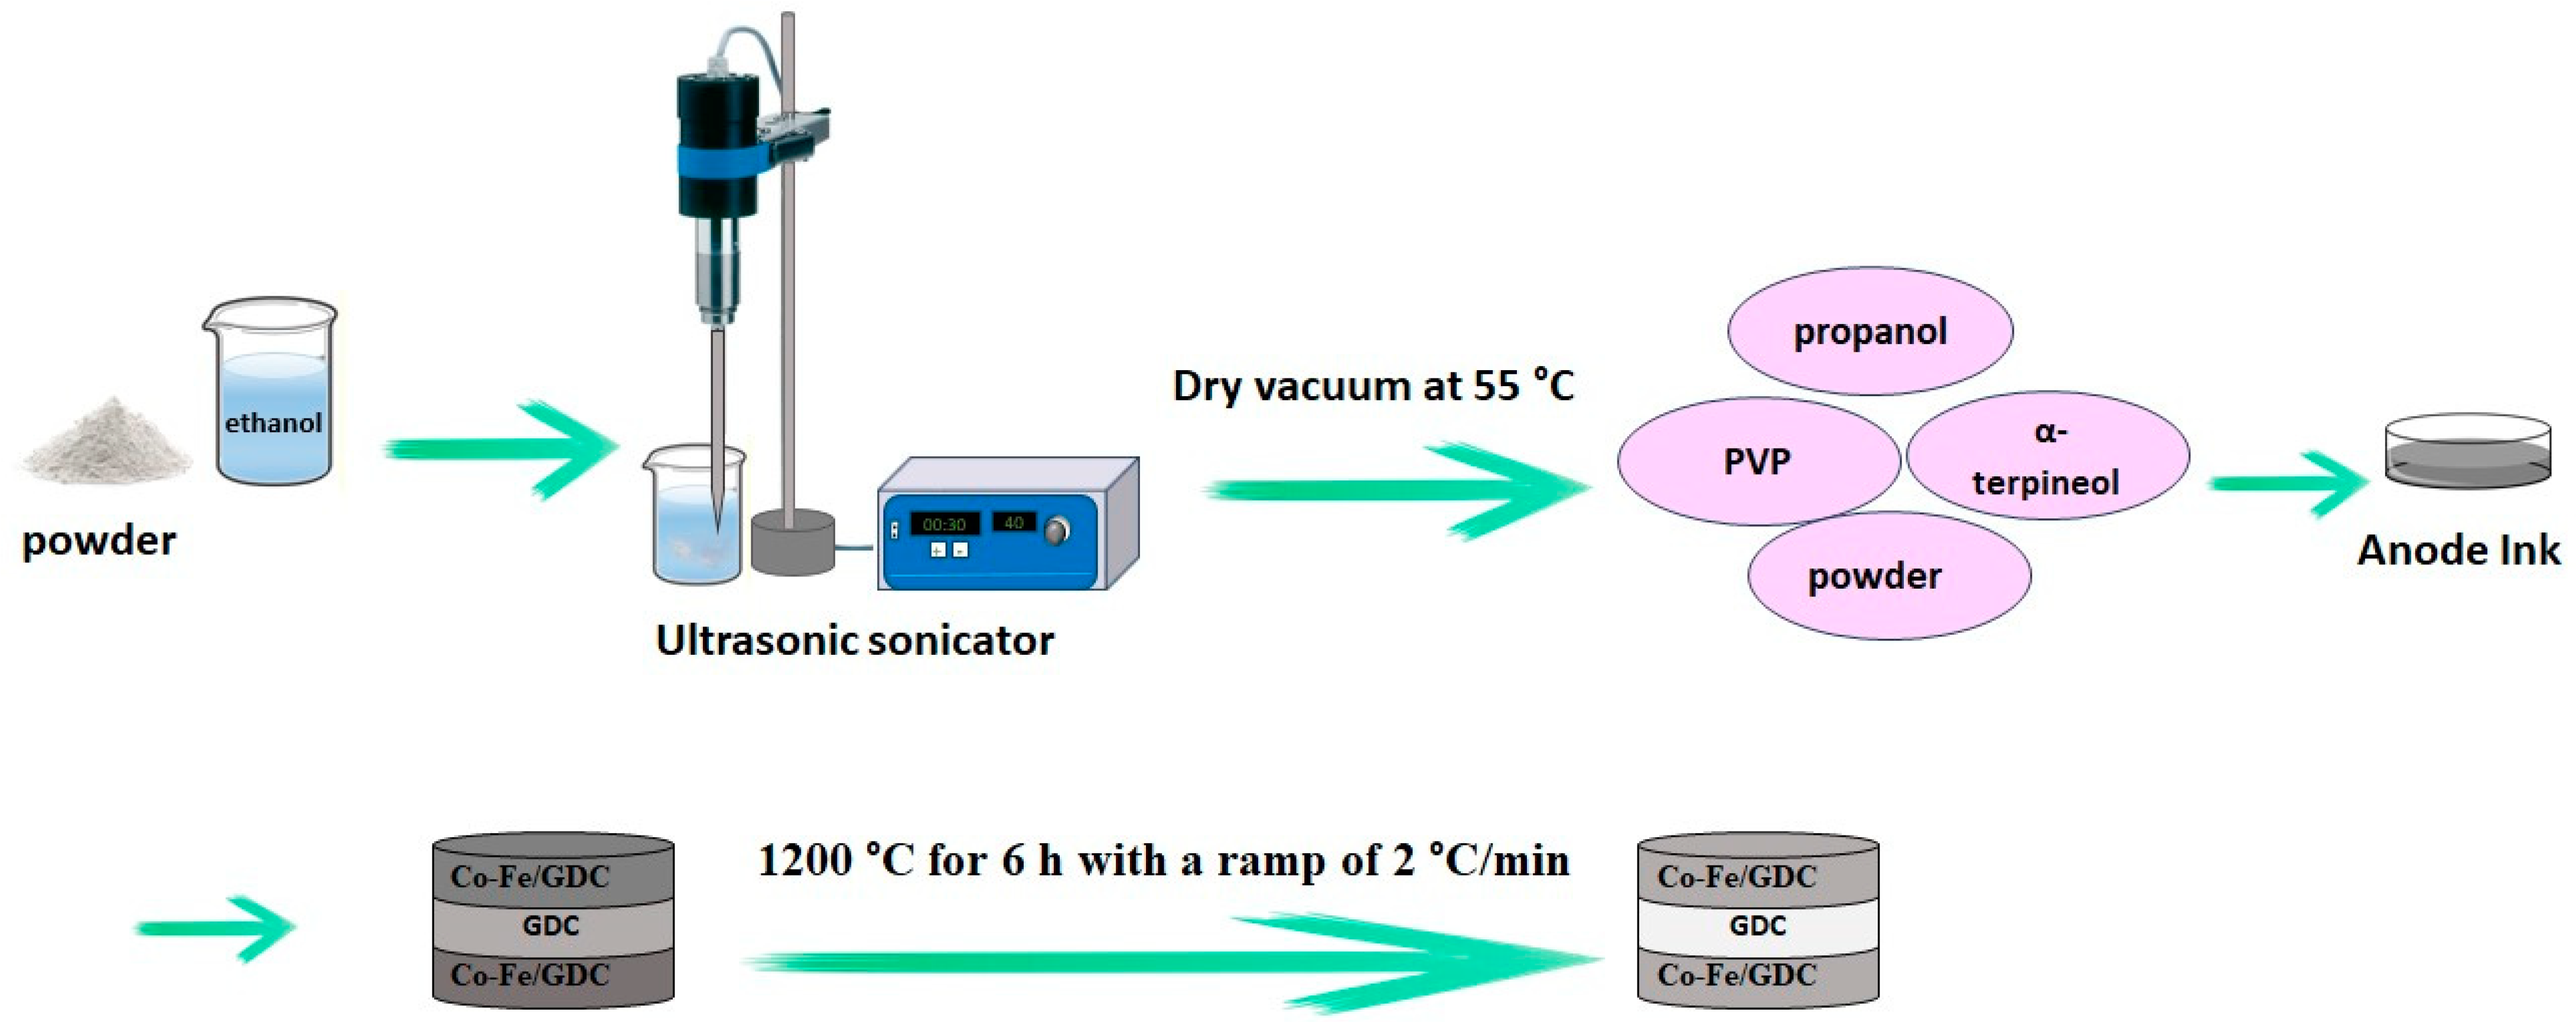
2.3. Cell Fabrication
2.4. Characterisation
3. Results and Discussion
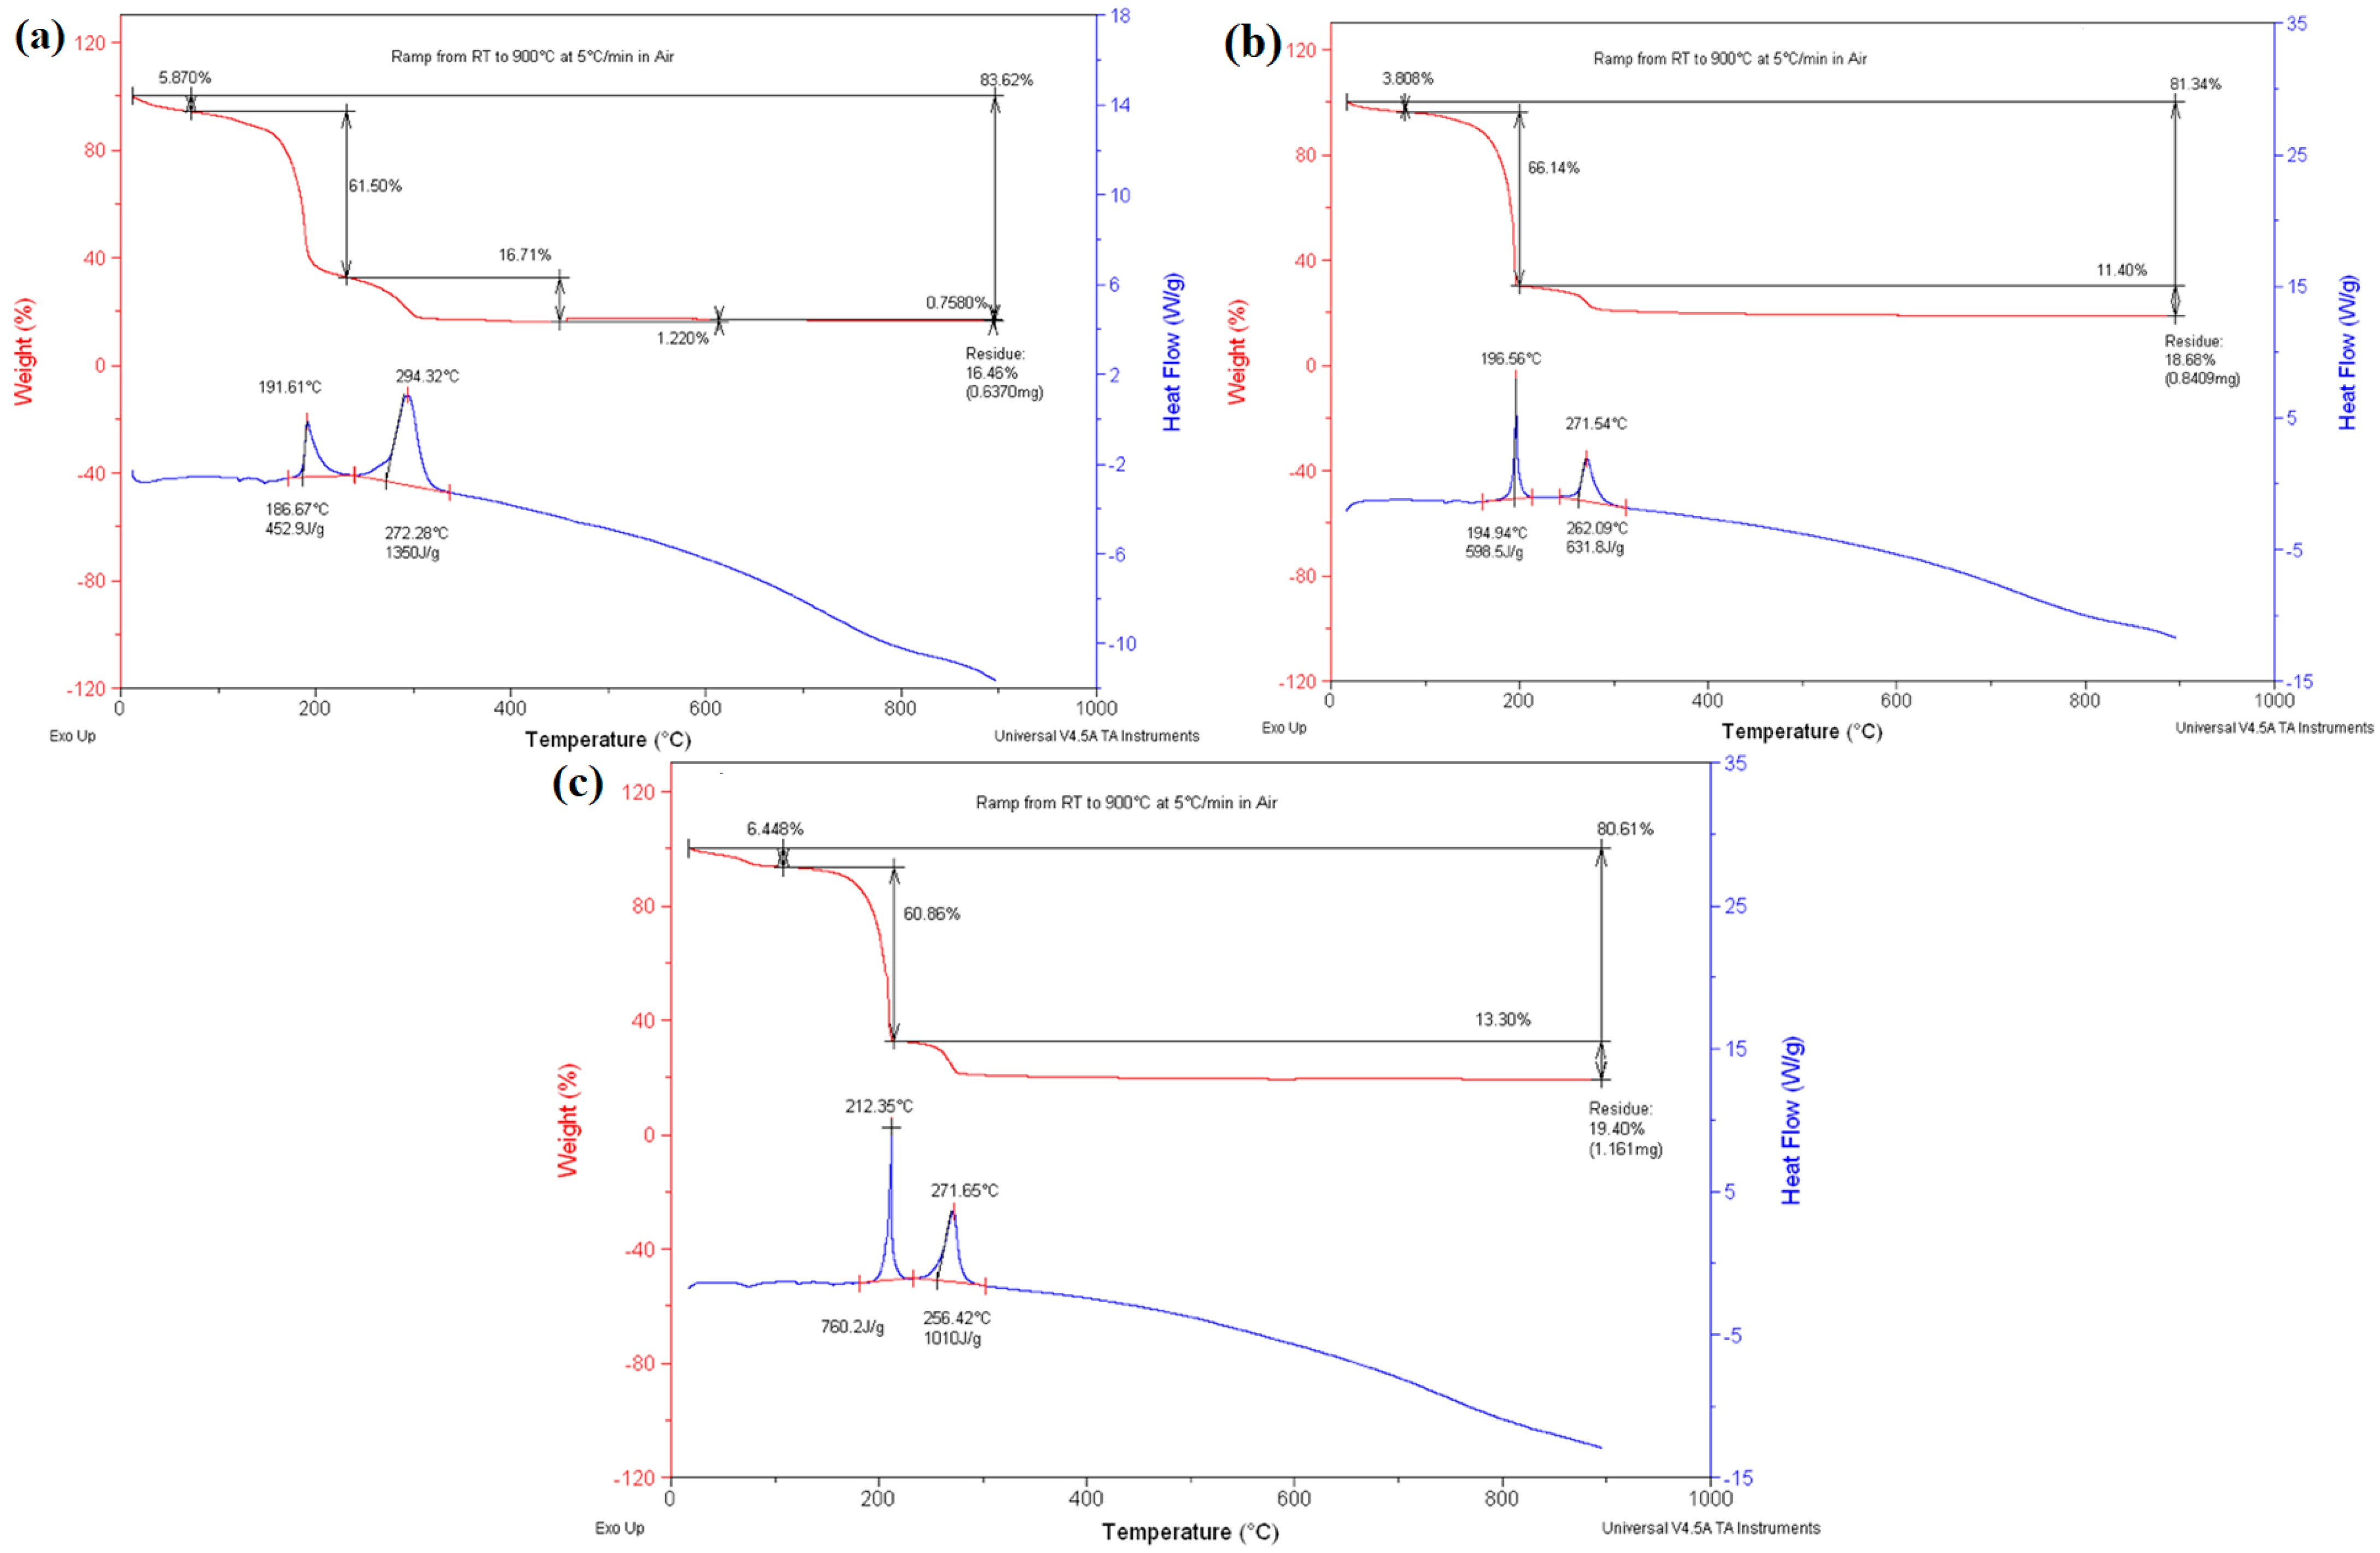
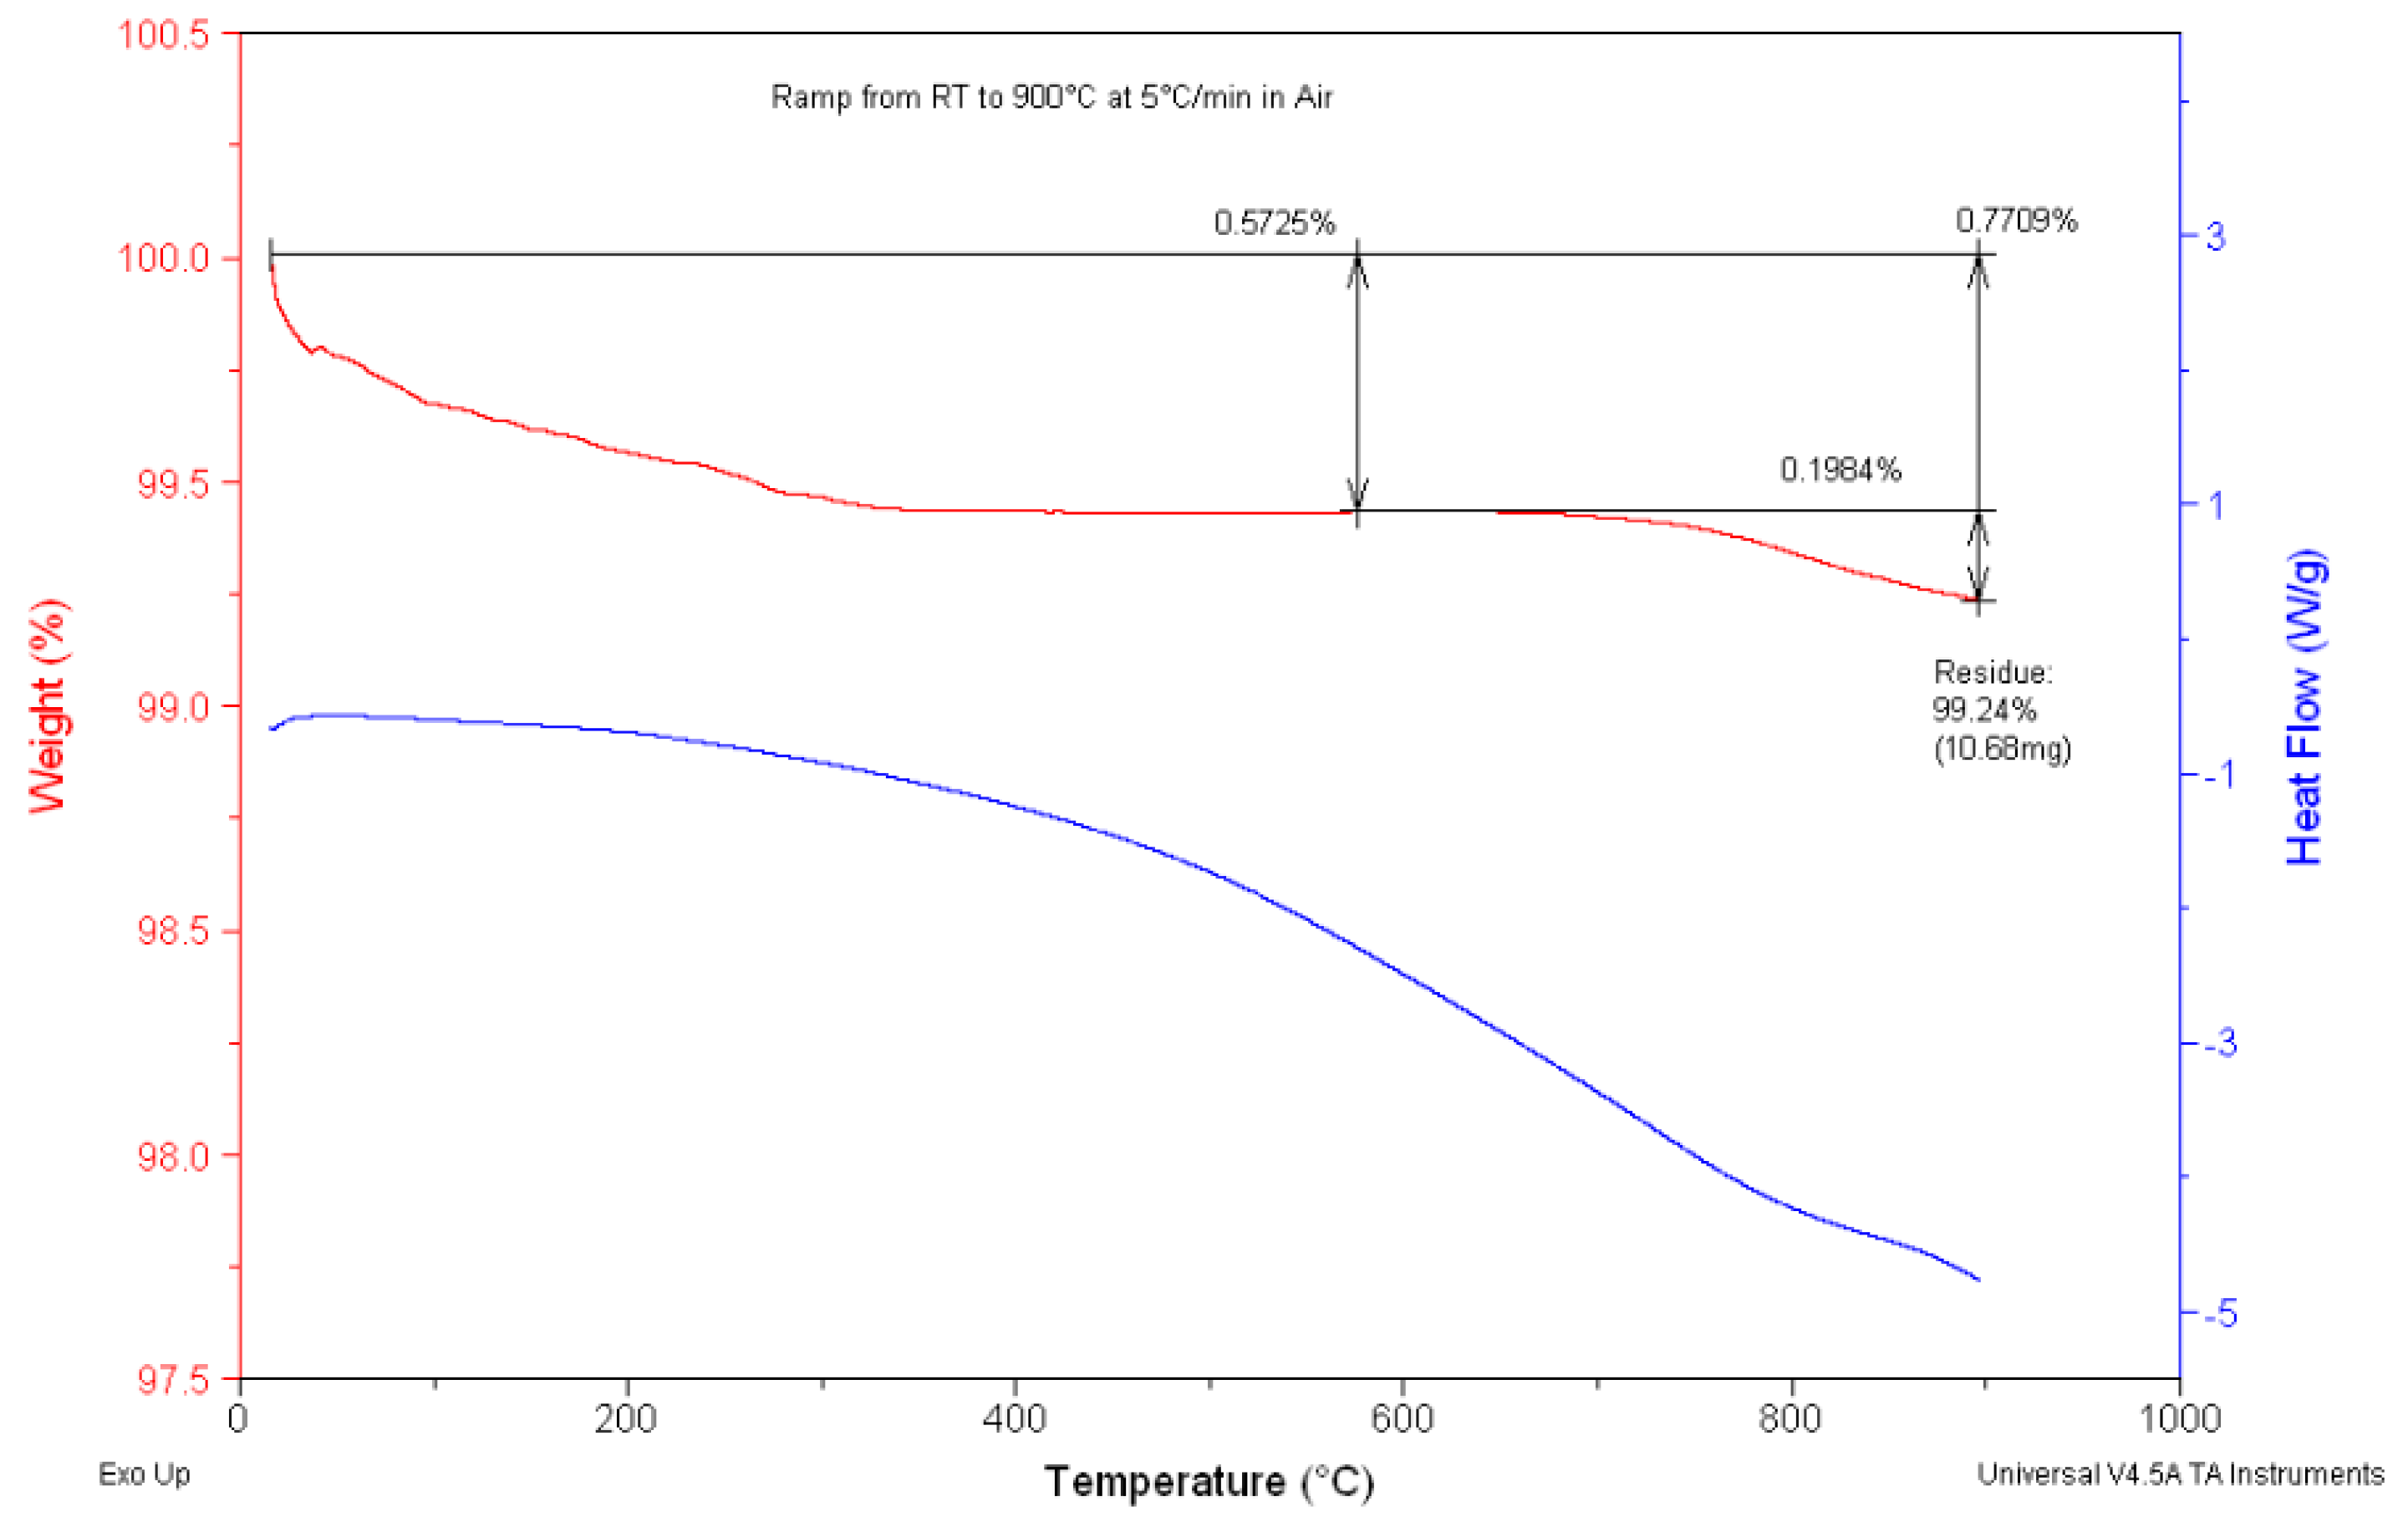
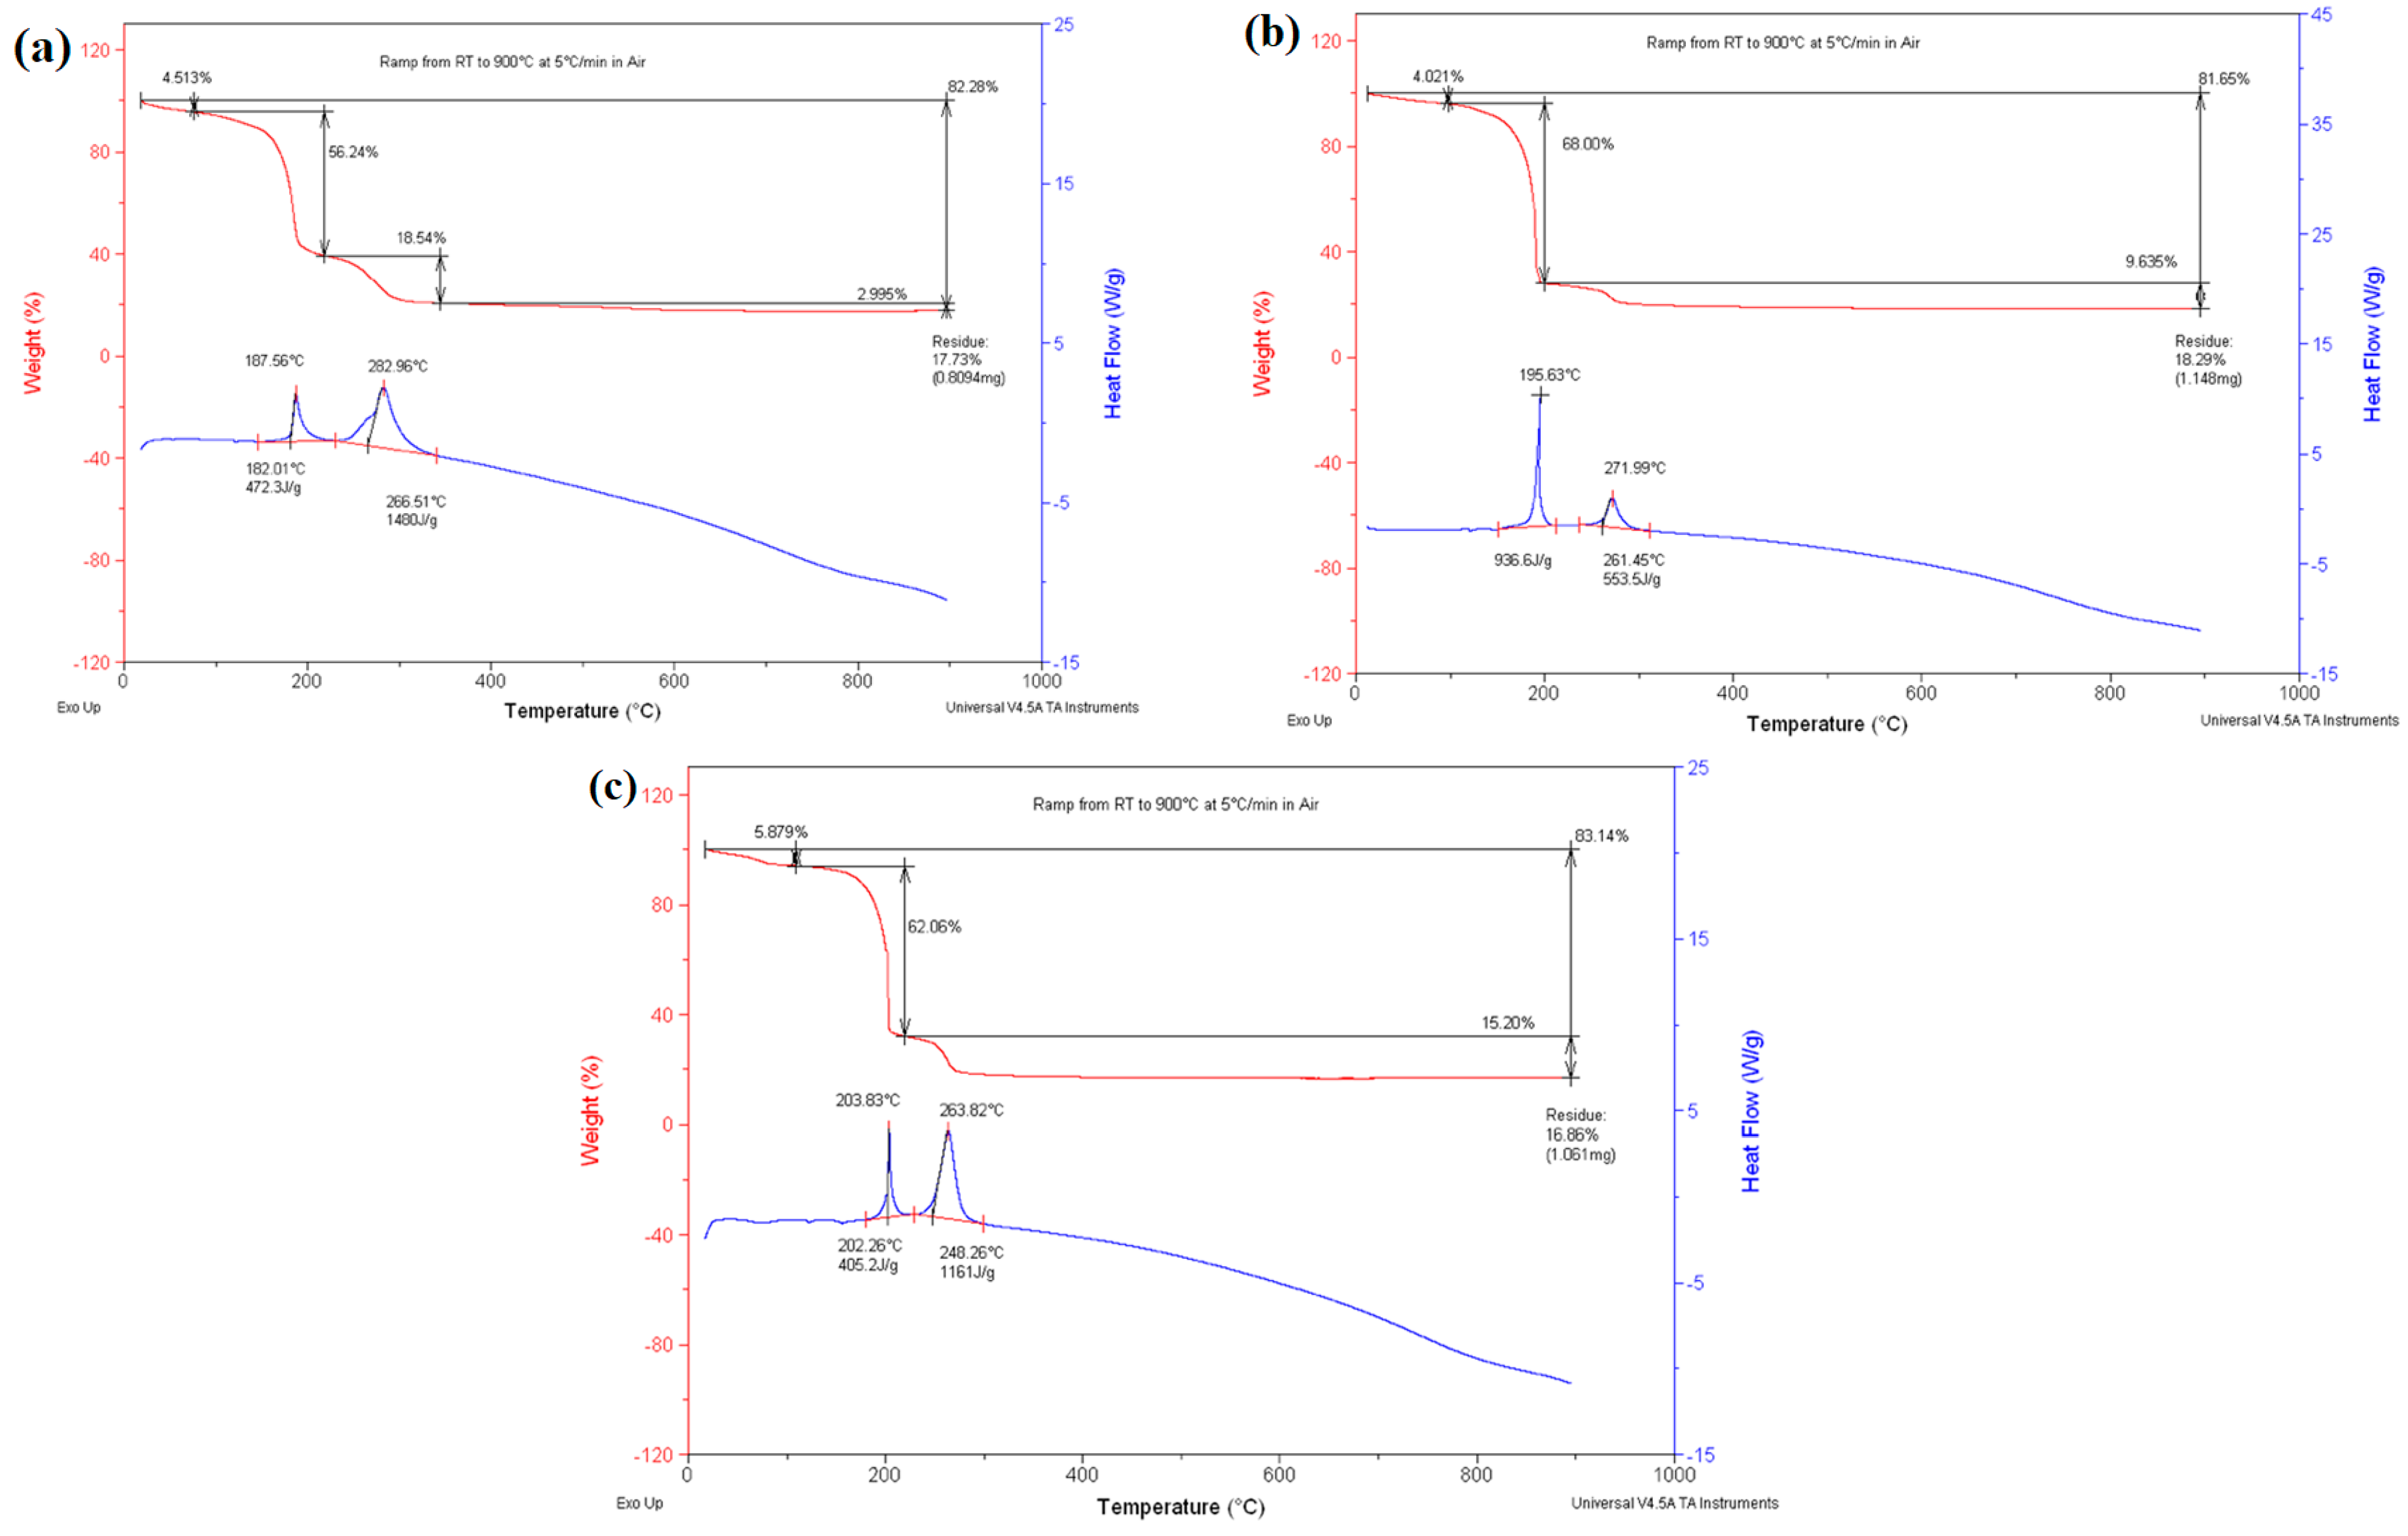
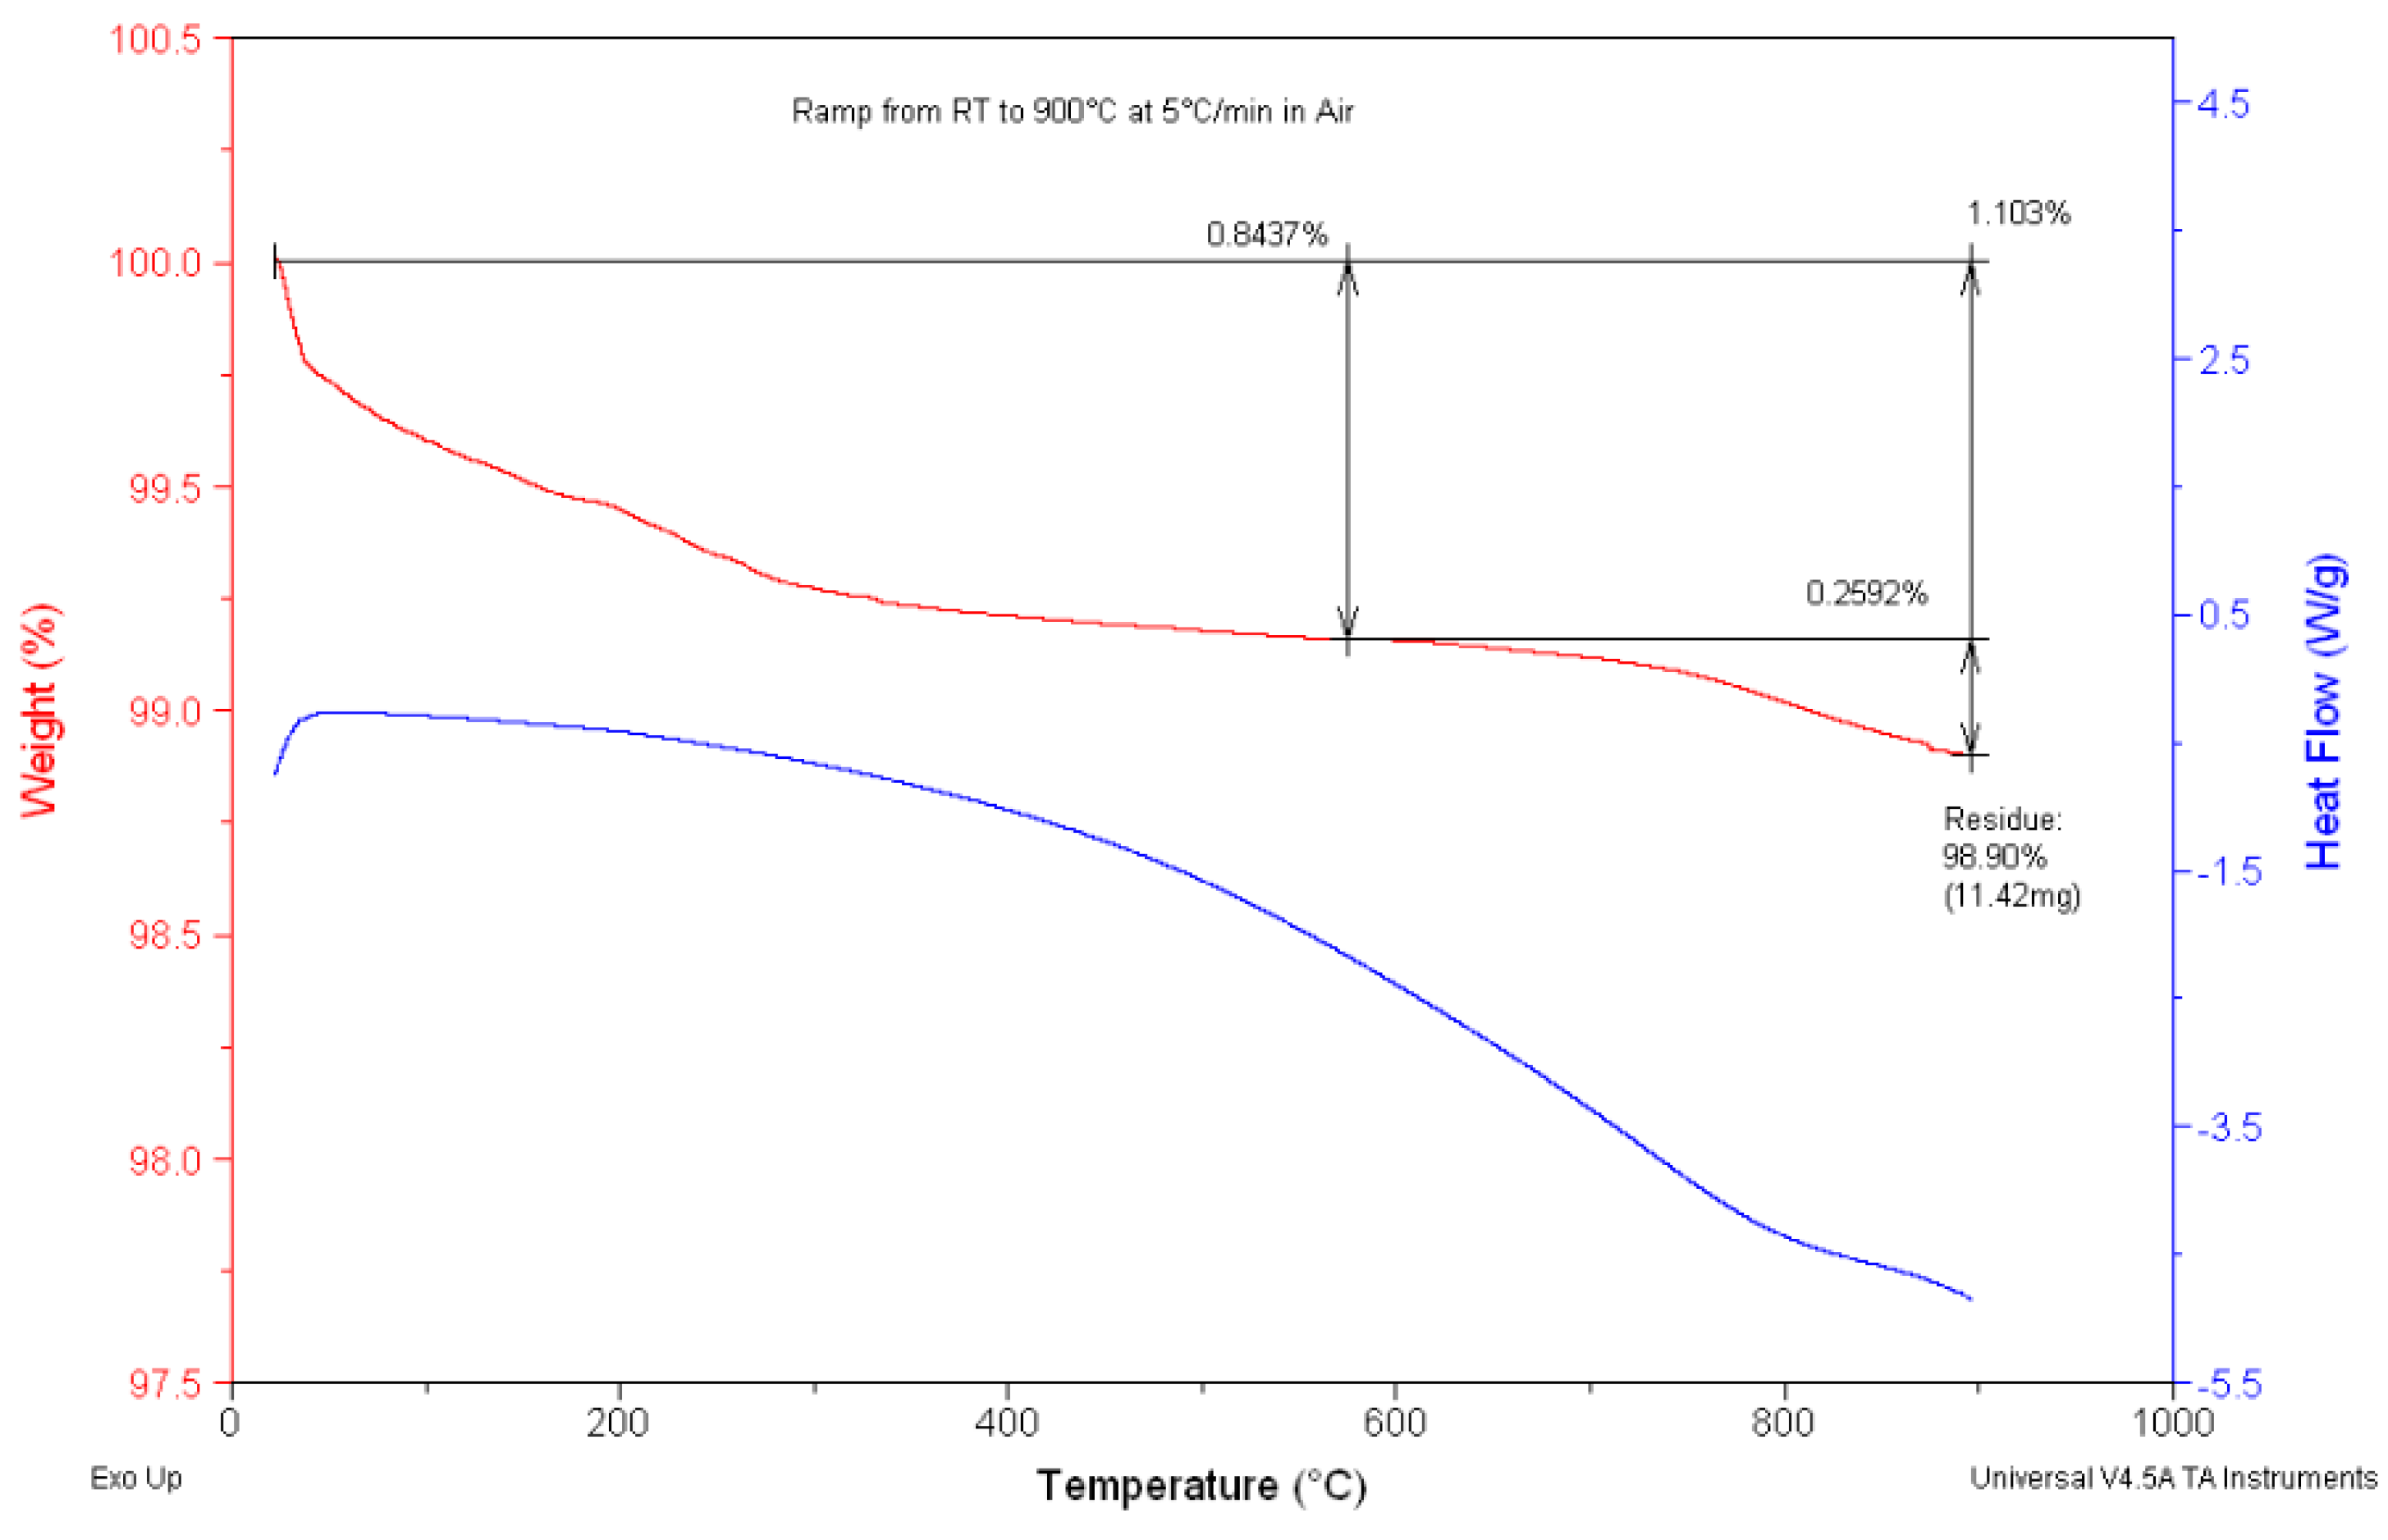
3.1. Simultaneous DSC/TGA Analysis
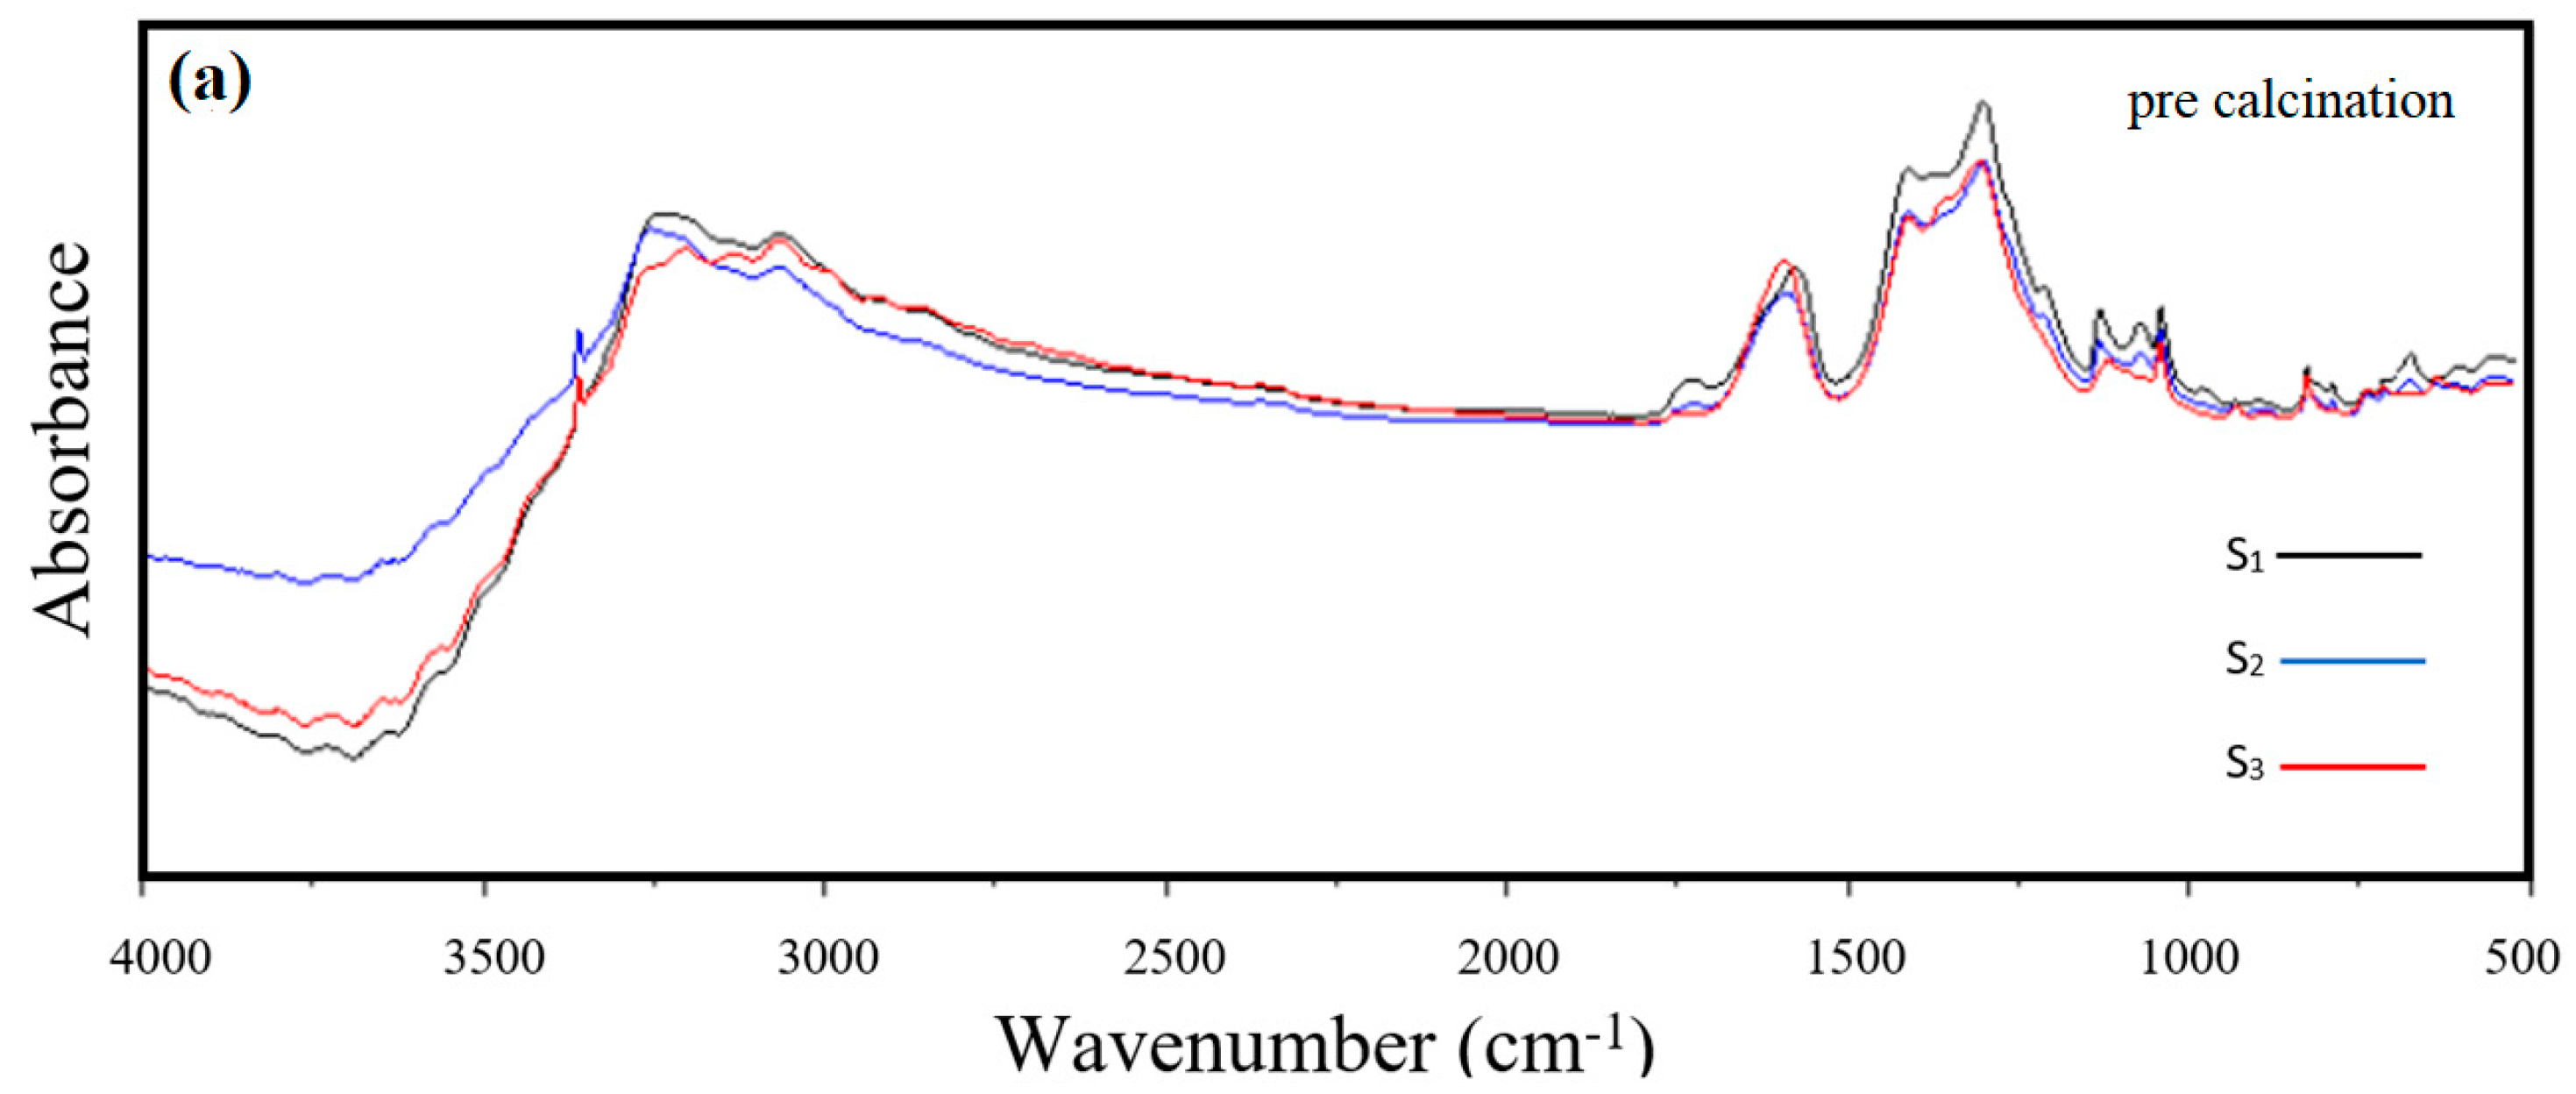
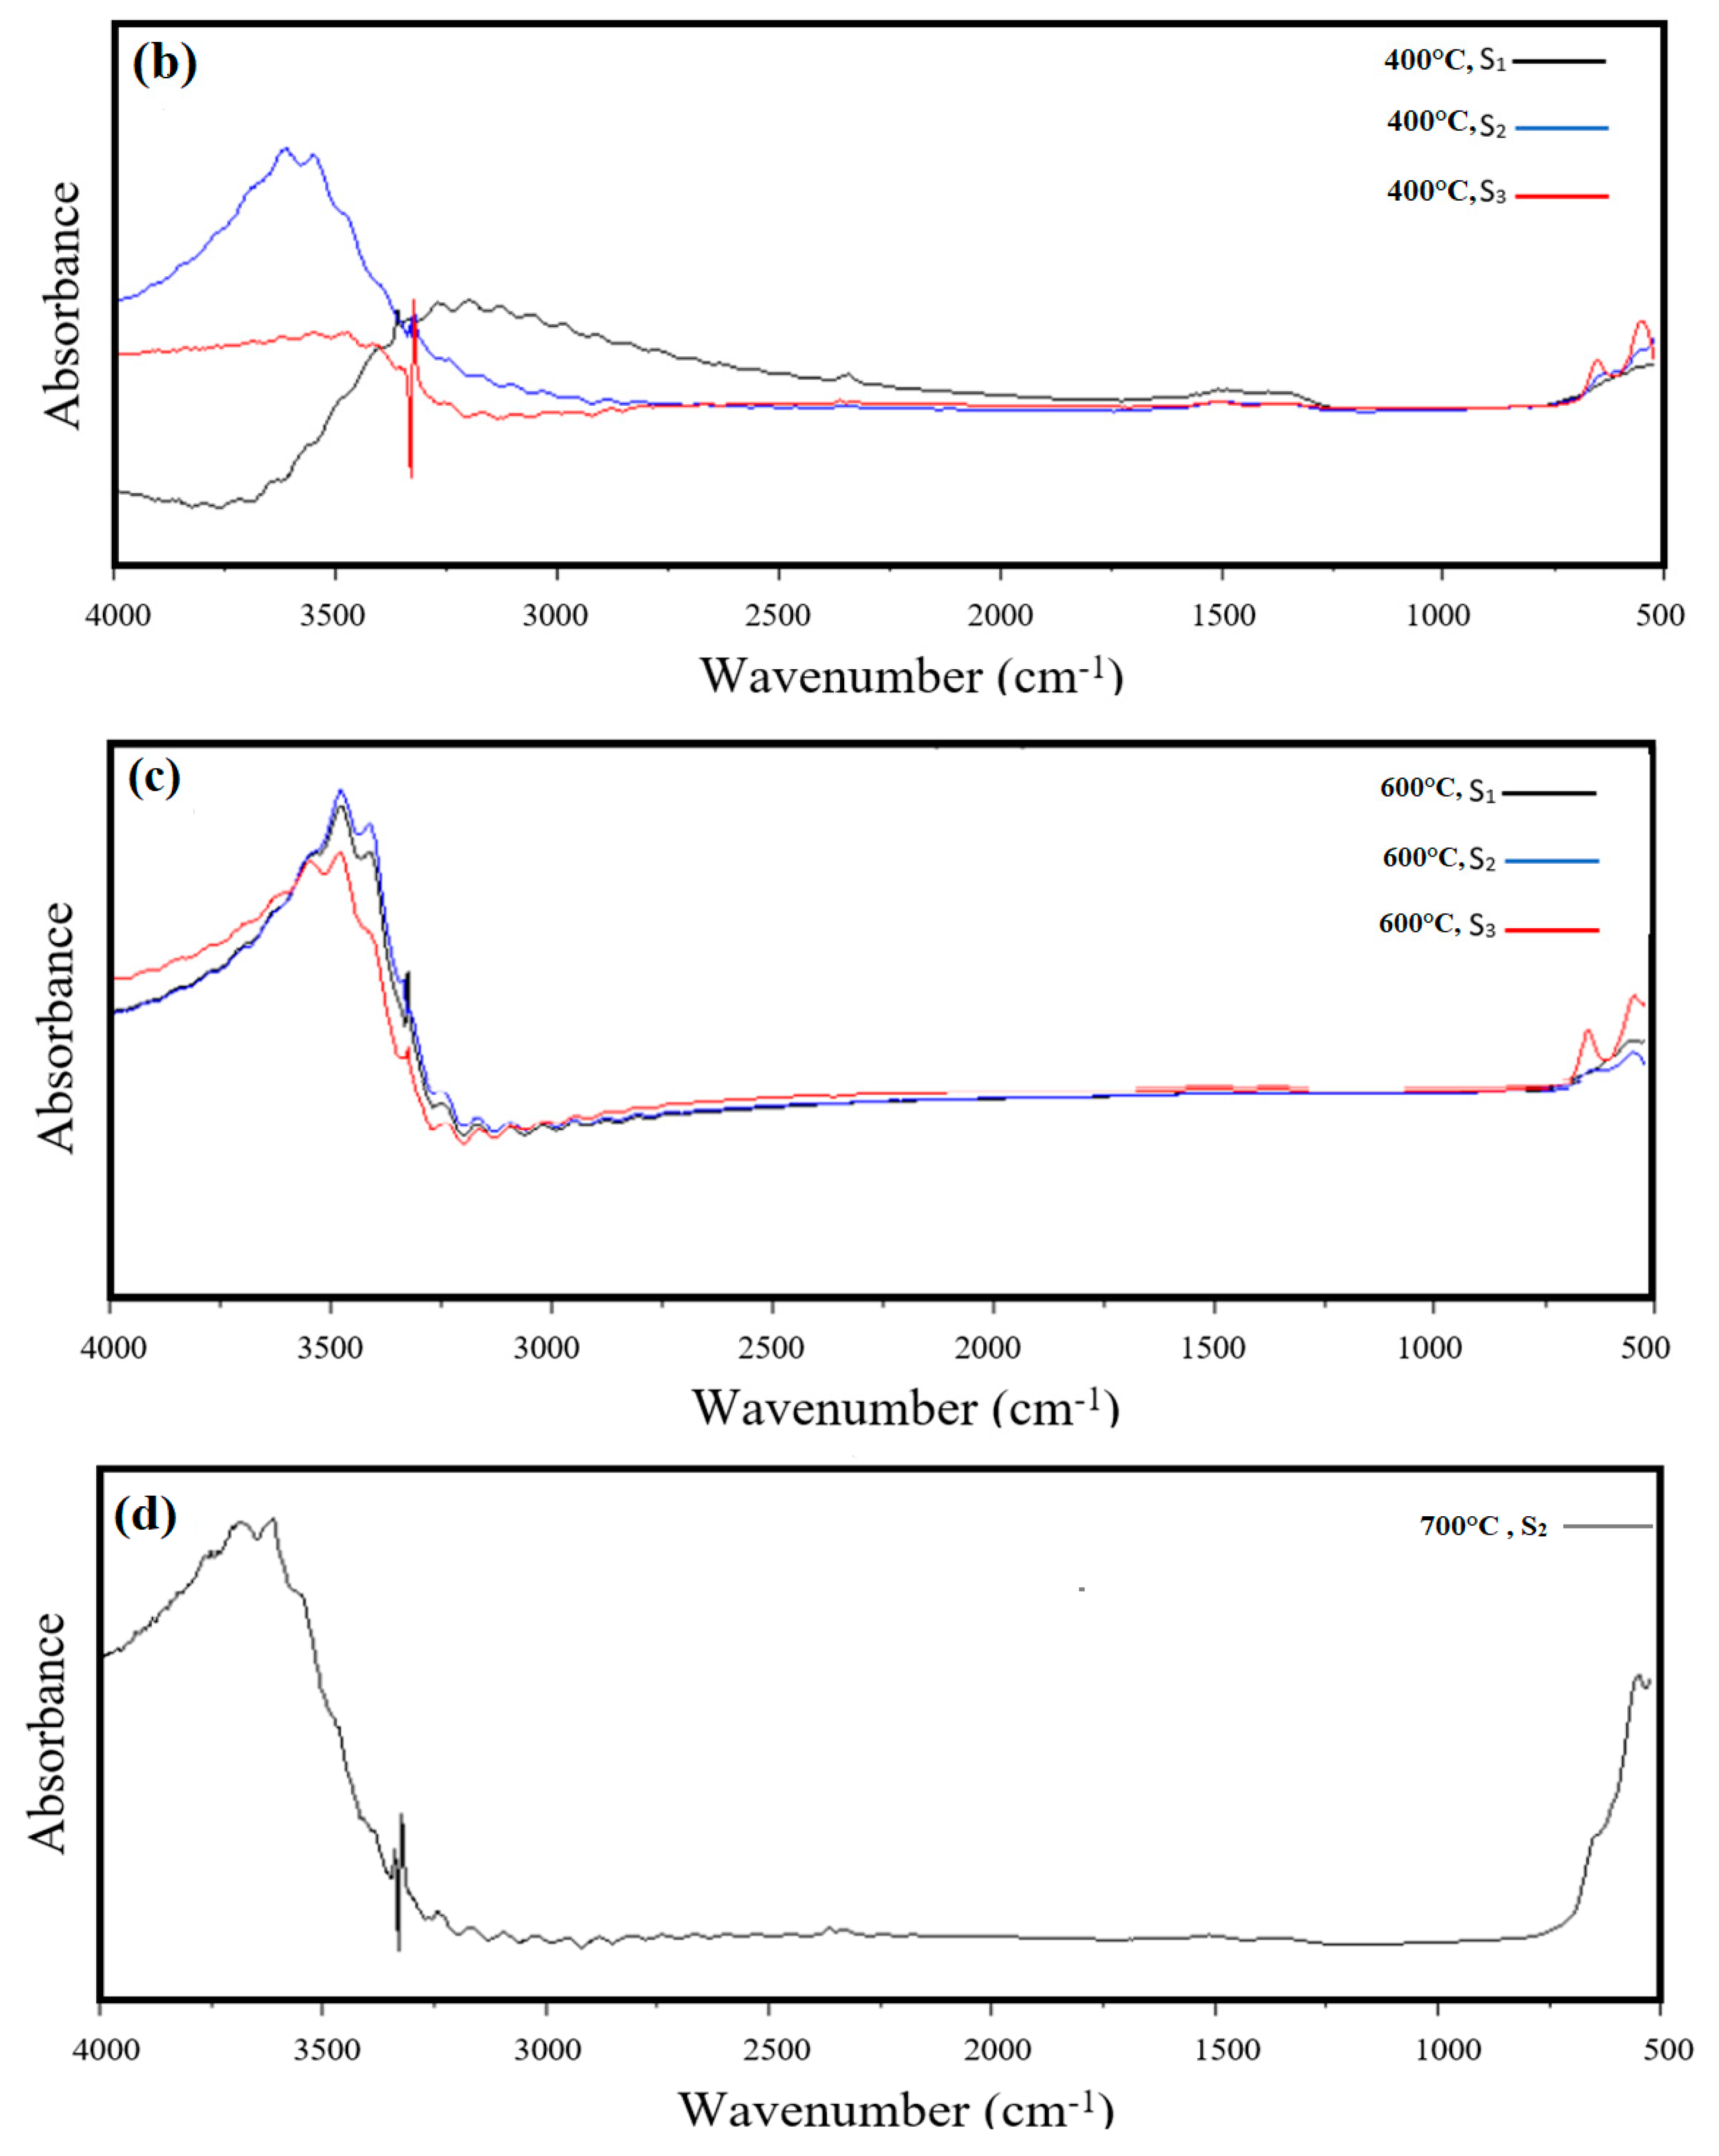
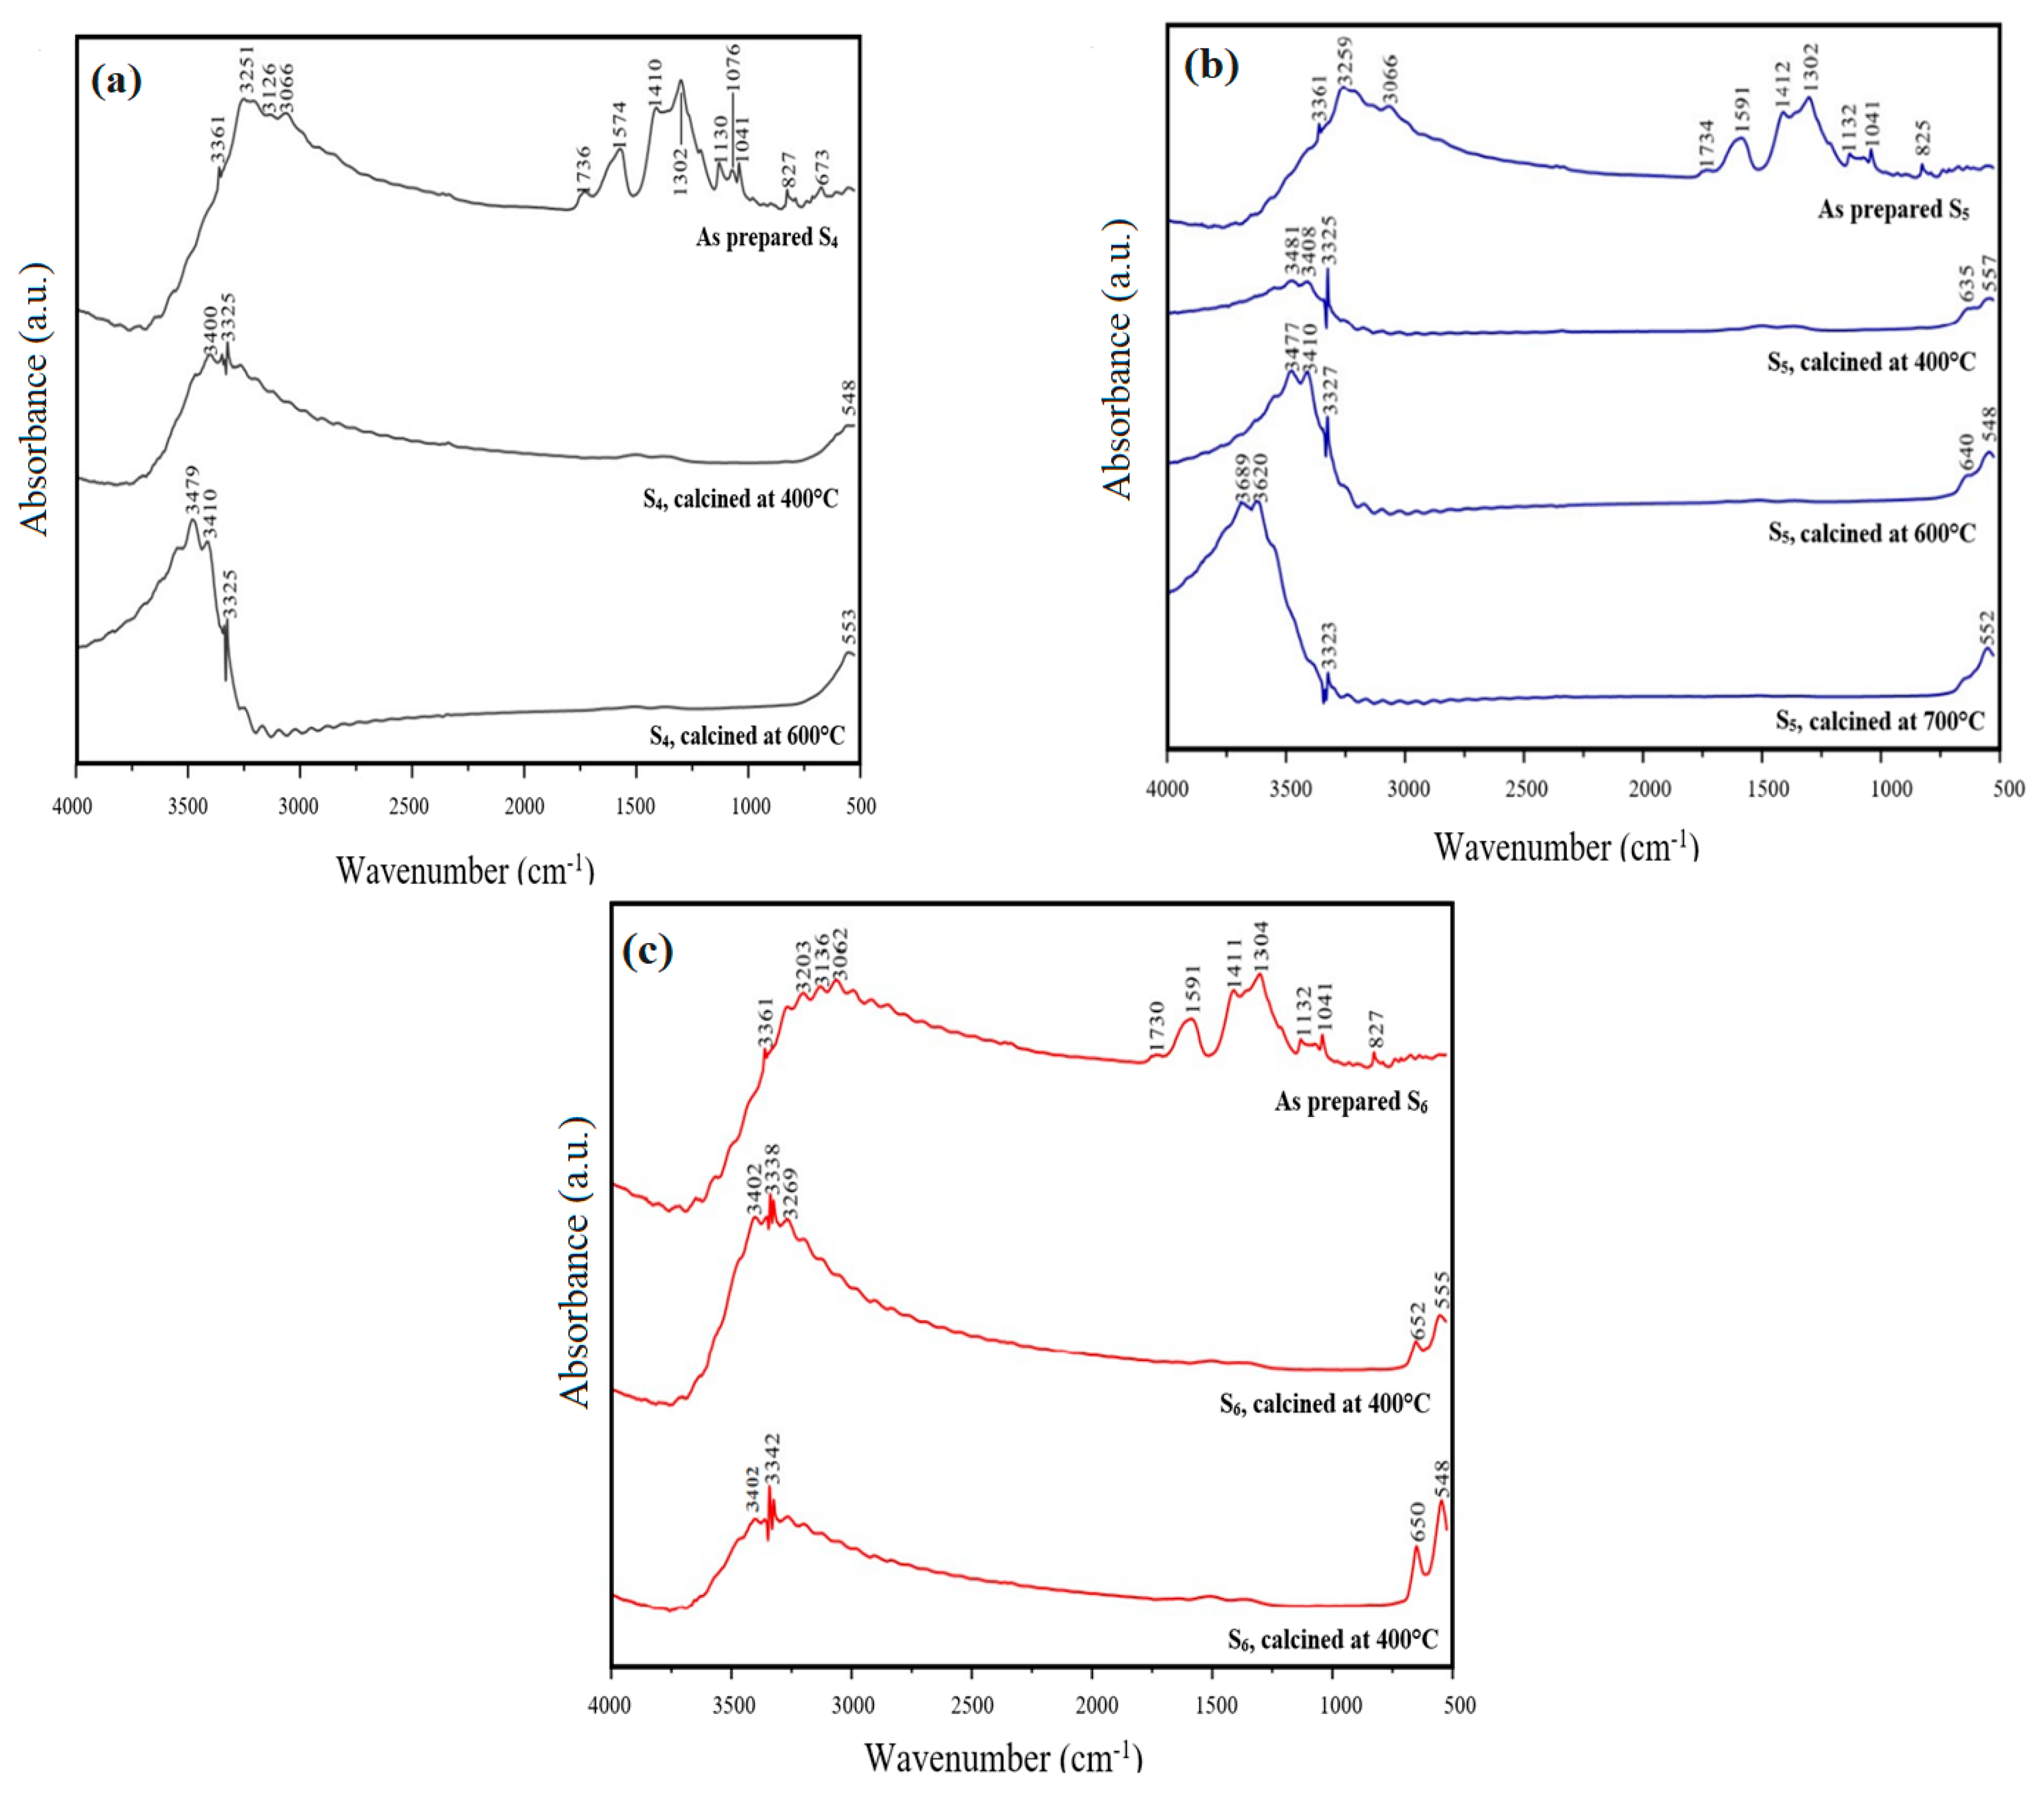
3.2. FT-IR Analysis
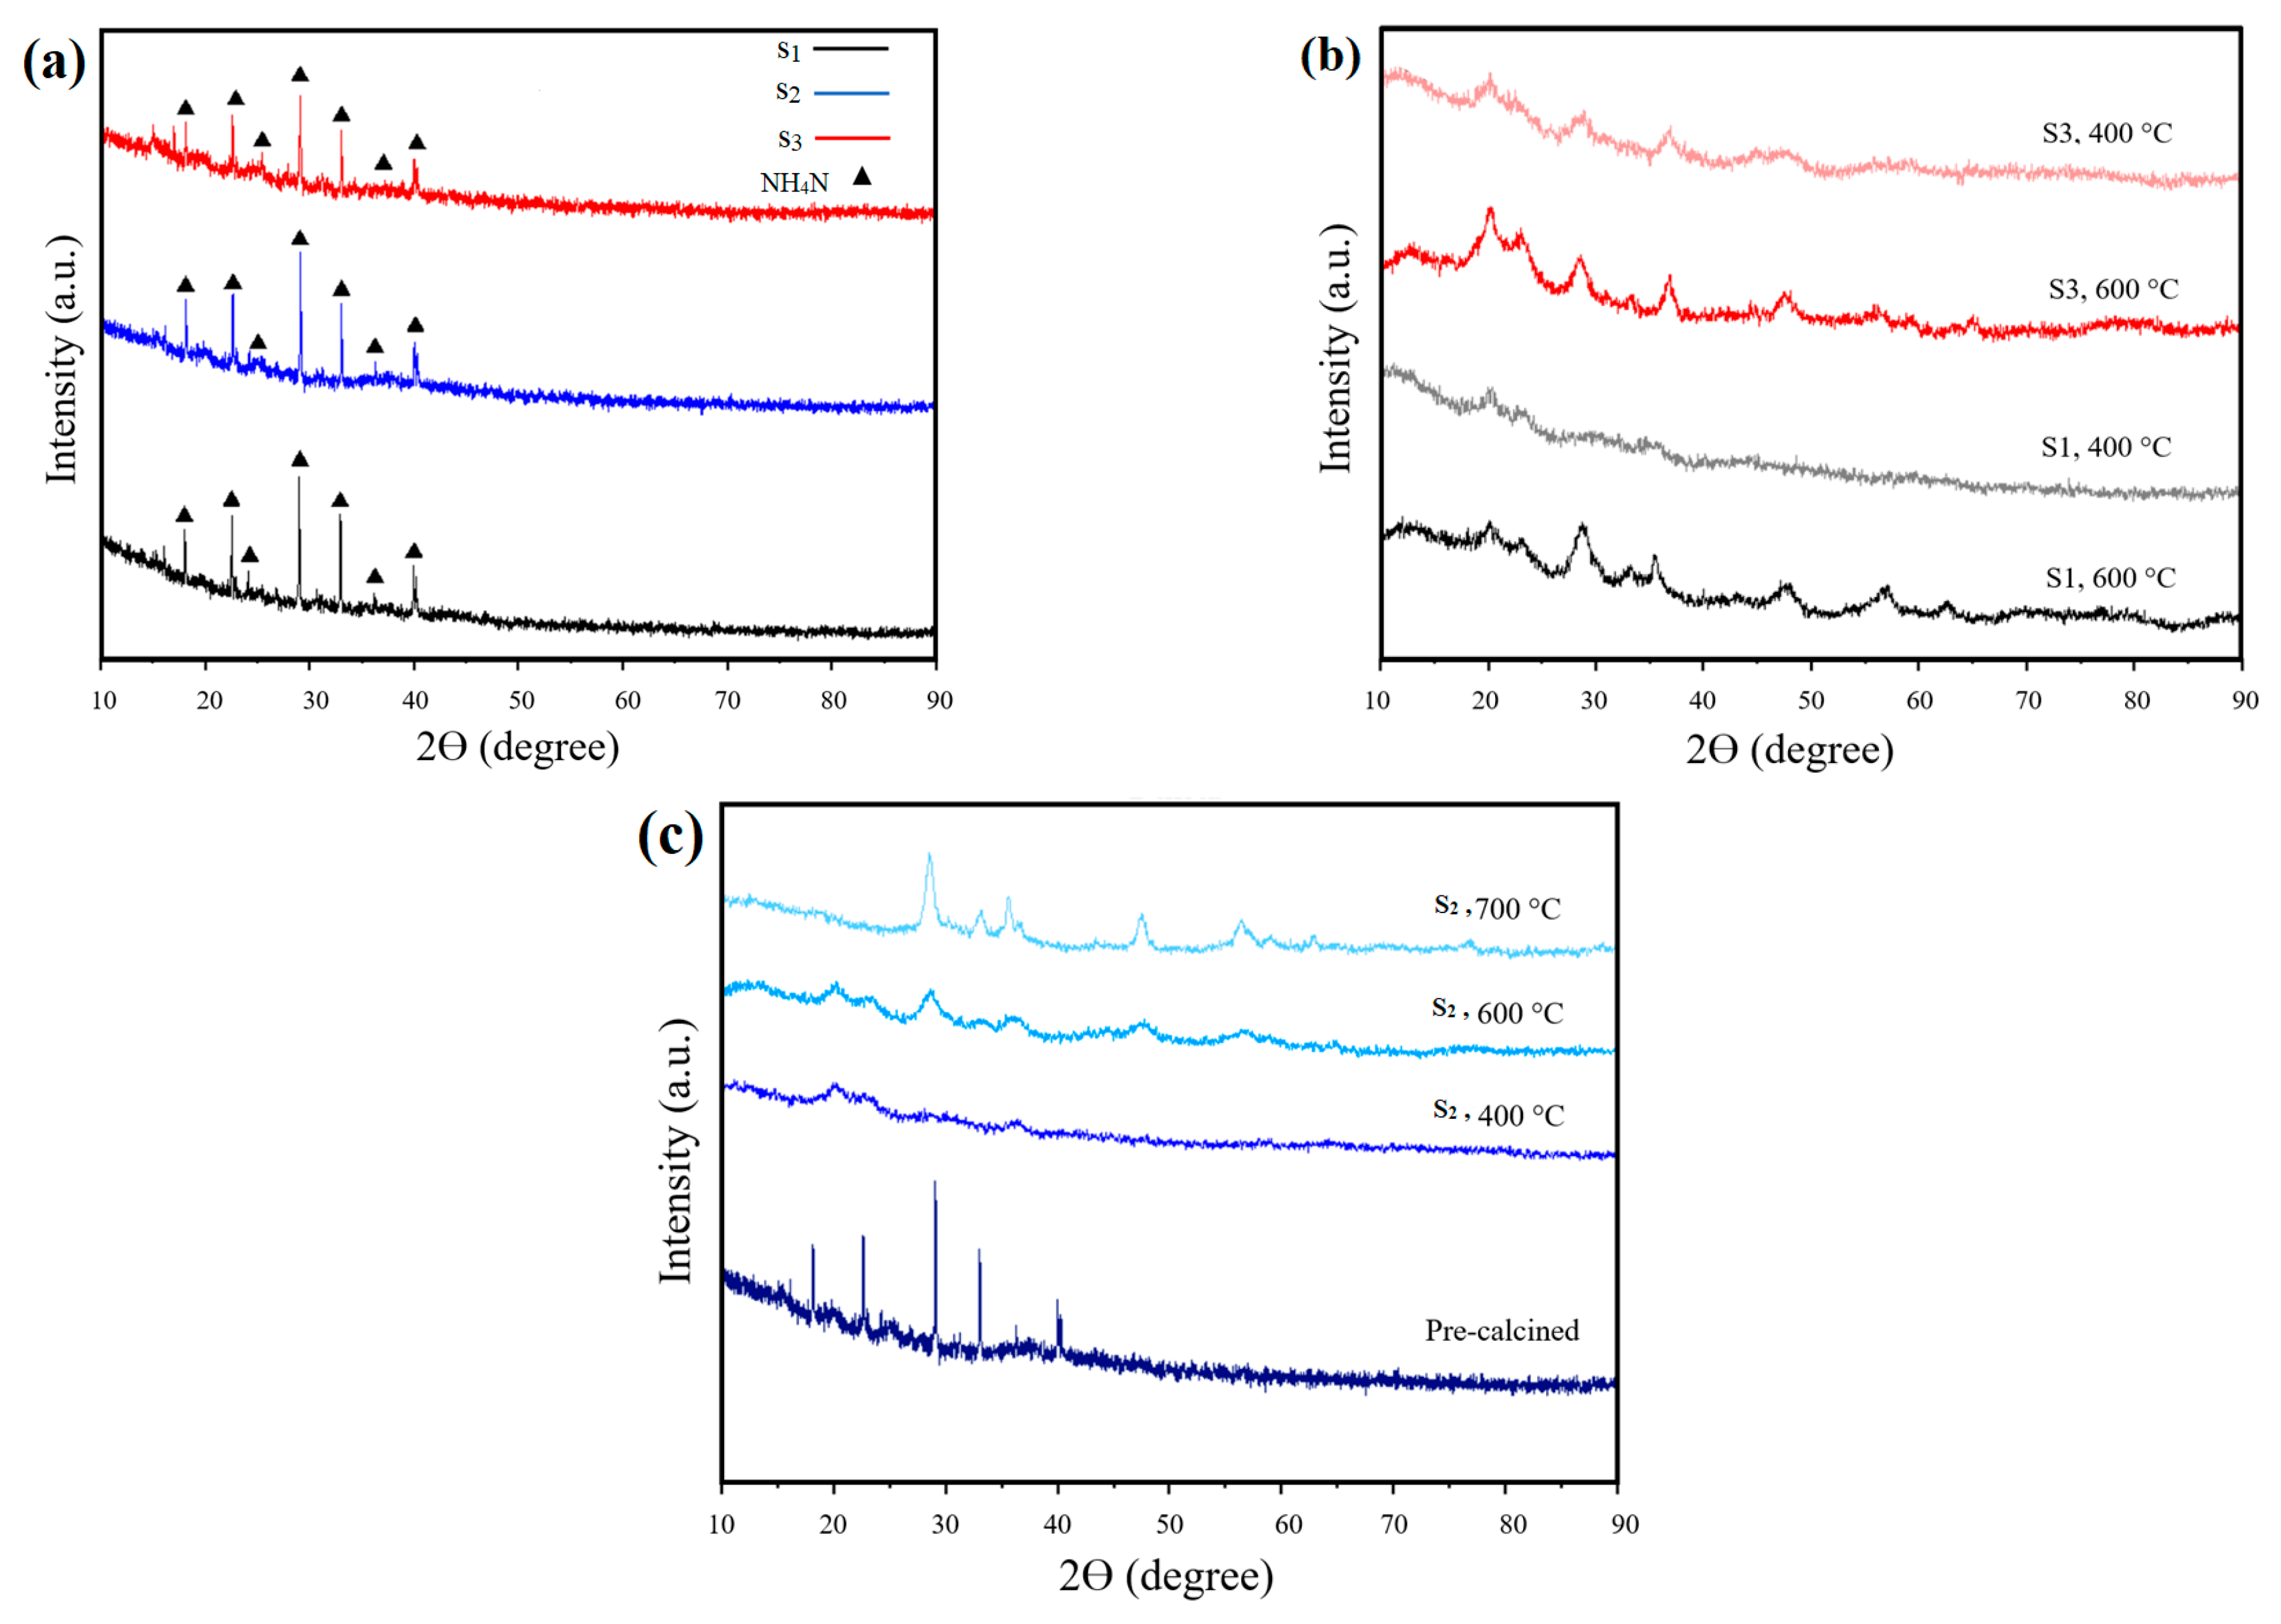
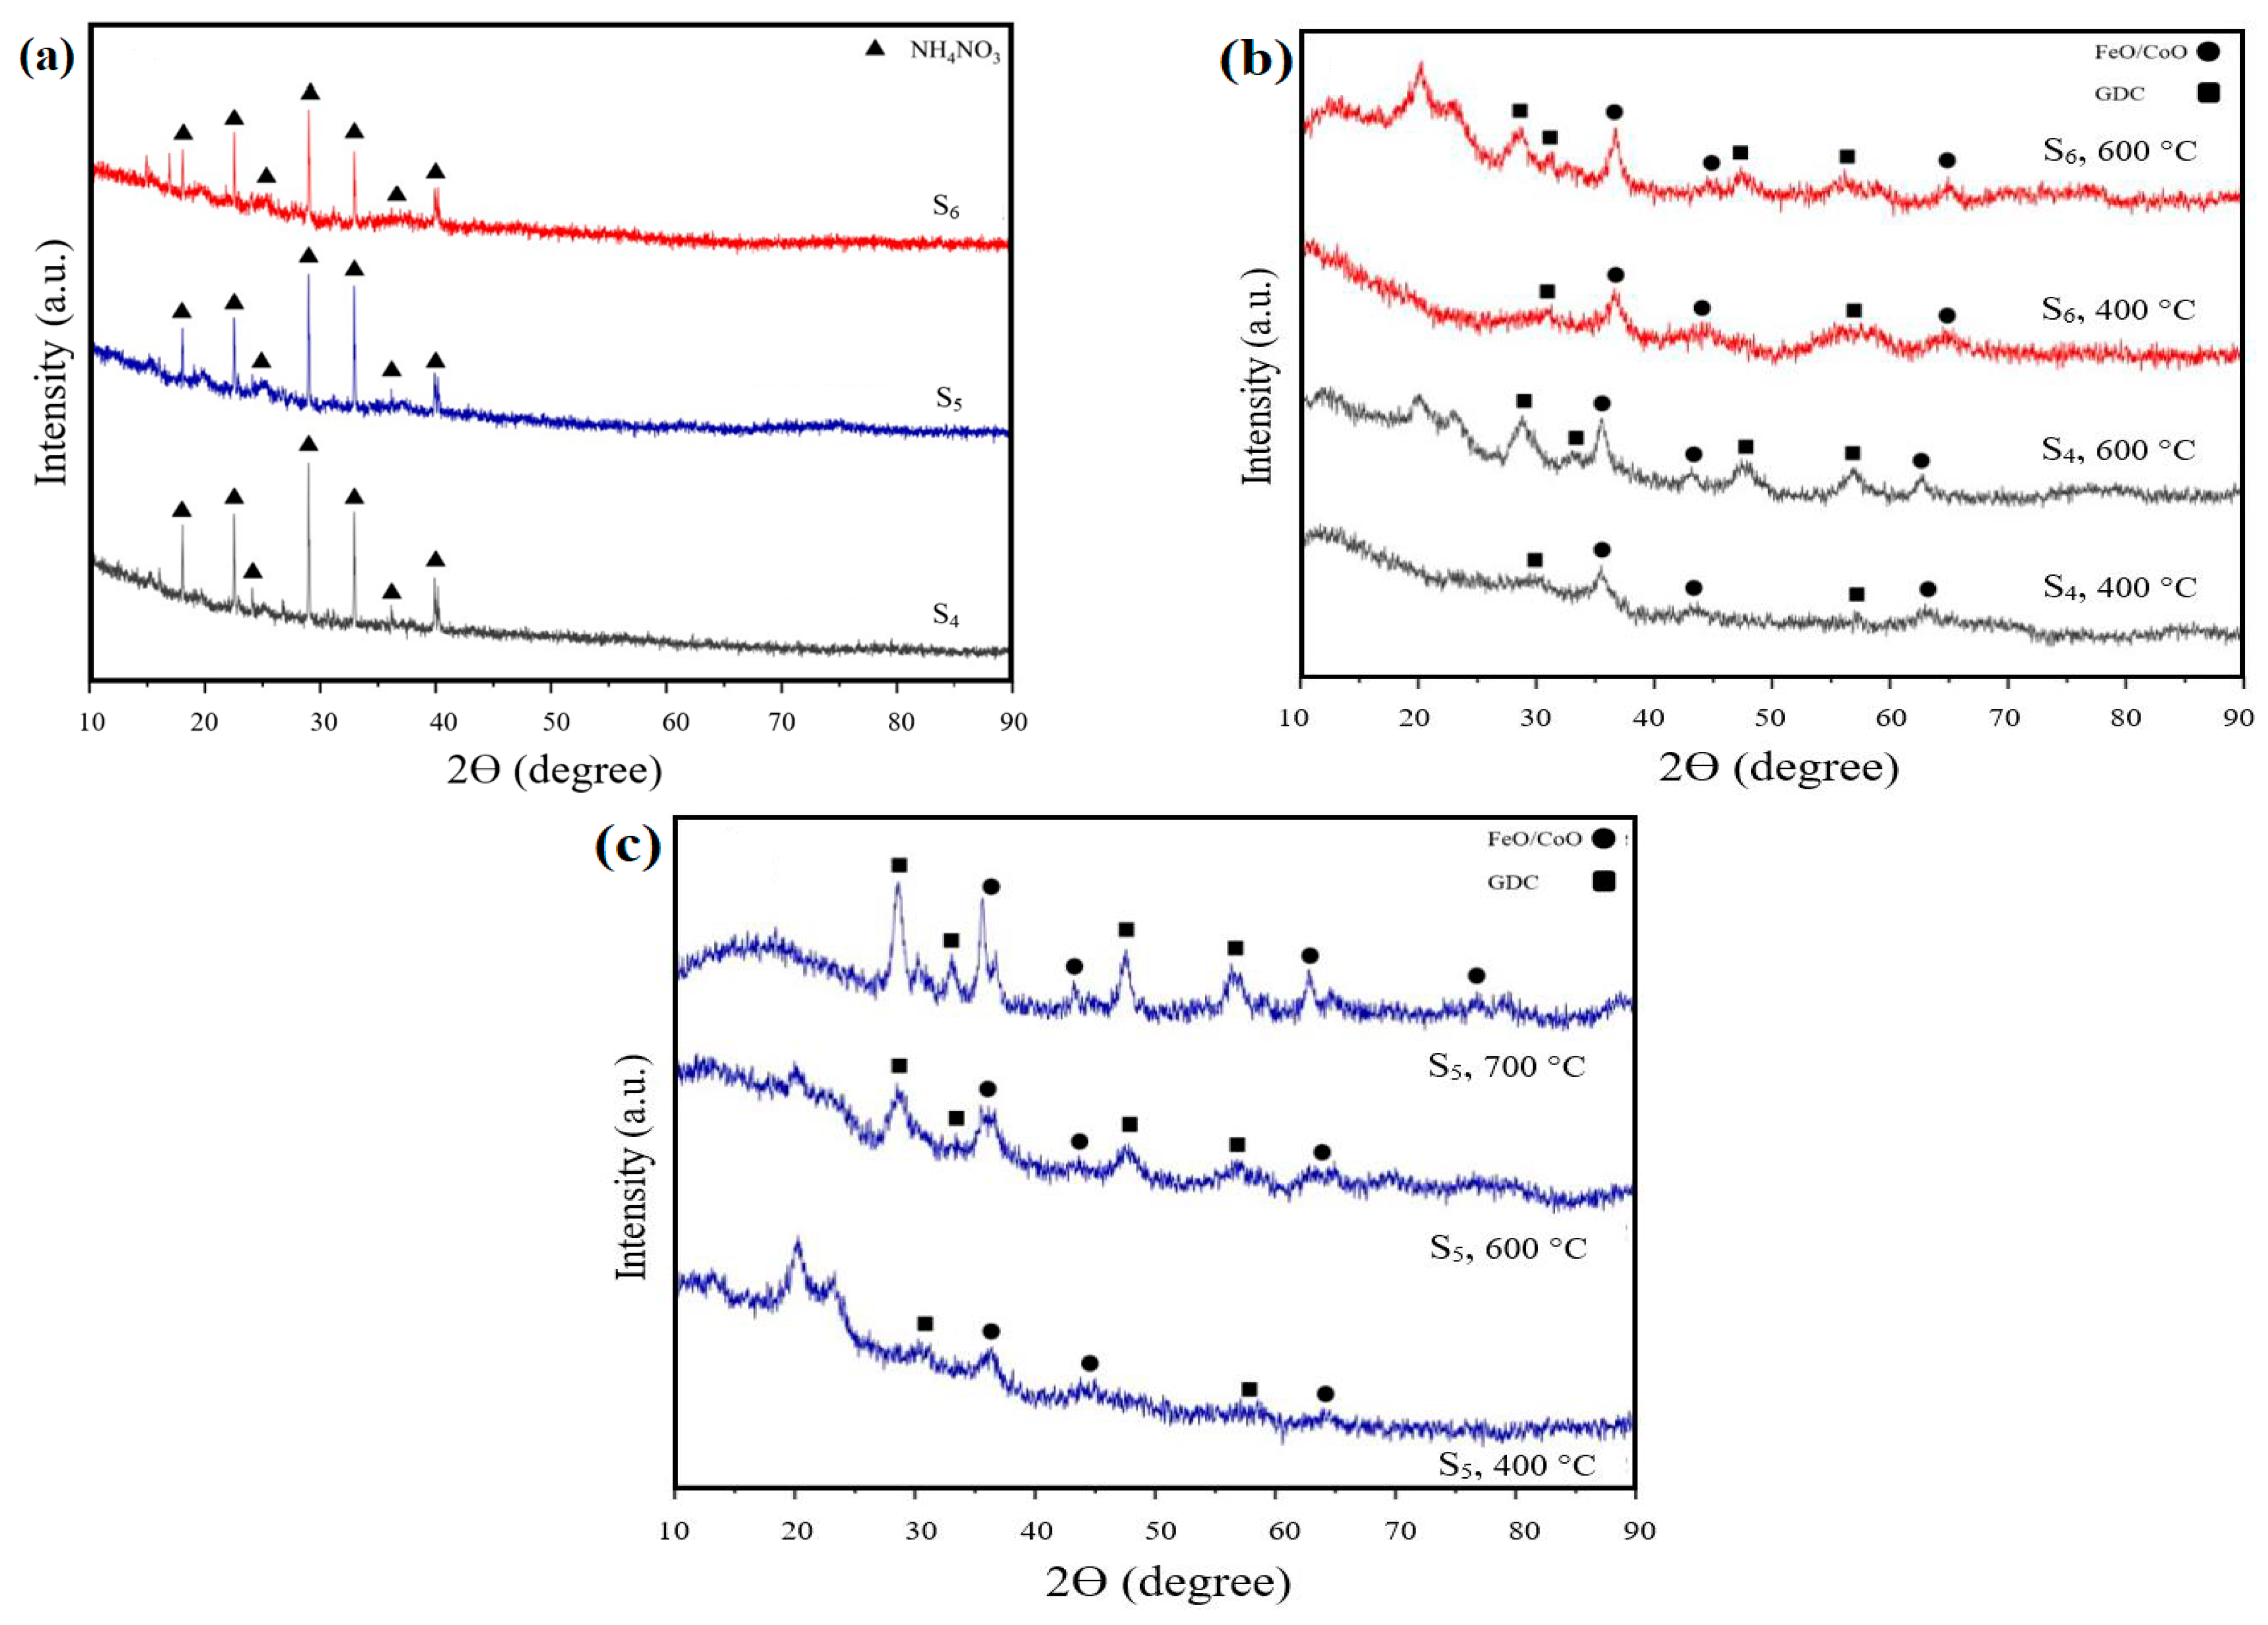
3.3. XRD Analysis
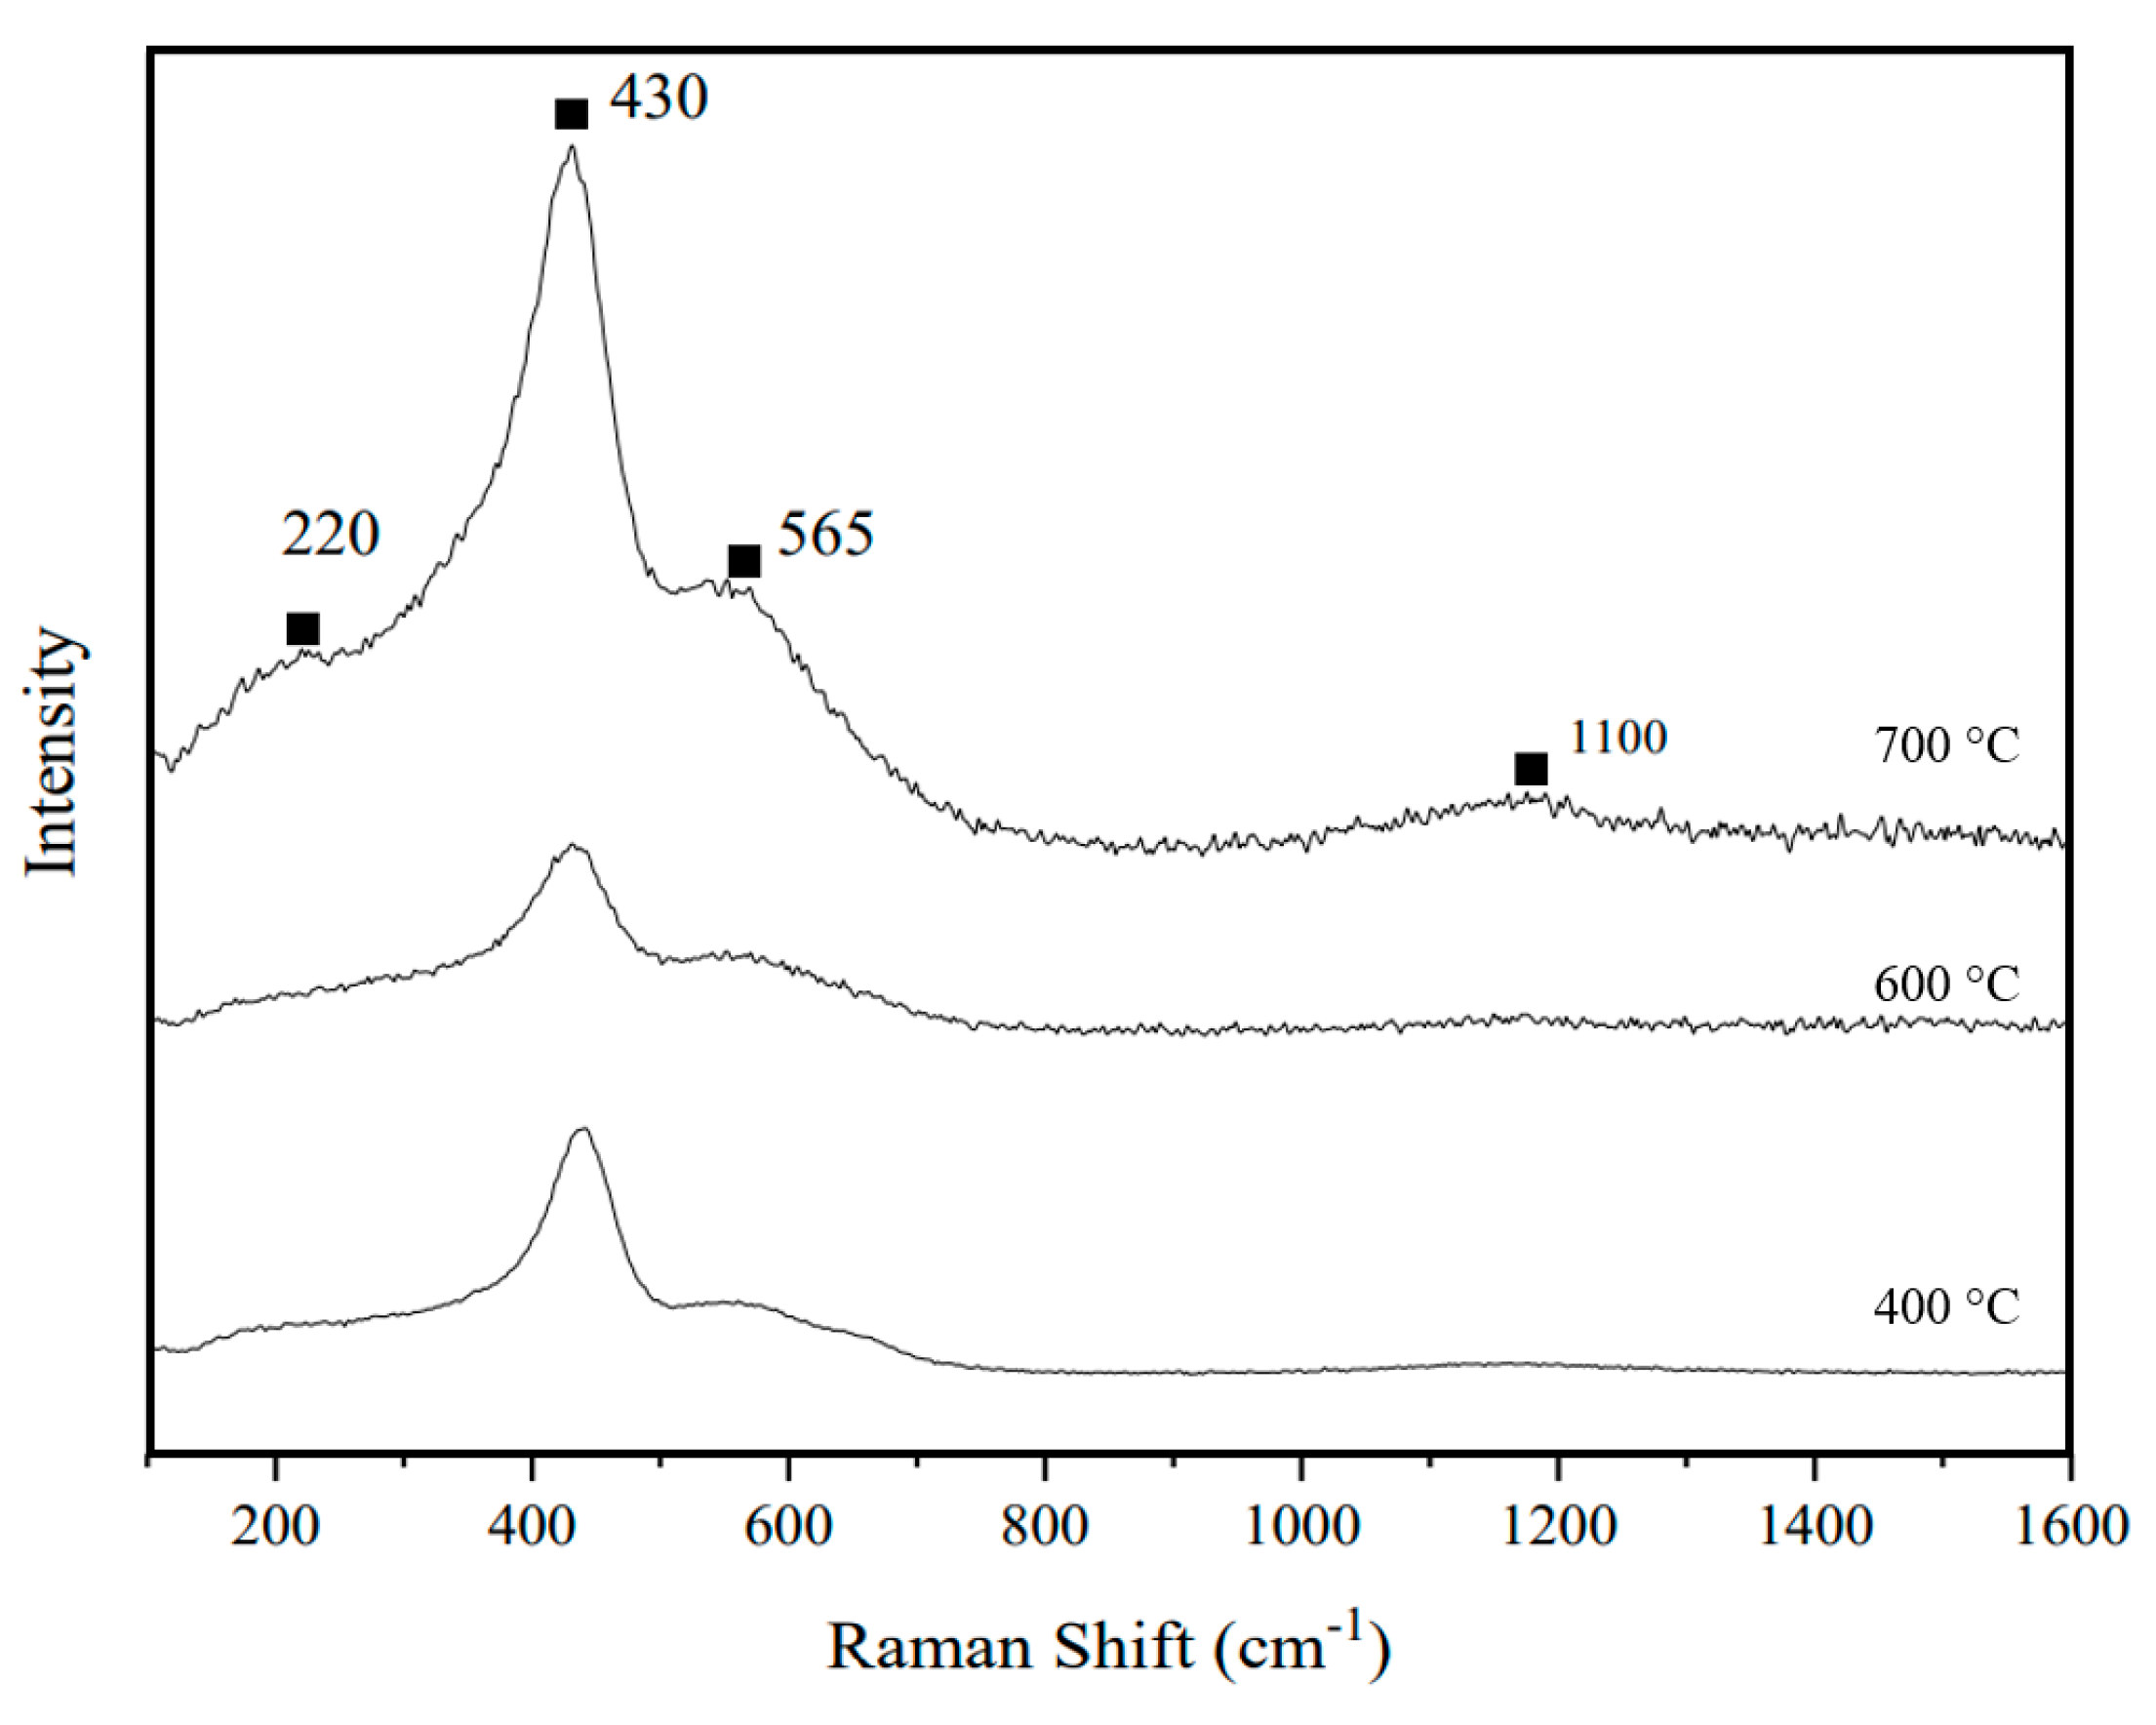
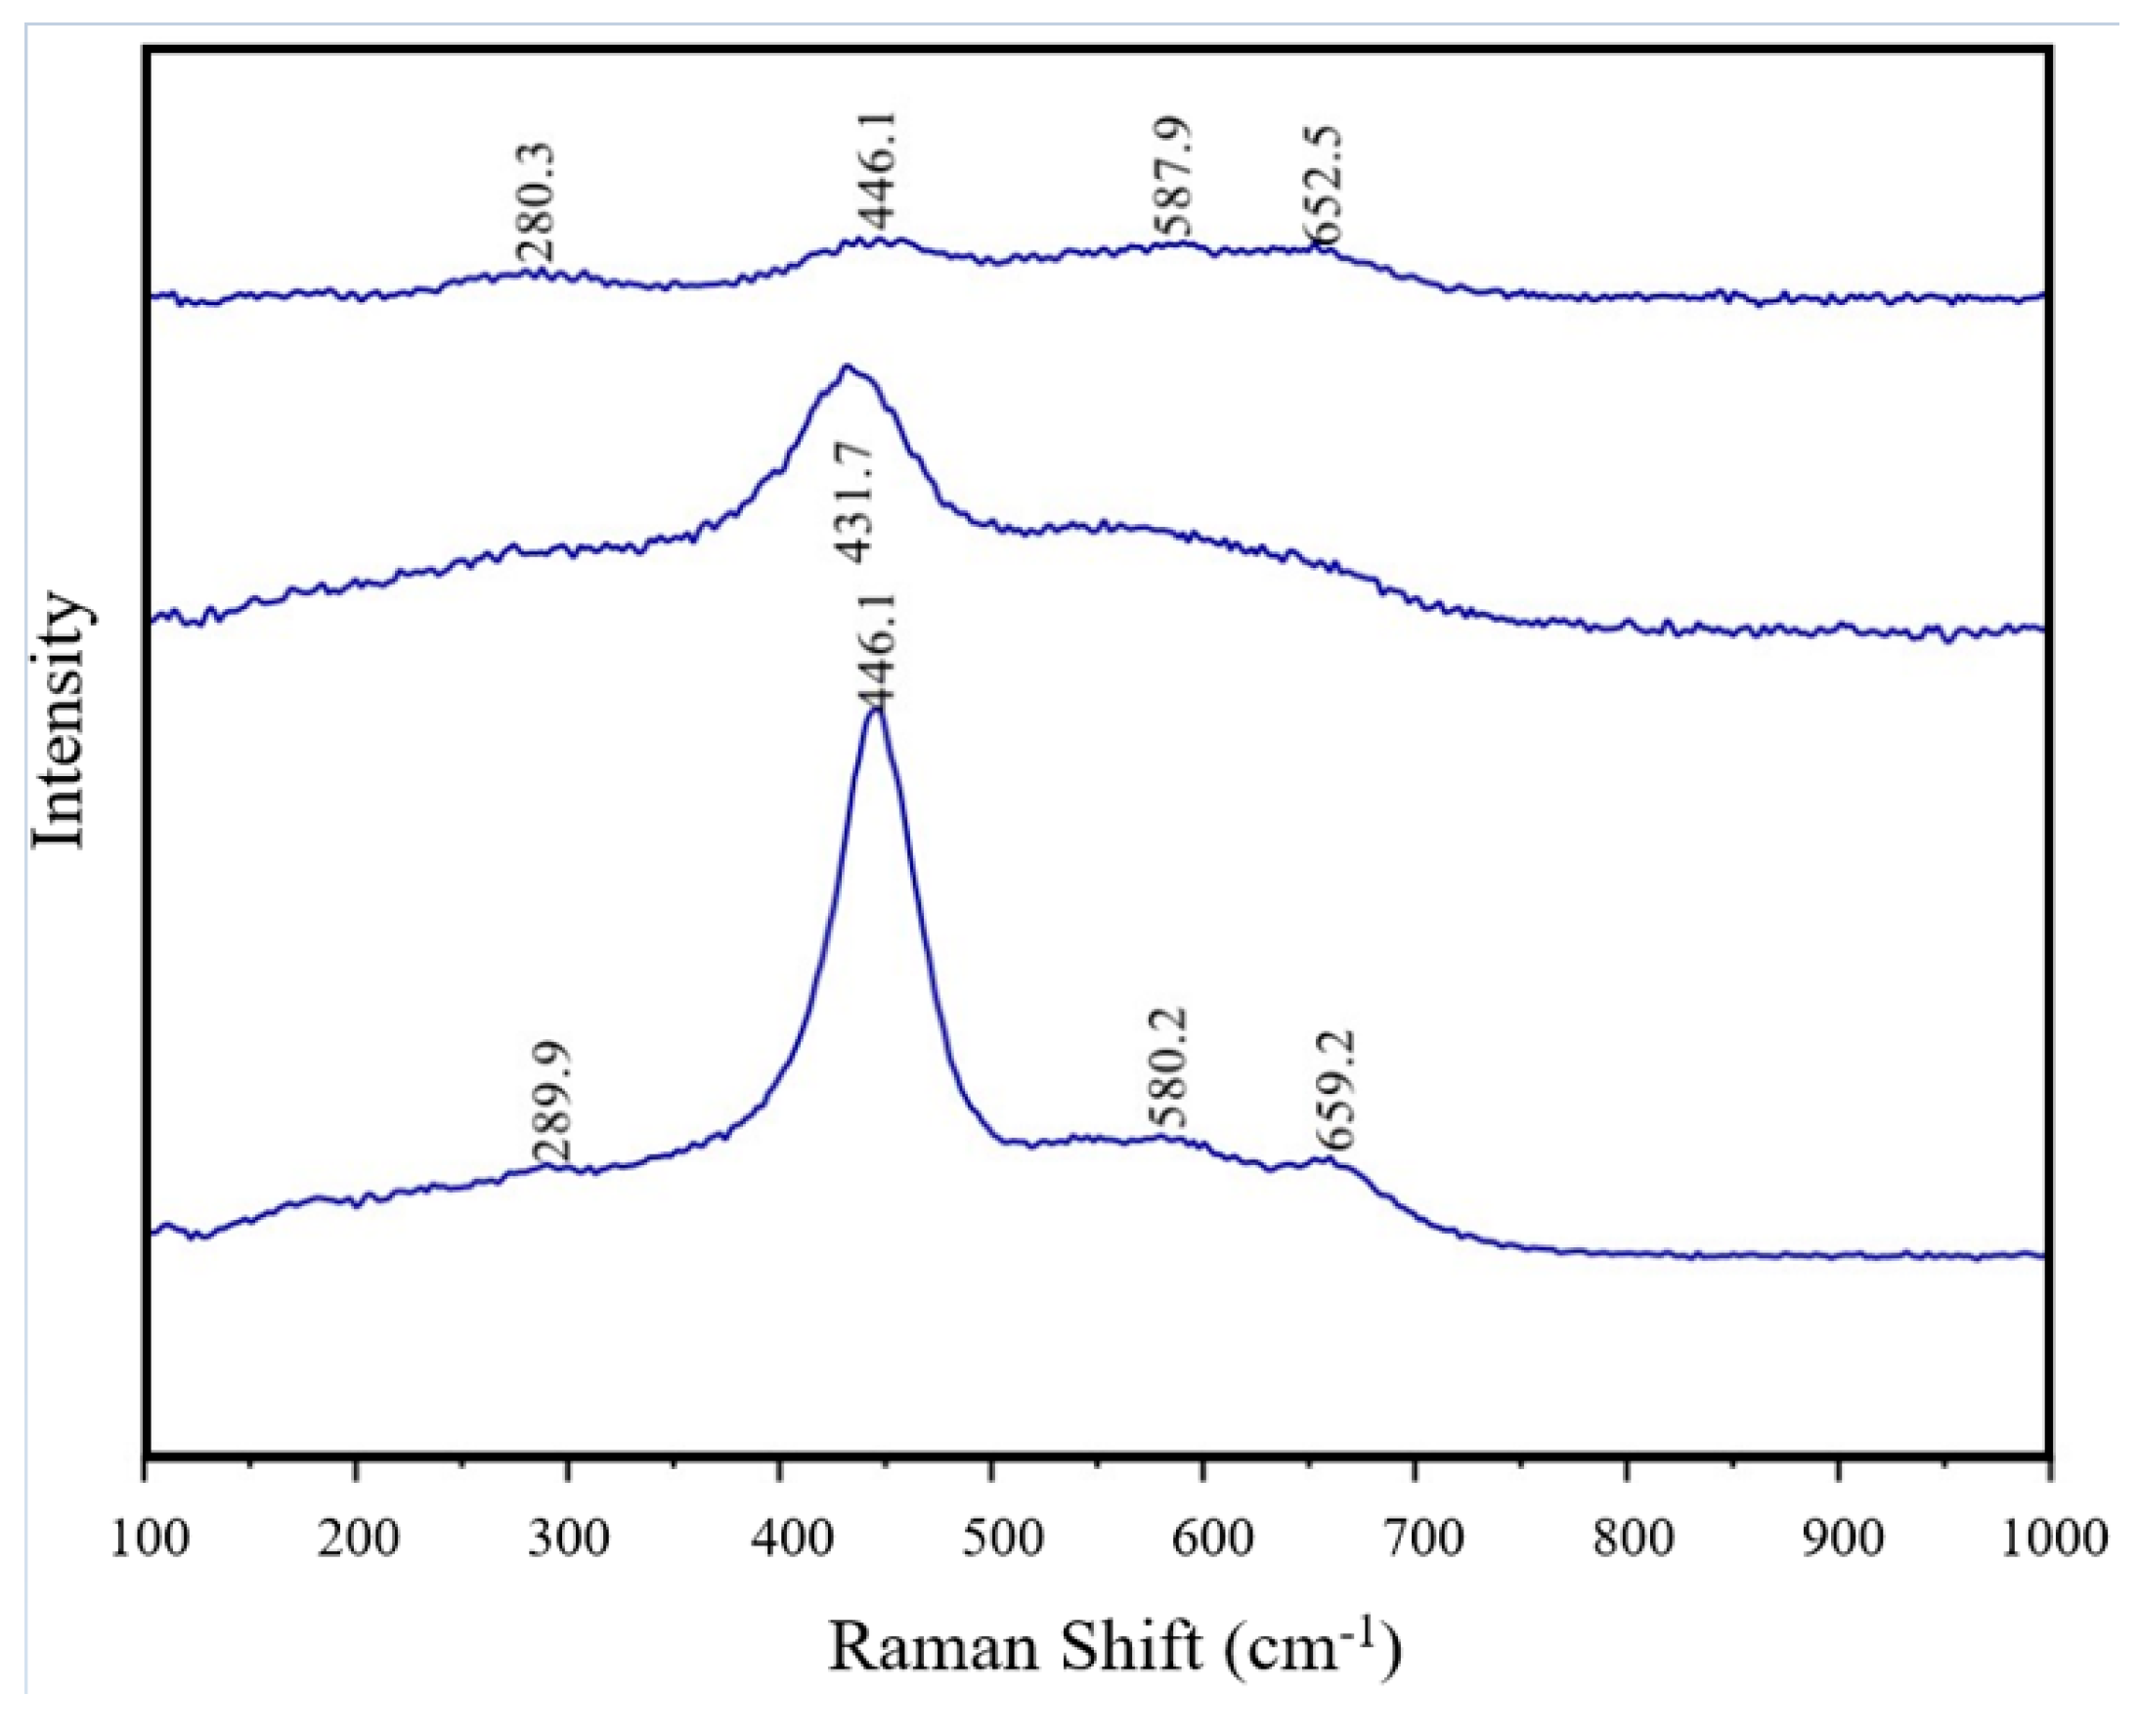
3.4. Raman Spectroscopy
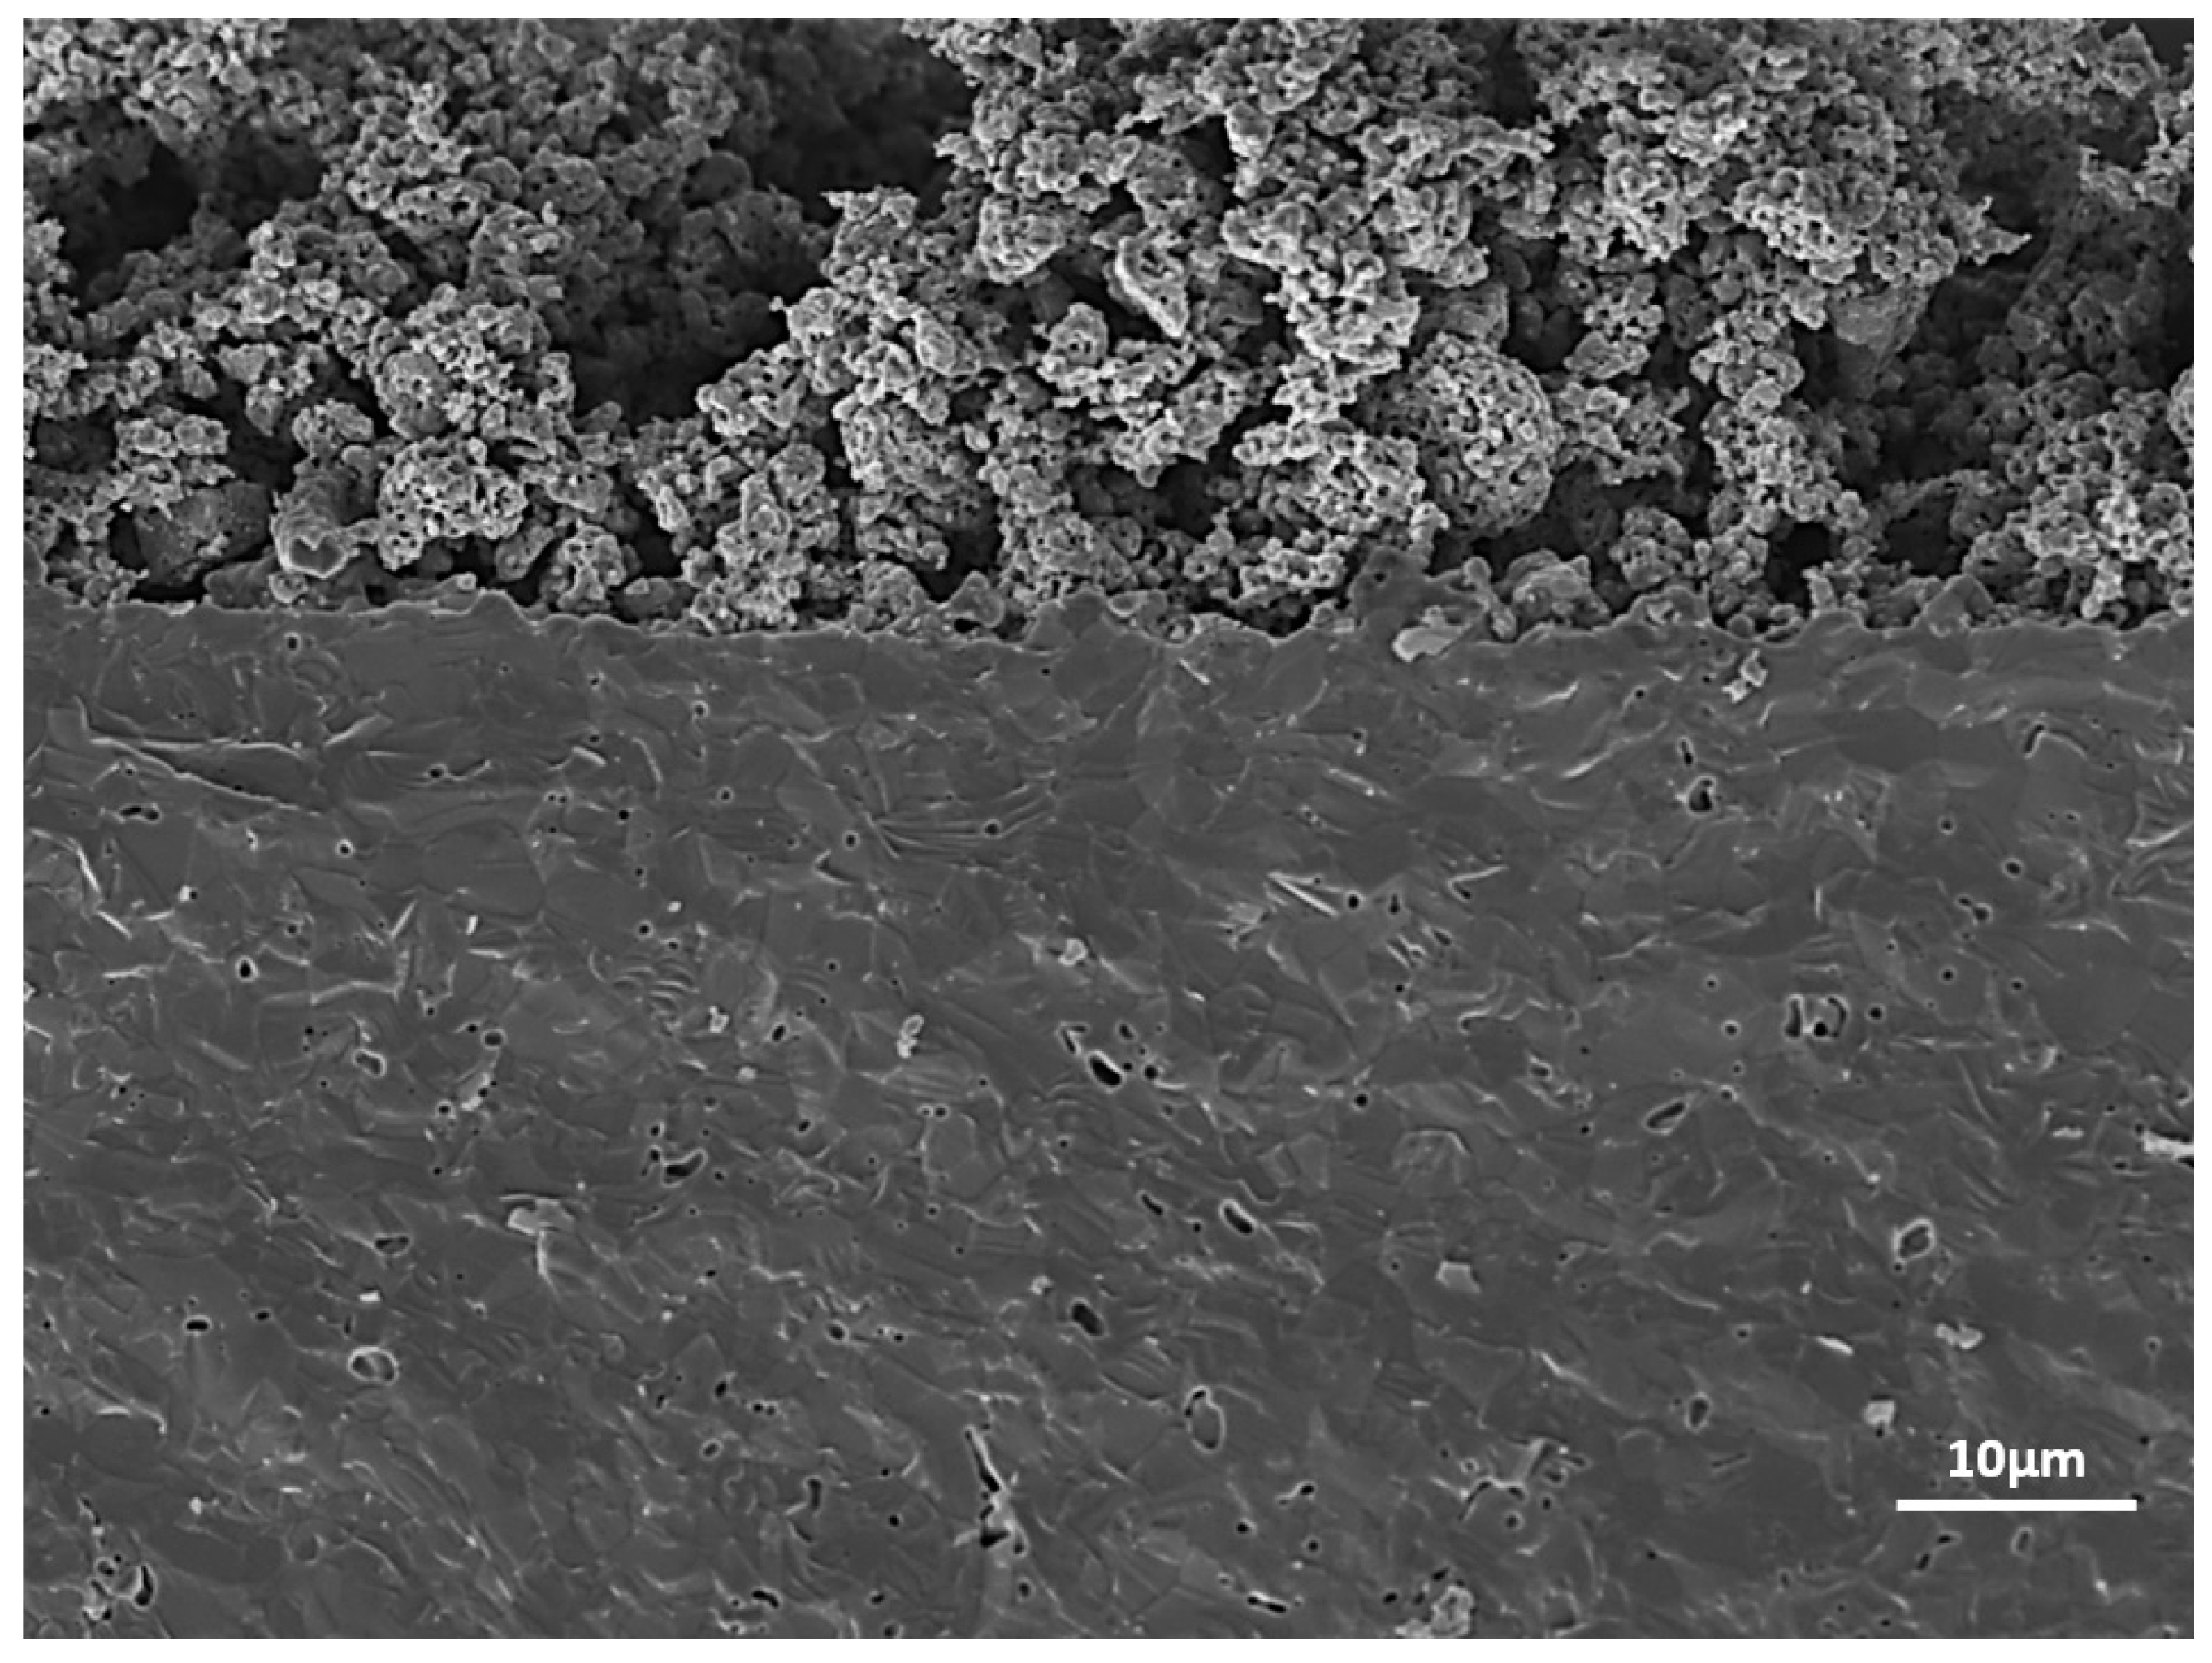
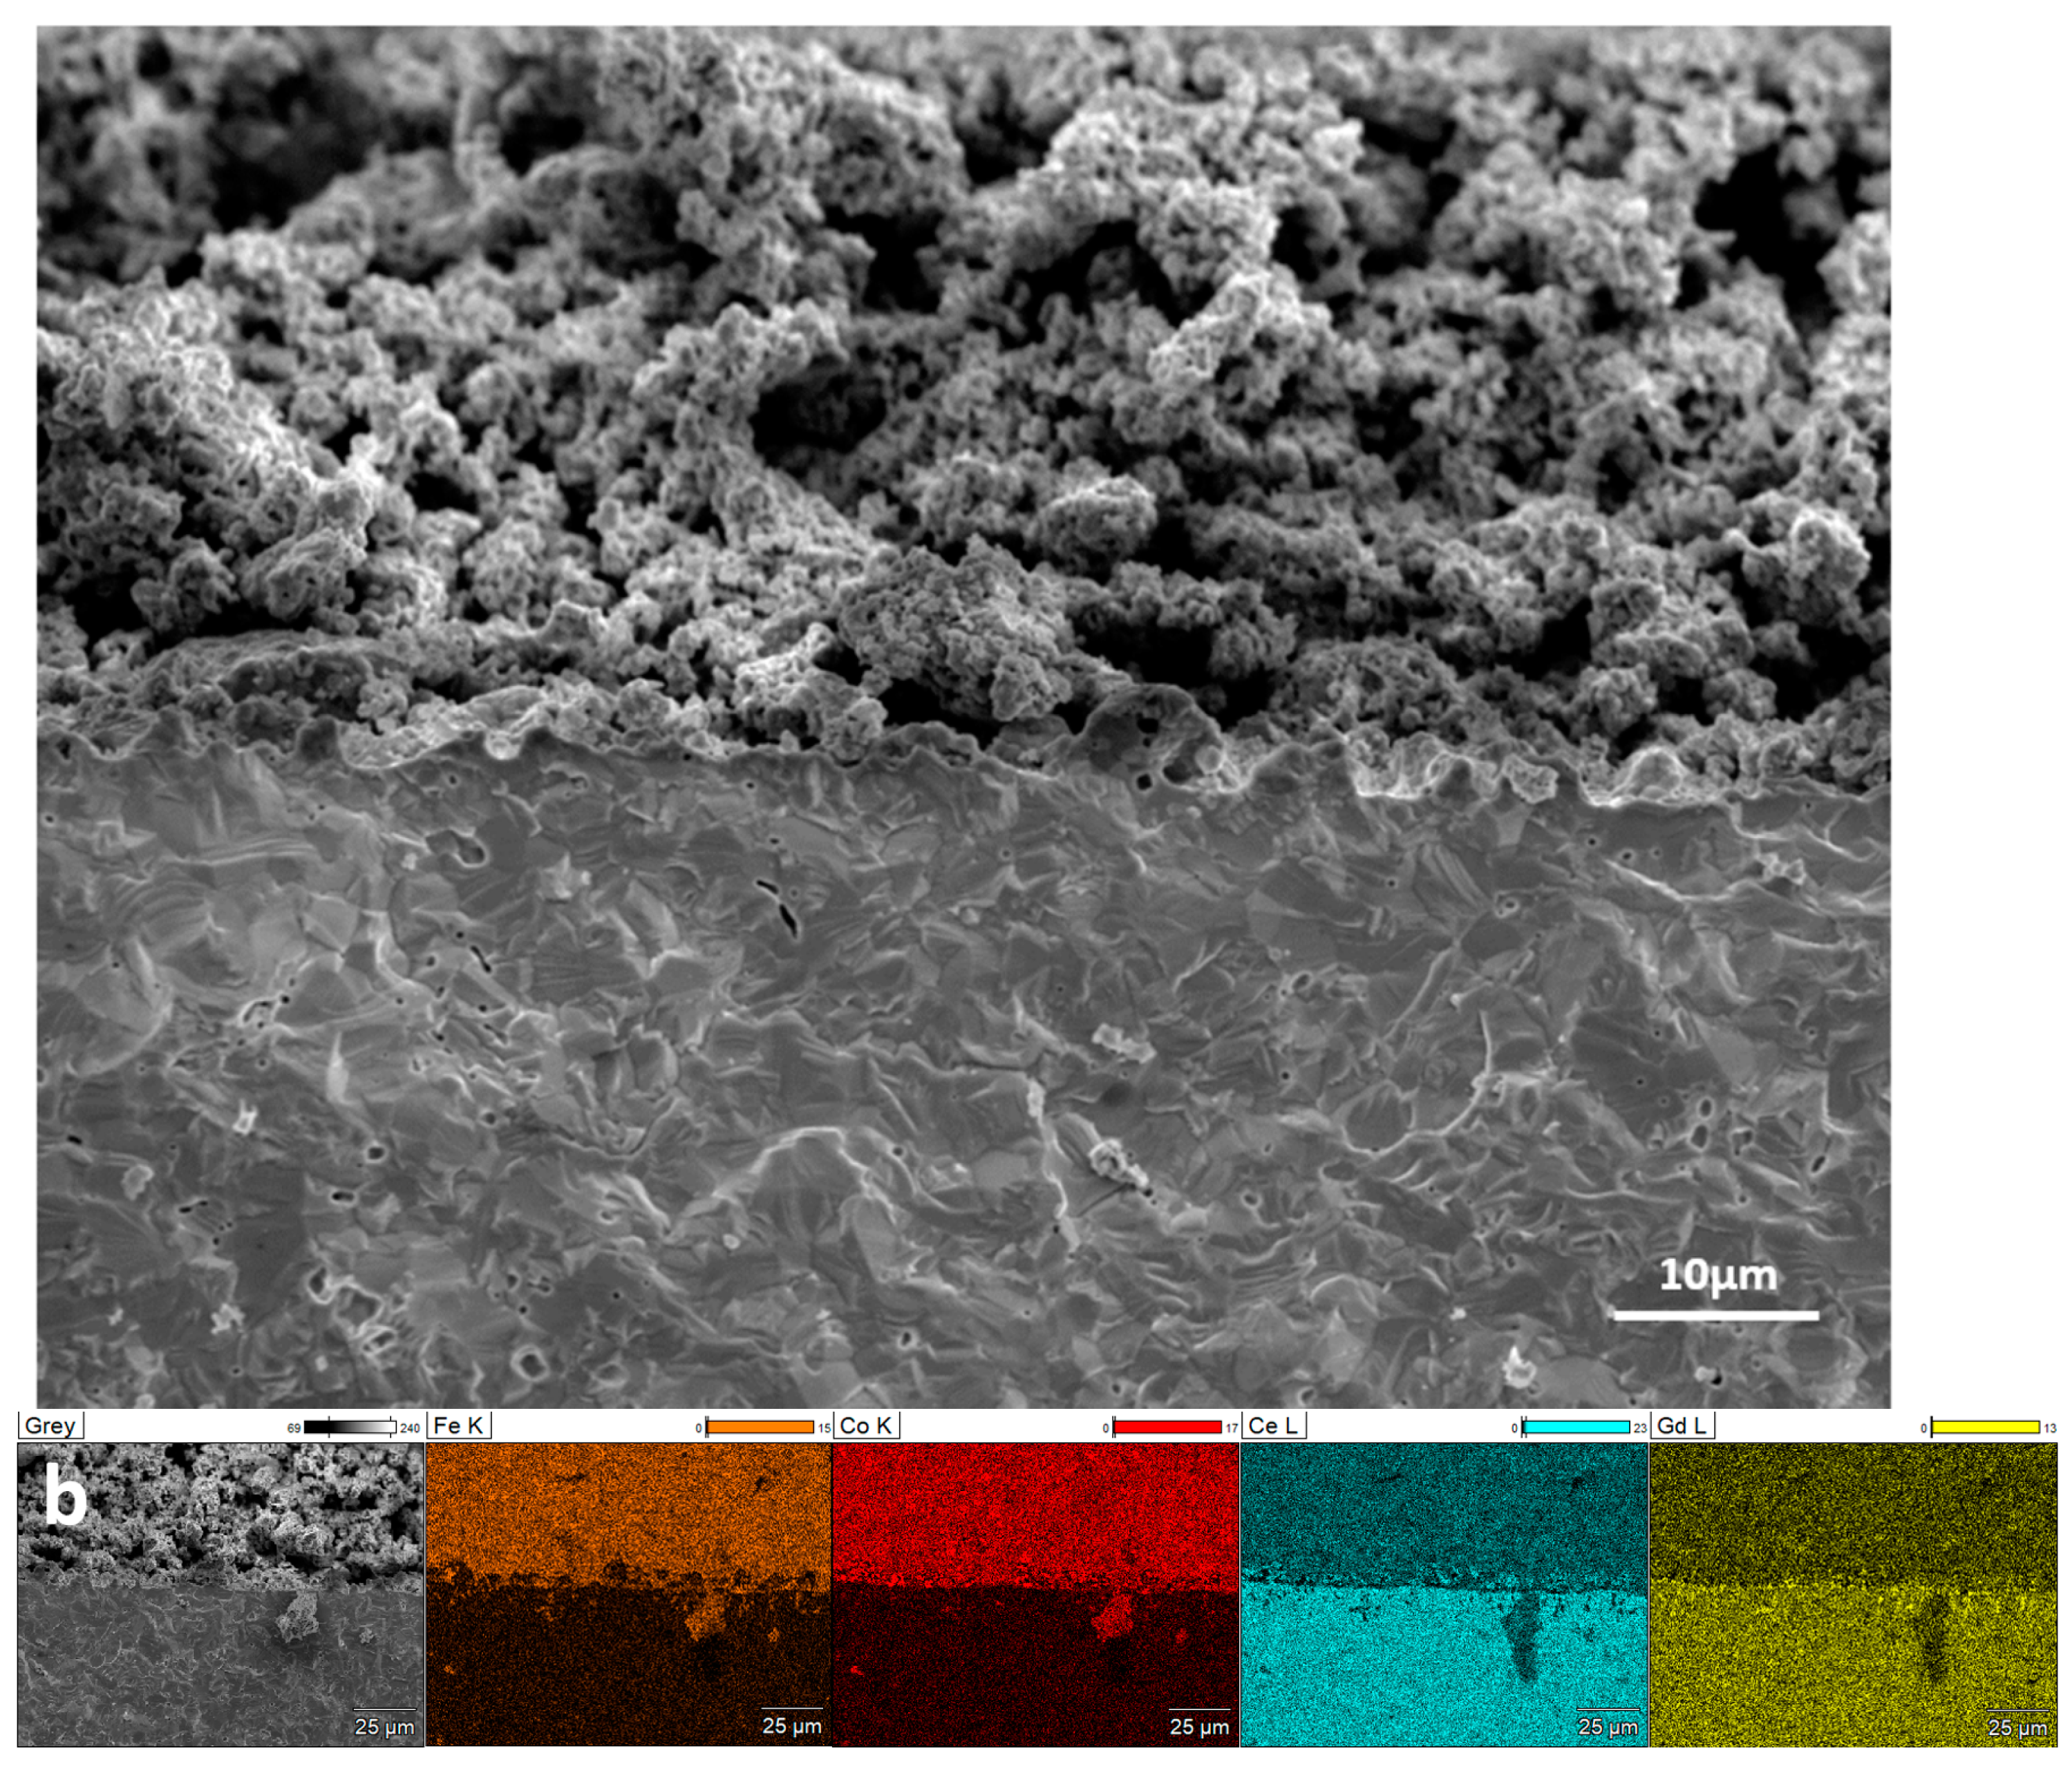
3.5. Analysis of Morphology and (EDX/EDS)
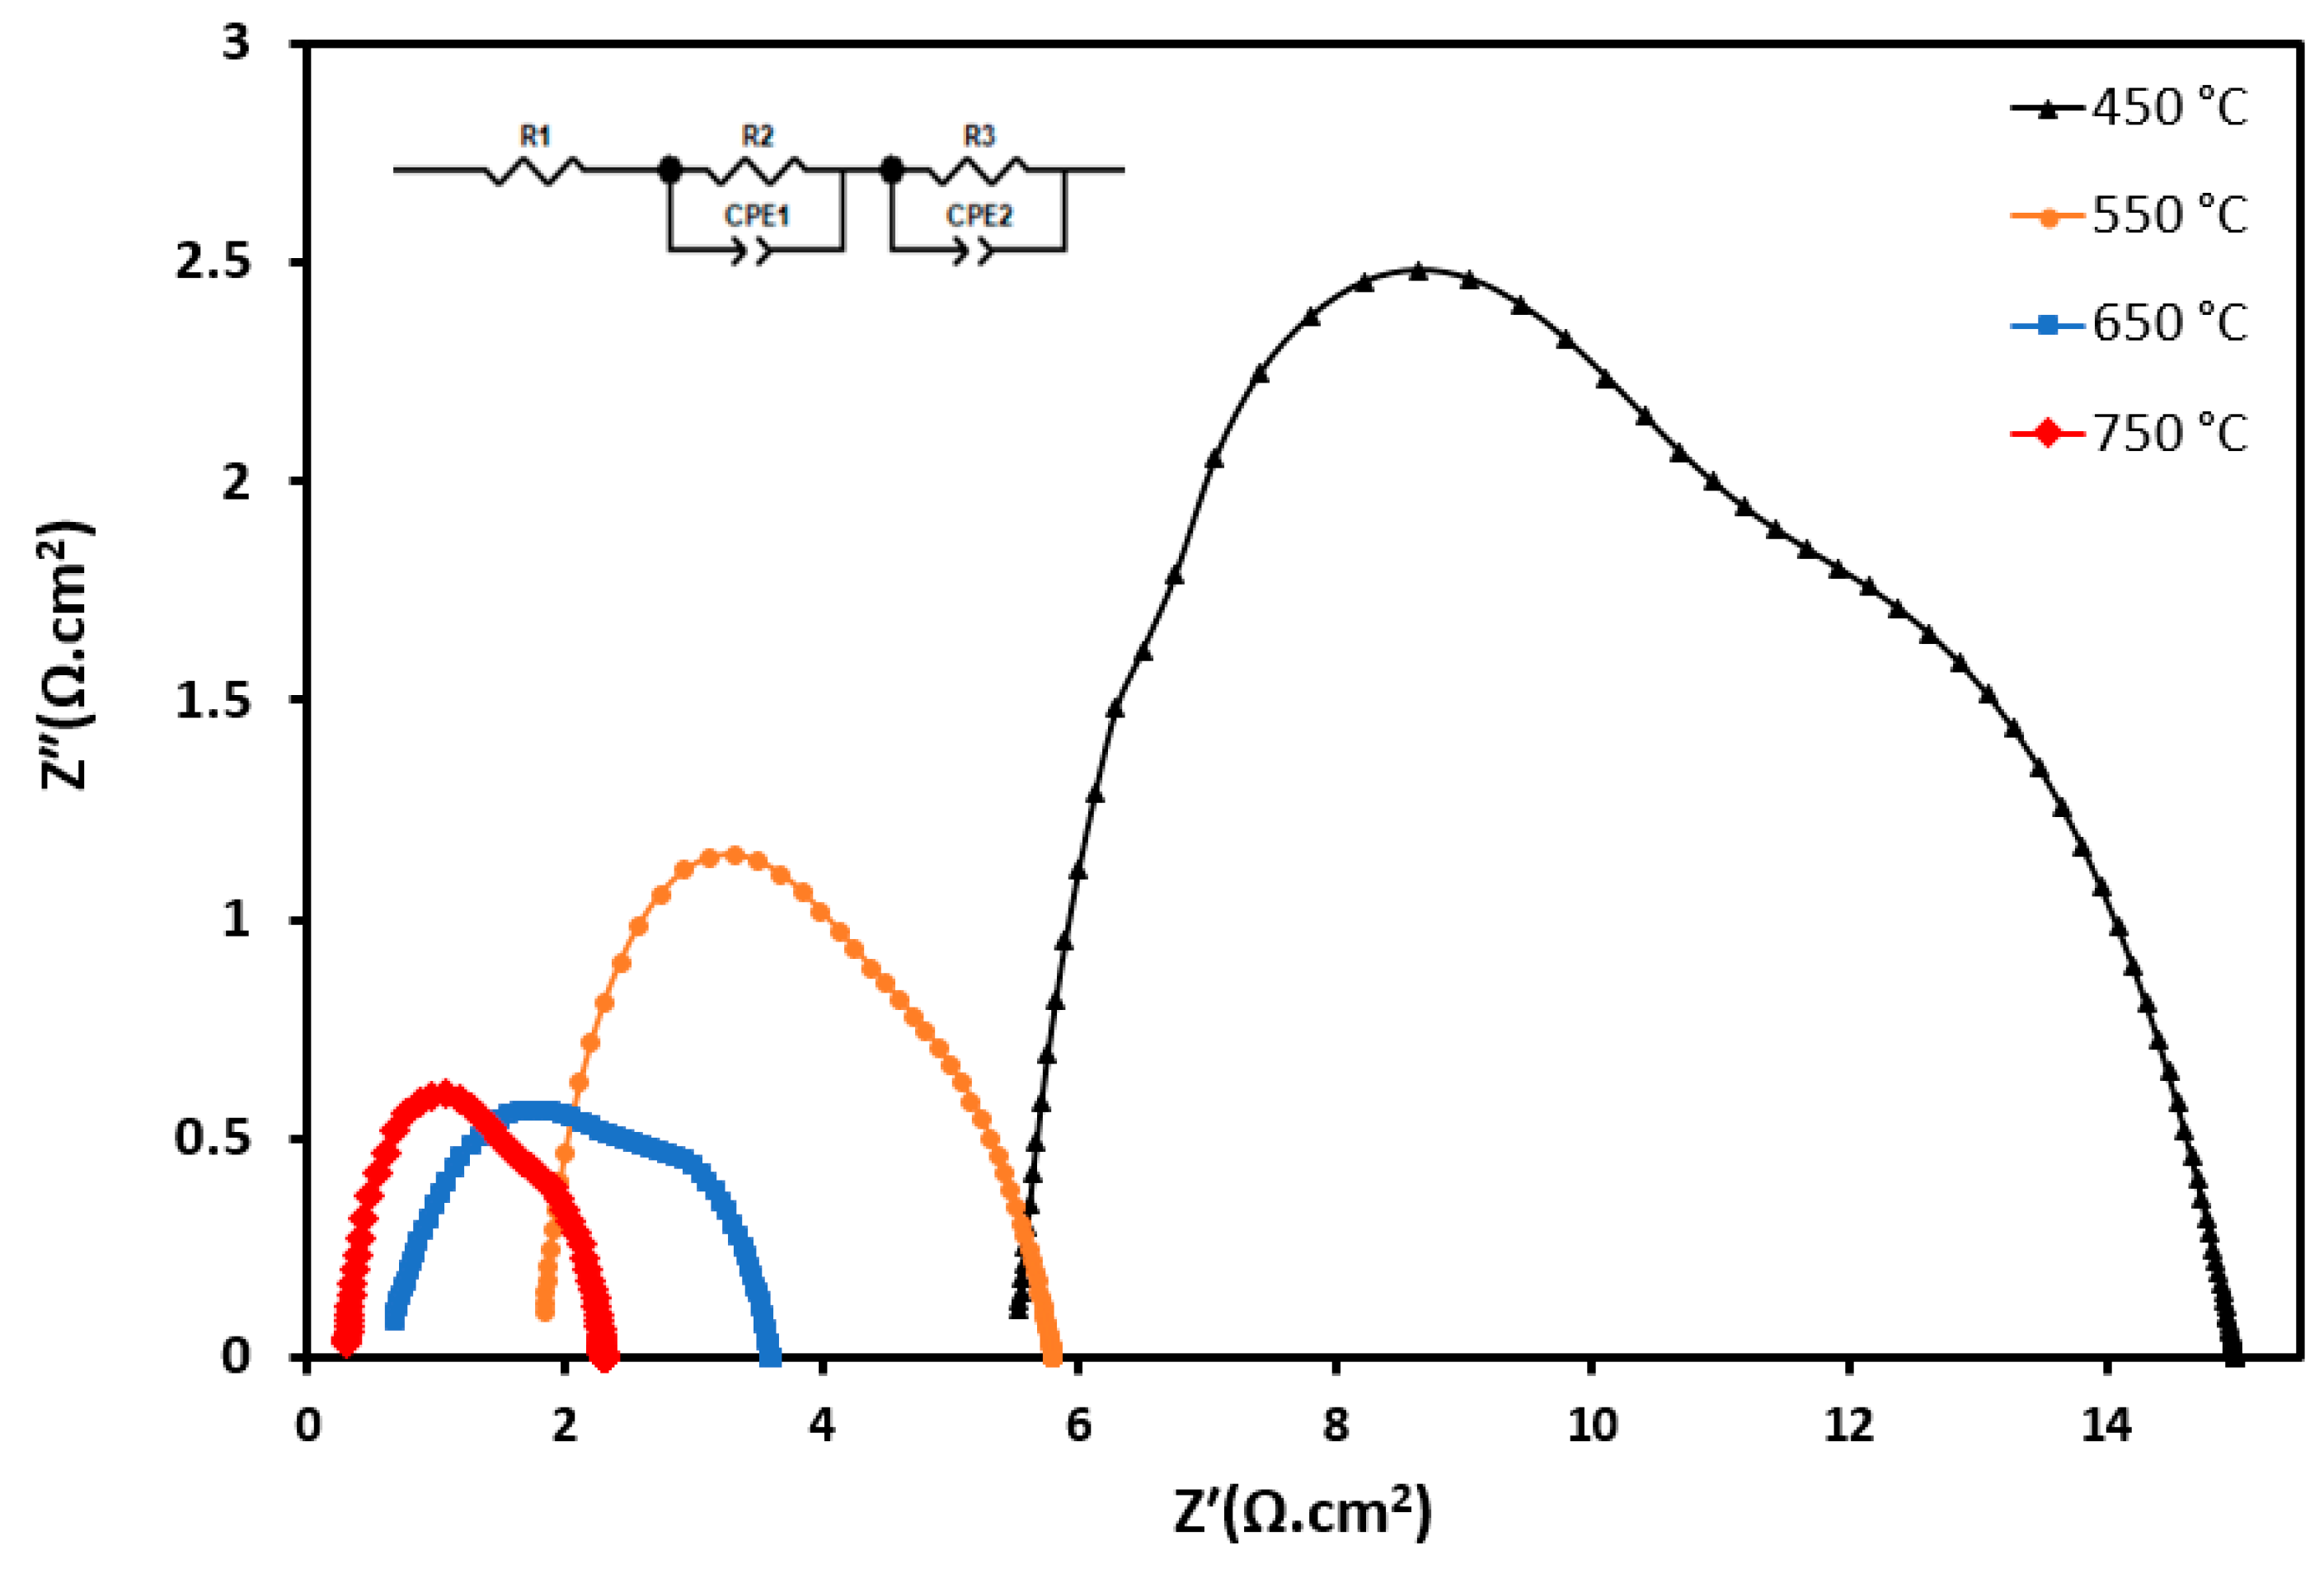
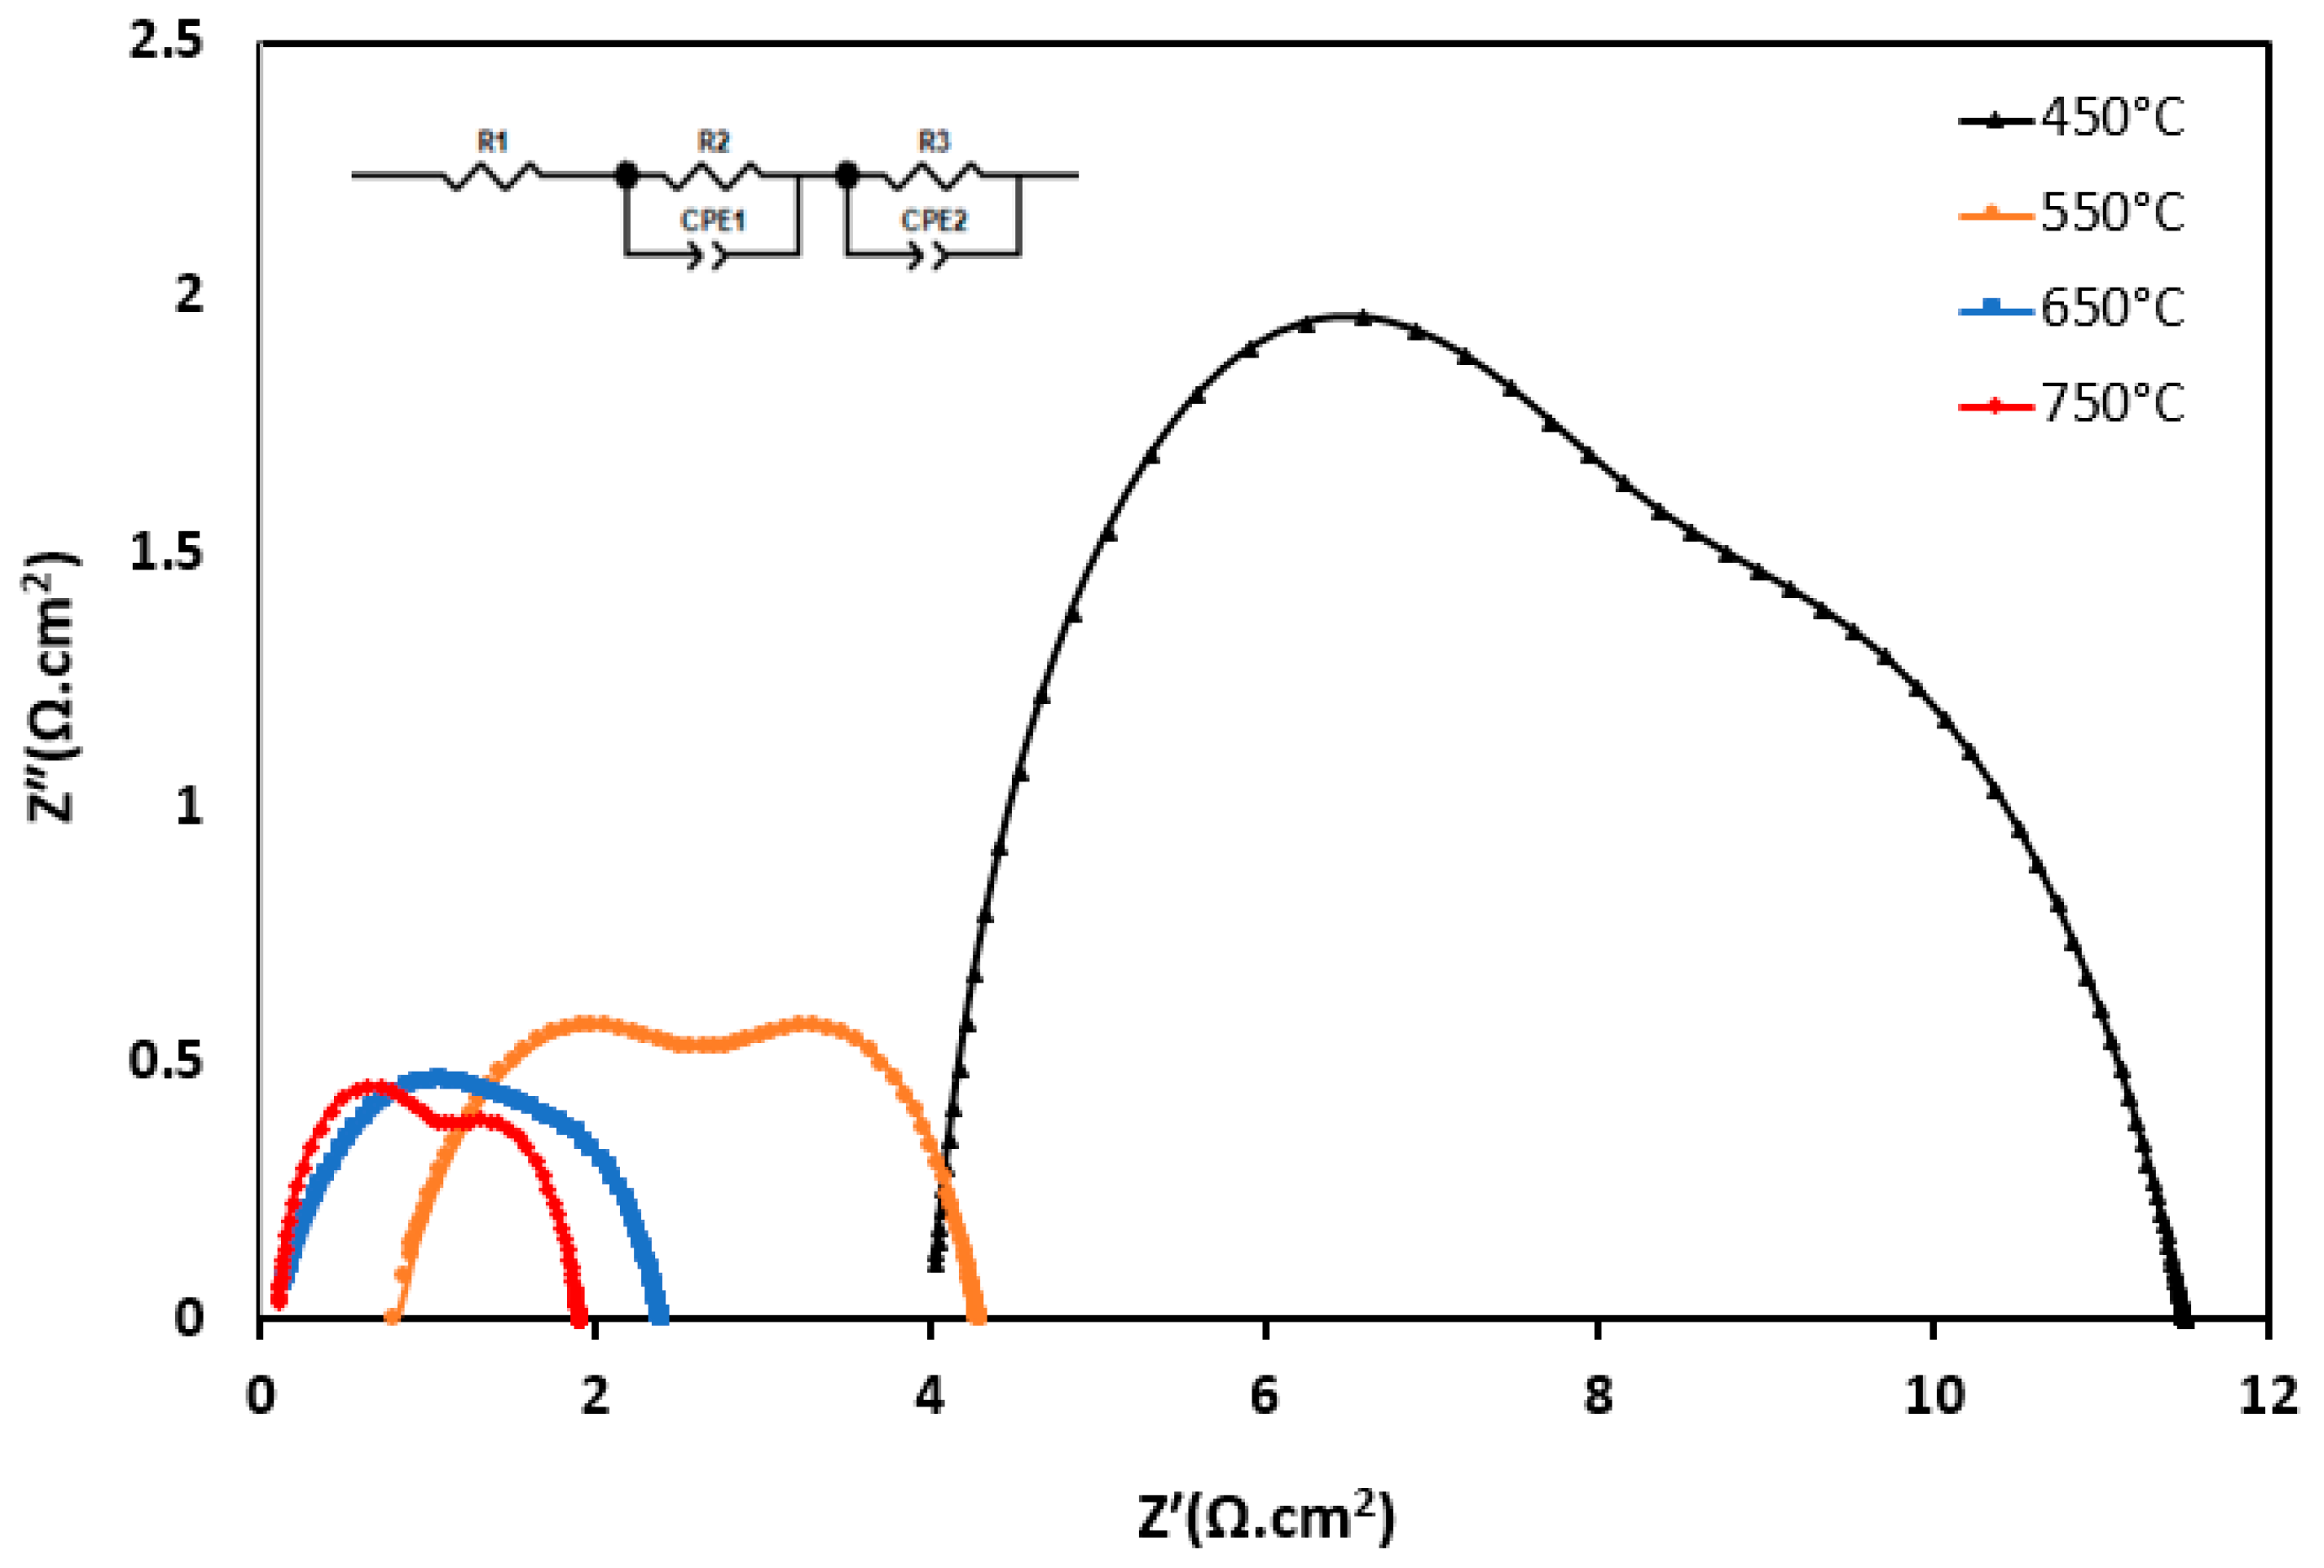
3.6. Electrical Conductivity
4. Conclusions
Author Contributions
Funding
Institutional Review Board Statement
Informed Consent Statement
Data Availability Statement
Acknowledgments
Conflicts of Interest
References
- Williams, M.C.; Strakey, J.; Sudoval, W.U.S. DOE fossil energy fuel cells program. J. Power Sources 2006, 159, 1241–1247. [Google Scholar] [CrossRef]
- Singhal, S.C.; Kendall, K. High-Temperature Solid Oxide Fuel Cells: Fundamentals, Design and Applications; Elsevier: Amsterdam, The Netherlands, 1985. [Google Scholar]
- Zhao, F.; Virkar, A.V. Dependence of polarization in anode-supported solid oxide fuel cells on various cell parameters. J. Power Sources 2005, 141, 79–95. [Google Scholar] [CrossRef]
- Zakaria, Z.; Abu Hassan, S.H.; Shaari, N.; Yahaya, A.Z.; Boon Kar, Y. A review on recent status and challenges of yttria stabilized zirconia modification to lowering the temperature of solid oxide fuel cells operation. Int. J. Energy Res. 2020, 44, 631–650. [Google Scholar] [CrossRef]
- Rabuni, M.F.; Li, T.; Othman, M.H.; Adnan, F.H.; Li, K. Progress in Solid Oxide Fuel Cells with Hydrocarbon Fuels. Energies 2023, 16, 6404. [Google Scholar] [CrossRef]
- Fan, L.; Zhu, B.; Su, P.-C.; He, C. Nanomaterials and technologies for low temperature solid oxide fuel cells: Recent advances, challenges and opportunities. Nano Energy 2018, 45, 148–176. [Google Scholar] [CrossRef]
- Fabbri, E.; Bi, L.; Pergolesi, D.; Traversa, E. Towards the next generation of solid oxide fuel cells operating below 600 °C with chemically stable proton—Conducting electrolytes. Adv. Mater. 2012, 24, 195–208. [Google Scholar] [CrossRef]
- Sengodan, S.; Lan, R.; Humphreys, J.; Du, D.; Xu, W.; Wang, H.; Tao, S. Advances in reforming and partial oxidation of hydrocarbons for hydrogen production and fuel cell applications. Renew. Sustain. Energy Rev. 2018, 82, 761–780. [Google Scholar] [CrossRef]
- Xu, Q.; Guo, Z.; Xia, L.; He, Q.; Li, Z.; Temitope Bello, I.; Zheng, K.; Ni, M. A comprehensive review of solid oxide fuel cells operating on various promising alternative fuels. Energy Convers. Manag. 2022, 253, 115175. [Google Scholar] [CrossRef]
- Shri Prakash, B.; Senthil Kumar, S.; Aruna, S.T. Properties and development of Ni/YSZ as an anode material in solid oxide fuel cell: A review. Renew. Sustain. Energy Rev. 2014, 36, 149–179. [Google Scholar] [CrossRef]
- Geofrey Sahini, M.; Daud Lupyana, S. Perspective and control of cation interdiffusion and interface reactions in solid oxide fuel cells (SOFCs). Mater. Sci. Eng. B 2023, 292, 116415. [Google Scholar] [CrossRef]
- An, W.; Gatewood, D.; Dunlap, B.; Turner, C.H. Catalytic activity of bimetallic nickel alloys for solid-oxide fuel cell anode reactions from density-functional theory. J. Power Sources 2011, 196, 4724–4728. [Google Scholar] [CrossRef]
- Chen, K.; Jiang, S.P. Degradation and durability of electrodes of solid oxide fuel cells. Mater. High Temp. Fuel Cells 2013, 245–307. [Google Scholar] [CrossRef]
- Lanzini, A.; Ferrero, D.; Papurello, D.; Santarelli, M. Reporting Degradation from Different Fuel Contaminants in Ni-anode SOFCs. Fuel Cells 2017, 17, 423–433. [Google Scholar] [CrossRef]
- Wongsawatgul, N.; Chaianansutcharit, S.; Yamamoto, K.; Nanko, M.; Sato, K. Cobalt alloying effect on improvement of Ni/YSZ anode-supported solid oxide fuel cell operating with dry methane. Mater. Trans. 2021, 62, 1541–1548. [Google Scholar] [CrossRef]
- Mo, B.; Rix, J.G.; Pal, U.; Basu, S.N.; Gopalan, S. Exploring the Role of Humidity, Temperature, and Mixed Ionic and Electronic Conductivity on SOFC Anode Electrocatalysis. JOM 2021, 73, 2771–2780. [Google Scholar] [CrossRef]
- Xu, C.; Sun, W.; Ren, R.; Yang, X.; Ma, M.; Qiao, J.; Wang, Z.; Zhen, S.; Sun, K. A highly active and carbon-tolerant anode decorated with in situ grown cobalt nano-catalyst for intermediate-temperature solid oxide fuel cells. Appl. Catal. B Environ. 2021, 282, 119553. [Google Scholar] [CrossRef]
- Matsumoto, K.; Tachikawa, Y.; Lyth, S.M.; Matsuda, J.; Sasaki, K. Performance and durability of Ni–Co alloy cermet anodes for solid oxide fuel cells. Int. J. Hydrogen Energy 2022, 47, 29441–29455. [Google Scholar] [CrossRef]
- Wang, M.; Li, N.; Wang, Z.; Chen, C.; Zhan, Z. Electrochemical performance and redox stability of solid oxide fuel cells supported on dual-layered anodes of Ni-YSZ cermet and Ni–Fe alloy. Int. J. Hydrogen Energy 2022, 47, 5453–5461. [Google Scholar] [CrossRef]
- Yan, J.; Enoki, M.; Matsumoto, H.; Ishihara, T. Nanoporous Ni–Fe bimetallic plates for nonfragile, reliable SOFCs. Electrochem. Solid-State Lett. 2007, 10, B139. [Google Scholar] [CrossRef]
- Ni, C.; Zhou, J.; Zhang, Z.; Li, S.; Ni, J.; Wu, K.; Irvine, J.T. Iron-based electrode materials for solid oxide fuel cells and electrolysers. Energy Environ. Sci. 2021, 14, 6287–6319. [Google Scholar] [CrossRef]
- Kalyk, F.; Abakevičienė, B. Synthesis and evaporation of gadolinium-doped ceria electrolyte for IT-SOFC applications. In Proceedings of the NBCM 2020: International Conference on Nanostructured Bioceramic Materials, Vilnius, Lithuania, 1–3 December 2020; Vilnius University: Vilnius, Lithuania, 2020. [Google Scholar]
- Nenning, A.; Bischof, C.; Fleig, J.; Bram, M.; Opitz, A.K. The relation of microstructure, materials properties and impedance of SOFC electrodes: A case study of Ni/GDC anodes. Energies 2020, 13, 987. [Google Scholar] [CrossRef]
- Mo, B. Role of Mixed Ionic and Electronic Transport on Electrocatalytic Activity of Infiltrated Nanoparticles in Solid Oxide Fuel Cell Cermet Electrodes. Ph.D. Thesis, Boston University, Boston, MA, USA, 2021. [Google Scholar]
- Monshi, A.; Foroughi, M.R.; Monshi, M. Modified Scherrer Equation to Estimate More Accurately Nano-Crystallite Size Using XRD. World J. Nano Sci. Eng. 2012, 2, 154–160. [Google Scholar] [CrossRef]
- Meisuria, S.; Unal, I.; Choolaei, M.; Ramirez Reina, T.; Horri, B. Synthesis and Characterisation of Nanocrystalline Ni1-xCoxO-GDC as Methane Reforming Catalyst for SOFCs. Ceram. Int. 2018, 44, 6841–6860. [Google Scholar] [CrossRef]
- Mather, G.C.; Figueiredo, F.M.; Jurado, J.R.; Frade, J.R. Electrochemical behaviour of Ni-cermet anodes containing a proton-conducting ceramic phase on YSZ substrate. Electrochim. Acta 2004, 49, 2601–2612. [Google Scholar] [CrossRef]
- Skarlis, S.A.; Nicolle, A.; Berthout, D.; Dujardin, C.; Granger, P. Combined experimental and kinetic modeling approaches of ammonium nitrate thermal decomposition. Thermochim. Acta 2014, 584, 58–66. [Google Scholar] [CrossRef]
- Sameeh, M.; Abdel-Fattah Omran, M.; Bayoumy, W.A.; El-asawi, T.; Elbellihi, A.A. Thermal Decomposition of Metal Tartrates through the Prepration of Nano Cobalt Ferrite. Basic Environ. Sci. 2014, 1, 46–64. [Google Scholar] [CrossRef]
- Newkirk, A.E. Thermogravimetric measurements. Anal. Chem. 1960, 32, 1558–1563. [Google Scholar] [CrossRef]
- Koike, K.; Furukawa, T. Evidence for Ferromagnetic Order at the FeO(111) Surface. Phys. Rev. Lett. 1996, 77, 3921–3924. [Google Scholar] [CrossRef]
- Chen, D.; Green, A.; Dollimore, D. DSC: The importance of baseline calibration. Thermochim. Acta 1996, 284, 429–433. [Google Scholar] [CrossRef]
- Joseph, S.; Joshi, H.; Joshi, M.J. Infrared spectroscopic and thermal studies of gel grown spherulitic crystals of iron tartrate. Cryst. Res. Technol. 1997, 32, 339–346. [Google Scholar] [CrossRef]
- Arabacı, A.; Öksüzömer, M.F. Preparation and characterization of 10mol% Gd doped CeO2 (GDC) electrolyte for SOFC applications. Ceram. Int. 2012, 38, 6509–6515. [Google Scholar] [CrossRef]
- Jethva, H.O. FTIR Spectroscopic and XRD analysis of gel-grown, cadmium levo-tartrate crystals. Int. J. Appl. Res. 2015, 1, 1–3. [Google Scholar]
- Shah, A.; Patel, I. FTIR and XRD study of barium tartrate (BaC4H4O6) crystals grown by gel method. AIP Conf. Proc. 2010, 2010, 192–193. [Google Scholar]
- Safi, R.; Ghasemi, A.; Shoja-Razavi, R.; Tavousi, M. The role of pH on the particle size and magnetic consequence of cobalt ferrite. J. Magn. Magn. Mater. 2015, 396, 288–294. [Google Scholar] [CrossRef]
- Zarkov, A.; Stanulis, A.; Salkus, T.; Kezionis, A.; Jasulaitiene, V.; Ramanauskas, R.; Tautkus, S.; Kareiva, A. Synthesis of nanocrystalline gadolinium doped ceria via sol–gel combustion and sol–gel synthesis routes. Ceram. Int. 2016, 42, 3972–3988. [Google Scholar] [CrossRef]
- Theoret, A.; Sandorfy, C. Infrared spectra and crystalline phase transitions of ammonium nitrate. Can. J. Chem. 1964, 42, 57–62. [Google Scholar] [CrossRef]
- Wu, H.B.; Chan, M.N.; Chan, C.K. FTIR characterization of polymorphic transformation of ammonium nitrate. Aerosol Sci. Technol. 2007, 41, 581–588. [Google Scholar] [CrossRef]
- Gerakines, P.; Schutte, W.; Greenberg, J.; van Dishoeck, E.F. The infrared band strengths of H2O, CO and CO2 in laboratory simulations of astrophysical ice mixtures. Astron. Astrophys. 1995; 296, 810–818. [Google Scholar] [CrossRef]
- Rocha, R.A.; Muccillo, E.N.S. Physical and chemical properties of nanosized powders of gadolinia-doped ceria prepared by the cation complexation technique. Mater. Res. Bull. 2003, 38, 1979–1986. [Google Scholar] [CrossRef]
- Denton, A.R.; Ashcroft, N.W. Vegard’s law. Phys. Rev. A 1991, 43, 3161–3164. [Google Scholar] [CrossRef]
- Ci, L.; Wei, B.; Xu, C.; Liang, J.; Wu, D.; Xie, S.; Zhou, W.; Li, Y.; Liu, Z.; Tang, D. Crystallization behavior of the amorphous carbon nanotubes prepared by the CVD method. J. Cryst. Growth 2001, 233, 823–828. [Google Scholar] [CrossRef]
- STANDARDS, N.B.O. Standard X-ray Diffraction Powder Patterns. 1969, NBS monogragh 25-Section7. Available online: https://nvlpubs.nist.gov/nistpubs/Legacy/MONO/nbsmonograph25-7.pdf (accessed on 30 July 2024).
- Hou, Y.; Xu, Z.; Sun, S. Controlled synthesis and chemical conversions of FeO nanoparticles. Angew. Chem. 2007, 119, 6445–6448. [Google Scholar] [CrossRef]
- Deori, K.; Deka, S. Morphology oriented surfactant dependent CoO and reaction time dependent Co 3 O 4 nanocrystals from single synthesis method and their optical and magnetic properties. CrystEngComm 2013, 15, 8465–8474. [Google Scholar] [CrossRef]
- Tan, J.; Zhang, W.; Lv, Y.-H.; Xia, A.-L. Facile preparation of Mn-doped CeO2 Submicrorods by composite-hydroxide-salt-mediated approach and their magnetic property. Mater. Res. 2013, 16, 689–694. [Google Scholar] [CrossRef]
- Majeed, S.; Shivashankar, S. Rapid, microwave-assisted synthesis of Gd2O3 and Eu:Gd2O3 nanocrystals: Characterization, magnetic, optical and biological studies. J. Mater. Chem. B 2014, 2, 5585–5593. [Google Scholar] [CrossRef]
- Praserthdam, P.; Silveston, P.L.; Mekasuwandumrong, O.; Pavarajarn, V.; Phungphadung, J.; Somrang, P. A new correlation for the effects of the crystallite size and calcination temperature on the single metal oxides and spinel oxides nanocrystal. Cryst. Growth Des. 2004, 4, 39–43. [Google Scholar] [CrossRef]
- Guo, S.; Liu, Y.; Murphy, E.; Ly, A.; Xu, M.; Matanovic, I.; Pan, X.; Atanassov, P. Robust palladium hydride catalyst for electrocatalytic formate formation with high CO tolerance. Appl. Catal. B Environ. 2022, 316, 121659. [Google Scholar] [CrossRef]
- Sun, Y.; Wang, C.; Wen, Y.; Zhu, K.; Zhao, J. Lattice contraction and magnetic and electronic transport properties of Mn3Zn1-xGexN. Appl. Phys. Lett. 2007, 91, 231913. [Google Scholar] [CrossRef]
- Kharton, V.V.; Figueiredo, F.M.; Navarro, L.; Naumovich, E.N.; Kovalevsky, A.V.; Yaremchenko, A.A.; Viskup, A.P.; Carneiro, A.; Marques, F.M.B.; Frade, J.R. Ceria-based materials for solid oxide fuel cells. J. Mater. Sci. 2001, 36, 1105–1117. [Google Scholar] [CrossRef]
- Keramidas, V.G.; White, W.B. Raman spectra of oxides with the fluorite structure. J. Chem. Phys. 1973, 59, 1561–1562. [Google Scholar] [CrossRef]
- Popović, Z.; Dohčević-Mitrović, Z.; Šćepanović, M.; Grujić-Brojčin, M.; Aškrabić, S. Raman scattering on nanomaterials and nanostructures. Ann. Der Phys. 2011, 523, 62–74. [Google Scholar] [CrossRef]
- Ghaemi, N.; Slade, R.C.T.; Amini Horri, B. A benzoate coprecipitation route for synthesizing nanocrystalline GDC powder with lowered sintering temperature. Ceram. Int. 2021, 47, 20009–20018. [Google Scholar] [CrossRef]
- Choolaei, M.; Cai, Q.; Slade, R.C.T.; Amini Horri, B. Nanocrystalline gadolinium-doped ceria (GDC) for SOFCs by an environmentally-friendly single step method. Ceram. Int. 2018, 44, 13286–13292. [Google Scholar] [CrossRef]
- Gonzalez, J.P. Synthesis and Characterization of Iron Oxide Thin Films for Use in Electrical Devices. Master’s Thesis, San Diego State University, San Deigo, CA, USA, 2013. [Google Scholar]
- Gunawardana, B.; Singhal, N.; Swedlund, P. Degradation of chlorinated phenols by zero valent iron and bimetals of iron: A review. Environ. Eng. Res. 2011, 16, 187–203. [Google Scholar] [CrossRef]
- Li, Y.; Qiu, W.; Qin, F.; Fang, H.; Hadjiev, V.G.; Litvinov, D.; Bao, J. Identification of cobalt oxides with Raman scattering and Fourier transform infrared spectroscopy. J. Phys. Chem. C 2016, 120, 4511–4516. [Google Scholar] [CrossRef]
- Horri, B.A.; Selomulya, C.; Wang, H. Electrochemical characteristics and performance of anode-supported SOFCs fabricated using carbon microspheres as a pore-former. Int. J. Hydrogen Energy 2012, 37, 19045–19054. [Google Scholar] [CrossRef]
- Banerji, A.; Grover, V.; Sathe, V.; Deb, S.K.; Tyagi, A.K. CeO2–Gd2O3 system: Unraveling of microscopic features by Raman spectroscopy. Solid State Commun. 2009, 149, 1689–1692. [Google Scholar] [CrossRef]
- García-Murillo, A.; Le Luyer, C.; Garapon, C.; Dujardin, C.; Bernstein, E.; Pedrini, C.; Mugnier, J. Optical properties of europium-doped Gd2O3 waveguiding thin films prepared by the sol–gel method. Opt. Mater. 2002, 19, 161–168. [Google Scholar] [CrossRef]
- Matta, J.; Courcot, D.; Abi-Aad, E.; Aboukais, A. Identification of vanadium oxide species and trapped single electrons in interaction with the CeVO4 phase in vanadium− cerium oxide systems. 51V MAS NMR, EPR, Raman, and thermal analysis studies. Chem. Mater. 2002, 14, 4118–4125. [Google Scholar] [CrossRef]
- De Faria, D.L.A.; Venâncio Silva, S.; de Oliveira, M.T. Raman microspectroscopy of some iron oxides and oxyhydroxides. J. Raman Spectrosc. 1997, 28, 873–878. [Google Scholar] [CrossRef]
- Choi, H.; Jung, Y.M.; Kim, S. A Study of the Mechanism of the Electrochemical Reaction of Lithium with CoO by Two-Dimensional Soft X-ray Absorption Spectroscopy (2D XAS), 2D Raman, and 2D Heterospectral XAS−Raman Correlation Analysis. J. Phys. Chem. B 2003, 107, 5806–5811. [Google Scholar] [CrossRef]
- Lv, H.; Tu, H.-y.; Zhao, B.-y.; Wu, Y.-j.; Hu, K.-a. Synthesis and electrochemical behavior of Ce1−xFexO2−δ as a possible SOFC anode materials. Solid State Ion. 2007, 177, 3467–3472. [Google Scholar] [CrossRef]
- Fu, C.; Chan, S.H.; Liu, Q.; Ge, X.; Pasciak, G. Fabrication and evaluation of Ni-GDC composite anode prepared by aqueous-based tape casting method for low-temperature solid oxide fuel cell. Int. J. Hydrogen Energy 2010, 35, 301–307. [Google Scholar] [CrossRef]
- Zhao, J.; Xu, X.; Zhou, W.; Zhu, Z.; Guo, Y.; Zhong, S. A Novel Method to Purposely Modify the Anode/Electrolyte Interface in Solid Oxide Fuel Cells. ChemistrySelect 2019, 4, 13835–13840. [Google Scholar] [CrossRef]


| Sample ID | Crystal Size (nm) | |||
|---|---|---|---|---|
| Before Calcination | After Calcination | |||
| 400 °C | 600 °C | 700 °C | ||
| S1 | 81.15 | 4.303 | 7.097 | - |
| S2 | 70.87 | 4.883 | 5.307 | 10.85 |
| S3 | 79.82 | 6.269 | 7.838 | - |
| Sample ID | Calcination Temperature (°C) | Theta (Degree) | Lattice Spacing, d (nm) | Miller Indices | Lattice Parameter (Å) | ||
|---|---|---|---|---|---|---|---|
| h | k | l | |||||
| S1 | 400 | 17.52 | 0.2560 | 1 | 1 | 1 | 4.434 |
| S2 | 400 | 18.07 | 0.2486 | 1 | 1 | 1 | 4.305 |
| S3 | 400 | 18.41 | 0.2441 | 1 | 1 | 1 | 4.228 |
| S1 | 600 | 17.75 | 0.2529 | 1 | 1 | 1 | 4.381 |
| S2 | 600 | 18.09 | 0.2483 | 1 | 1 | 1 | 4.300 |
| S3 | 600 | 18.36 | 0.2448 | 1 | 1 | 1 | 4.239 |
| S2 | 700 | 17.78 | 0.2524 | 1 | 1 | 1 | 4.372 |
| Ammonium Nitrate [45] | |
|---|---|
| h k l | 2θ (deg) |
| 1 0 0 | 17.9 |
| 0 1 1 | 22.4 |
| 1 1 0 | 24.3 |
| 1 1 1 | 28.9 |
| 0 2 0 | 32.9 |
| 1 0 2 | 36.1 |
| 1 1 2 | 39.9 |
| FeO [46] | CoO [47] | ||
| h k l | 2θ(deg) | h k l | 2θ(deg) |
| 1 1 1 | 36.2 | 1 1 1 | 36.5 |
| 2 0 0 | 42.0 | 2 0 0 | 42.5 |
| 2 2 0 | 61.1 | 2 2 0 | 61.6 |
| 2 2 2 | 76.5 | 2 2 2 | 77.7 |
| CeO2 [48] | Gd2O3 [49] | ||
| h k l | 2θ(deg) | h k l | 2θ(deg) |
| 1 1 1 | 28.6 | 1 1 1 | 28.3 |
| 2 0 0 | 33.1 | 2 0 0 | 32.9 |
| 2 2 0 | 47.5 | 2 2 0 | 47.3 |
| 2 2 2 | 56.4 | 2 2 2 | 56.1 |
| Sample ID | Calcination Temperature (°C) | Mean Crystalline Size (nm) | Lattice Parameter (nm) | Lattice Contraction (%) |
|---|---|---|---|---|
| S1 | 400 | 4.1 | 0.540 | 0.33 |
| 600 | 7.1 | 0.538 | 0.70 | |
| S2 | 400 | 3.6 | 0.531 | 1.99 |
| 600 | 4.6 | 0.533 | 1.62 | |
| 700 | 10.7 | 0.537 | 0.89 | |
| S3 | 400 | 4.5 | 0.526 | 2.92 |
| 600 | 6.3 | 0.526 | 2.92 |
| Element | Calcination Temperature (°C) for S2 | Cases | ||||
|---|---|---|---|---|---|---|
| 400 | 600 | 700 | Case1 Atom% | Case2 Atom% | Case3 Atom% | |
| Average Atom% | ||||||
| O-K | 49.9% | 53.9% | 43.8% | 54.5% | 61.4% | 59.3% |
| Fe-K | 19.8% | 17.6% | 20.6% | 17.7% | 15.0% | 15.8% |
| Co-K | 19.2% | 18.7% | 22.6% | 17.7% | 15.0% | 15.8% |
| Ce-L | 8.3% | 7.5% | 9.2% | 8.1% | 6.8% | 7.2% |
| Gd-L | 2.8% | 2.3% | 2.8% | 2.0% | 1.7% | 1.8% |
| Calcination Temperature (°C) | C-K | O-K | Al-K | P-K | Fe-K | Co-K | Cu-K | Ce-K | Gd-K |
|---|---|---|---|---|---|---|---|---|---|
| 400 | 32.6 | 35.3 | 0.2 | 0.2 | 13.2 | 12.8 | 0.6 | 3.8 | 1.2 |
| 600 | 26.1 | 39.3 | 0.4 | 0.1 | 13.7 | 15.4 | NA | 3.8 | 1.2 |
| 700 | 6.8 | 45.2 | 0.4 | NA | 19.2 | 20.8 | NA | 5.8 | 1.9 |
| Temperatures | Sample ID | Rs | RP1 | RP2 | Rpt | Area-Specific Resistance (ASR) (Ohm cm2) (RPt) |
|---|---|---|---|---|---|---|
| 450 °C | S2 | 5.53 | 7.37 | 4.56 | 5.967 | 1.49 |
| 550 °C | S2 | 1.83 | 2.72 | 2.27 | 4.49 | 0.63 |
| 650 °C | S2 | 0.66 | 1.84 | 1.22 | 1.53 | 0.38 |
| 750 °C | S2 | 0.31 | 1.29 | 1 | 1.15 | 0.29 |
| Temperatures | Sample ID | Rs | RP1 | RP2 | Rpt | Area-Specific Resistance (ASR) (Ohm cm) (RPt) |
|---|---|---|---|---|---|---|
| 450 °C | S5 | 4.03 | 4.92 | 4.02 | 4.47 | 1.12 |
| 550 °C | S5 | 0.81 | 2.18 | 1.65 | 1.92 | 0.48 |
| 650 °C | S5 | 0.15 | 0.91 | 0.60 | 0.75 | 0.19 |
| 750 °C | S5 | 0.12 | 0.84 | 0.49 | 0.67 | 0.17 |
Disclaimer/Publisher’s Note: The statements, opinions and data contained in all publications are solely those of the individual author(s) and contributor(s) and not of MDPI and/or the editor(s). MDPI and/or the editor(s) disclaim responsibility for any injury to people or property resulting from any ideas, methods, instructions or products referred to in the content. |
© 2024 by the authors. Licensee MDPI, Basel, Switzerland. This article is an open access article distributed under the terms and conditions of the Creative Commons Attribution (CC BY) license (https://creativecommons.org/licenses/by/4.0/).
Share and Cite
Quinlan, L.; Brooks, T.; Ghaemi, N.; Arellano-Garcia, H.; Irandoost, M.; Sharifianjazi, F.; Amini Horri, B. Synthesis and Characterisation of Nanocrystalline CoxFe1−xGDC Powders as a Functional Anode Material for the Solid Oxide Fuel Cell. Materials 2024, 17, 3864. https://doi.org/10.3390/ma17153864
Quinlan L, Brooks T, Ghaemi N, Arellano-Garcia H, Irandoost M, Sharifianjazi F, Amini Horri B. Synthesis and Characterisation of Nanocrystalline CoxFe1−xGDC Powders as a Functional Anode Material for the Solid Oxide Fuel Cell. Materials. 2024; 17(15):3864. https://doi.org/10.3390/ma17153864
Chicago/Turabian StyleQuinlan, Laura, Talia Brooks, Nasrin Ghaemi, Harvey Arellano-Garcia, Maryam Irandoost, Fariborz Sharifianjazi, and Bahman Amini Horri. 2024. "Synthesis and Characterisation of Nanocrystalline CoxFe1−xGDC Powders as a Functional Anode Material for the Solid Oxide Fuel Cell" Materials 17, no. 15: 3864. https://doi.org/10.3390/ma17153864