
Study on High-Ductility Geopolymer Concrete: The Influence of Oven Heat Curing Conditions on Mechanical Properties and Microstructural Development

Abstract
:1. Introduction
2. Materials and Methods
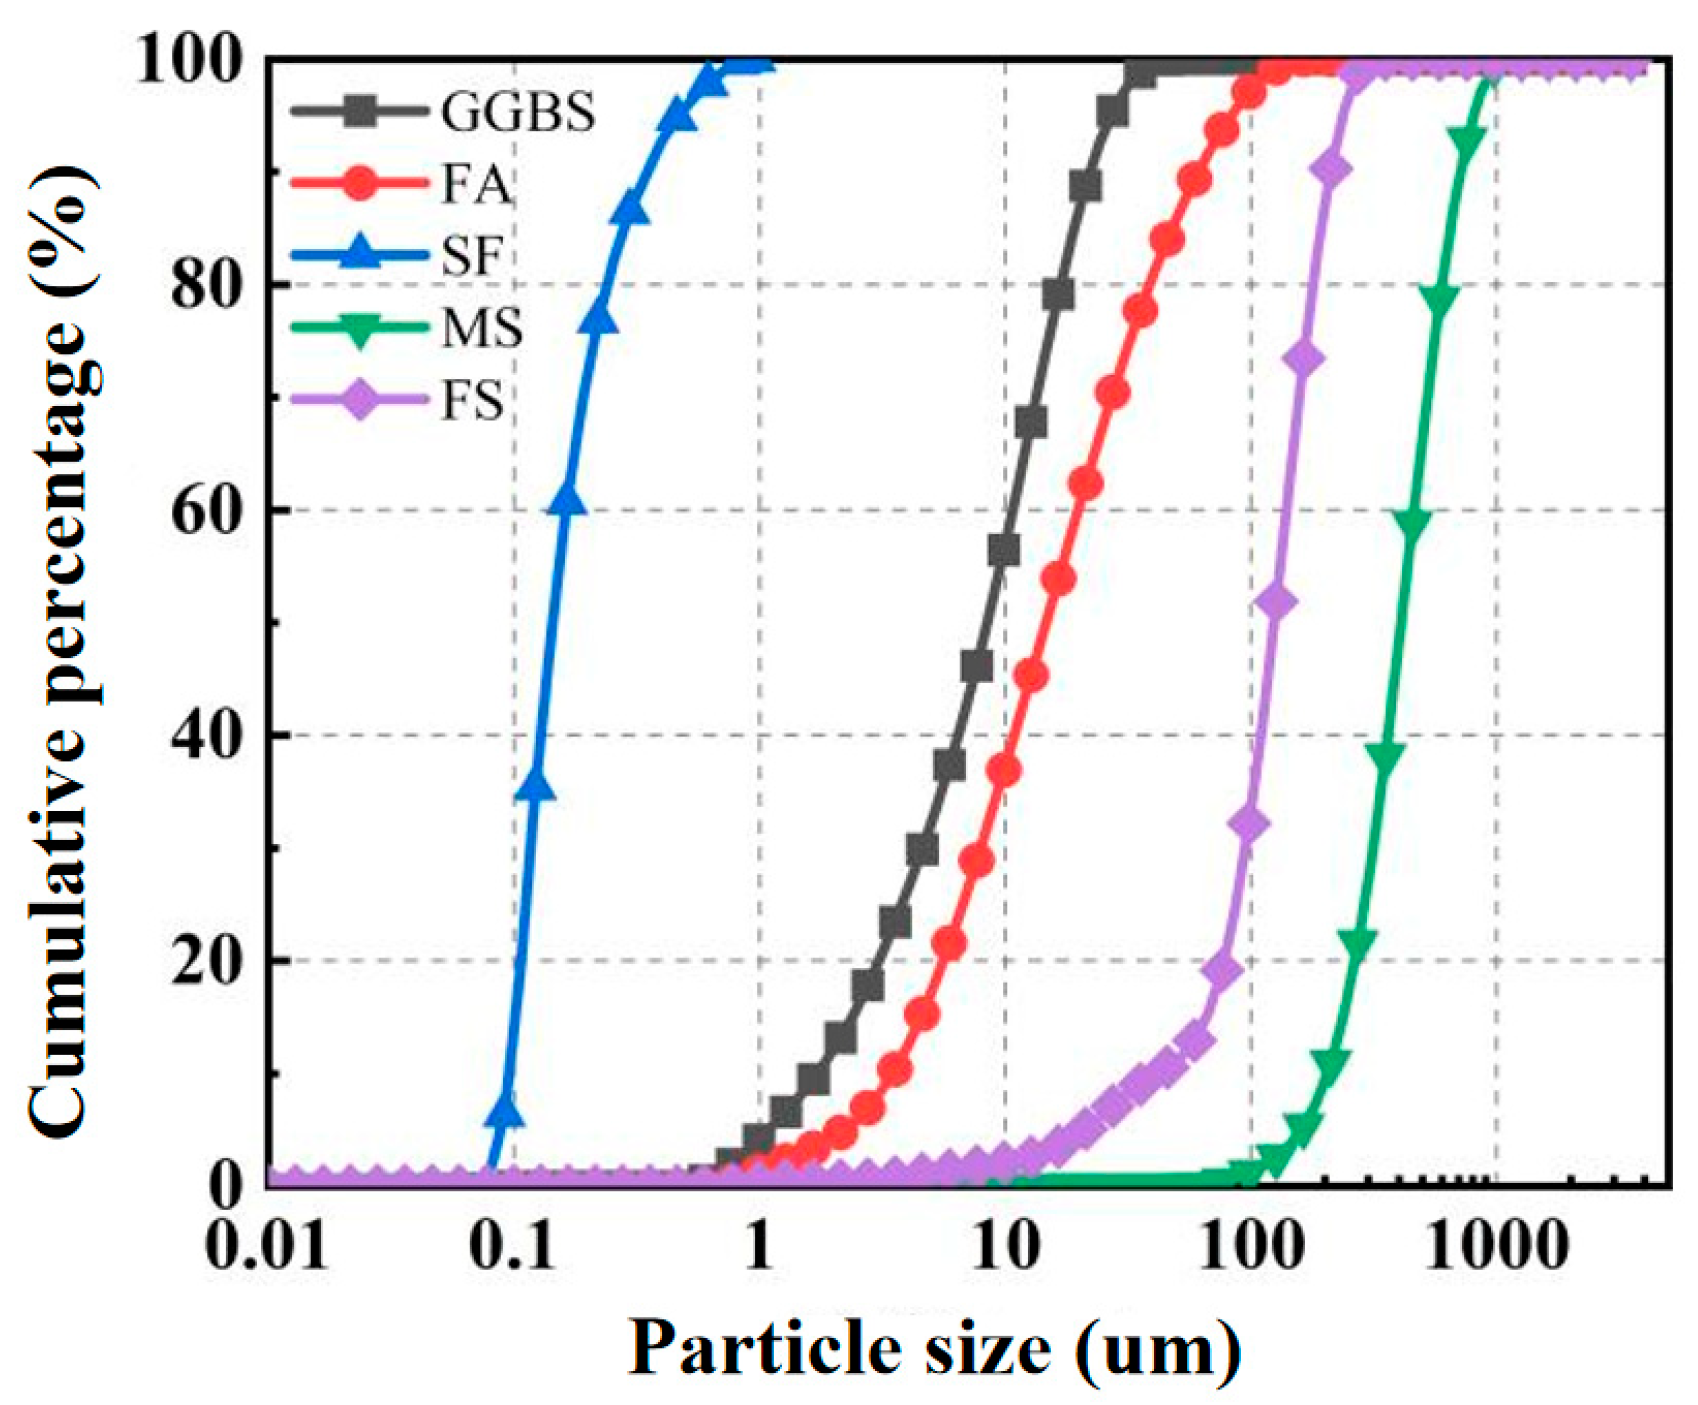
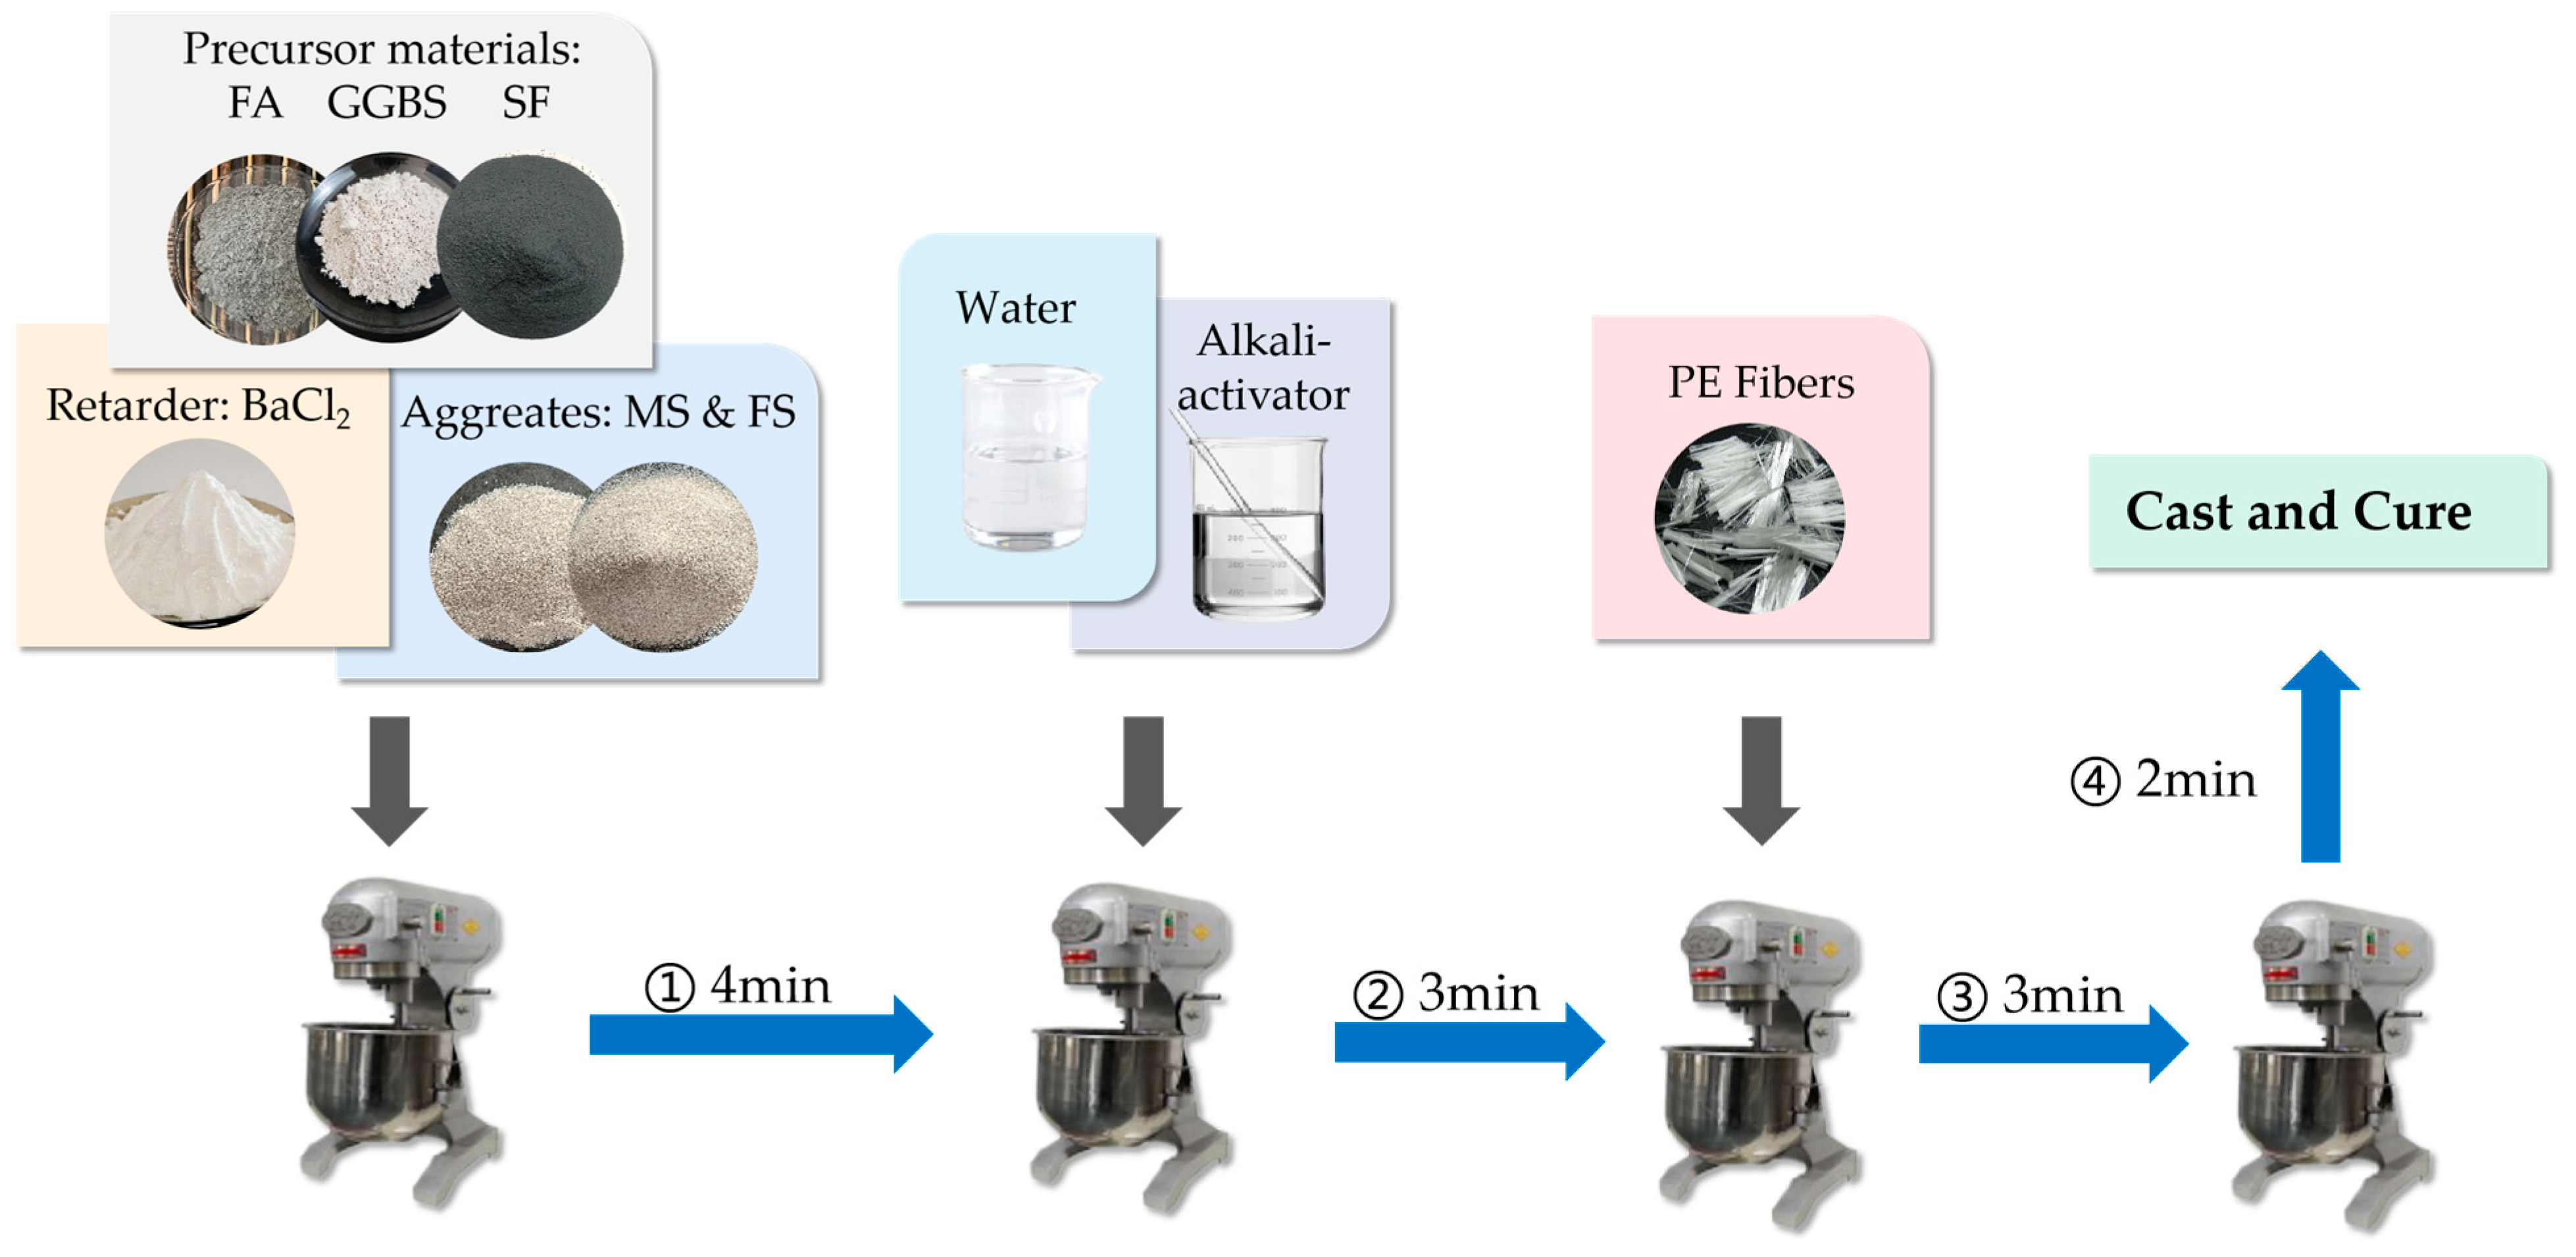
2.1. Materials
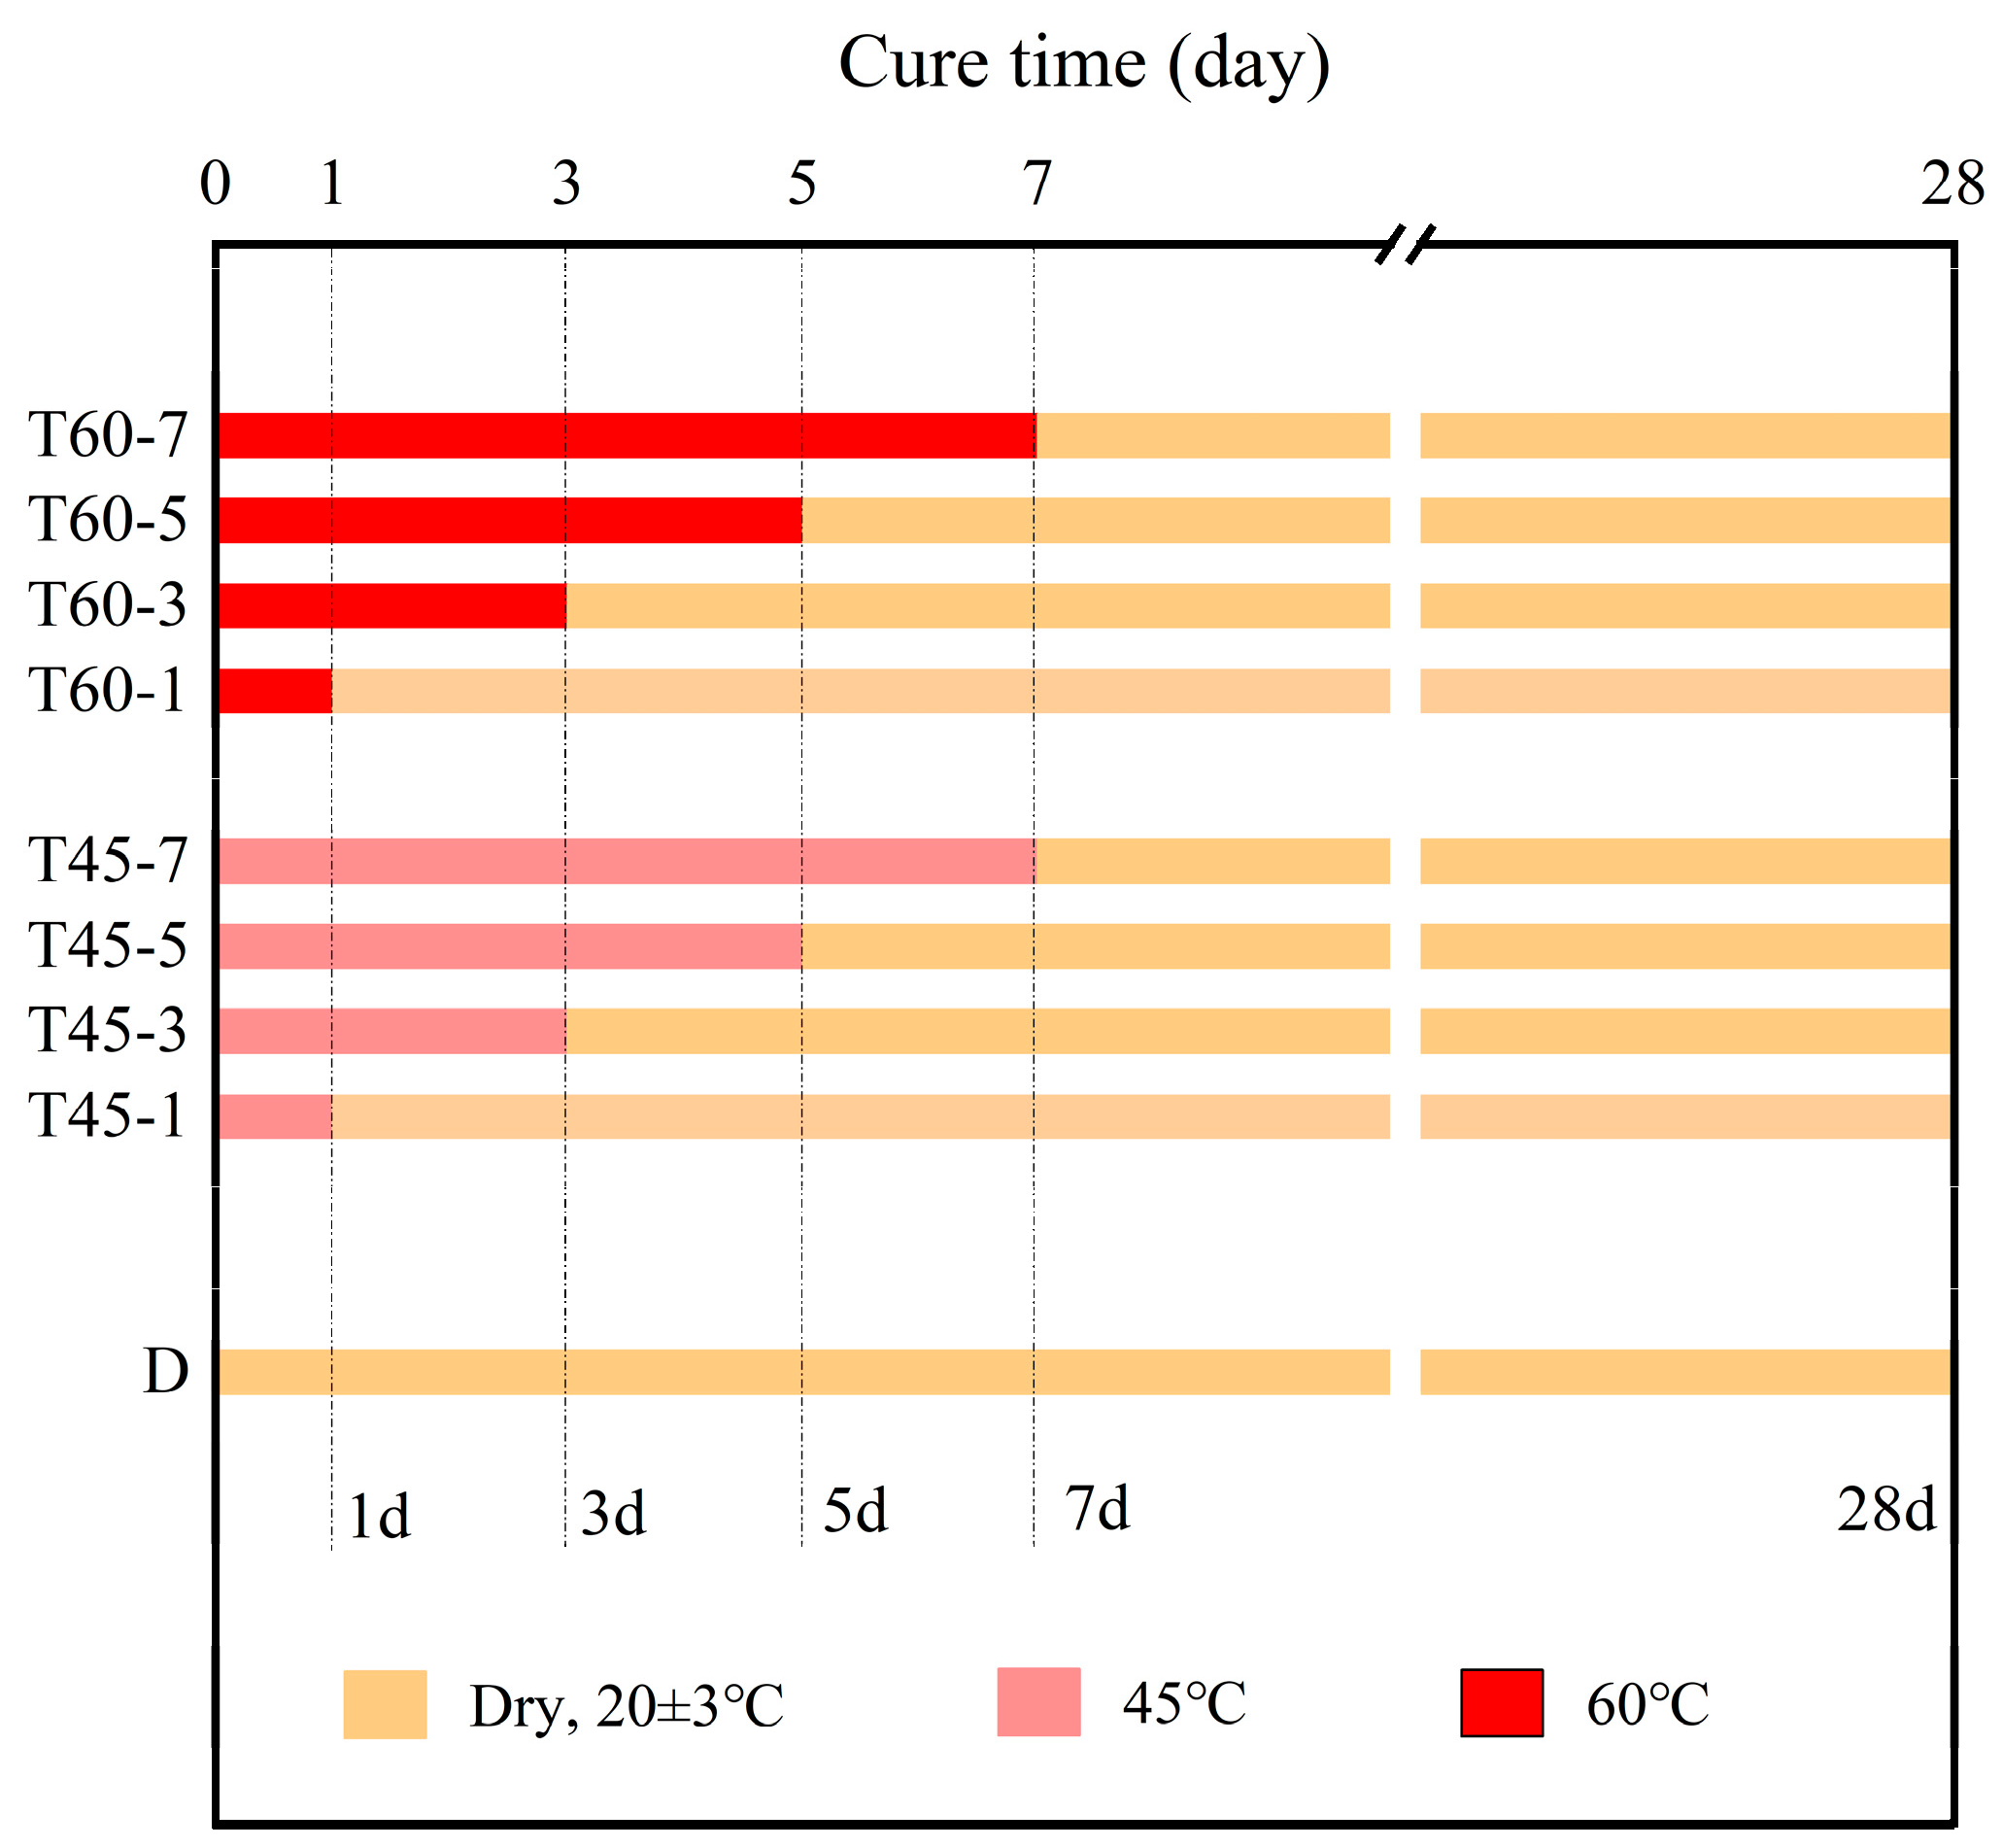
2.2. Curing Methods and Curing Time Design
2.3. Test Setup
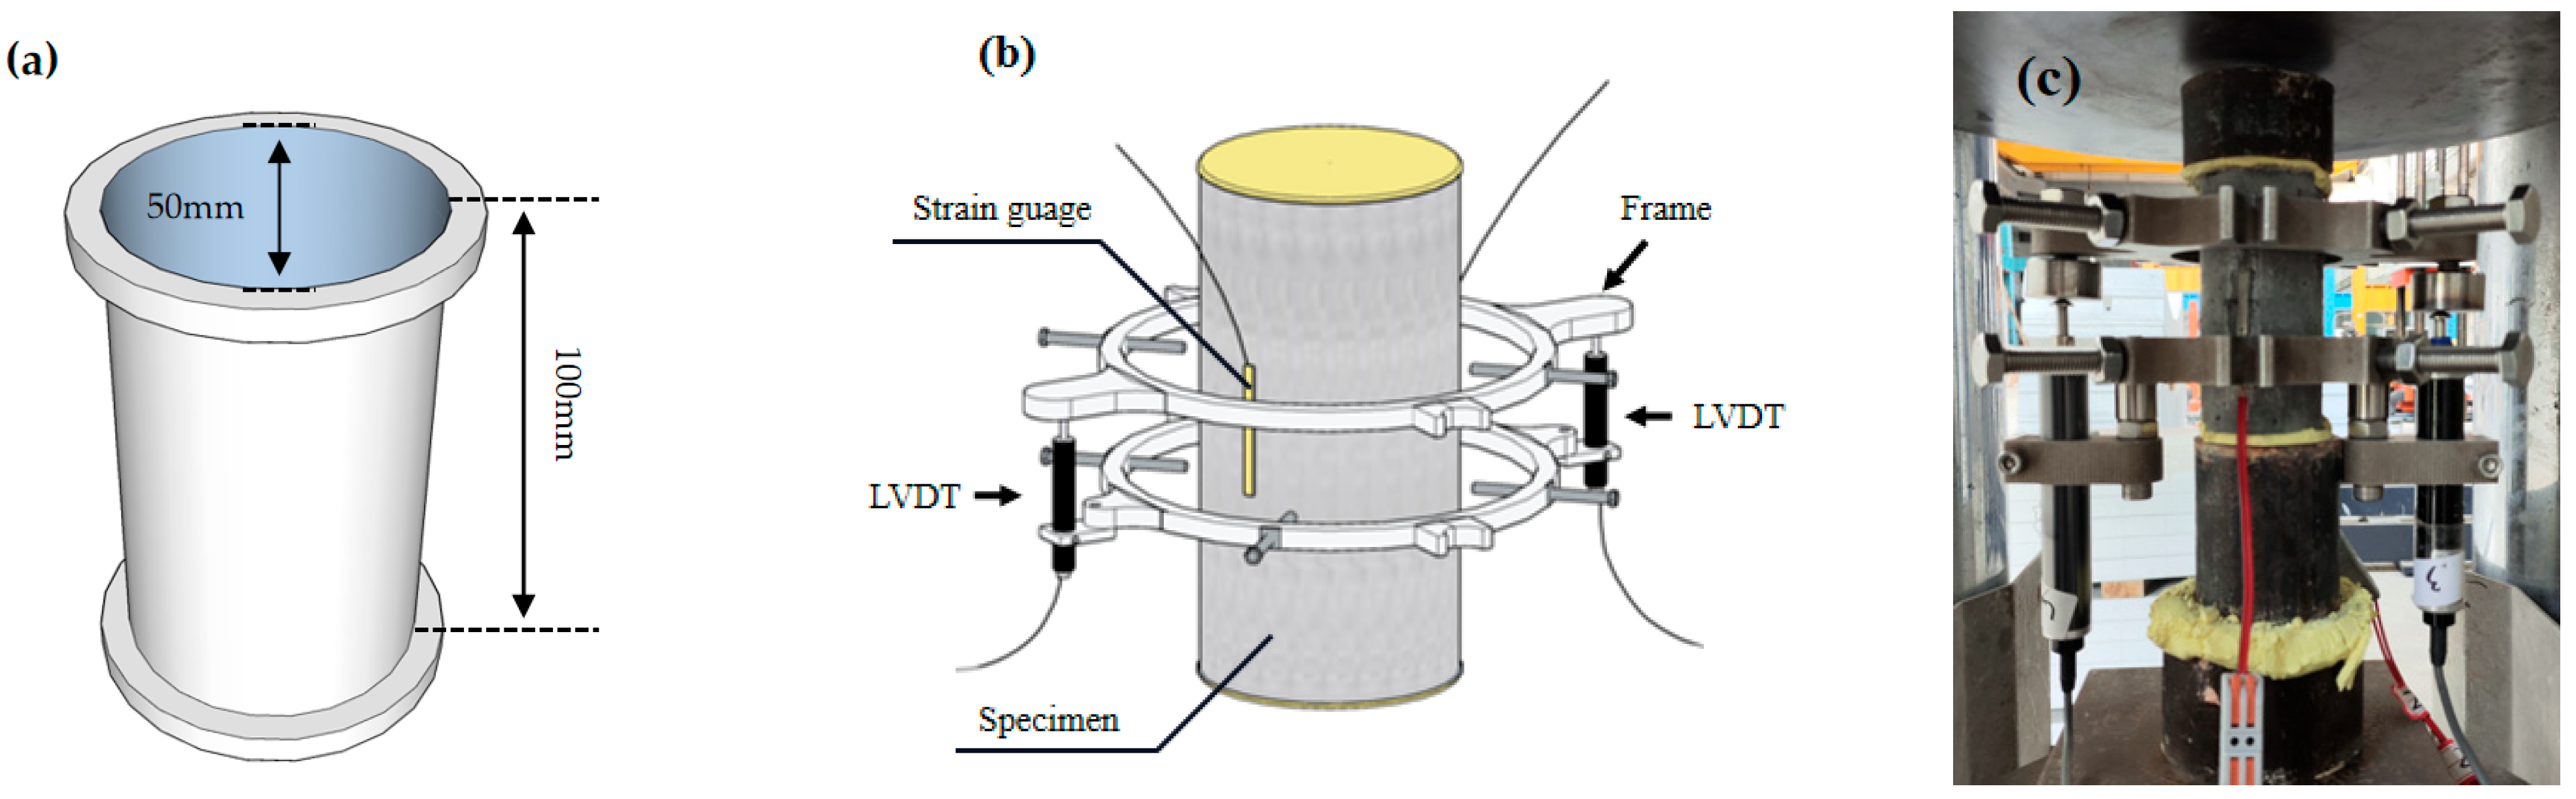
2.3.1. Compressive Test
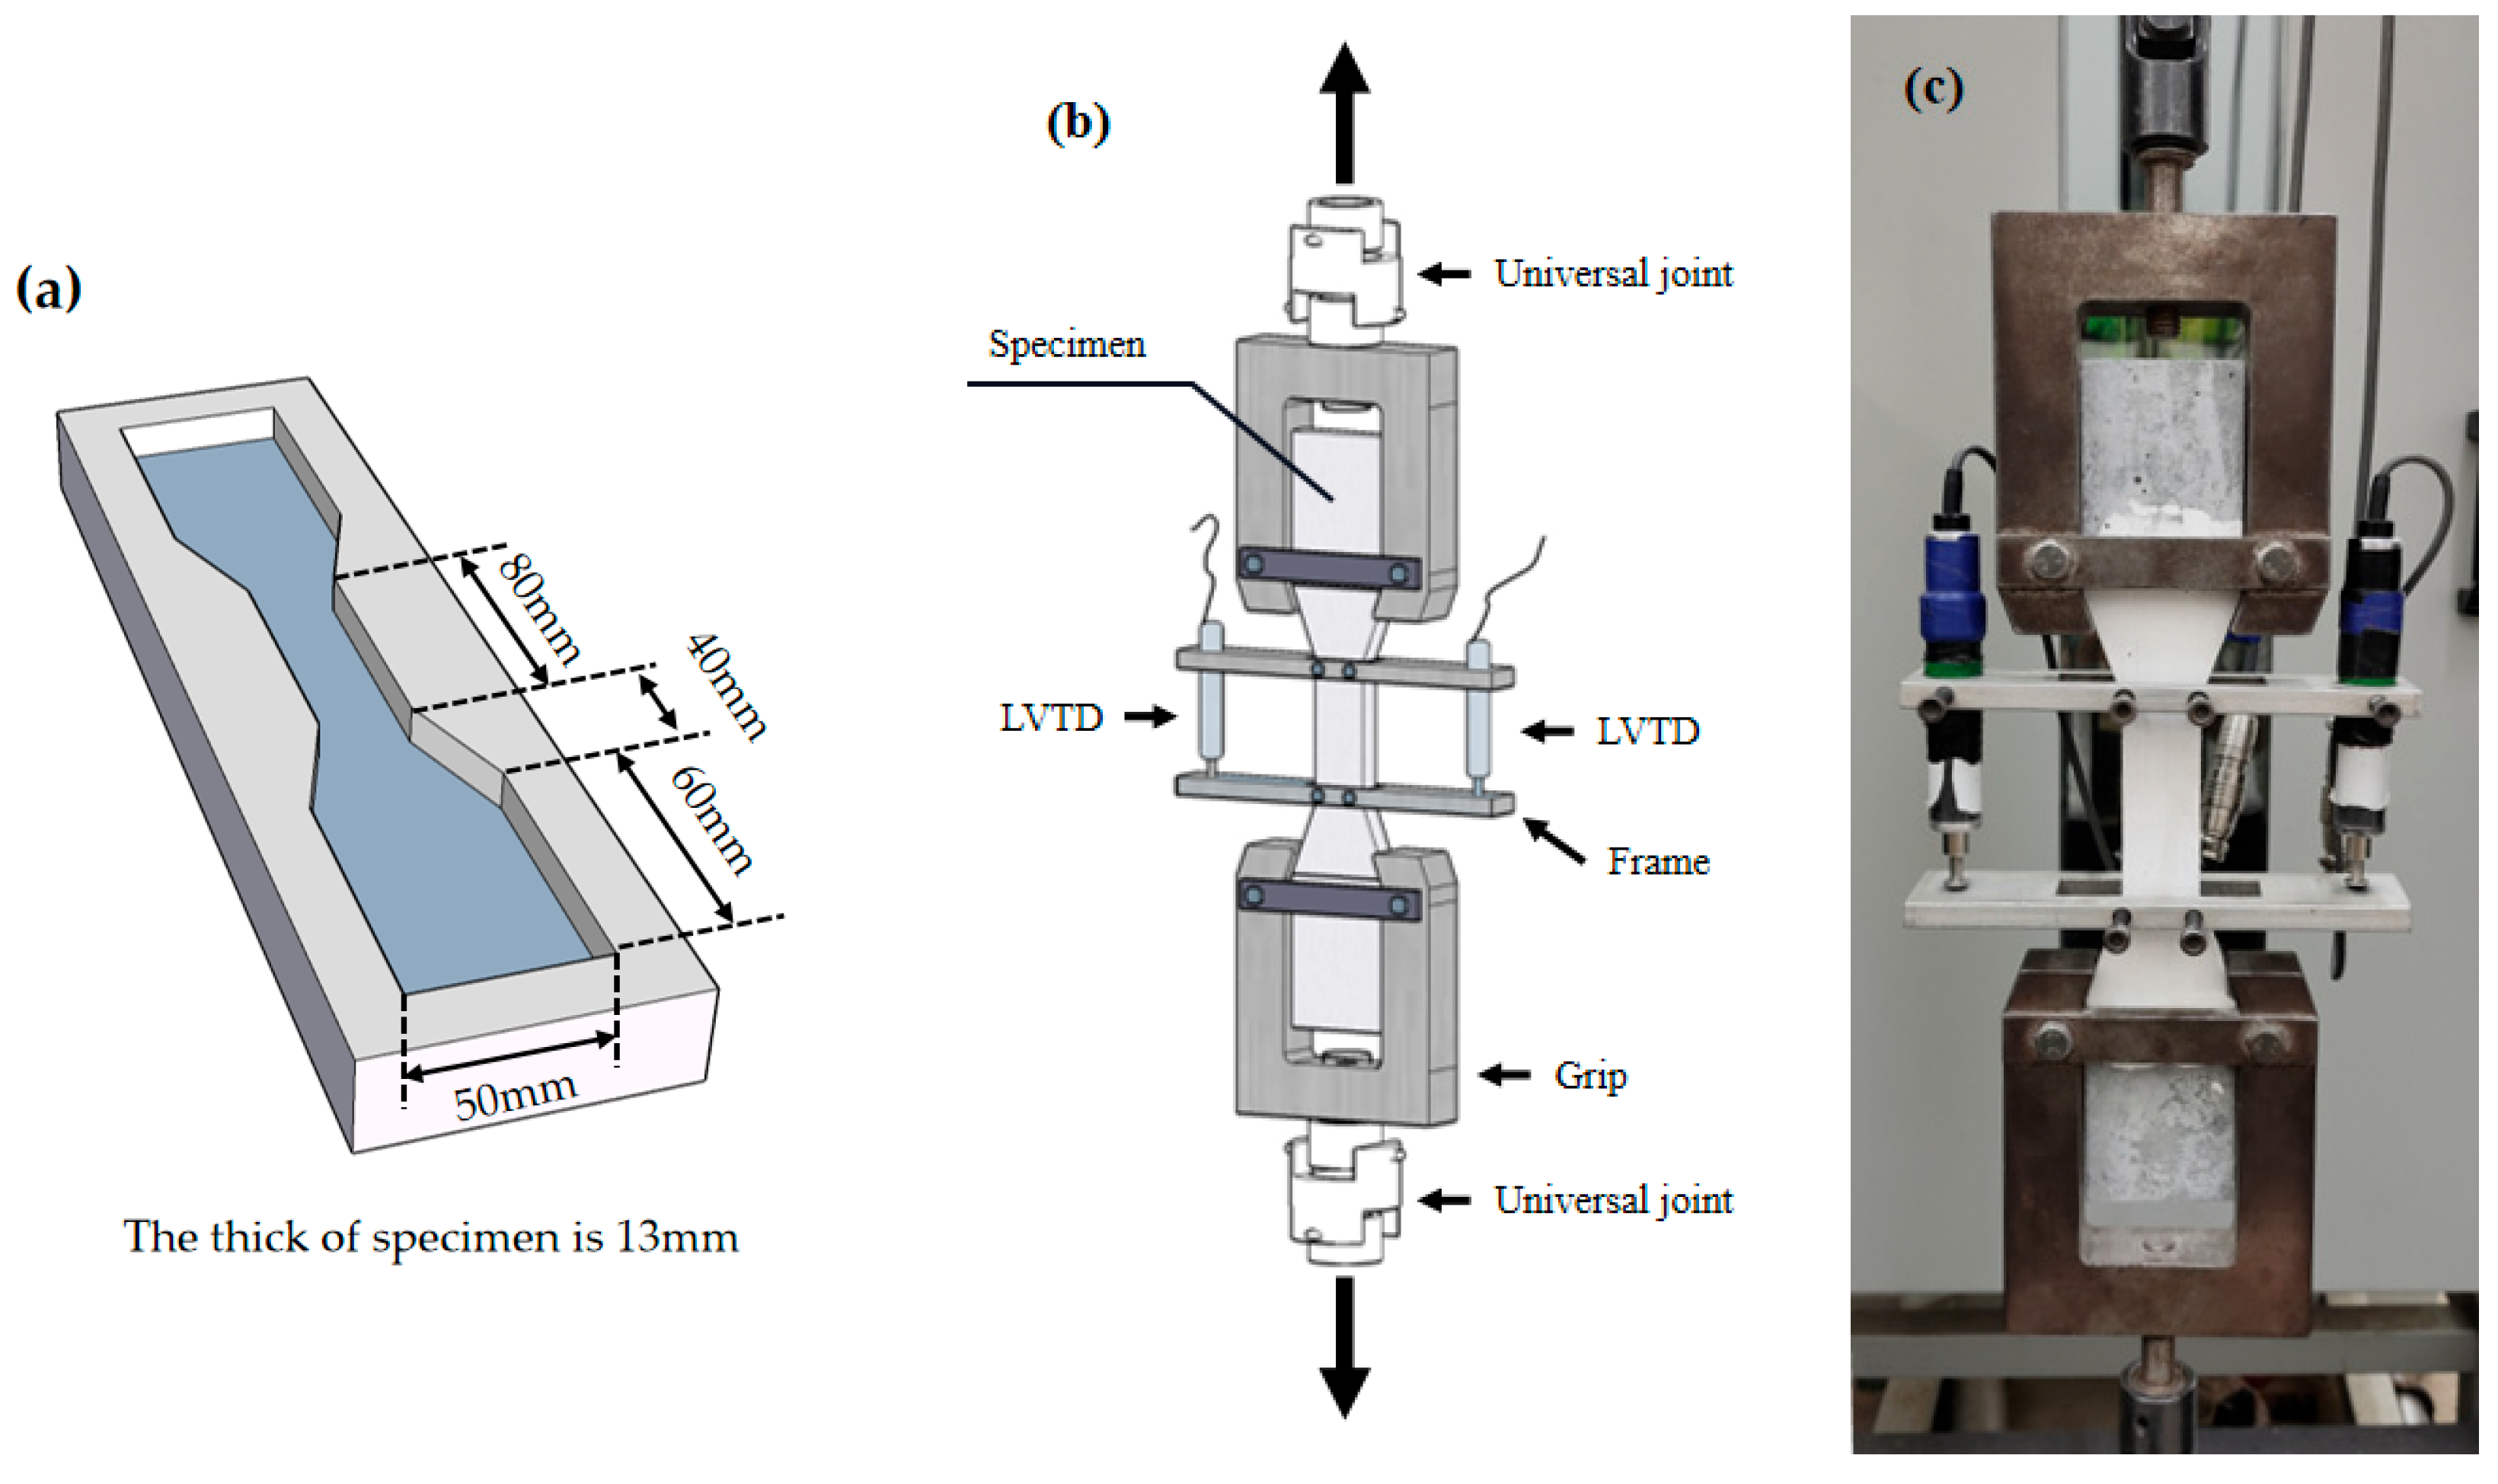
2.3.2. Tensile Test
2.3.3. SEM and EDS Analysis
3. Results and Discussion
3.1. Compressive Test
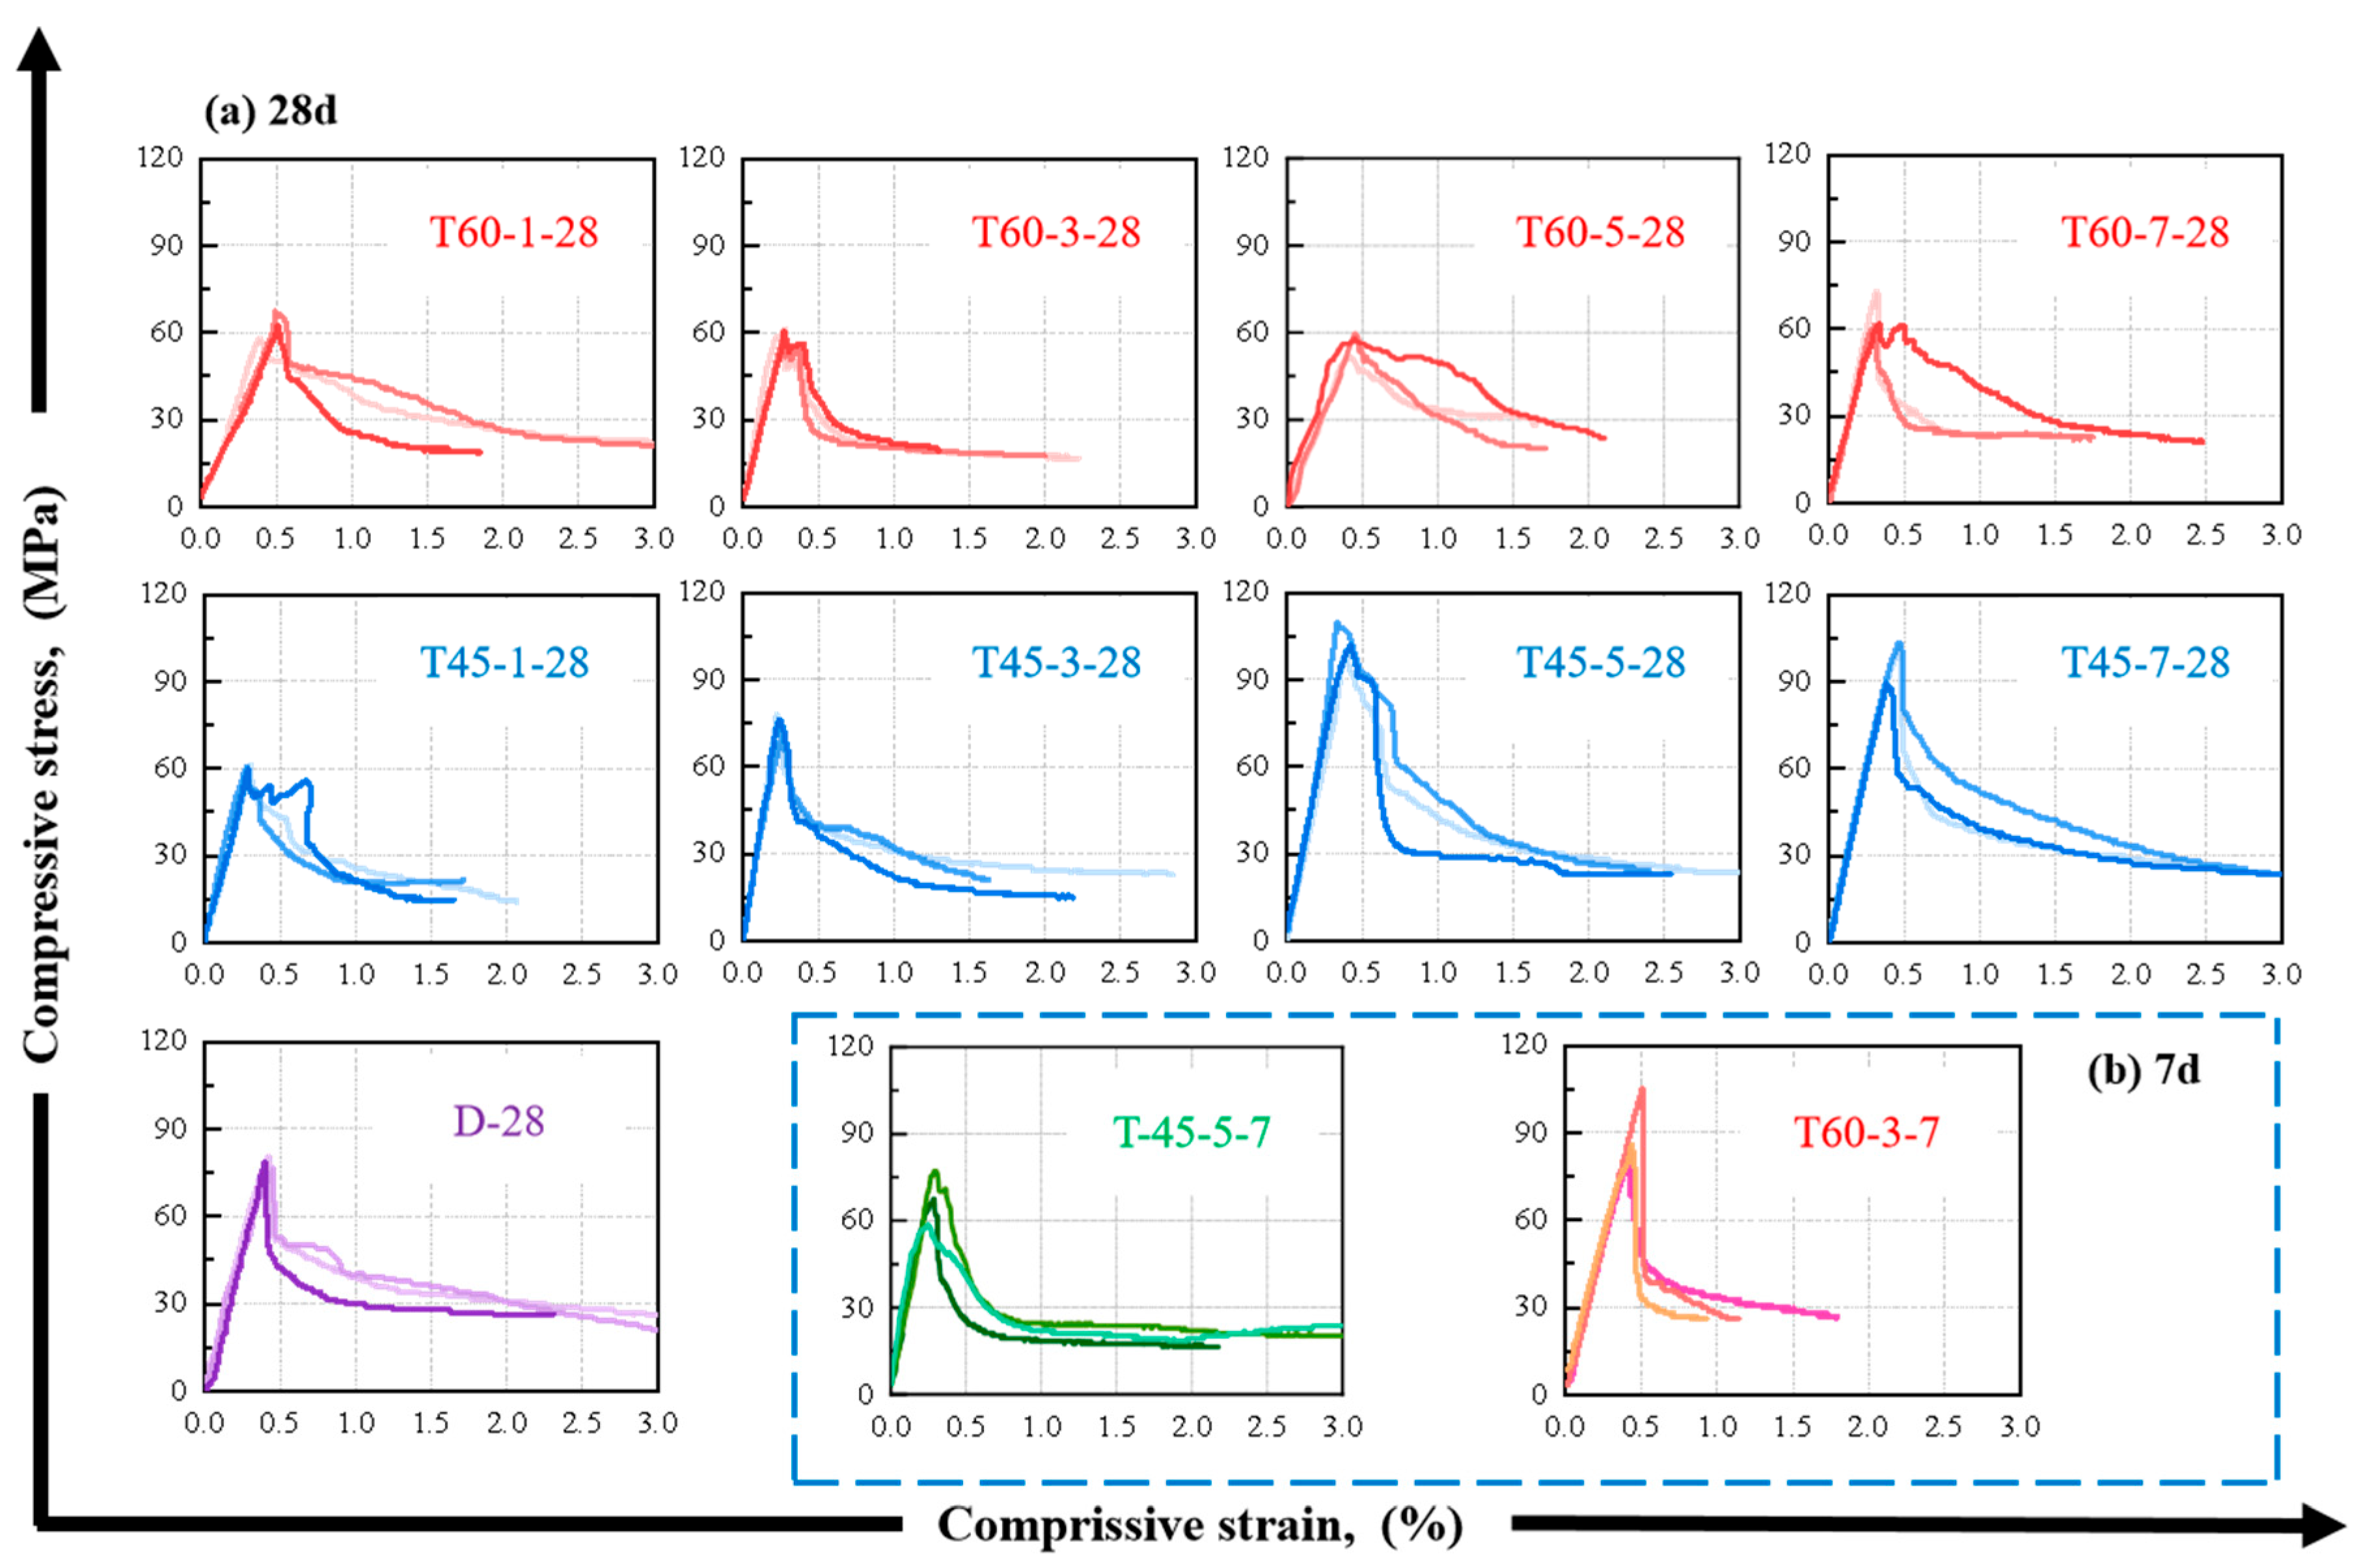
3.1.1. Stress–Strain Relationship of Uniaxial Compressive Test
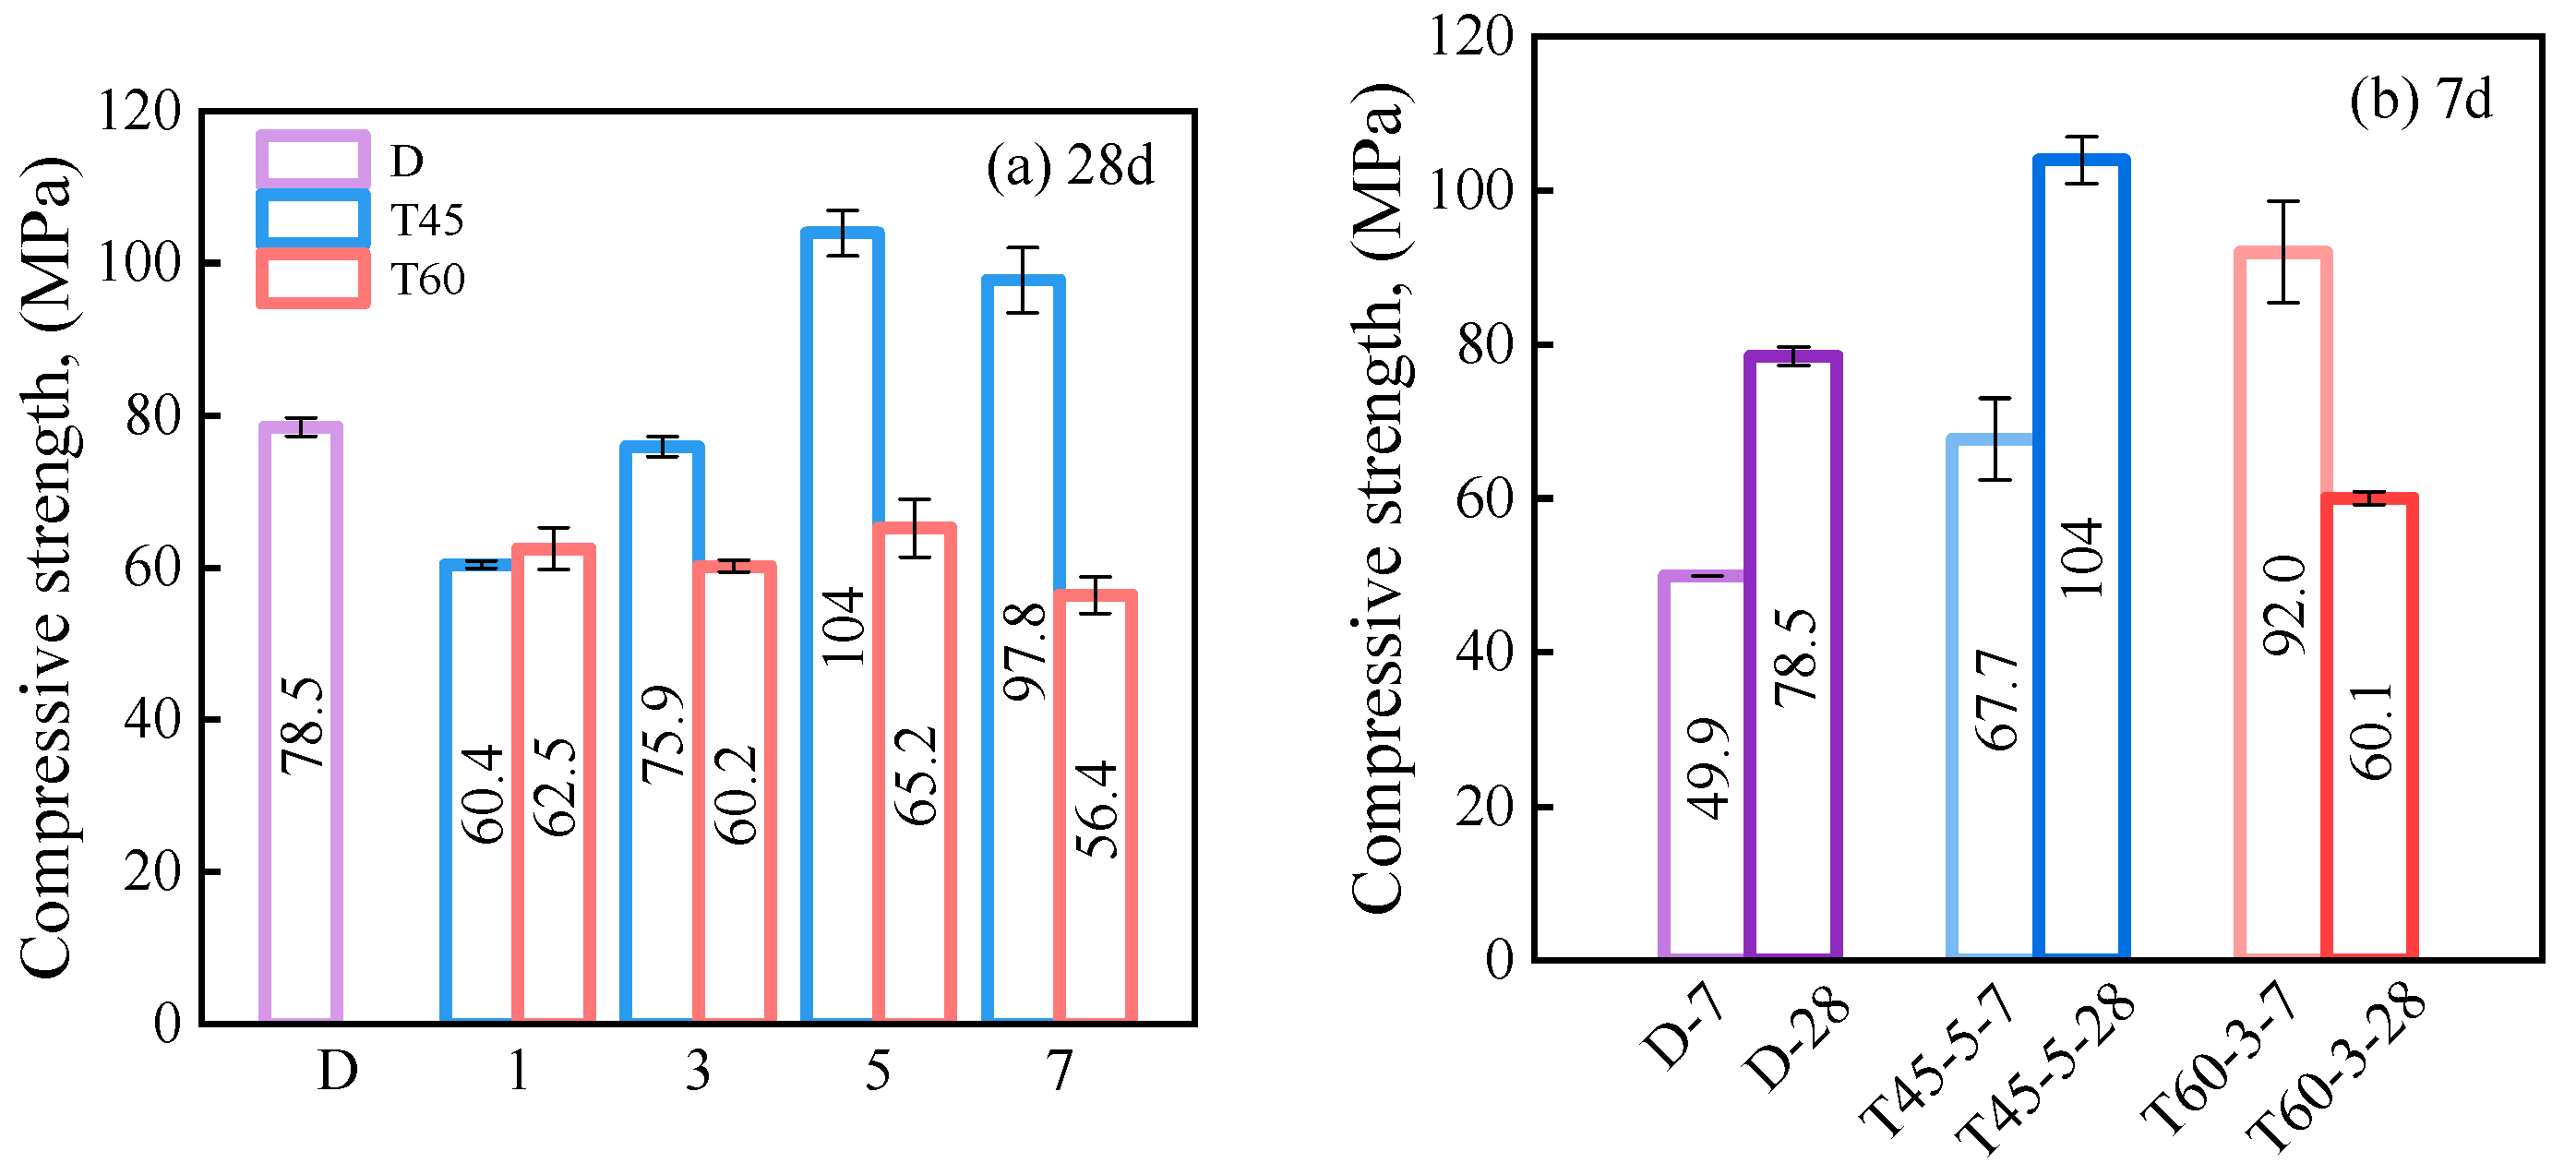
3.1.2. Compressive Properties Parameters
3.2. Tensile Test
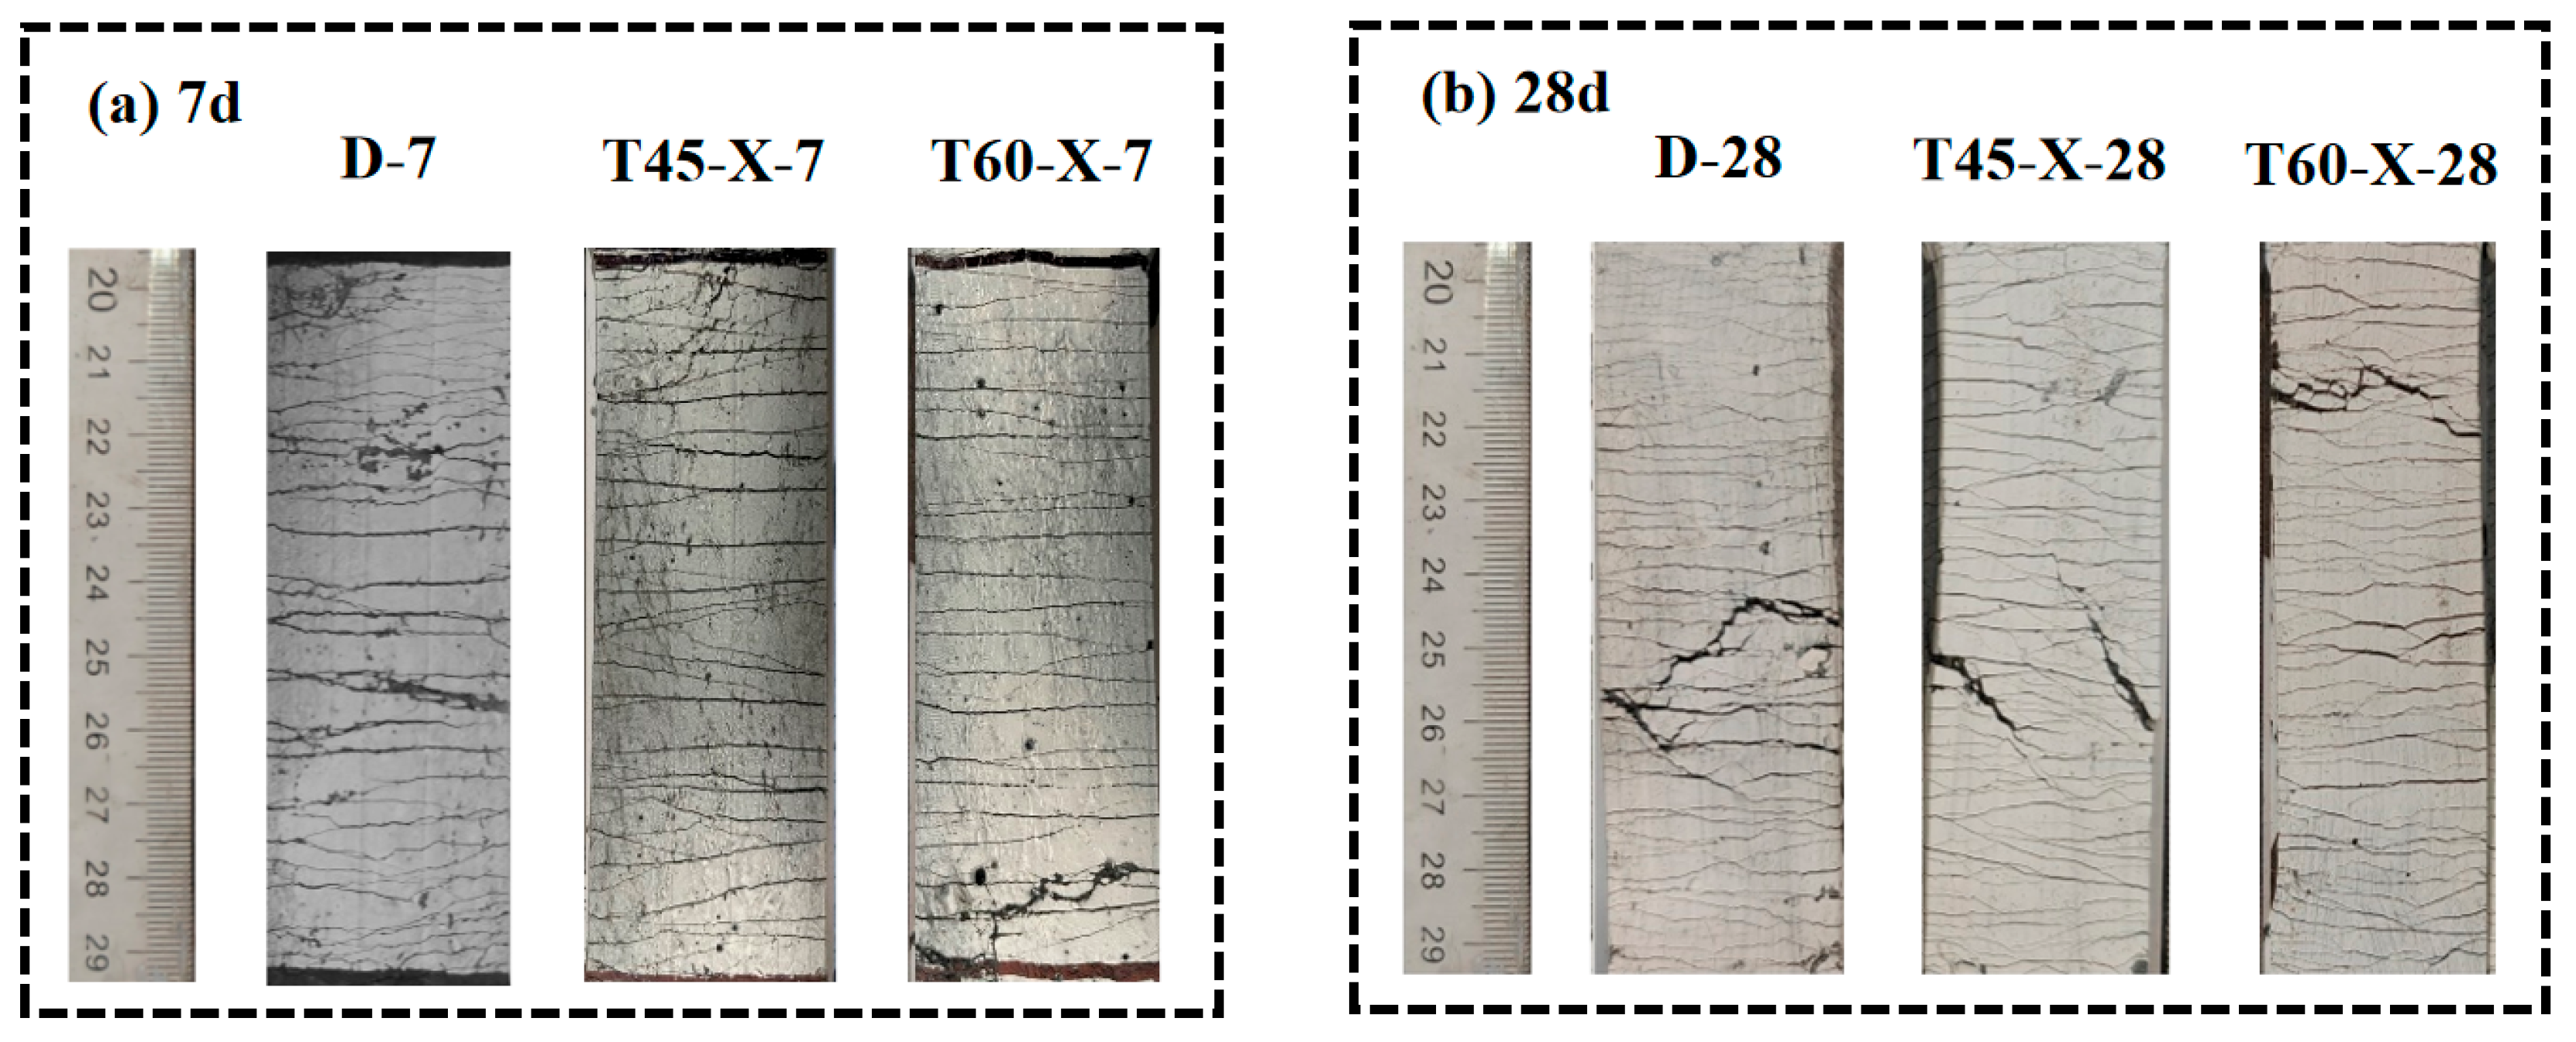
3.2.1. Failure Mode
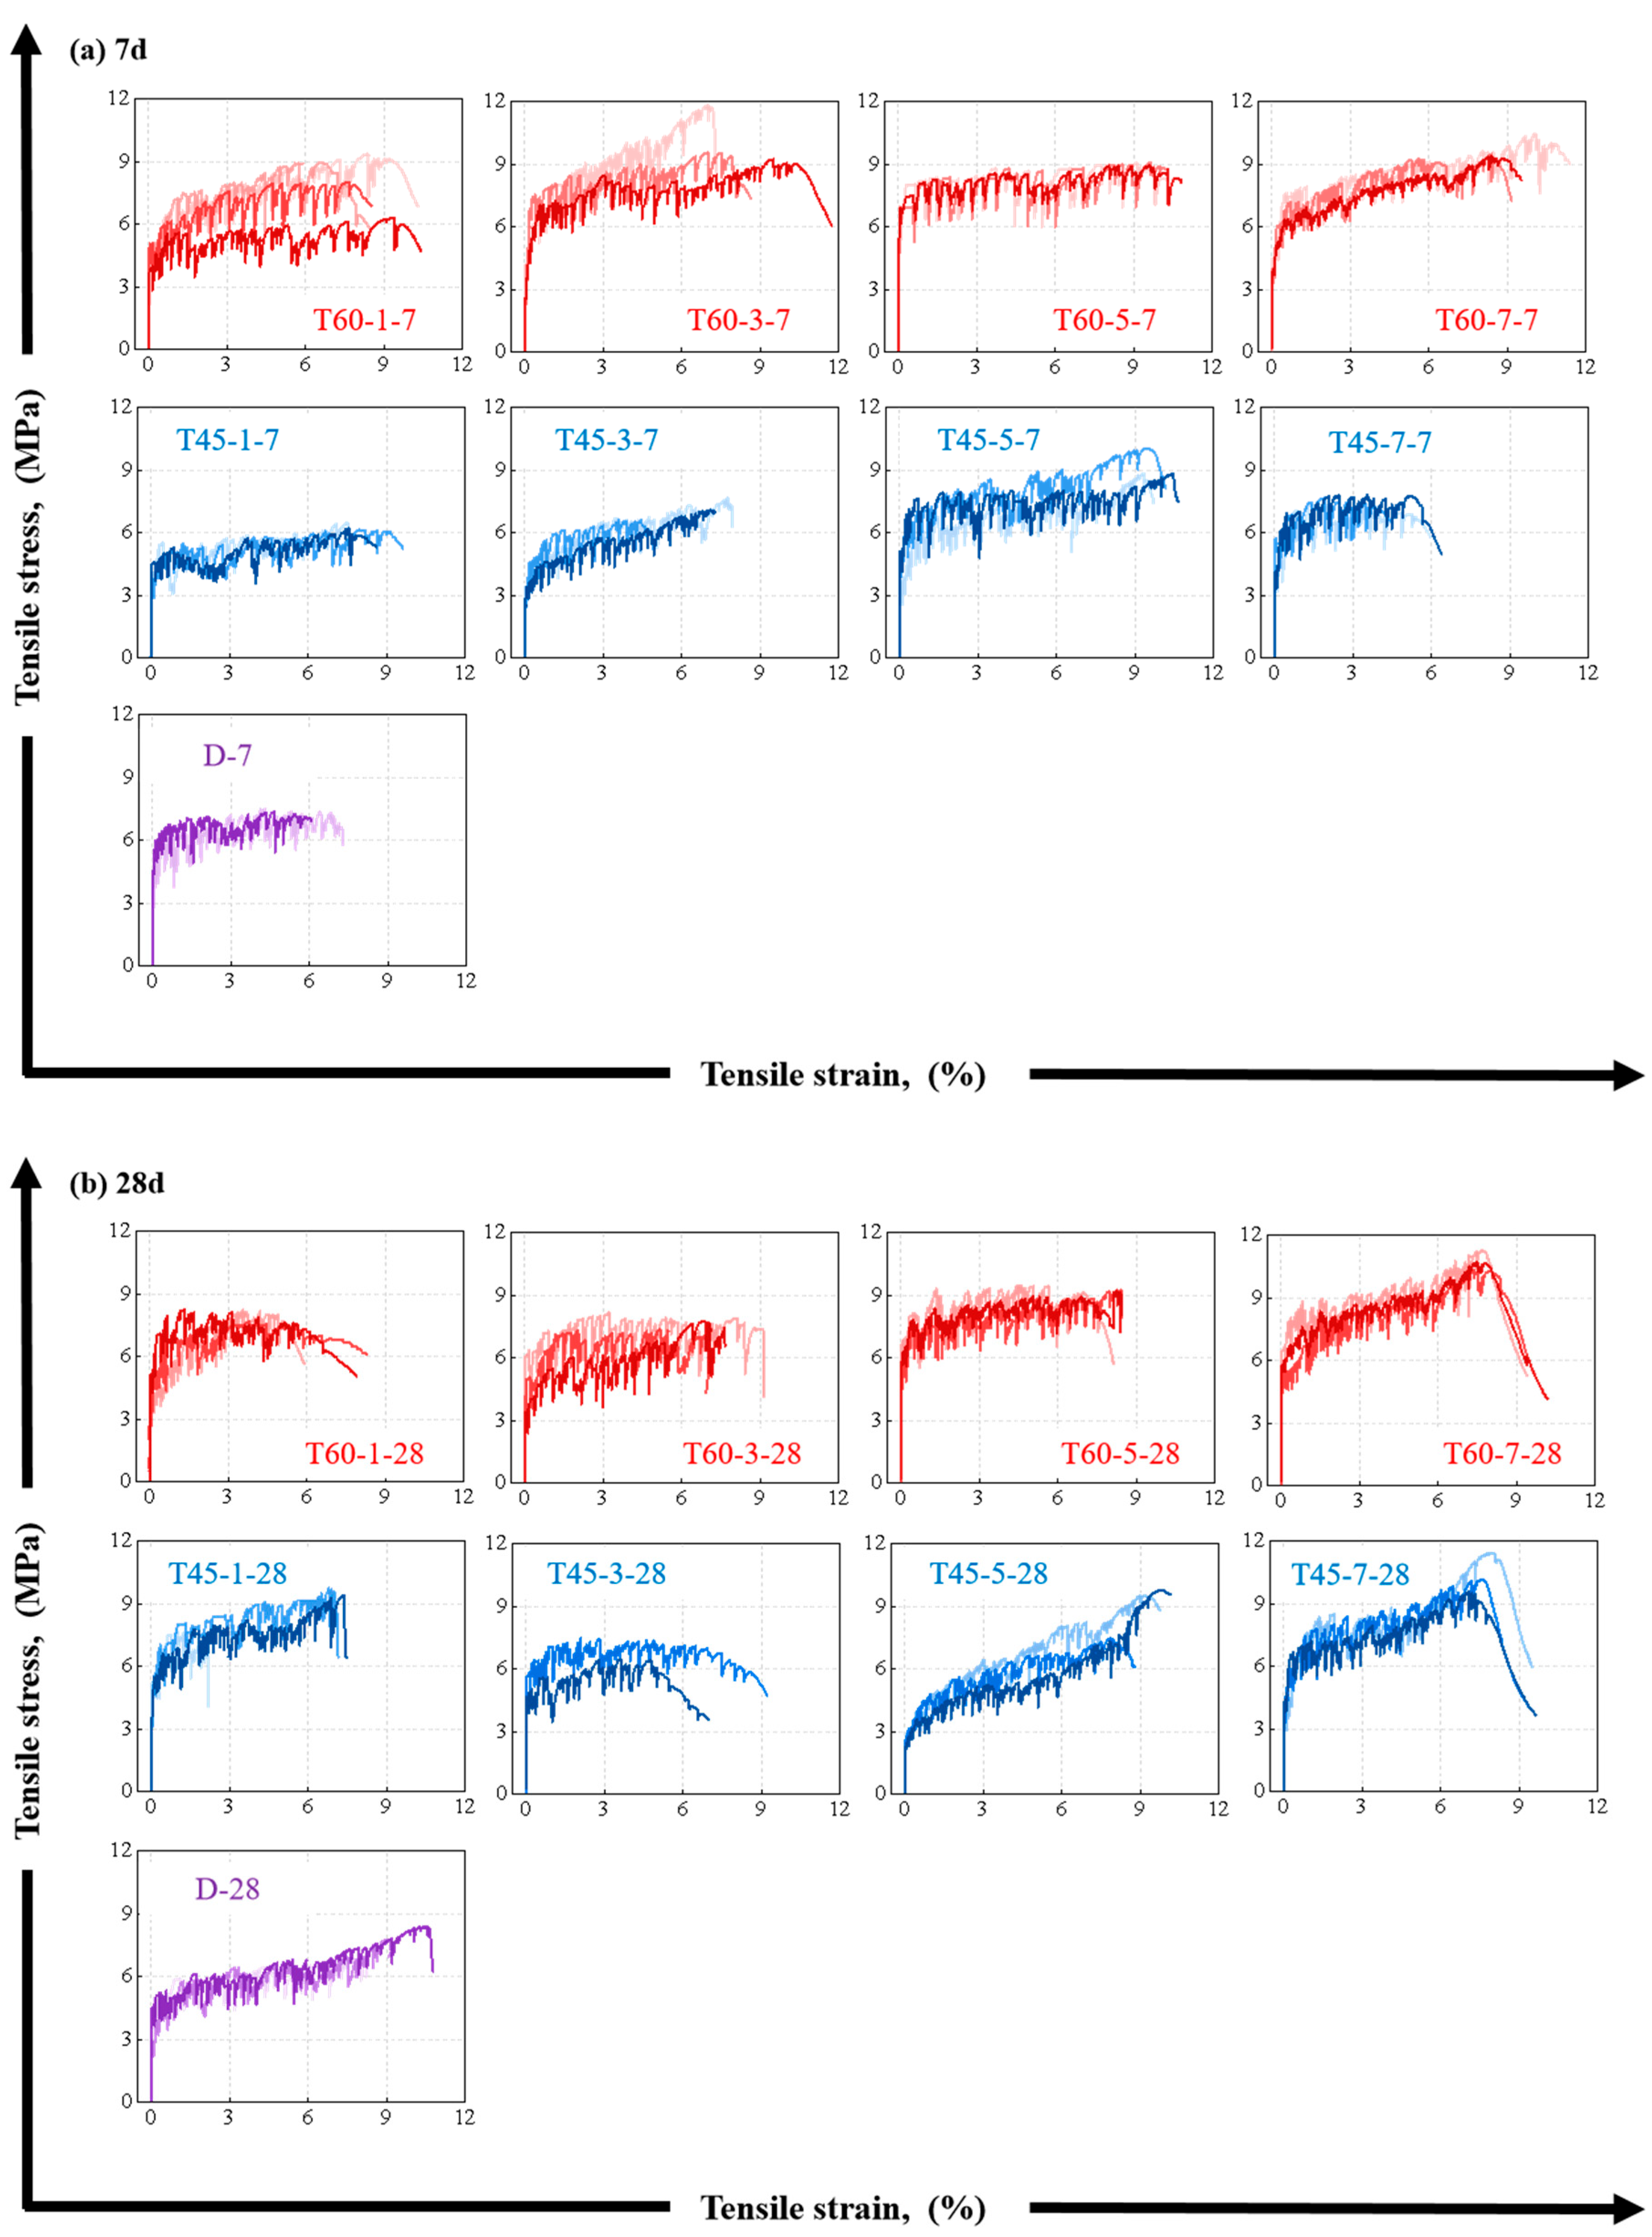
3.2.2. Tensile Stress–Strain Curves
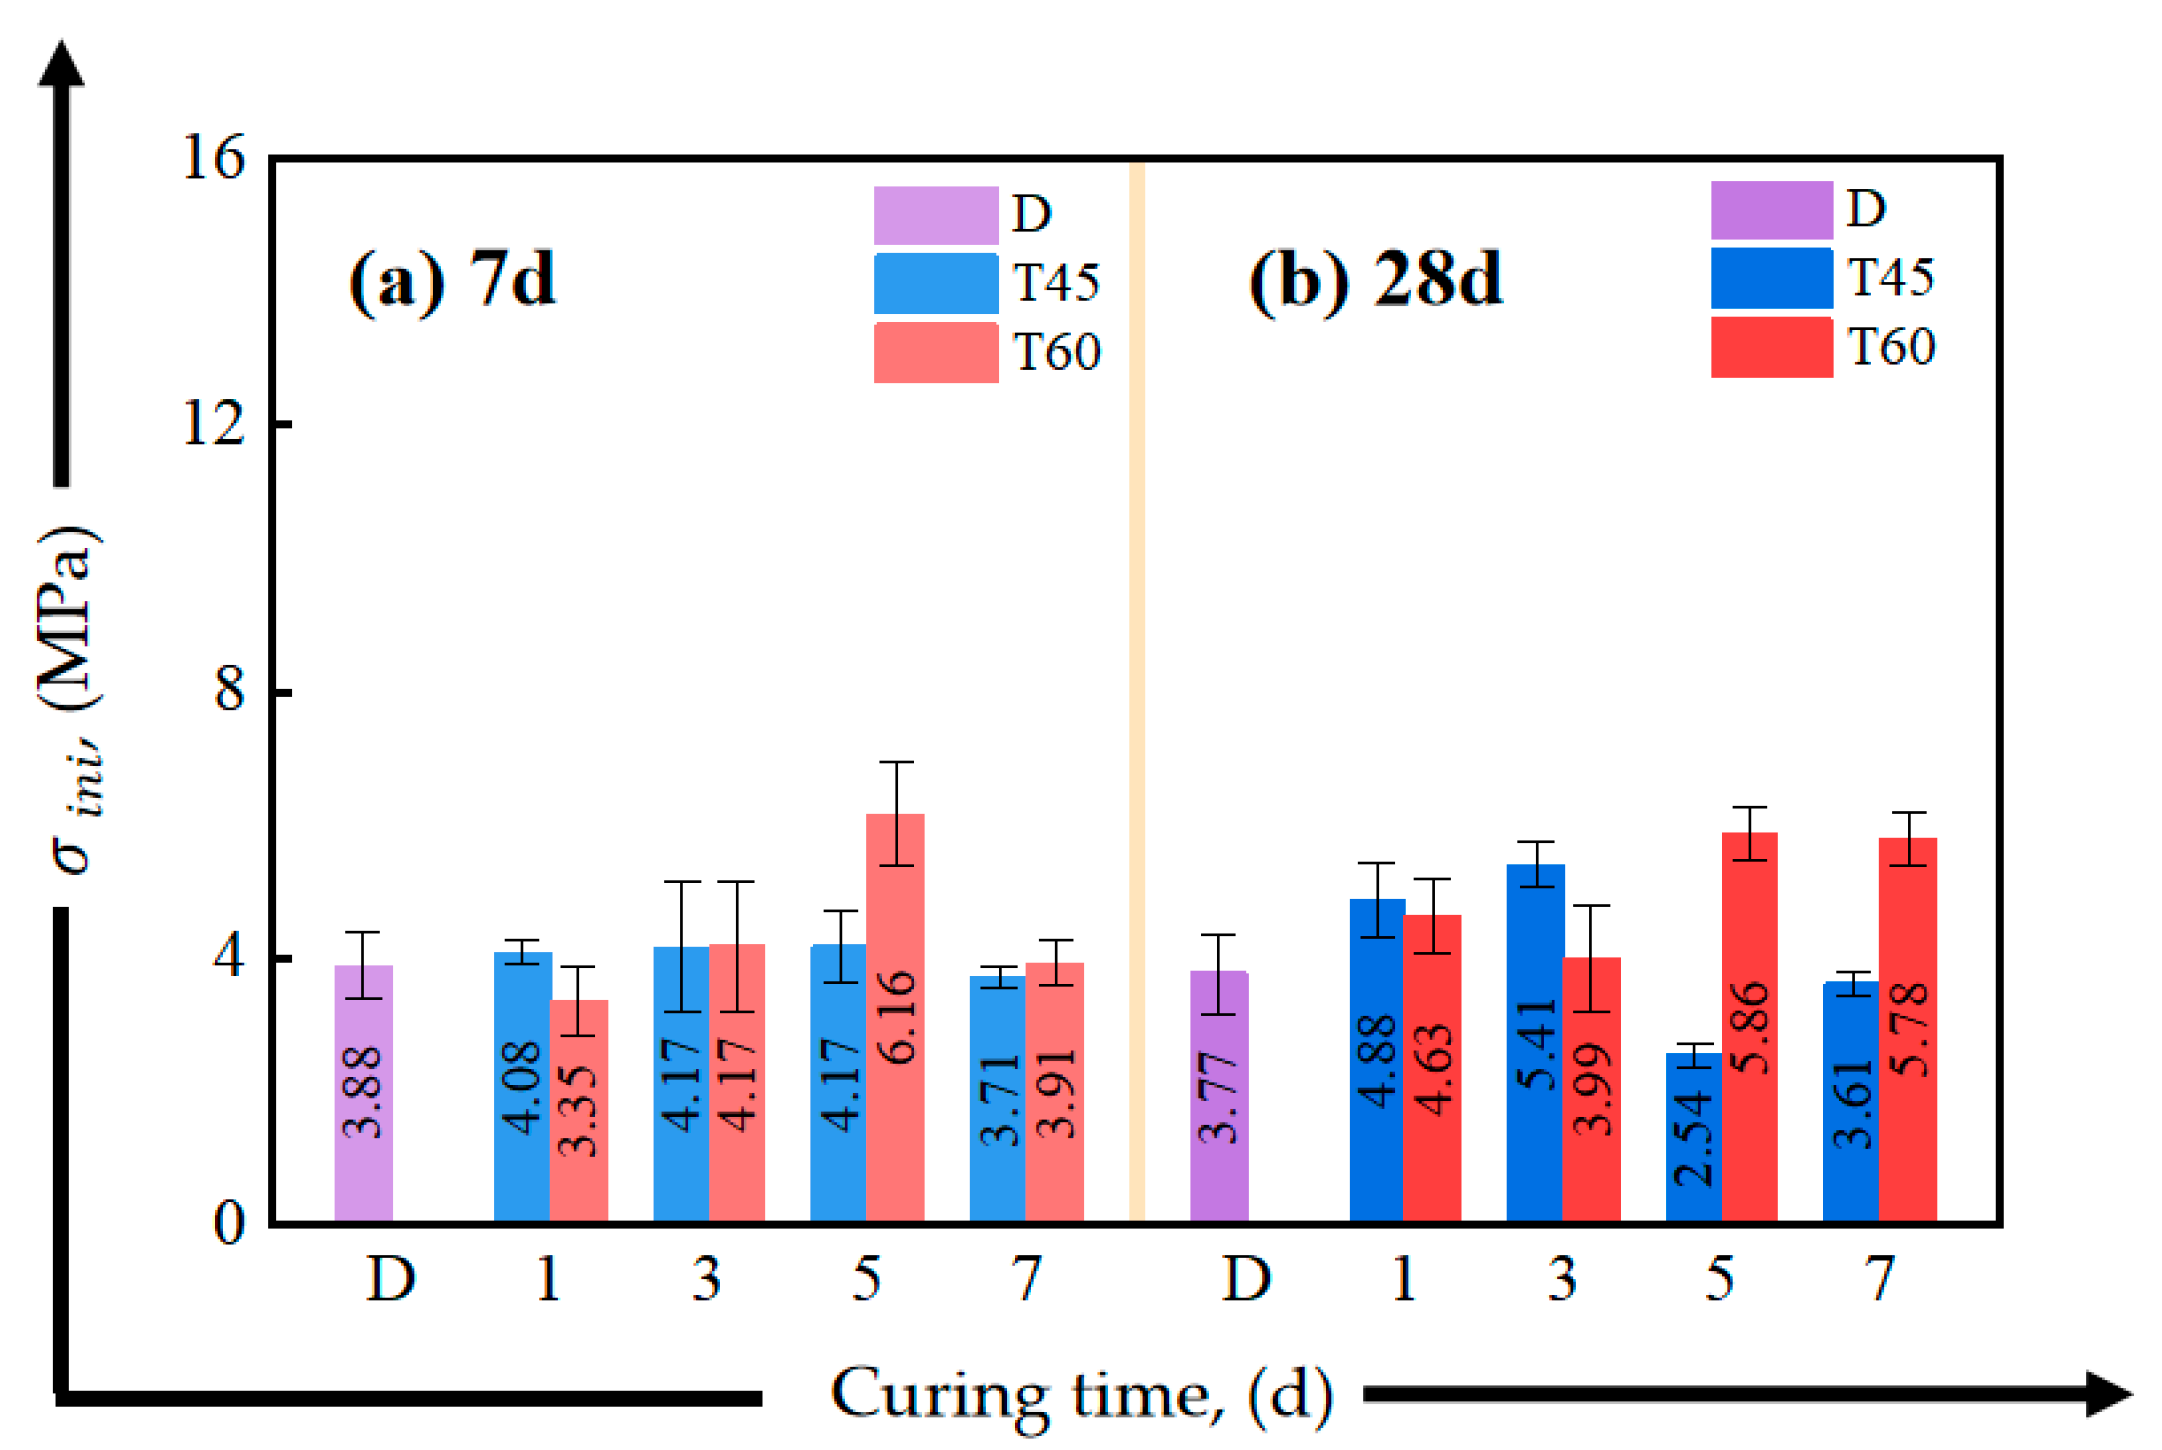
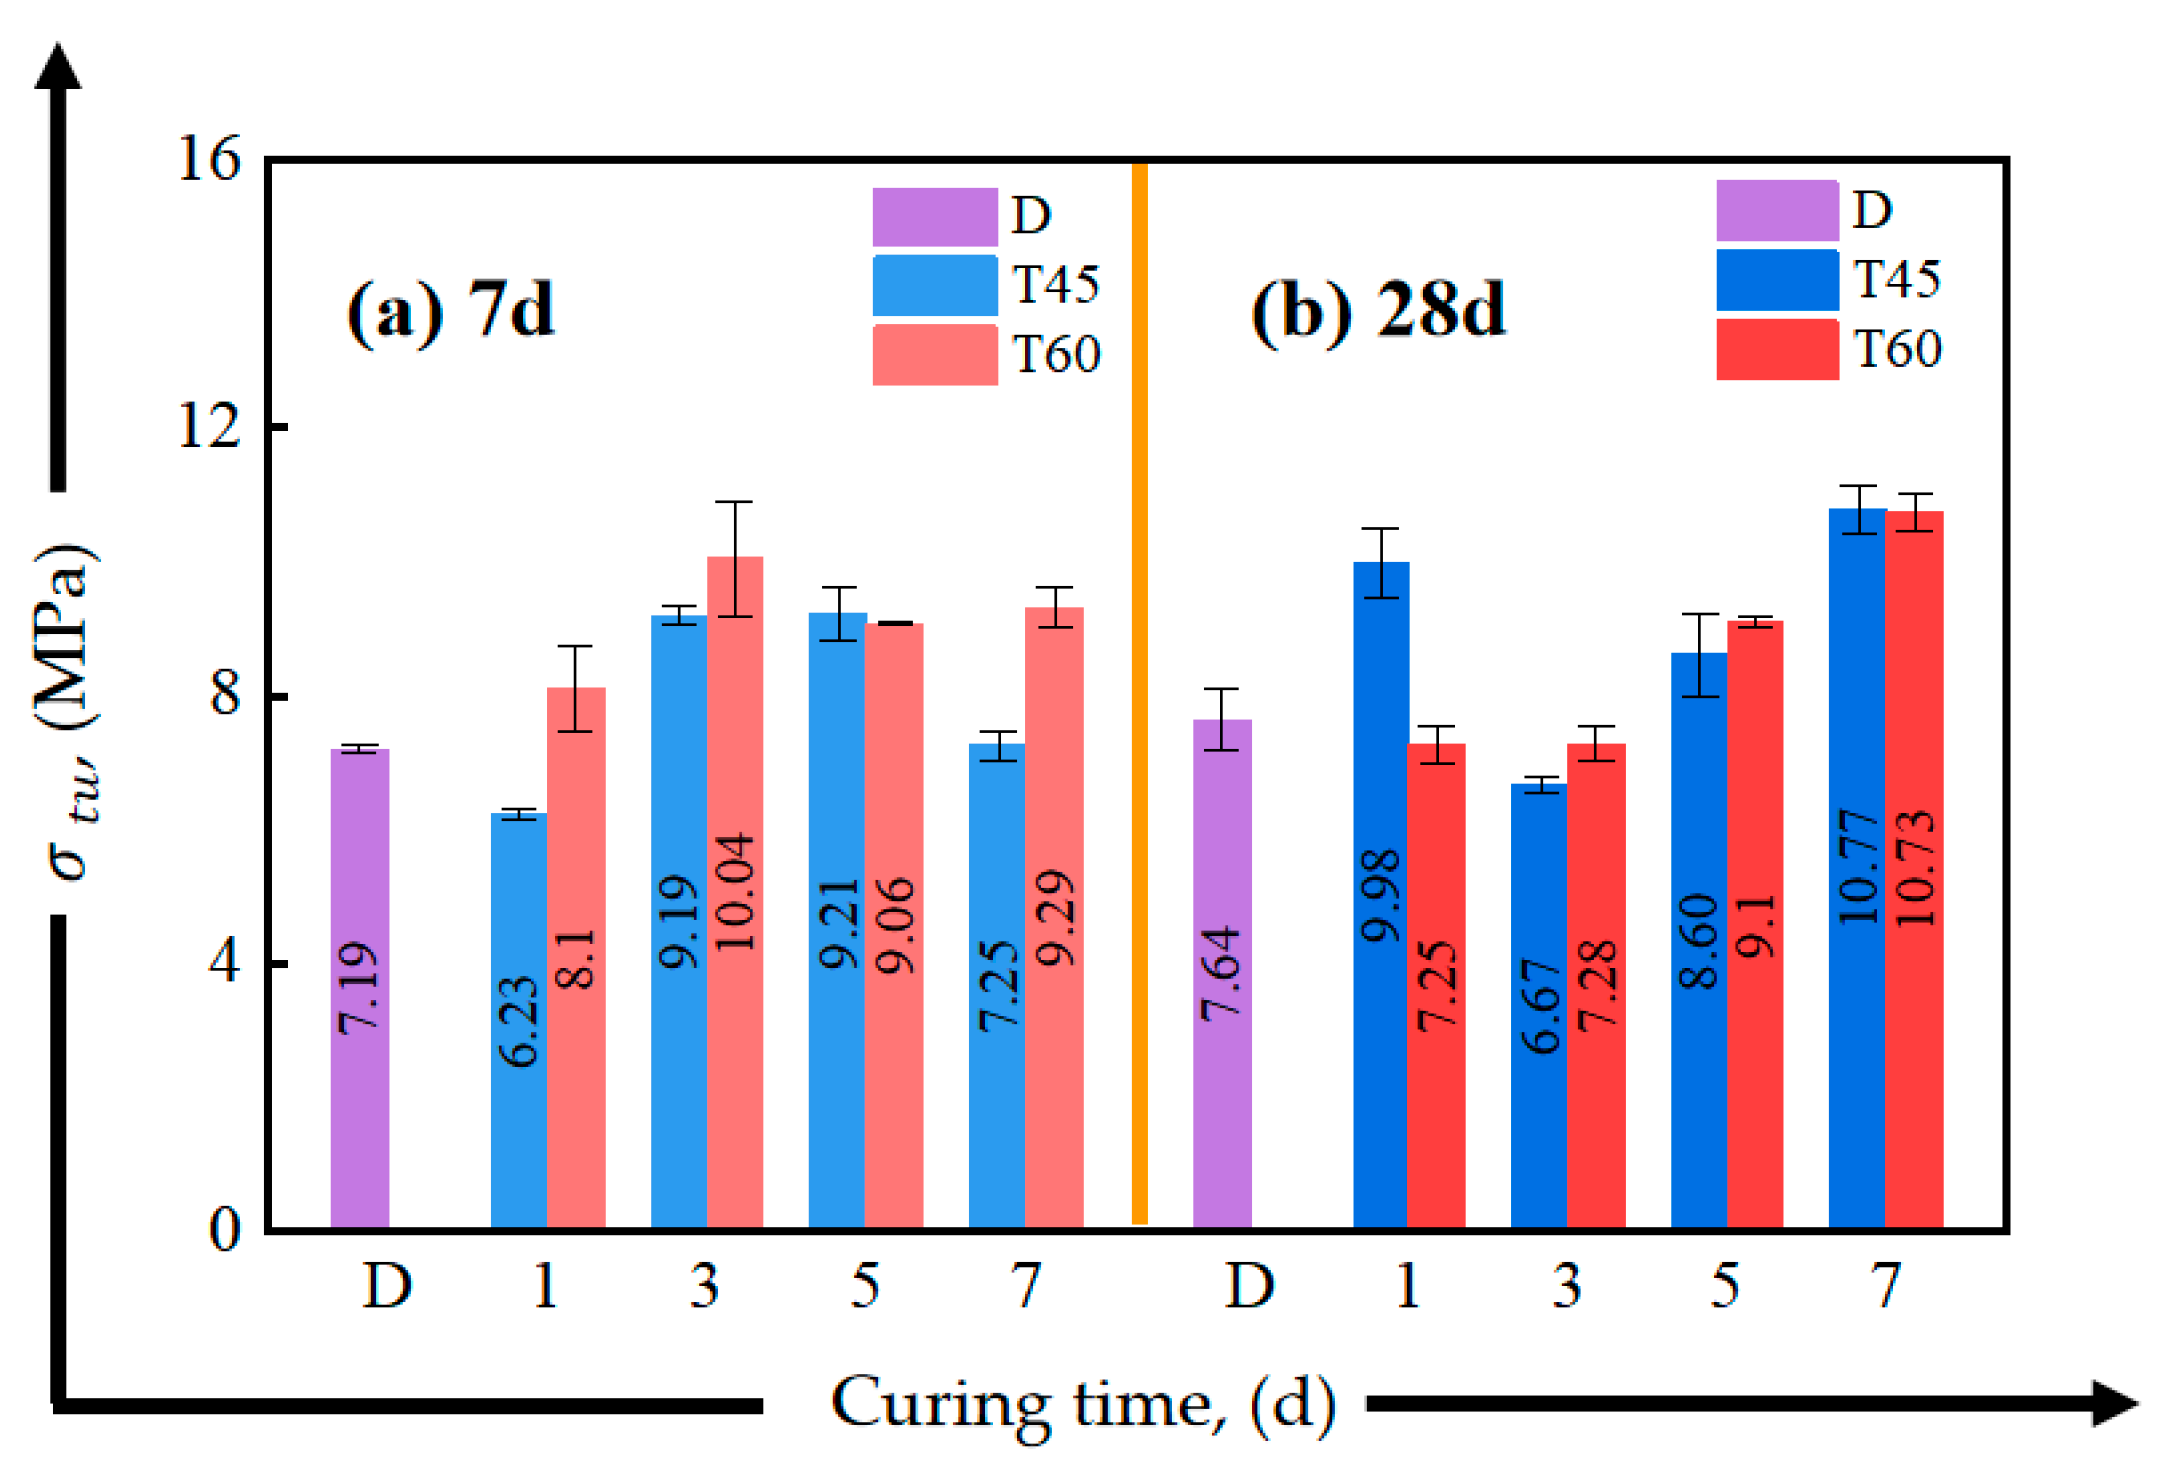
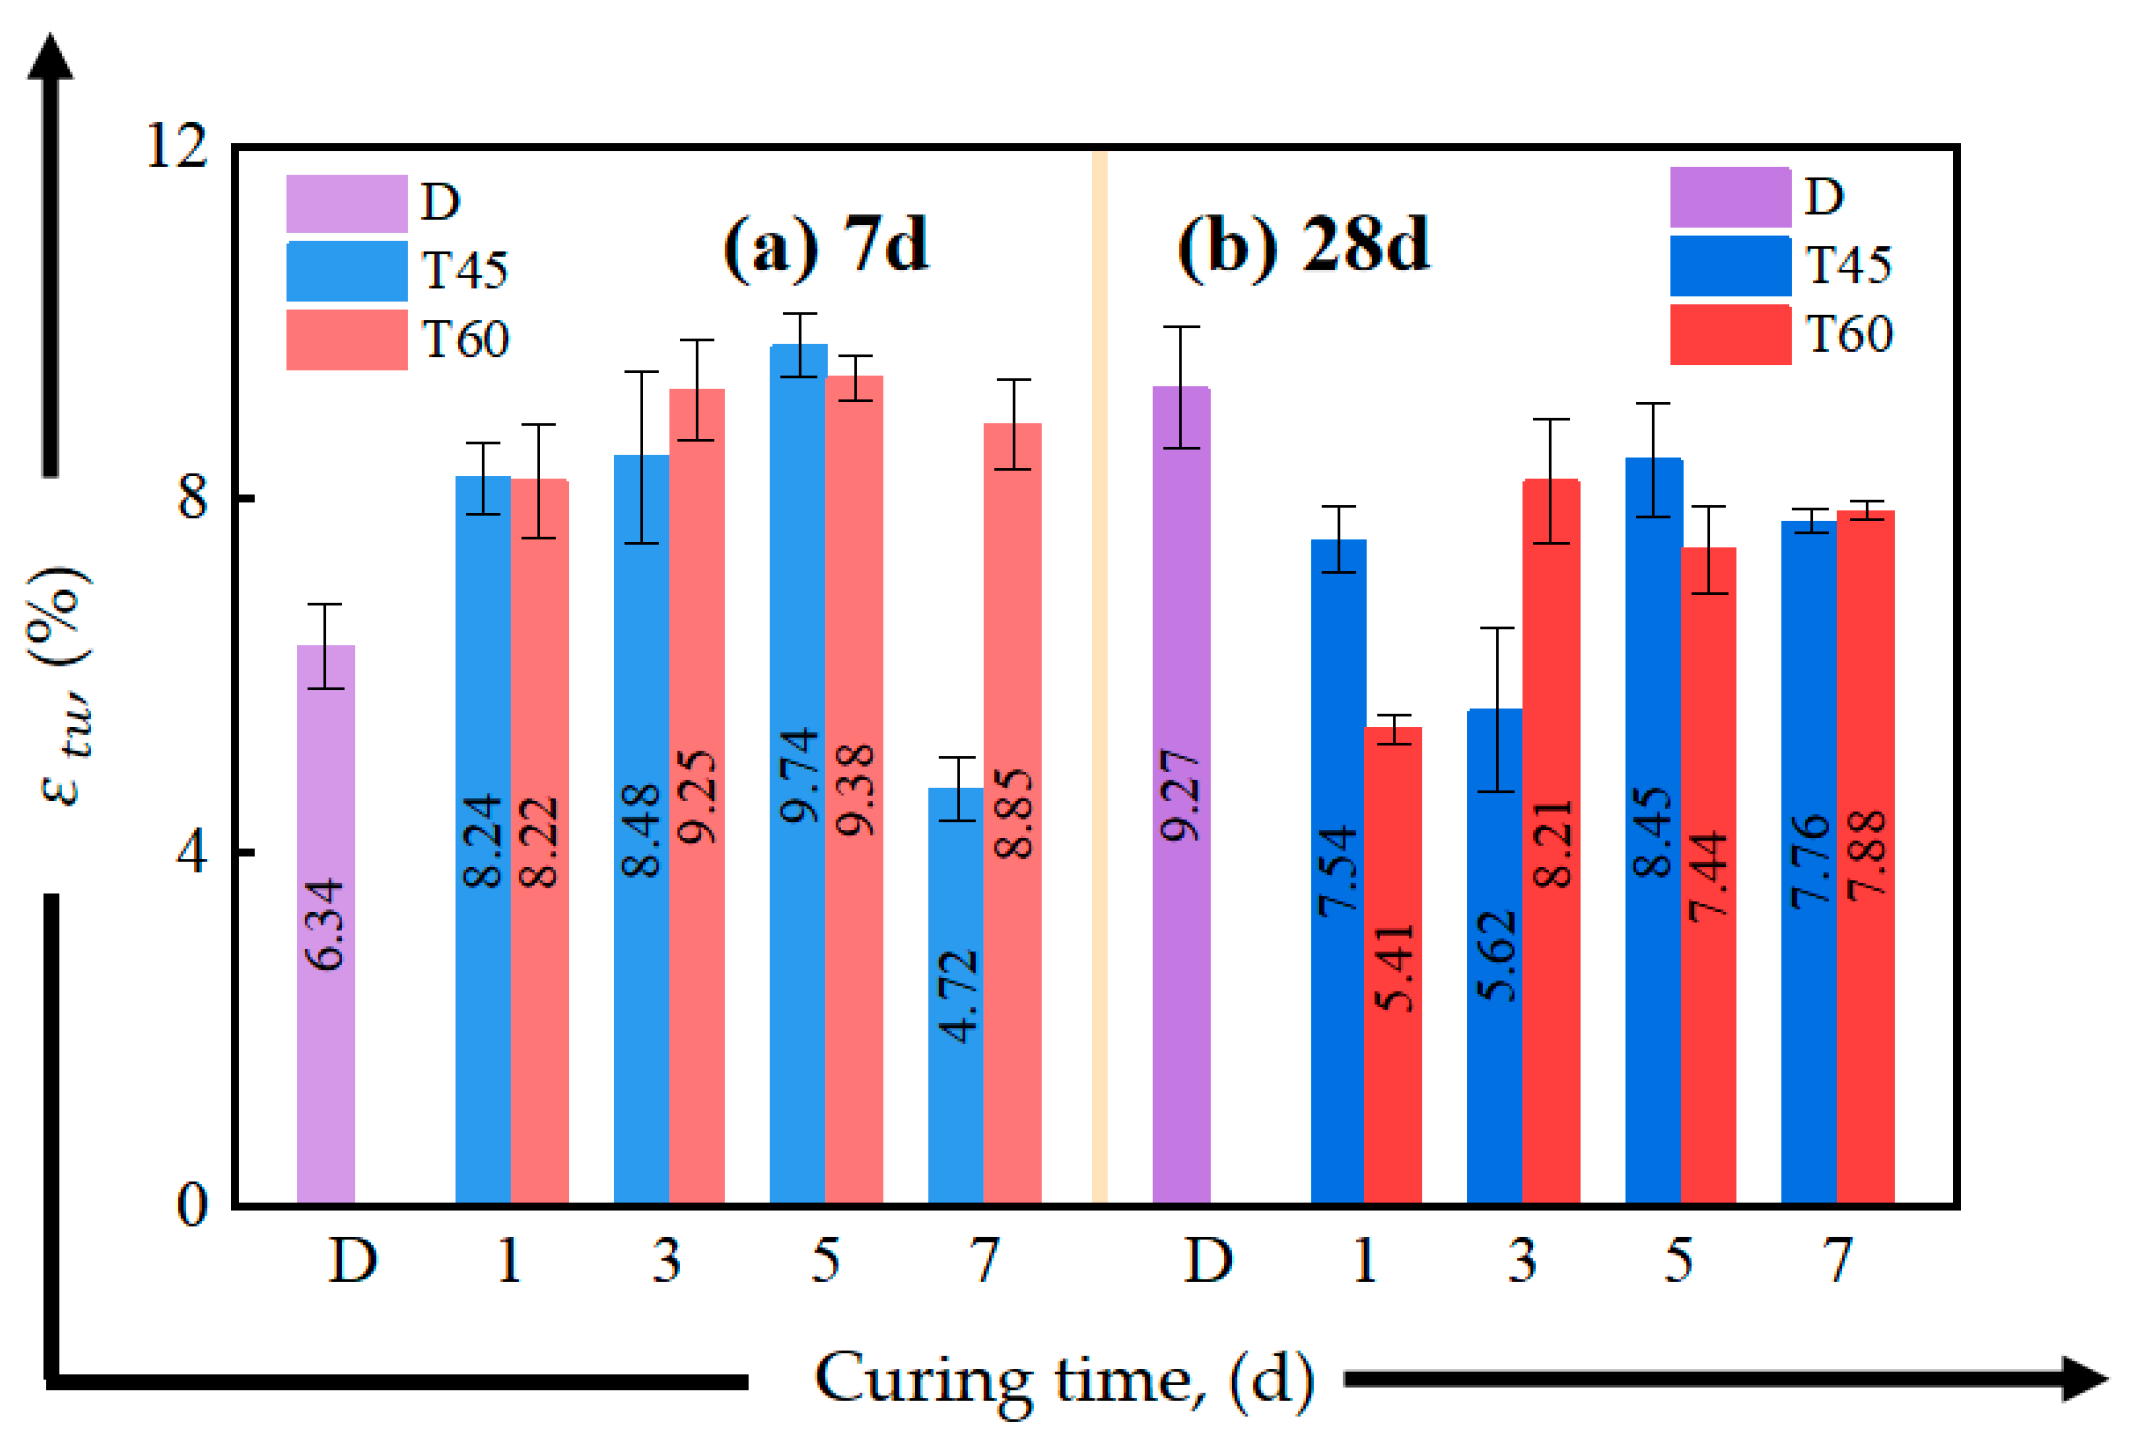
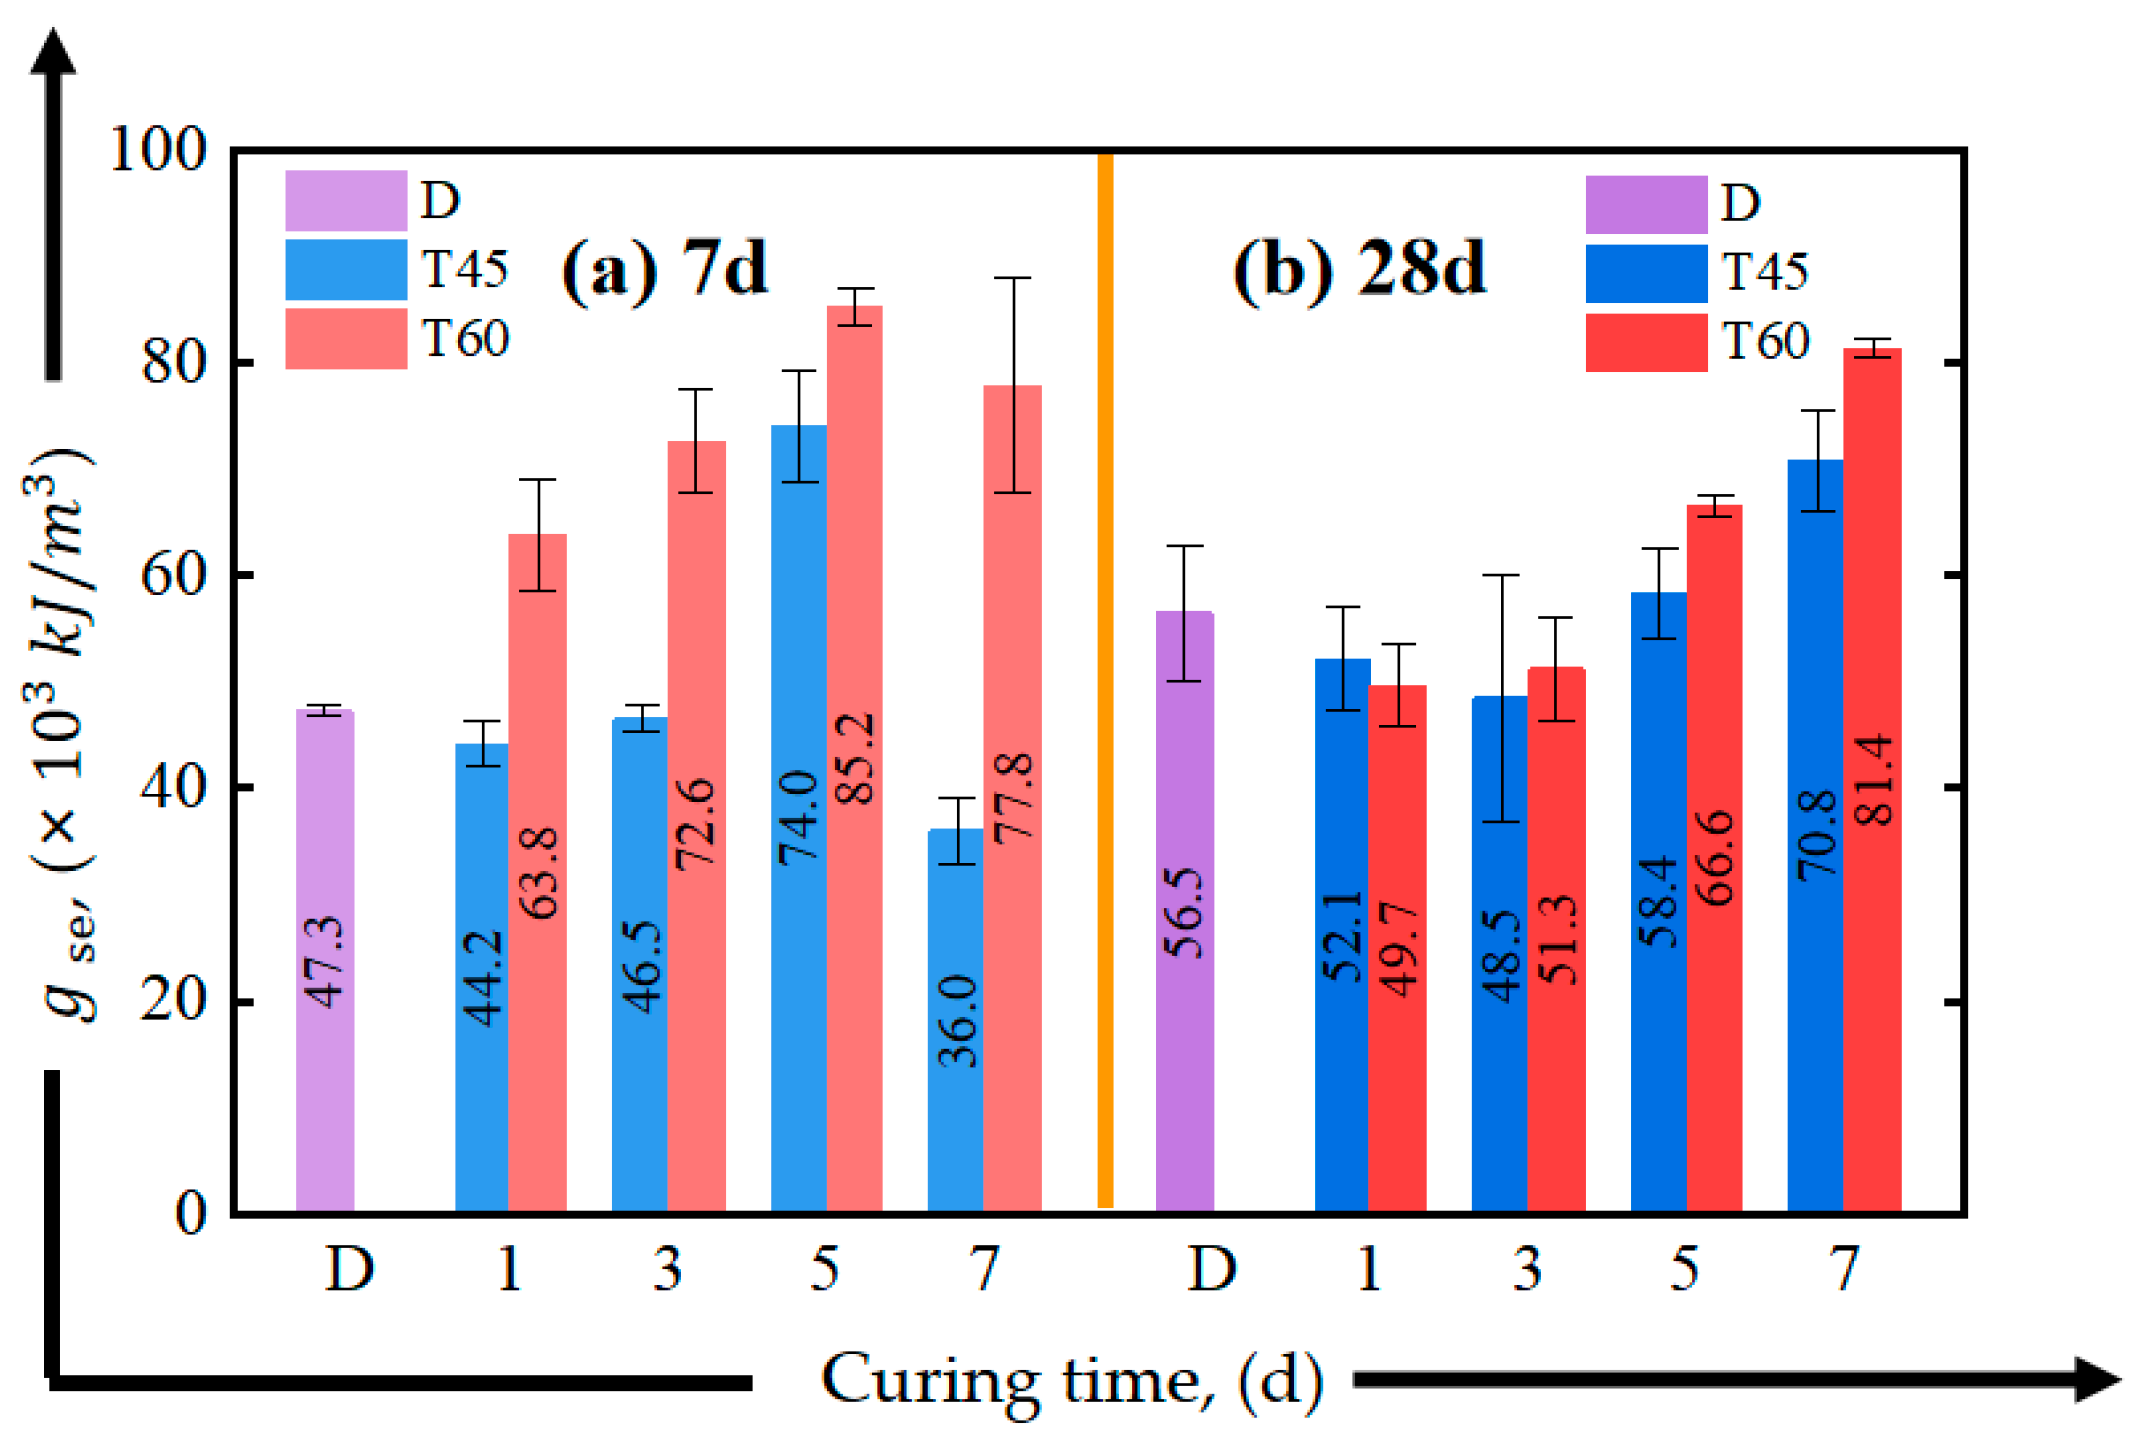
3.2.3. Tensile Properties Parameters
3.3. Microstructure Analysis
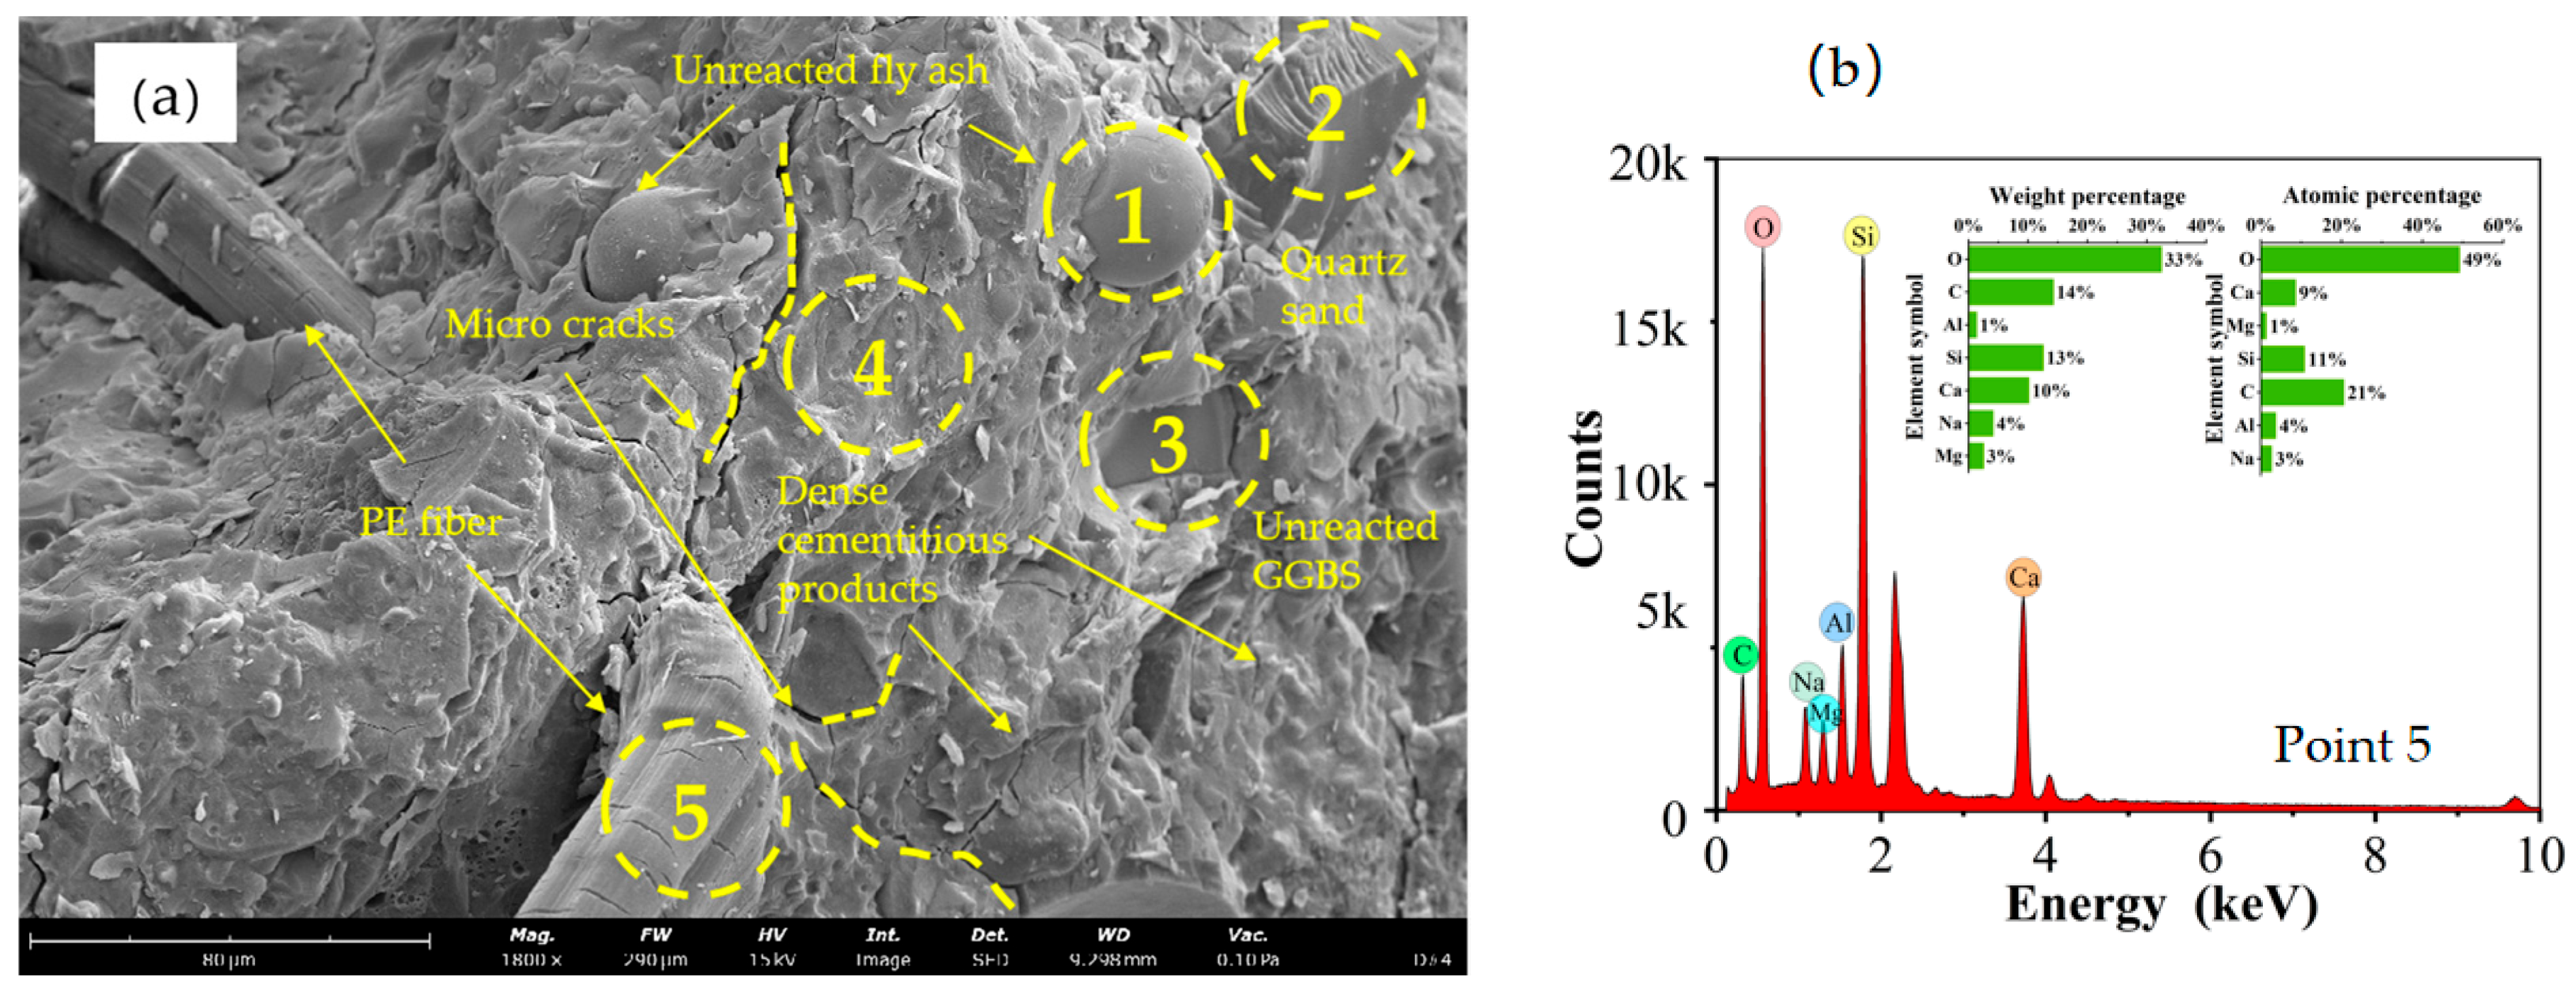
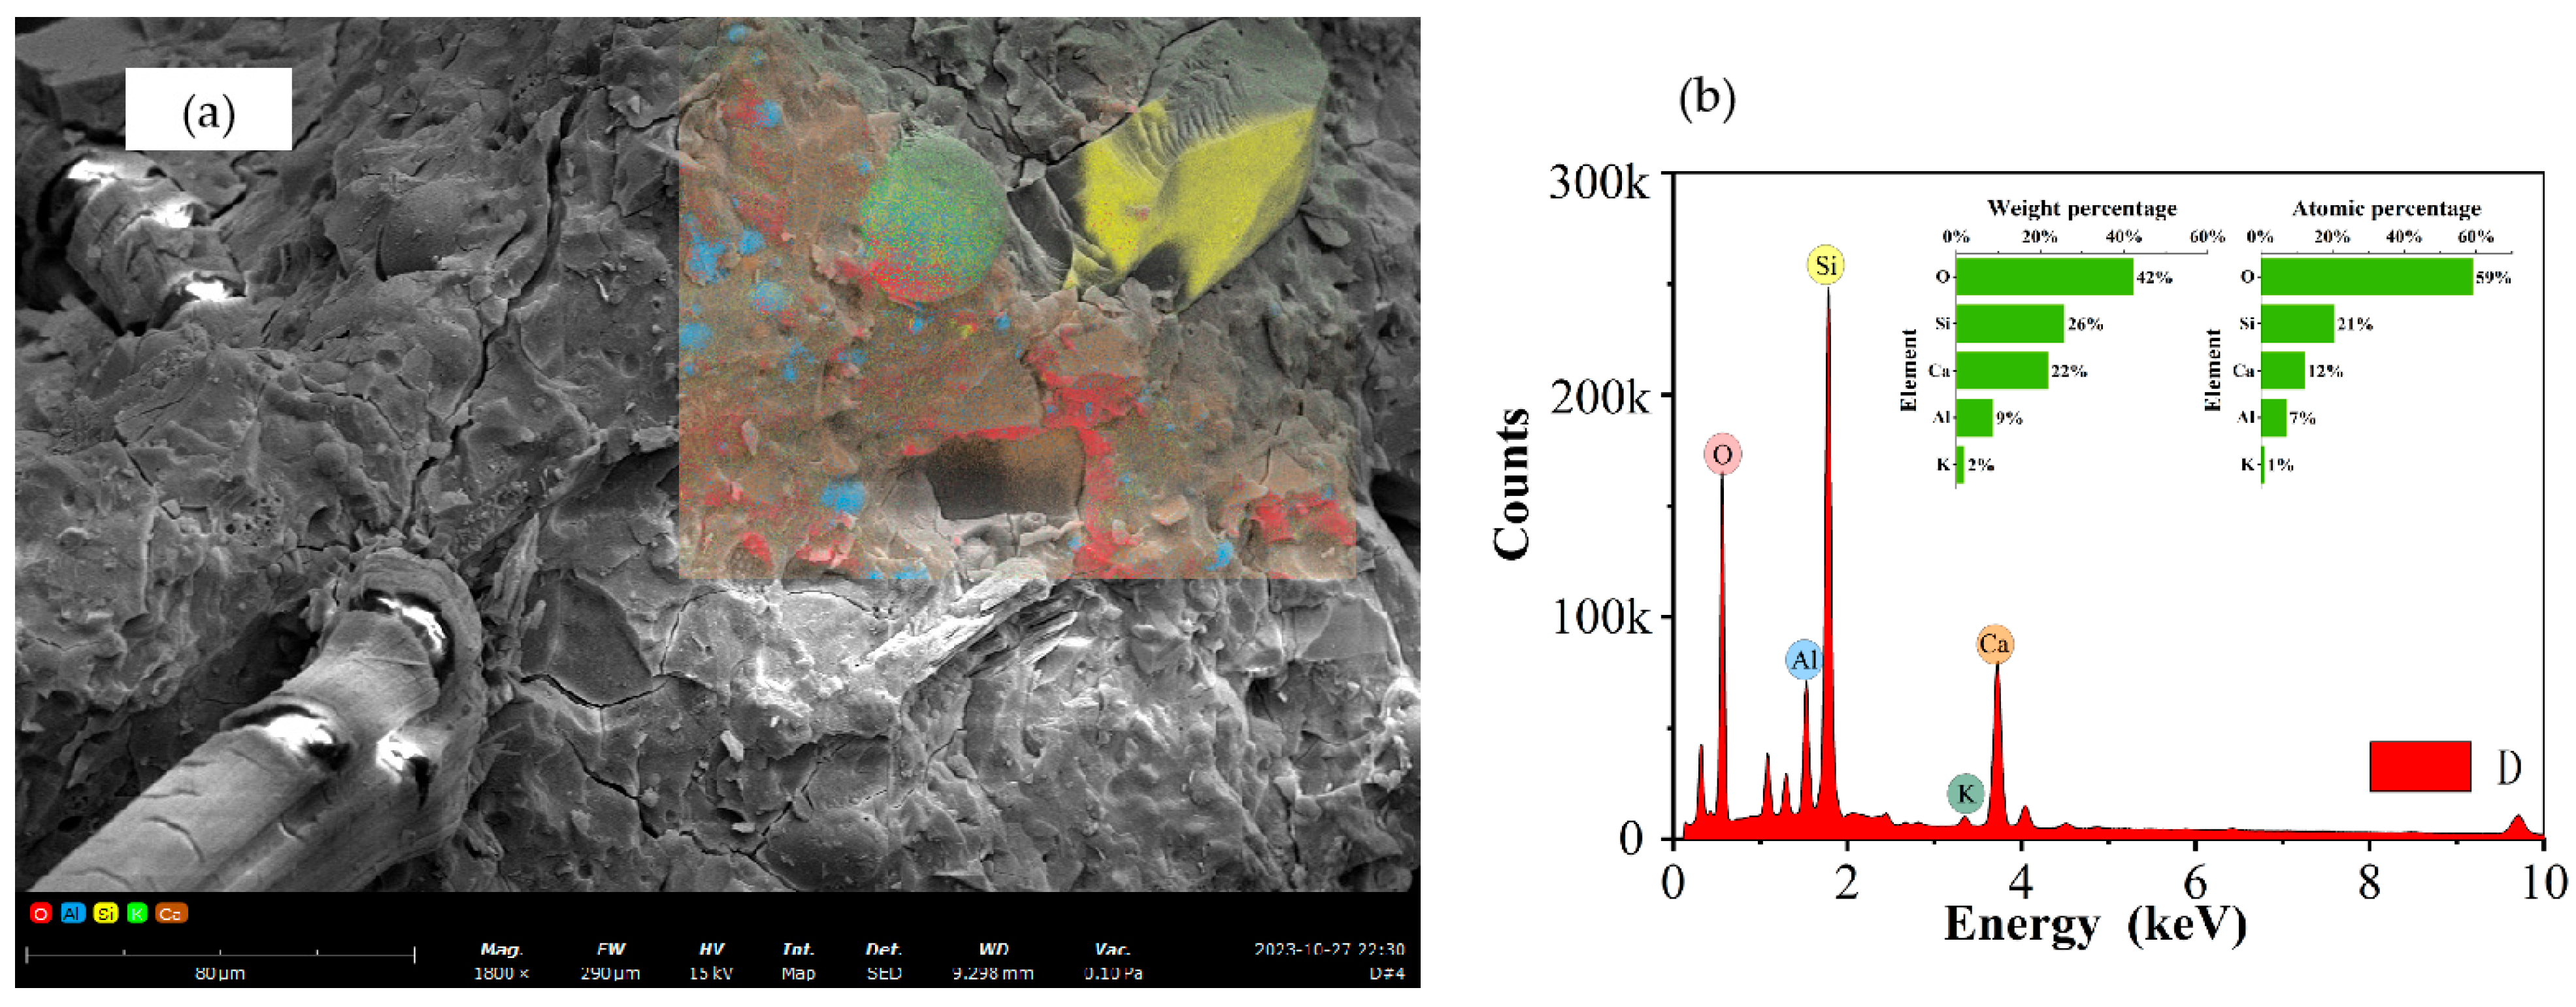
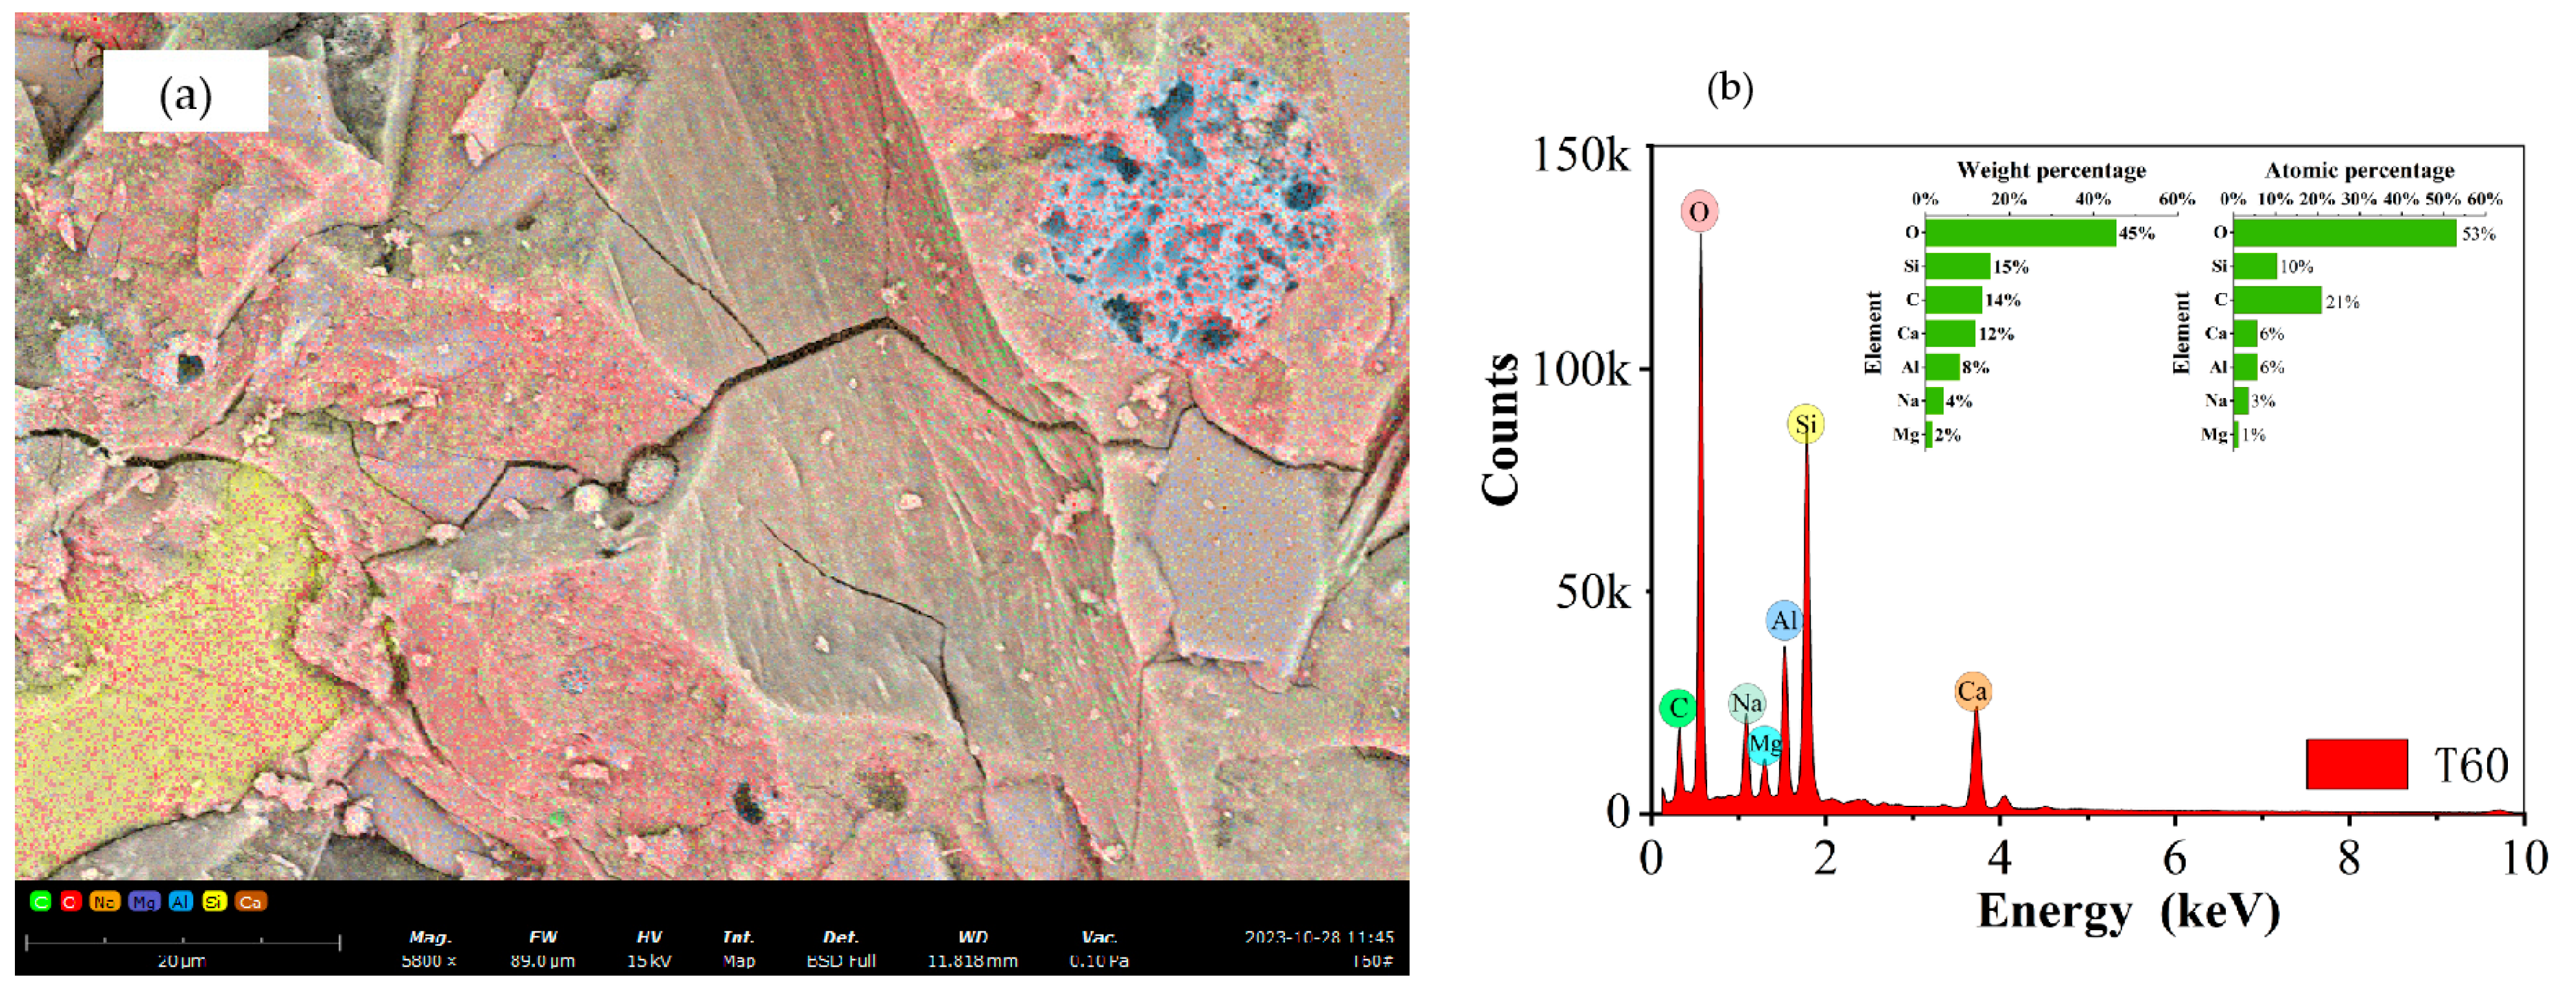
3.3.1. The Influence of Curing Temperature on the Development of the Matrix
3.3.2. The Influence of Curing Temperature on the Bonding between Matrix and Fiber
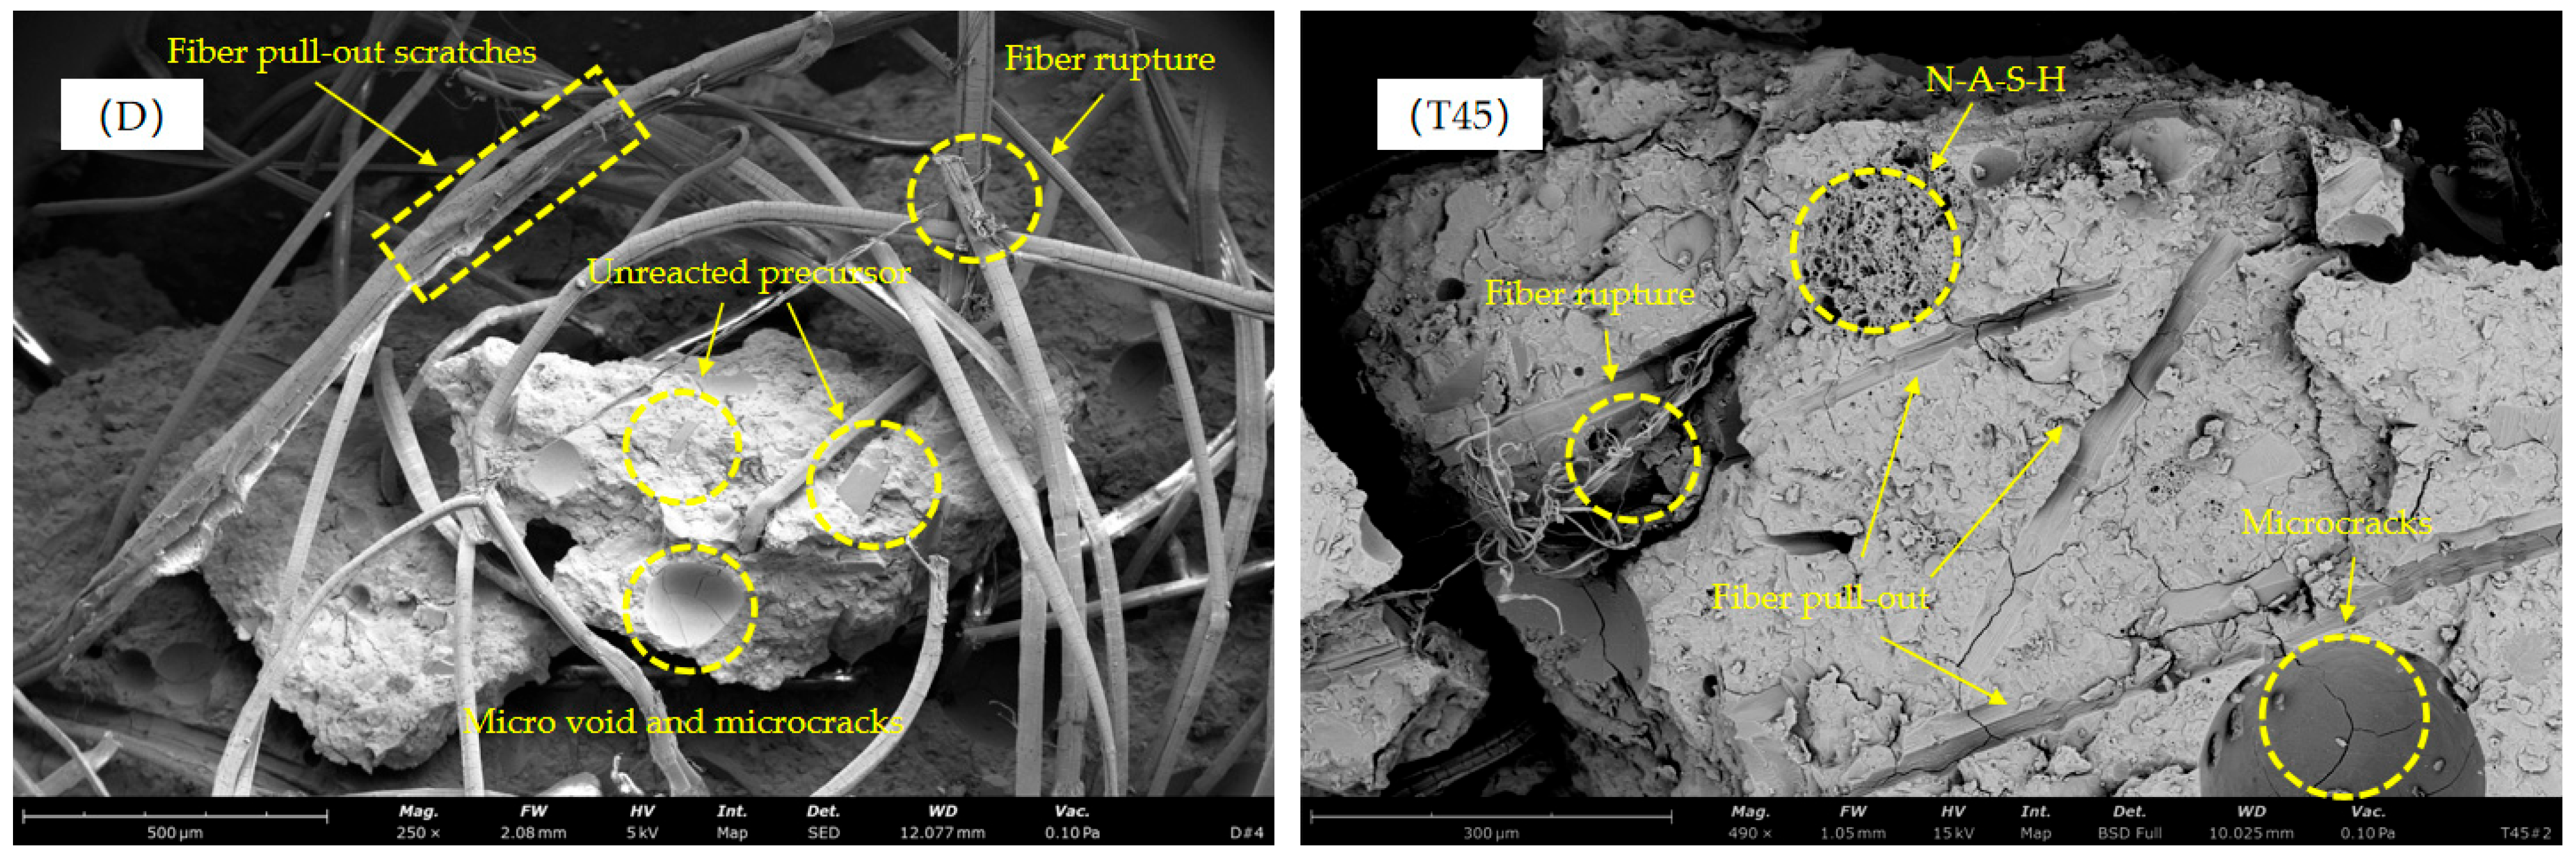
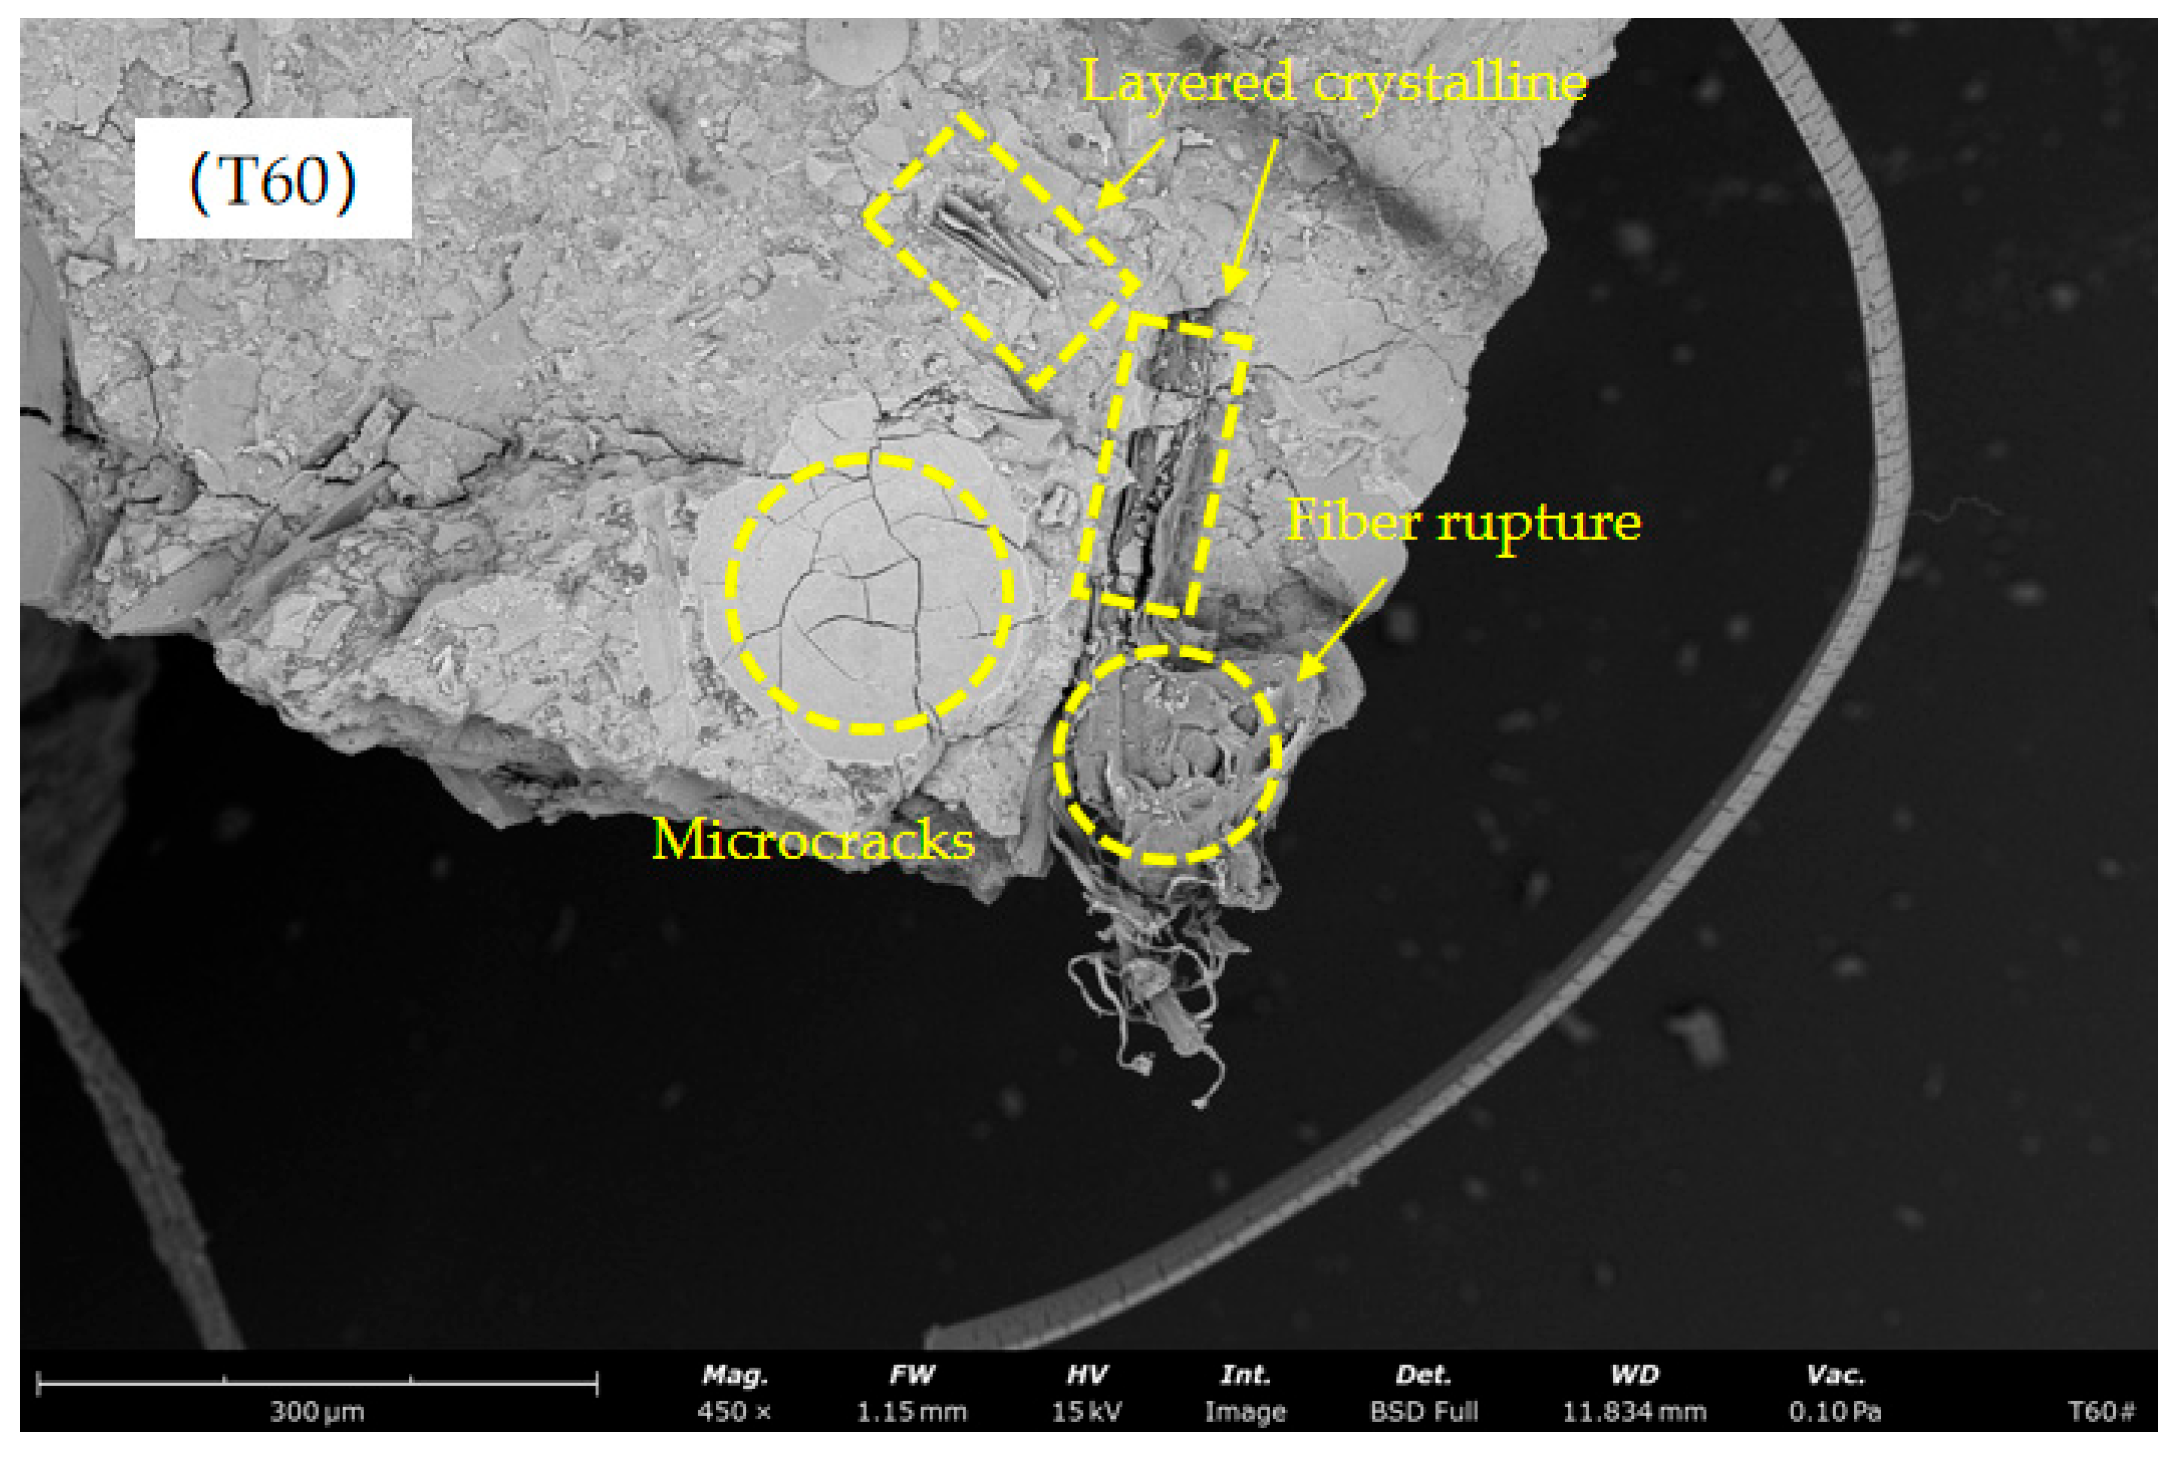
3.3.3. The Influence of Curing Temperature on the Fiber Failure Mode
4. Conclusions
Author Contributions
Funding
Institutional Review Board Statement
Informed Consent Statement
Data Availability Statement
Conflicts of Interest
References
- Almutairi, A.L.; Tayeh, B.A.; Adesina, A.; Isleem, H.F.; Zeyad, A.M. Potential applications of geopolymer concrete in construction: A review. Case Stud. Constr. Mater. 2021, 15, e00733. [Google Scholar] [CrossRef]
- Chen, G.; Zheng, D.-p.; Chen, Y.-w.; Lin, J.-X.; Lao, W.-j.; Guo, Y.-c.; Chen, Z.-b.; Lan, X.-w. Development of high performance geopolymer concrete with waste rubber and recycle steel fiber: A study on compressive behavior, carbon emissions and economical performance. Constr. Build. Mater. 2023, 393, 131988. [Google Scholar] [CrossRef]
- Pan, H.; Xie, Z.; Chen, G.; Su, J.; Zhuo, K.; Chen, Z.; Lin, J.; Feng, C.; Guo, Y. Dynamic compressive behavior of high-strength engineered geopolymer composites. J. Build. Eng. 2023, 80, 108036. [Google Scholar] [CrossRef]
- Miri, M.; Ghasemi, M.R.; Nezhad, H.B. Experimental Investigation of Corrosion Cracking in Reinforced Concrete Beams Containing Nano Wollastonite. J. Rehabil. Civ. Eng. 2019, 7, 117–138. [Google Scholar]
- Yu, J.; Yao, J.; Lin, X.; Li, H.; Lam, J.Y.K.; Leung, C.K.Y.; Sham, I.M.L.; Shih, K. Tensile performance of sustainable Strain-Hardening Cementitious Composites with hybrid PVA and recycled PET fibers. Cem. Concr. Res. 2018, 107, 110–123. [Google Scholar] [CrossRef]
- Şahmaran, M.; Özbay, E.; Yücel, H.; Lachemi, M.; Li, V. Effect of Fly Ash and PVA Fiber on Microstructural Damage and Residual Properties of Engineered Cementitious Composites Exposed to High Temperatures. J. Mater. Civ. Eng. 2011, 23, 1735–1745. [Google Scholar] [CrossRef]
- Liu, J.-C.; Tan, K.H. Mechanism of PVA fibers in mitigating explosive spalling of engineered cementitious composite at elevated temperature. Cem. Concr. Compos. 2018, 93, 235–245. [Google Scholar] [CrossRef]
- Lin, J.-X.; Song, Y.; Xie, Z.-H.; Guo, Y.-C.; Yuan, B.; Zeng, J.-J.; Wei, X. Static and dynamic mechanical behavior of engineered cementitious composites with PP and PVA fibers. J. Build. Eng. 2020, 29, 101097. [Google Scholar] [CrossRef]
- Ranade, R.; Li, V.; Stults, M.D.; Heard, W.; Rushing, T. Composite Properties of High-Strength, High-Ductility Concrete. ACI Mater. J. 2013, 110, 413–422. [Google Scholar]
- Zhu, B.; Pan, J.; Zhang, M.; Leung, C.K.Y. Predicting the strain-hardening behaviour of polyethylene fibre reinforced engineered cementitious composites accounting for fibre-matrix interaction. Cem. Concr. Compos. 2022, 134, 104770. [Google Scholar] [CrossRef]
- Zhang, Z.; Qin, F.; Ma, H.; Xu, L. Tailoring an impact resistant engineered cementitious composite (ECC) by incorporation of crumb rubber. Constr. Build. Mater. 2020, 262, 120116. [Google Scholar] [CrossRef]
- Duxson, P.; Fernández-Jiménez, A.; Provis, J.L.; Lukey, G.C.; Palomo, A.; van Deventer, J.S.J. Geopolymer technology: The current state of the art. J. Mater. Sci. 2007, 42, 2917–2933. [Google Scholar] [CrossRef]
- Shi, C.; Jiménez, A.F.; Palomo, A. New cements for the 21st century: The pursuit of an alternative to Portland cement. Cem. Concr. Res. 2011, 41, 750–763. [Google Scholar] [CrossRef]
- Valentini, L. Modeling Dissolution–Precipitation Kinetics of Alkali-Activated Metakaolin. ACS Omega 2018, 3, 18100–18108. [Google Scholar] [CrossRef] [PubMed]
- Li, Z.; Xu, Y.; Wu, C.; Zhang, W.; Chen, Y.; Li, Y. Preparation and Research on Mechanical Properties of Eco-Friendly Geopolymer Grouting Cementitious Materials Based on Industrial Solid Wastes. Materials 2024, 17, 3874. [Google Scholar] [CrossRef] [PubMed]
- Ling, Y.; Zhang, X.; Wu, Y.; Zou, W.; Wang, C.; Li, C.; Li, W. Evaluation of Bonding Behavior between Engineered Geopolymer Composites with Hybrid PE/PVA Fibers and Concrete Substrate. Materials 2024, 17, 3778. [Google Scholar] [CrossRef] [PubMed]
- Ohno, M.; Li, V.C. A feasibility study of strain hardening fiber reinforced fly ash-based geopolymer composites. Constr. Build. Mater. 2014, 57, 163–168. [Google Scholar] [CrossRef]
- He, P.; Wang, M.; Fu, S.; Jia, D.; Yan, S.; Yuan, J.; Xu, J.; Wang, P.; Zhou, Y. Effects of Si/Al ratio on the structure and properties of metakaolin based geopolymer. Ceram. Int. 2016, 42, 14416–14422. [Google Scholar] [CrossRef]
- Assi, L.N.; Eddie Deaver, E.; Ziehl, P. Effect of source and particle size distribution on the mechanical and microstructural properties of fly Ash-Based geopolymer concrete. Constr. Build. Mater. 2018, 167, 372–380. [Google Scholar] [CrossRef]
- Wan, Q.; Rao, F.; Song, S.; García, R.E.; Estrella, R.M.; Patiño, C.L.; Zhang, Y. Geopolymerization reaction, microstructure and simulation of metakaolin-based geopolymers at extended Si/Al ratios. Cem. Concr. Compos. 2017, 79, 45–52. [Google Scholar] [CrossRef]
- Liew, Y.M.; Kamarudin, H.; Mustafa Al Bakri, A.M.; Bnhussain, M.; Luqman, M.; Khairul Nizar, I.; Ruzaidi, C.M.; Heah, C.Y. Optimization of solids-to-liquid and alkali activator ratios of calcined kaolin geopolymeric powder. Constr. Build. Mater. 2012, 37, 440–451. [Google Scholar] [CrossRef]
- Fardjaoui, N.E.H.; Wicklein, B.; Aranda, P.; Sobrados, I.; El Berrichi, F.Z.; Ruiz-Hitzky, E. Modulation of inorganic matrices for functional nanoarchitectures fabrication: The simultaneous effect of moisture and temperature in the preparation of metakaolin based geopolymers. Bull. Chem. Soc. Jpn. 2018, 91, 1158–1167. [Google Scholar] [CrossRef]
- Görhan, G.; Aslaner, R.; Şinik, O. The effect of curing on the properties of metakaolin and fly ash-based geopolymer paste. Compos. Part B Eng. 2016, 97, 329–335. [Google Scholar] [CrossRef]
- Singh, G.V.P.B.; Subramaniam, K.V.L. Influence of processing temperature on the reaction product and strength gain in alkali-activated fly ash. Cem. Concr. Compos. 2019, 95, 10–18. [Google Scholar] [CrossRef]
- ASTM-C511; Standard Specification for Mixing Rooms, Moist Cabinets, Moist Rooms, and Water Storage Tanks Used in the Testing of Hydraulic Cements and Concretes. ASTM Standards: West Conshohocken, PA, USA, 2021.
- Narayanan, A.; Shanmugasundaram, P. An Experimental Investigation on Flyash-based Geopolymer Mortar under different curing regime for Thermal Analysis. Energy Build. 2017, 138, 539–545. [Google Scholar] [CrossRef]
- Helmy, A.I.I. Intermittent curing of fly ash geopolymer mortar. Constr. Build. Mater. 2016, 110, 54–64. [Google Scholar] [CrossRef]
- de Vargas, A.S.; Dal Molin, D.C.C.; Vilela, A.C.F.; Silva, F.J.d.; Pavão, B.; Veit, H. The effects of Na2O/SiO2molar ratio, curing temperature and age on compressive strength, morphology and microstructure of alkali-activated fly ash-based geopolymers. Cem. Concr. Compos. 2011, 33, 653–660. [Google Scholar] [CrossRef]
- Mo, B.-h.; Zhu, H.; Cui, X.-m.; He, Y.; Gong, S.-y. Effect of curing temperature on geopolymerization of metakaolin-based geopolymers. Appl. Clay Sci. 2014, 99, 144–148. [Google Scholar] [CrossRef]
- Hardjito, D. Studies of Fly Ash-Based Geopolymer Concrete. Ph.D. Thesis, Curtin University, Perth, Australia, 2005. [Google Scholar]
- Temuujin, J.; Williams, R.P.; van Riessen, A. Effect of mechanical activation of fly ash on the properties of geopolymer cured at ambient temperature. J. Mater. Process. Technol. 2009, 209, 5276–5280. [Google Scholar] [CrossRef]
- Palomo, A.; Grutzeck, M.W.; Blanco, M.T. Alkali-activated fly ashes: A cement for the future. Cem. Concr. Res. 1999, 29, 1323–1329. [Google Scholar] [CrossRef]
- Chindaprasirt, P.; Chareerat, T.; Hatanaka, S.; Cao, T. High-Strength Geopolymer Using Fine High-Calcium Fly Ash. J. Mater. Civ. Eng. 2011, 23, 264–270. [Google Scholar] [CrossRef]
- Bakria, A.M.M.A.; Kamarudin, H.; BinHussain, M.; Nizar, I.K.; Zarina, Y.; Rafiza, A.R. The Effect of Curing Temperature on Physical and Chemical Properties of Geopolymers. Phys. Procedia 2011, 22, 286–291. [Google Scholar] [CrossRef]
- Verma, M.; Dev, N. Effect of ground granulated blast furnace slag and fly ash ratio and the curing conditions on the mechanical properties of geopolymer concrete. Struct. Concr. 2022, 23, 2015–2029. [Google Scholar] [CrossRef]
- Kürklü, G. The effect of high temperature on the design of blast furnace slag and coarse fly ash-based geopolymer mortar. Compos. Part B Eng. 2016, 92, 9–18. [Google Scholar] [CrossRef]
- Türker, H.T.; Balçikanli, M.; Durmuş, İ.H.; Özbay, E.; Erdemir, M. Microstructural alteration of alkali activated slag mortars depend on exposed high temperature level. Constr. Build. Mater. 2016, 104, 169–180. [Google Scholar] [CrossRef]
- Li, X.; Wang, Z.; Jiao, Z. Influence of Curing on the Strength Development of Calcium-Containing Geopolymer Mortar. Materials 2013, 6, 5069–5076. [Google Scholar] [CrossRef]
- Yankwa Djobo, J.N.; Elimbi, A.; Kouamo Tchakouté, H.; Kumar, S. Mechanical properties and durability of volcanic ash based geopolymer mortars. Constr. Build. Mater. 2016, 124, 606–614. [Google Scholar] [CrossRef]
- Nasvi, M.; Pathegama, R.; Sanjayan, J. Geopolymer as well cement and variation of its mechanical behavior with curing temperature. Greenh. Gases Sci. Technol. 2012, 2, 46–58. [Google Scholar] [CrossRef]
- Görhan, G.; Kürklü, G. The influence of the NaOH solution on the properties of the fly ash-based geopolymer mortar cured at different temperatures. Compos. Part B Eng. 2014, 58, 371–377. [Google Scholar] [CrossRef]
- Arellano-Aguilar, R.; Burciaga-Díaz, O.; Gorokhovsky, A.; Escalante-García, J.I. Geopolymer mortars based on a low grade metakaolin: Effects of the chemical composition, temperature and aggregate:binder ratio. Constr. Build. Mater. 2014, 50, 642–648. [Google Scholar] [CrossRef]
- Hardjito, D.; Wallah, S.E.; Sumajouw, D.M.J.; Rangan, B.V. On the development of fly ash-based geopolymer concrete. ACI Mater. J. 2004, 101, 467–472. [Google Scholar]
- Atiş, C.D.; Görür, E.B.; Karahan, O.; Bilim, C.; İlkentapar, S.; Luga, E. Very high strength (120MPa) class F fly ash geopolymer mortar activated at different NaOH amount, heat curing temperature and heat curing duration. Constr. Build. Mater. 2015, 96, 673–678. [Google Scholar] [CrossRef]
- Yusuf, M.O.; Megat Johari, M.A.; Ahmad, Z.A.; Maslehuddin, M. Evolution of alkaline activated ground blast furnace slag–ultrafine palm oil fuel ash based concrete. Mater. Des. 2014, 55, 387–393. [Google Scholar] [CrossRef]
- Patankar, S.V.; Ghugal, Y.M.; Jamkar, S.S. Effect of Concentration of Sodium Hydroxide and Degree of Heat Curing on Fly Ash-Based Geopolymer Mortar. Indian J. Mater. Sci. 2014, 2014, 938789. [Google Scholar] [CrossRef]
- Li, X.; Ma, X.; Zhang, S.; Zheng, E. Mechanical Properties and Microstructure of Class C Fly Ash-Based Geopolymer Paste and Mortar. Materials 2013, 6, 1485–1495. [Google Scholar] [CrossRef] [PubMed]
- Guo, X.; Shi, H.; Dick, W.A. Compressive strength and microstructural characteristics of class C fly ash geopolymer. Cem. Concr. Compos. 2010, 32, 142–147. [Google Scholar] [CrossRef]
- Rovnaník, P. Effect of curing temperature on the development of hard structure of metakaolin-based geopolymer. Constr. Build. Mater. 2010, 24, 1176–1183. [Google Scholar] [CrossRef]
- Bakharev, T.; Sanjayan, J.G.; Cheng, Y.-B. Alkali activation of Australian slag cements. Cem. Concr. Res. 1999, 29, 113–120. [Google Scholar] [CrossRef]
- Li, Z.; Liu, S. Influence of Slag as Additive on Compressive Strength of Fly Ash-Based Geopolymer. J. Mater. Civ. Eng. 2007, 19, 470–474. [Google Scholar] [CrossRef]
- Oh, J.E.; Monteiro, P.J.M.; Jun, S.S.; Choi, S.; Clark, S.M. The evolution of strength and crystalline phases for alkali-activated ground blast furnace slag and fly ash-based geopolymers. Cem. Concr. Res. 2010, 40, 189–196. [Google Scholar] [CrossRef]
- Islam, A.; Alengaram, U.J.; Jumaat, M.Z.; Bashar, I.I. The development of compressive strength of ground granulated blast furnace slag-palm oil fuel ash-fly ash based geopolymer mortar. Mater. Design (1980–2015) 2014, 56, 833–841. [Google Scholar] [CrossRef]
- Lv, Y.; Wang, C.; Han, W.; Li, X.; Peng, H. Study of the Mechanical Properties and Microstructure of Alkali-Activated Fly Ash–Slag Composite Cementitious Materials. Polymers 2023, 15, 1903. [Google Scholar] [CrossRef]
- Ismail, I.; Bernal, S.A.; Provis, J.L.; San Nicolas, R.; Hamdan, S.; van Deventer, J.S.J. Modification of phase evolution in alkali-activated blast furnace slag by the incorporation of fly ash. Cem. Concr. Compos. 2014, 45, 125–135. [Google Scholar] [CrossRef]
- Puertas, F.; Martínez-Ramírez, S.; Alonso, S.; Vázquez, T. Alkali-activated fly ash/slag cements: Strength behaviour and hydration products. Cem. Concr. Res. 2000, 30, 1625–1632. [Google Scholar] [CrossRef]
- Nath, S.K.; Maitra, S.; Mukherjee, S.; Kumar, S. Microstructural and morphological evolution of fly ash based geopolymers. Constr. Build. Mater. 2016, 111, 758–765. [Google Scholar] [CrossRef]
- Su, J.-y.; Chen, G.; Pan, H.-s.; Lin, J.-X.; Zhang, J.; Zhuo, K.-x.; Chen, Z.-b.; Guo, Y.-c. Rubber modified high strength-high ductility concrete: Effect of rubber replacement ratio and fiber length. Constr. Build. Mater. 2023, 404, 133243. [Google Scholar] [CrossRef]
- GB/T-50146-2014; Technical Code for Application of Fly Ash Concrete. China Architecture & Building Press: Beijing, China, 2014.
- GB/T-18046-2017; Ground Granulated Blast Furnace Slag Used for Cement, Mortar and Concrete. General Administration of Quality Supervision, Inspection and Quarantine, The People’s Republic of China: Beijing, China, 2017.
- Tosun-Felekoğlu, K.; Felekoğlu, B.; Ranade, R.; Lee, B.Y.; Li, V.C. The role of flaw size and fiber distribution on tensile ductility of PVA-ECC. Compos. Part B Eng. 2014, 56, 536–545. [Google Scholar] [CrossRef]
- ASTM-C496; Standard Test Method for Splitting Tensile Strength of Cylindrical Concrete Specimens. ASTM Standards: West Conshohocken, PA, USA, 2011.
- JC/T2461-2018; Standard Test Method for the Mechanical Properties of Ductile Fiber Reinforcedcementitious Composites. Ministry of Industry and Information Technology of the People’s Republic of China: Beijing, China, 2018.
- Nasir, M.; Johari, M.A.M.; Maslehuddin, M.; Yusuf, M.O.; Al-Harthi, M.A. Influence of heat curing period and temperature on the strength of silico-manganese fume-blast furnace slag-based alkali-activated mortar. Constr. Build. Mater. 2020, 251, 118961. [Google Scholar] [CrossRef]
- Khale, D.; Chaudhary, R. Mechanism of geopolymerization and factors influencing its development: A review. J. Mater. Sci. 2007, 42, 729–746. [Google Scholar] [CrossRef]
- Heah, C.Y.; Kamarudin, H.; Bakri, A.M.M.A.; Binhussain, M.; Luqman, M.; Nizar, I.K.; Ruzaidi, C.M.; Liew, Y.M. Effect of Curing Profile on Kaolin-based Geopolymers. Phys. Procedia 2011, 22, 305–311. [Google Scholar] [CrossRef]
- Zhang, B.; Yuan, P.; Guo, H.; Deng, L.; Li, Y.; Li, L.; Wang, Q.; Liu, D. Effect of curing conditions on the microstructure and mechanical performance of geopolymers derived from nanosized tubular halloysite. Constr. Build. Mater. 2021, 268, 121186. [Google Scholar] [CrossRef]
- Palomo, A.; Blanco-Varela, M.T.; Granizo, M.L.; Puertas, F.; Vazquez, T.; Grutzeck, M.W. Chemical stability of cementitious materials based on metakaolin. Cem. Concr. Res. 1999, 29, 997–1004. [Google Scholar] [CrossRef]
- Kanda, T.; Li, V.C. Multiple Cracking Sequence and Saturation in Fiber Reinforced Cementitious Composites. Jpn. Concr. Inst. 1998, 9, 19–33. [Google Scholar]
- Lin, J.-X.; Chen, G.; Pan, H.-s.; Wang, Y.-c.; Guo, Y.-c.; Jiang, Z.-x. Analysis of stress-strain behavior in engineered geopolymer composites reinforced with hybrid PE-PP fibers: A focus on cracking characteristics. Compos. Struct. 2023, 323, 117437. [Google Scholar] [CrossRef]
- Lin, J.-X.; Luo, R.-H.; Su, J.-Y.; Guo, Y.-C.; Chen, W.-S. Coarse synthetic fibers (PP and POM) as a replacement to steel fibers in UHPC: Tensile behavior, environmental and economic assessment. Constr. Build. Mater. 2024, 412, 134654. [Google Scholar] [CrossRef]
- Wille, K.; El-Tawil, S.; Naaman, A.E. Properties of strain hardening ultra high performance fiber reinforced concrete (UHP-FRC) under direct tensile loading. Cem. Concr. Compos. 2014, 48, 53–66. [Google Scholar] [CrossRef]
- Samarakoon, M.H.; Ranjith, P.G.; Duan, W.H.; De Silva, V.R.S. Properties of one-part fly ash/slag-based binders activated by thermally-treated waste glass/NaOH blends: A comparative study. Cem. Concr. Compos. 2020, 112, 103679. [Google Scholar] [CrossRef]


| Property Parameters. | CaO | SiO2 | Al2O3 | SO3 | Fe2O3 | MgO | TiO2 | Other | Loss on Ignition (%) | Density (g/cm3) |
|---|---|---|---|---|---|---|---|---|---|---|
| wt % | ||||||||||
| GGBS | 34.0 | 34.5 | 17.7 | 1.64 | 1.03 | 6.01 | / | 5.12 | 0.840 | 2.90 |
| FA | 4.01 | 54.8 | 31.2 | 2.20 | 4.16 | 1.01 | 1.13 | 2.37 | 4.60 | 2.30 |
| SF | / | 94.7 | / | 0.20 | / | / | / | 5.10 | 3.00 | 0.25 |
| Diameter df (μm) | Length Lf (mm) | Strength (MPa) | Elastic Modulus (GPa) | Elongation (%) | Density (g/cm3) | Melting Temperature (°C) |
|---|---|---|---|---|---|---|
| 20.0 | 6/12/18 | >3000 | >110 | 3.5–4 | 0.970 | 135–145 |
| GGBS | FA | SF | MS | FS | NaOH Solution | Sodium Silicate Solution | Extra Water | PE Fiber | BaCl2 |
|---|---|---|---|---|---|---|---|---|---|
| 924 | 280 | 76.0 | 68.0 | 385 | 105 | 439 | 78.8 | 21.9 | 12.7 |
| Specimen | Compressive Strength (MPa) | Peak Compressive Strain (%) | Elastic Modulus (GPa) |
|---|---|---|---|
| D-7 | 49.9 (0.9) | 0.005 (0.001) | 14.4 (0.9) |
| D-28 | 78.5 (1.5) | 0.004 (0.002) | 21.5 (1.8) |
| T45-1-28 | 60.4 (0.5) | 0.003 (0.001) | 22.9 (2.7) |
| T45-3-28 | 75.9 (1.3) | 0.002 (0.001) | 34.1 (0.7) |
| T45-5-28 | 104 (2.9) | 0.004 (0.003) | 28.1 (1.4) |
| T45-7-28 | 97.8 (4.3) | 0.004 (0.001) | 25.0 (0.5) |
| T60-1-28 | 62.5 (2.8) | 0.005 (0.002) | 13.1 (0.7) |
| T60-3-28 | 60.2 (0.8) | 0.003 (0.001) | 27.8 (3.4) |
| T60-5-28 | 65.2 (3.8) | 0.003 (0.002) | 22.3 (0.6) |
| T60-7-28 | 56.4 (2.4) | 0.004 (0.001) | 15.3 (1.2) |
| T45-5-7 | 67.7 (5.3) | 0.003 (0.001) | 34.3 (5.5) |
| T60-3-7 | 91.979 (6.575) | 0.005 (0.001) | 22.1 (1.1) |
| Specimen | (MPa) | (%) | (MPa) | (%) | kJ/m3) | |
|---|---|---|---|---|---|---|
| D-7 | 3.88 (0.49) | 0.021 (0.006) | 7.19 (0.08) | 6.34 (0.47) | 47.3 (0.5) | 1.86 |
| D-28 | 3.77 (0.60) | 0.022 (0.004) | 7.64 (0.44) | 9.27 (0.69) | 56.6 (6.3) | 2.03 |
| T45-1-7 | 4.08 (0.17) | 0.034 (0.003) | 6.23 (0.09) | 8.24 (0.41) | 44.2 (2.1) | 1.53 |
| T45-3-7 | 4.17 (0.98) | 0.031 (0.007) | 9.19 (0.15) | 8.48 (0.98) | 46.5 (1.2) | 2.21 |
| T45-5-7 | 4.17 (0.52) | 0.021 (0.005) | 9.21 (0.41) | 9.74 (0.36) | 74.0 (5.2) | 2.21 |
| T45-7-7 | 3.71 (0.17) | 0.017 (0.003) | 7.25 (0.21) | 4.71 (0.36) | 36.0 (3.1) | 1.95 |
| T60-1-7 | 3.35 (0.50) | 0.018 (0.004) | 8.09 (0.65) | 8.22 (0.64) | 63.8 (5.2) | 2.42 |
| T60-3-7 | 4.17 (0.97) | 0.032 (0.007) | 10.0 (0.9) | 9.25 (0.57) | 72.6 (5.0) | 2.42 |
| T60-5-7 | 6.16 (0.77) | 0.043 (0.015) | 9.06 (0.02) | 9.38 (0.26) | 85.1 (1.8) | 1.47 |
| T60-7-7 | 3.91 (0.34) | 0.023 (0.004) | 9.29 (0.30) | 8.85 (0.50) | 77.8 (10.1) | 2.37 |
| T45-1-28 | 4.87 (0.55) | 0.025 (0.002) | 9.99 (0.51) | 7.54 (0.37) | 52.1 (4.8) | 2.05 |
| T45-3-28 | 5.40 (0.34) | 0.030 (0.004) | 6.67 (0.14) | 5.62 (0.92) | 48.5 (11.6) | 1.23 |
| T45-5-28 | 2.54 (0.19) | 0.022 (0.002) | 8.60 (0.62) | 8.45 (0.63) | 58.4 (4.2) | 3.39 |
| T45-7-28 | 3.61 (0.19) | 0.018 (0.001) | 10.8 (0.4) | 7.76 (0.14) | 70.8 (4.8) | 2.98 |
| T60-1-28 | 4.63 (0.56) | 0.025 (0.005) | 7.25 (0.28) | 5.41 (0.16) | 49.7 (3.8) | 1.57 |
| T60-3-28 | 3.99 (0.79) | 0.030 (0.002) | 7.28 (0.26) | 8.21 (0.70) | 51.3 (4.9) | 1.82 |
| T60-5-28 | 5.86 (0.42) | 0.029 (0.003) | 9.10 (0.09) | 7.44 (0.49) | 66.6 (0.9) | 1.55 |
| T60-7-28 | 5.78 (0.40) | 0.028 (0.003) | 10.7 (0.3) | 7.88 (0.09) | 81.4 (0.92) | 1.86 |
Disclaimer/Publisher’s Note: The statements, opinions and data contained in all publications are solely those of the individual author(s) and contributor(s) and not of MDPI and/or the editor(s). MDPI and/or the editor(s) disclaim responsibility for any injury to people or property resulting from any ideas, methods, instructions or products referred to in the content. |
© 2024 by the authors. Licensee MDPI, Basel, Switzerland. This article is an open access article distributed under the terms and conditions of the Creative Commons Attribution (CC BY) license (https://creativecommons.org/licenses/by/4.0/).
Share and Cite
Luo, R.; Liu, R.; Qin, G.; Jiang, M.; Wu, Y.; Guo, Y. Study on High-Ductility Geopolymer Concrete: The Influence of Oven Heat Curing Conditions on Mechanical Properties and Microstructural Development. Materials 2024, 17, 4011. https://doi.org/10.3390/ma17164011
Luo R, Liu R, Qin G, Jiang M, Wu Y, Guo Y. Study on High-Ductility Geopolymer Concrete: The Influence of Oven Heat Curing Conditions on Mechanical Properties and Microstructural Development. Materials. 2024; 17(16):4011. https://doi.org/10.3390/ma17164011
Chicago/Turabian StyleLuo, Ruihao, Runan Liu, Guang Qin, Minyang Jiang, Yixian Wu, and Yongchang Guo. 2024. "Study on High-Ductility Geopolymer Concrete: The Influence of Oven Heat Curing Conditions on Mechanical Properties and Microstructural Development" Materials 17, no. 16: 4011. https://doi.org/10.3390/ma17164011