
Ionic Twin Nanostructural Comparison: Propylammonium Butanoate vs. Butylammonium Propanoate and Their Interactions with Water


Abstract
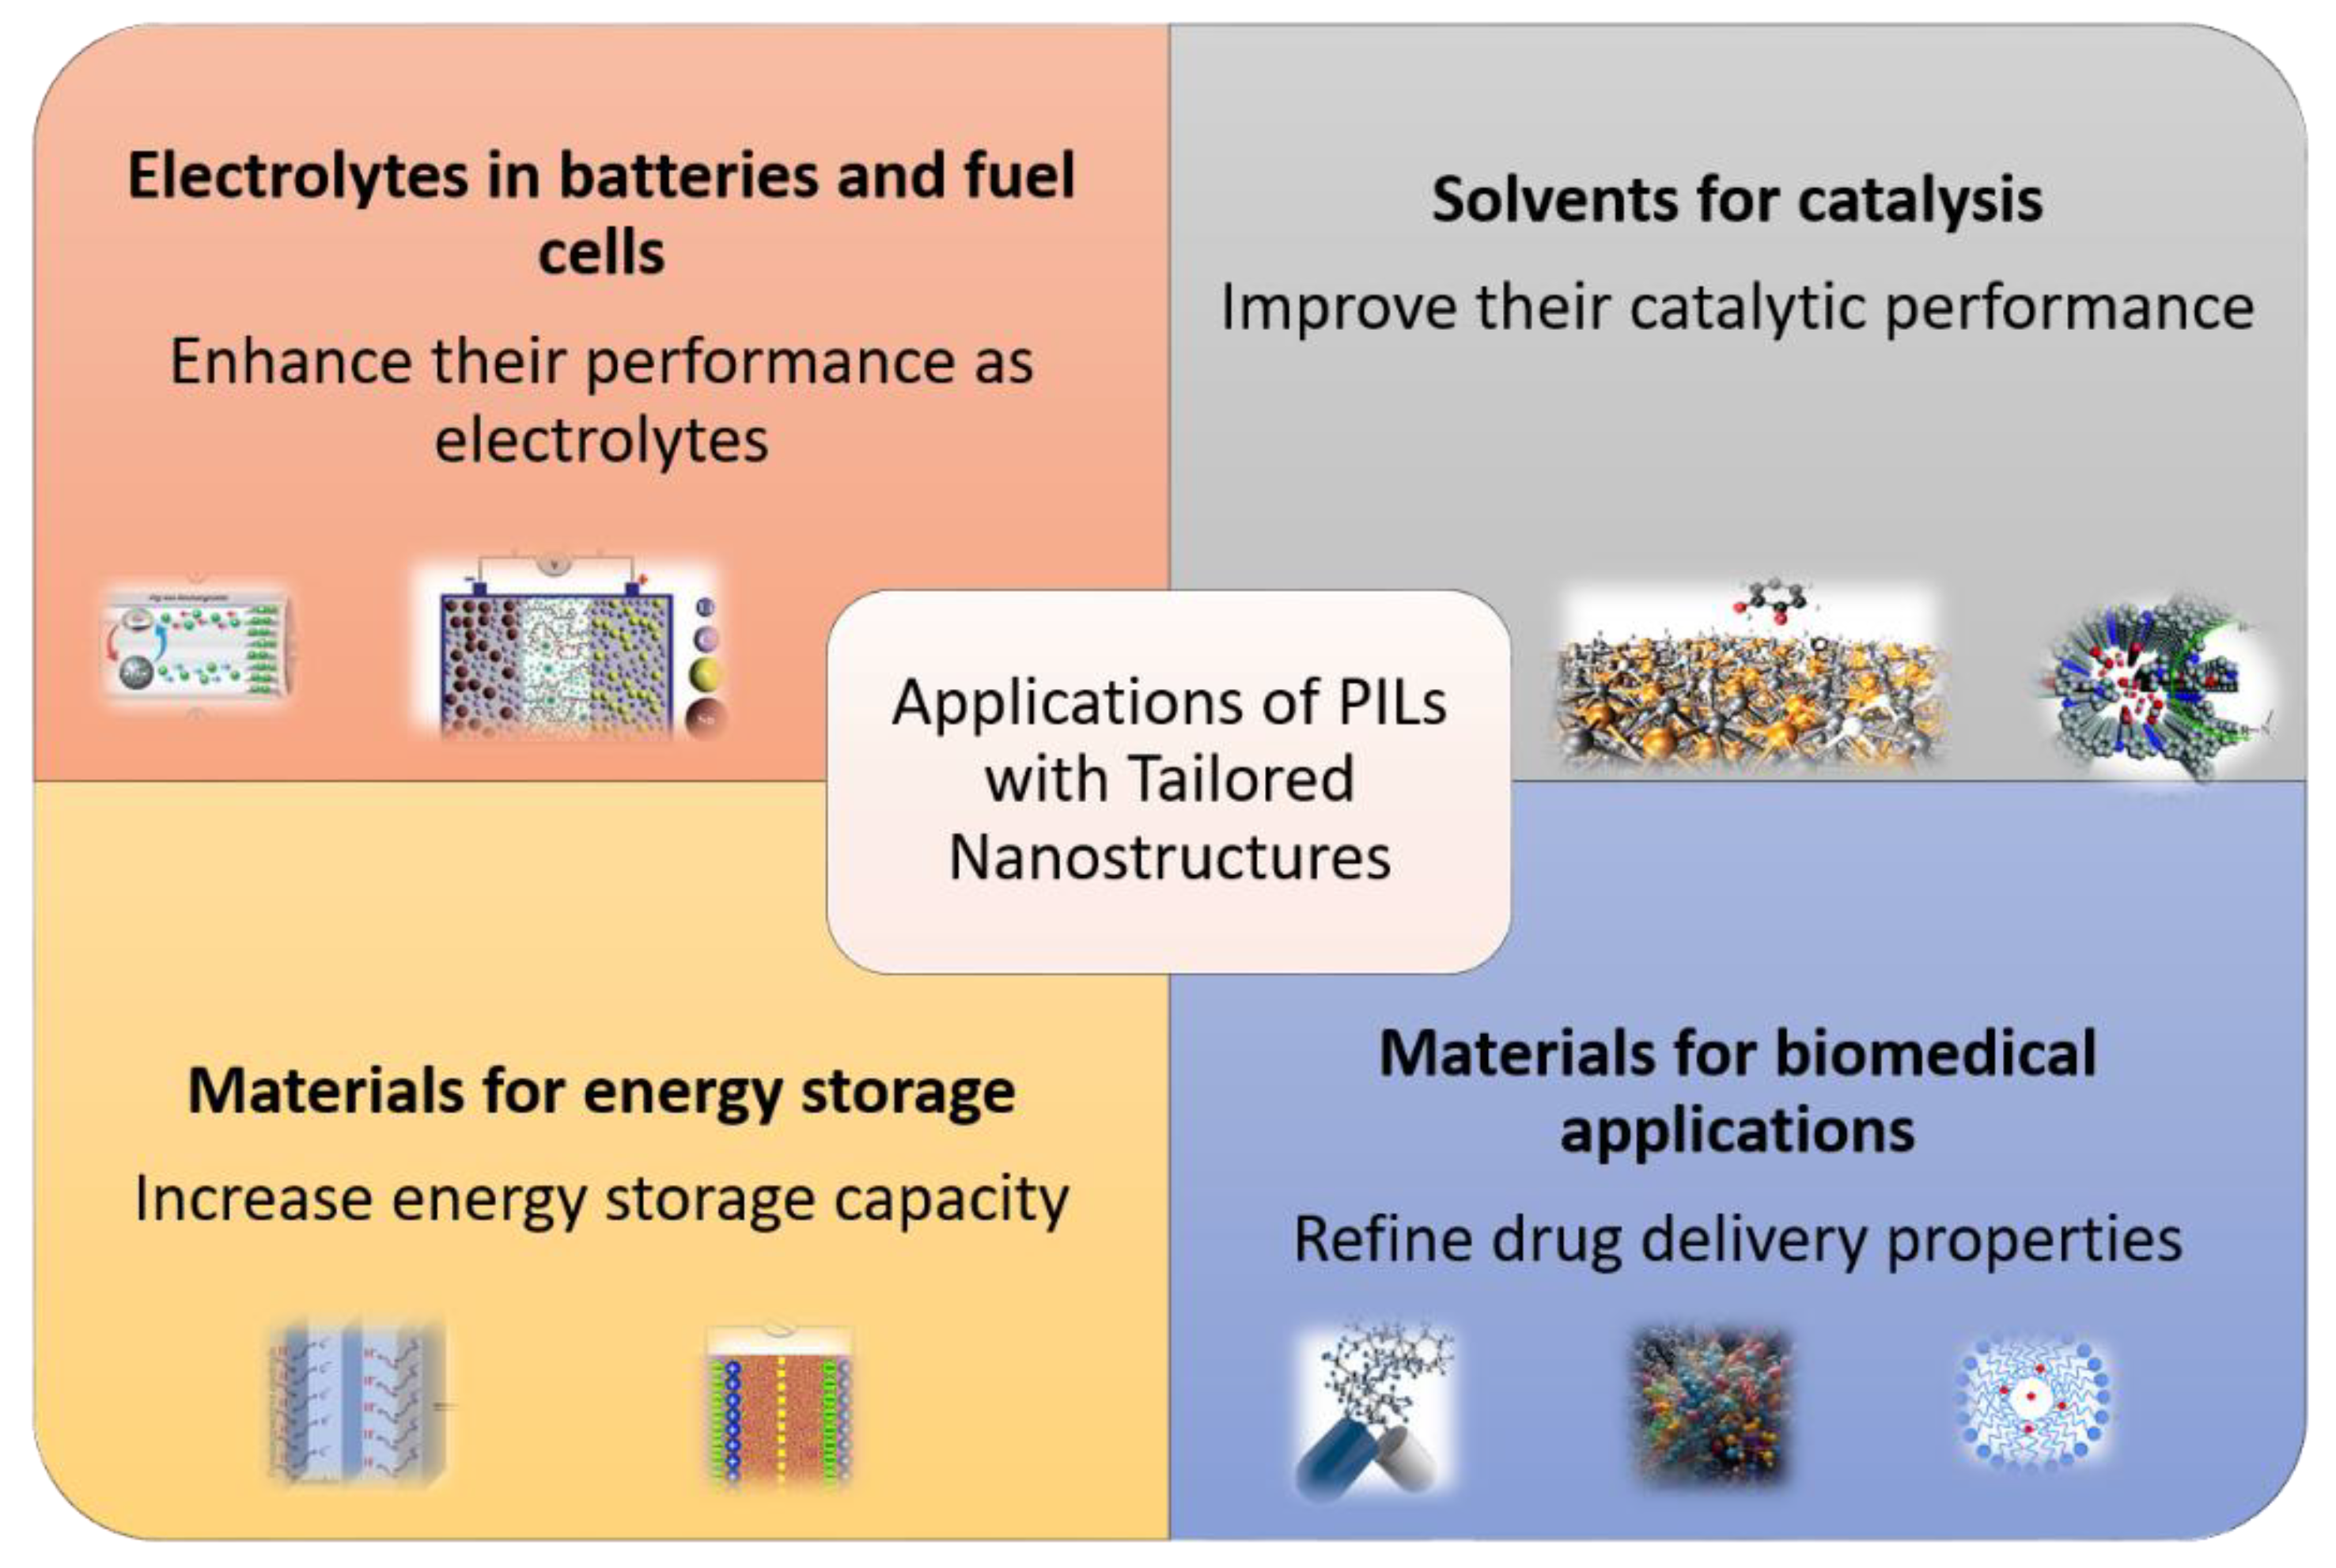
:1. Introduction
2. Materials and Methods
2.1. Synthesis
- Karl Fischer titration was used to determine the water content following a 12 h cycle.
- Water was extracted using a freeze-drying process at 0.03 mbar pressure. The freeze-drying cycle was carried out twice more, if the water mole percentage was greater than 0.1, or until no decrease in the water content was noticed.
2.2. Methods
2.2.1. X-ray Scattering
2.2.2. Molecular Dynamic Simulation
- Energy minimizations were achieved through the use of both conjugated gradient and steepest descent methods;
- A brief NVT run (20 ps) at 50 K;
- Gradient heating at 298 K in the NPT ensemble using the Berensen weak coupling algorithm [22], with the external pressure set at 1 atm;
- An approximate 2 ns NPT 298 K equilibration; a productive 2 ns NVT simulation with an integration time step of 2 fs and trajectories collected every 1000 steps;
- Periodic Boundary Conditions were applied to all phases of the calculation in order to minimize the crystal artifacts resulting from finite-size effects.
3. Results and Discussion
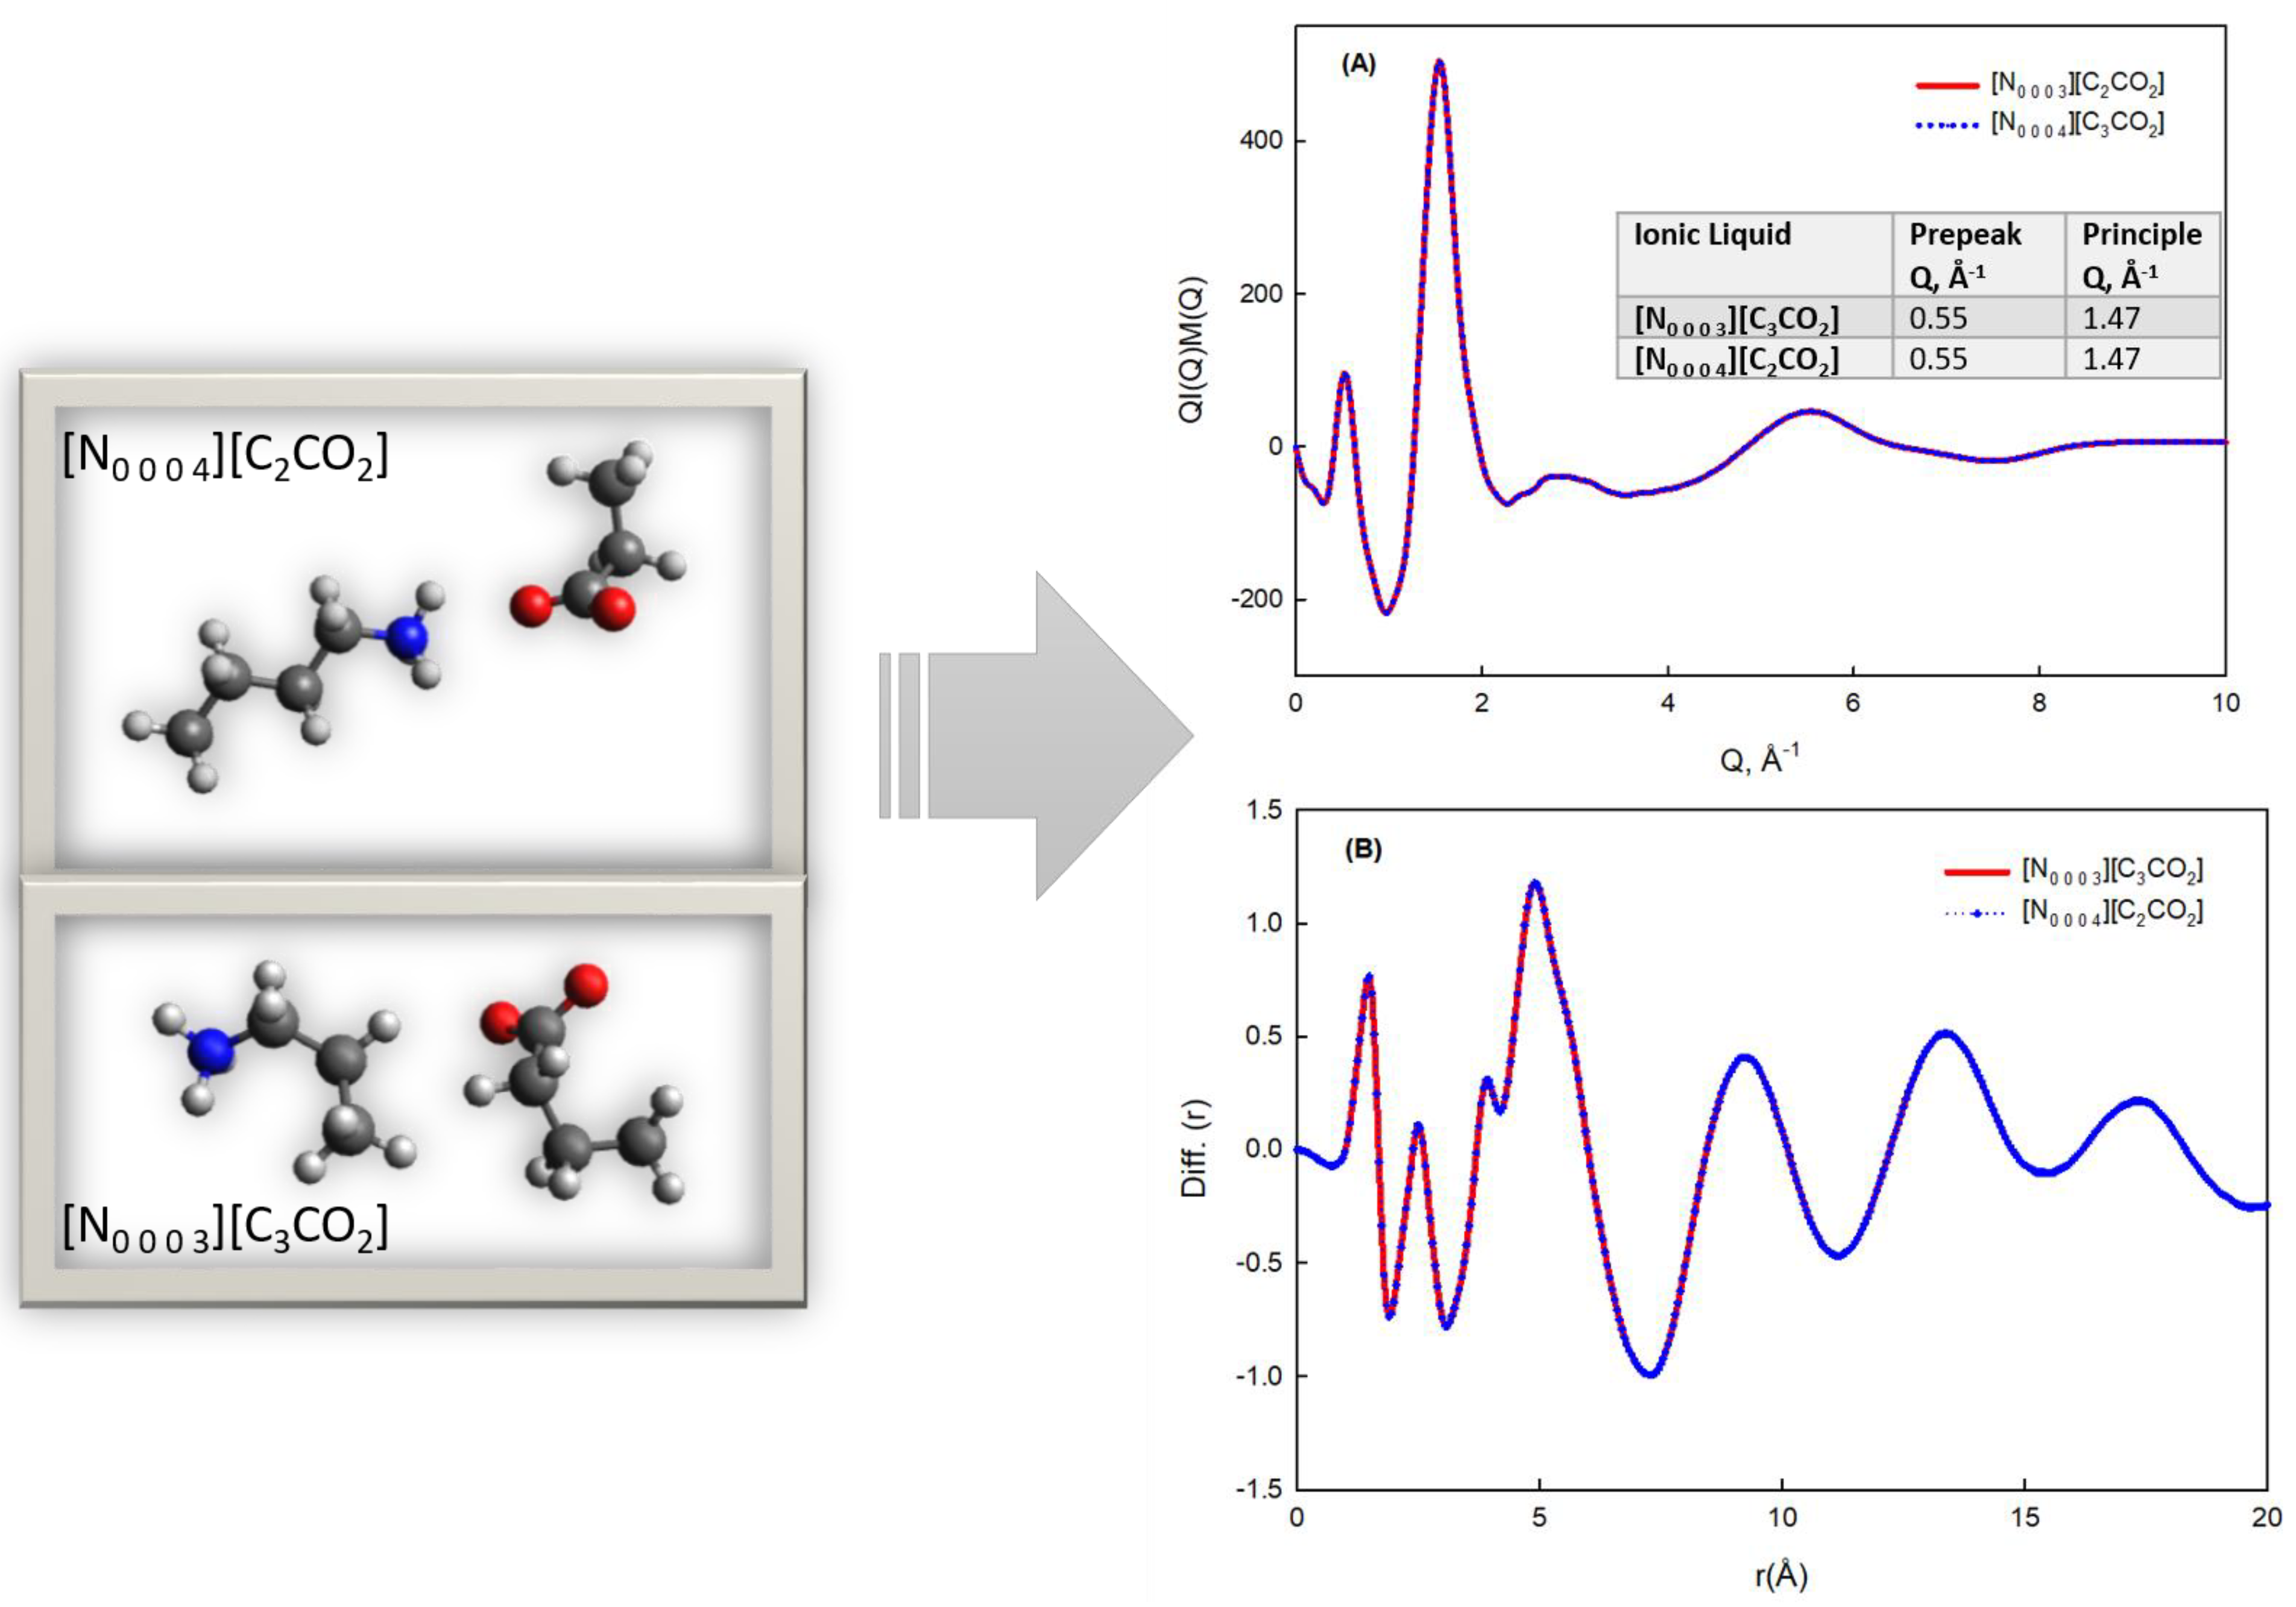
3.1. Experimental and Computational Characterization of Nanostructure
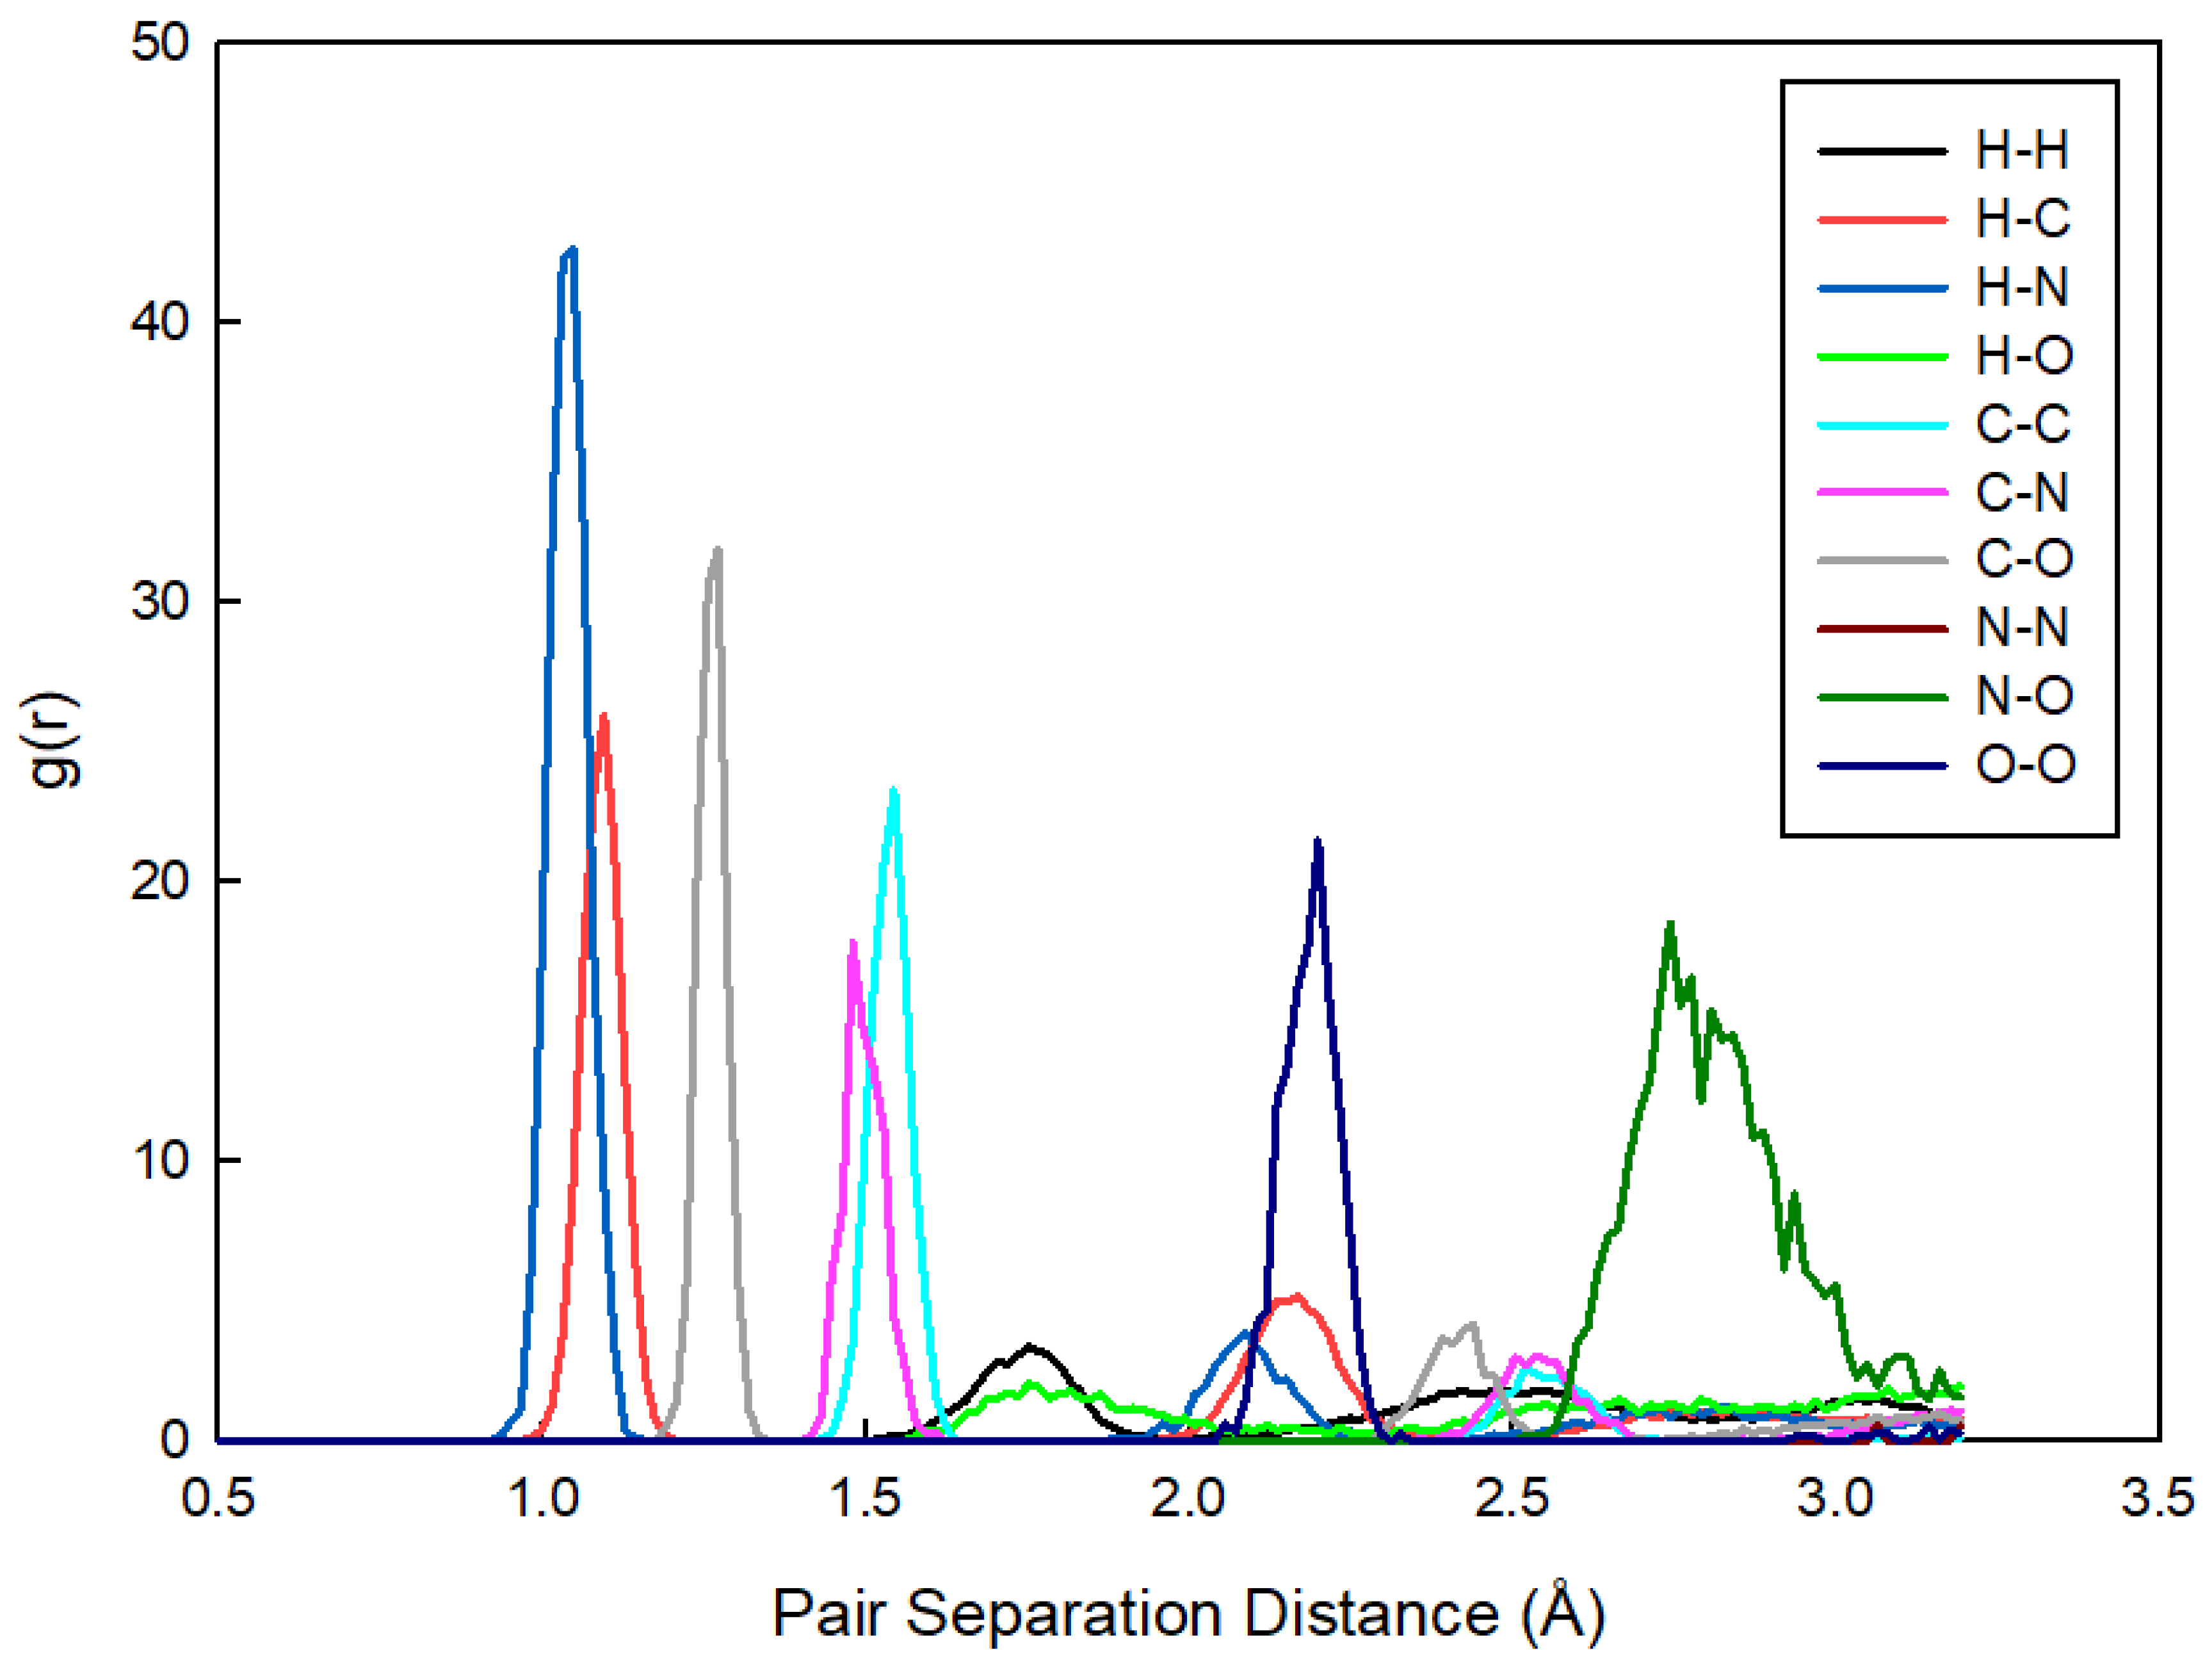
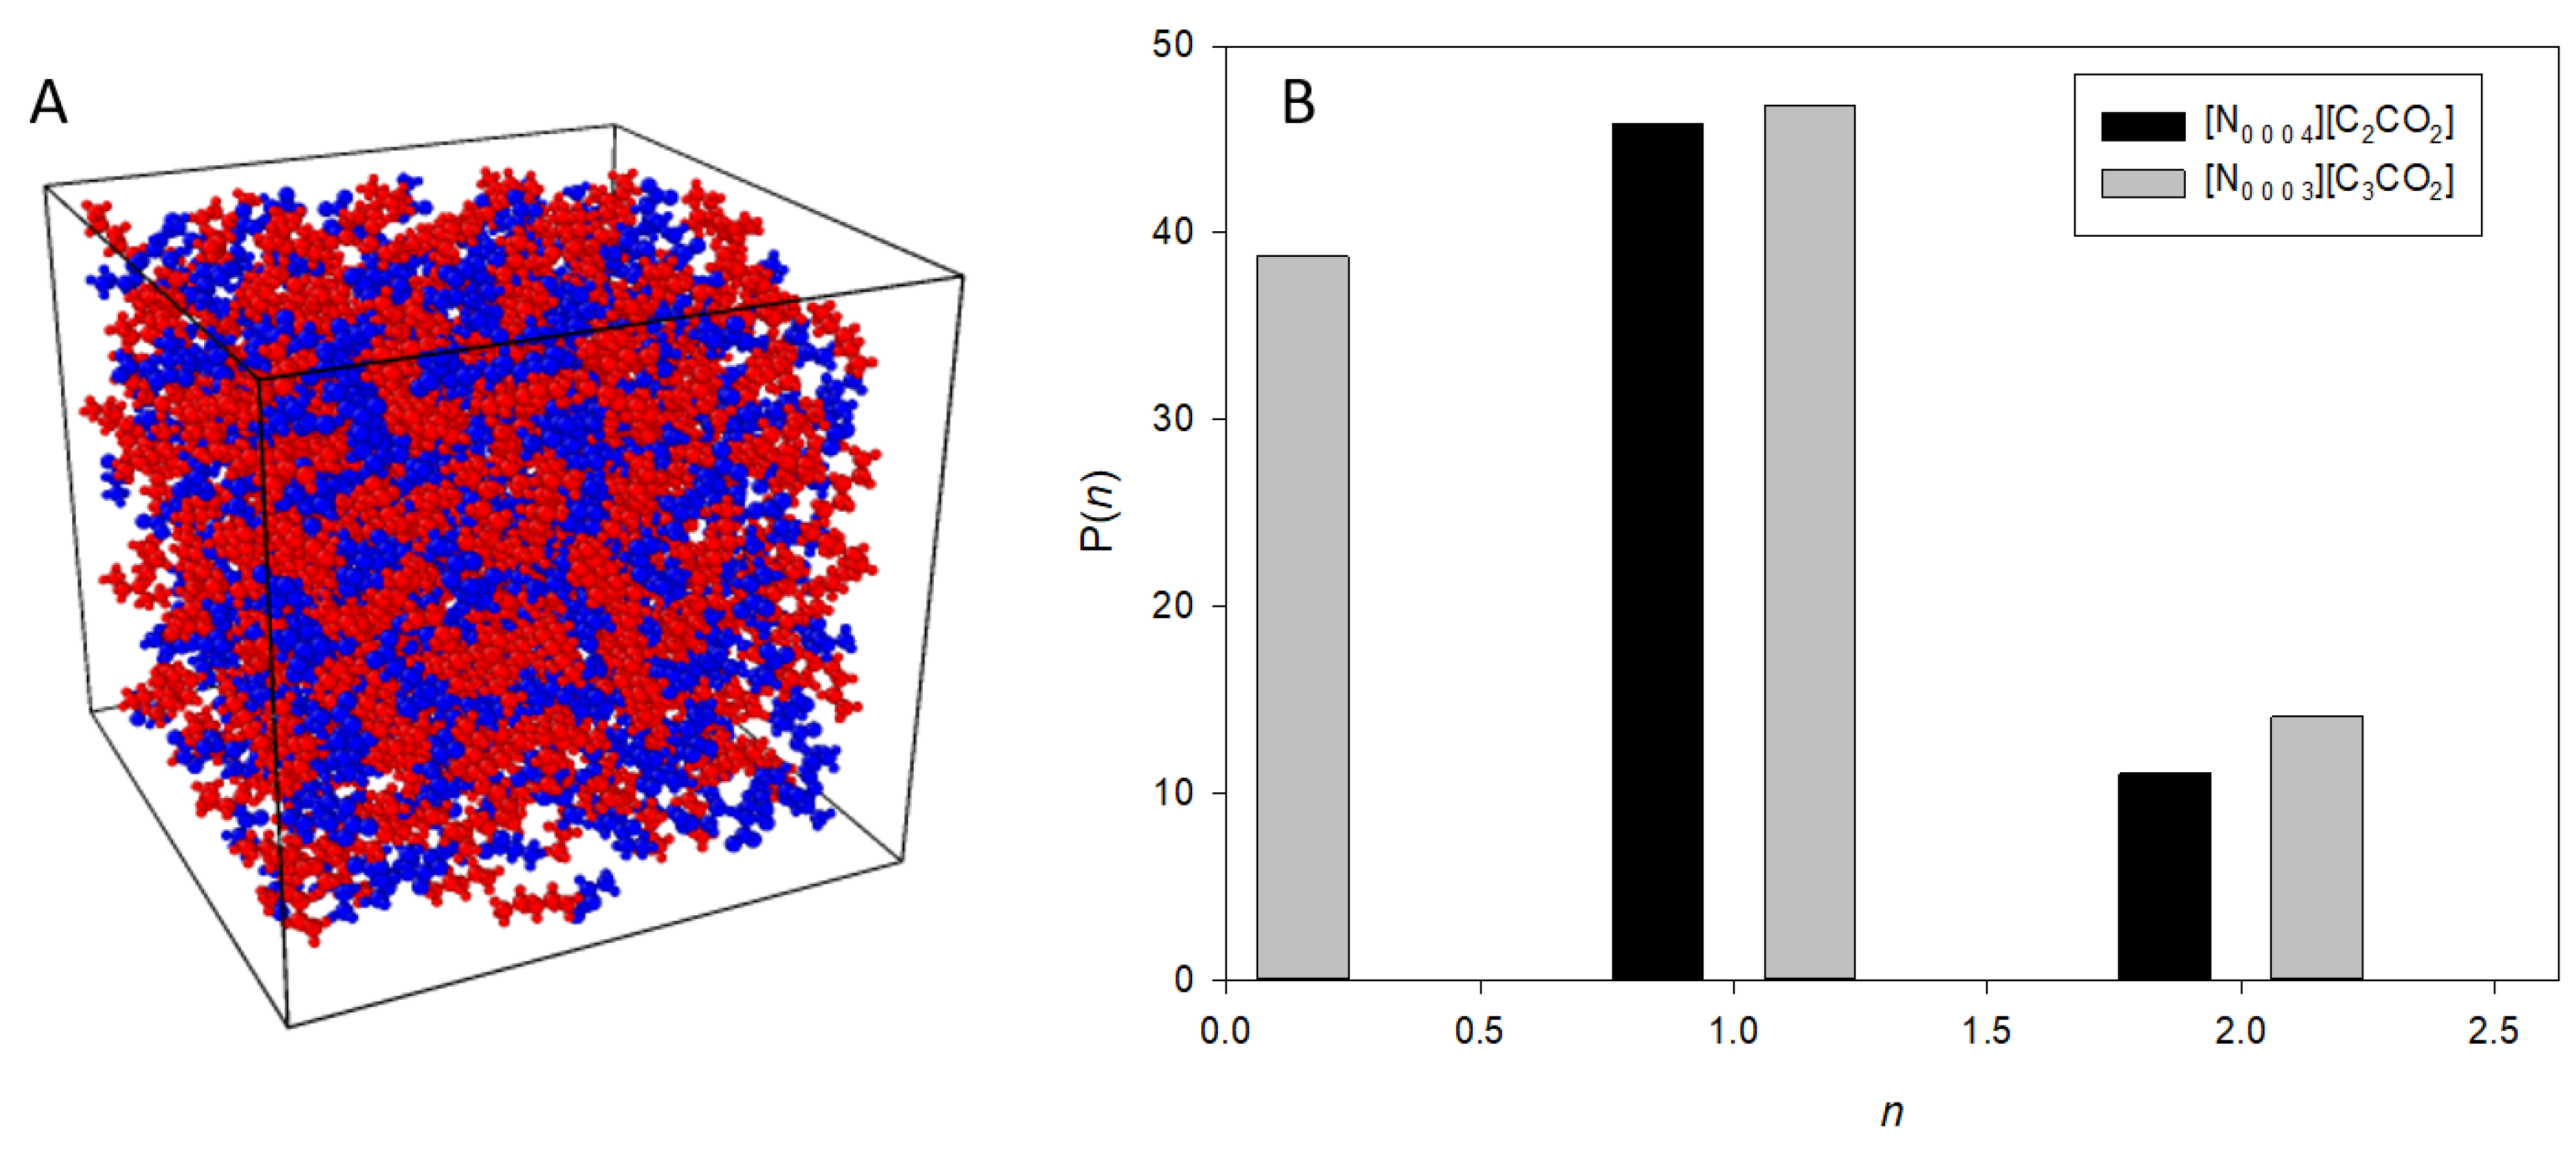
3.2. Nanostructural Comparison—Structure Factor and Radial Distribution Function Analysis
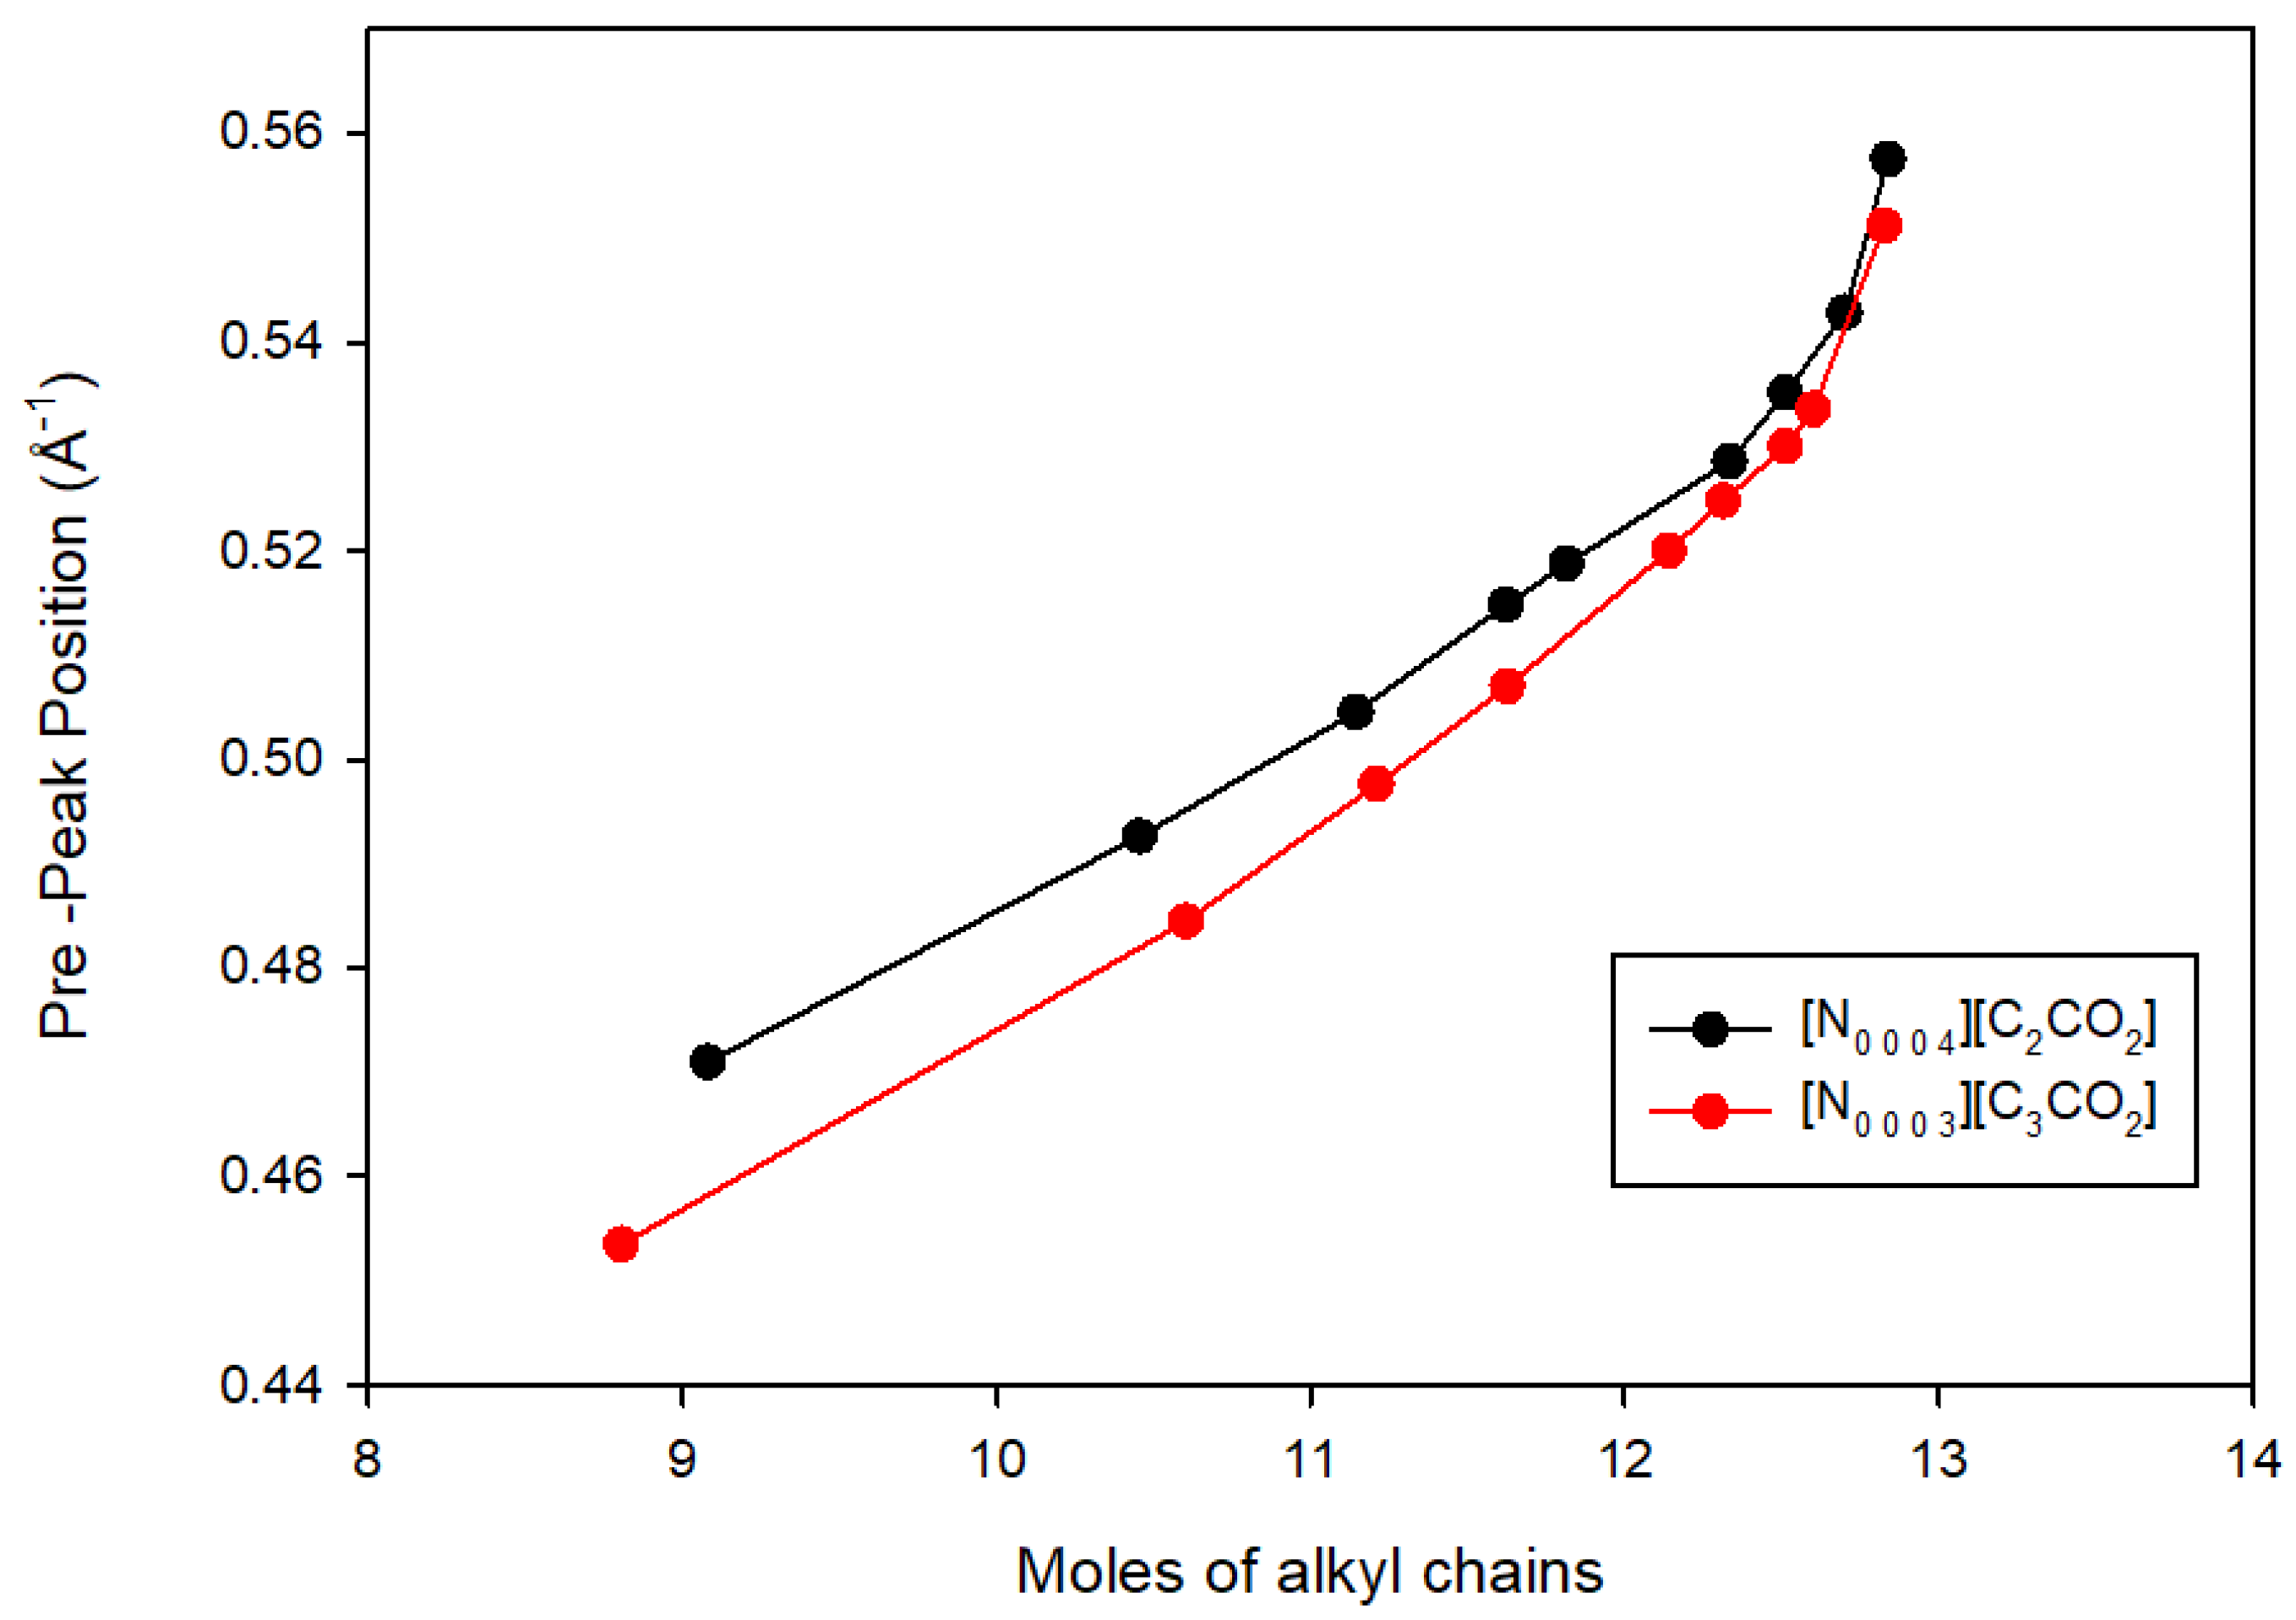
3.3. Comparison with Other Alkylammonium Alkanoate Ionic Liquids
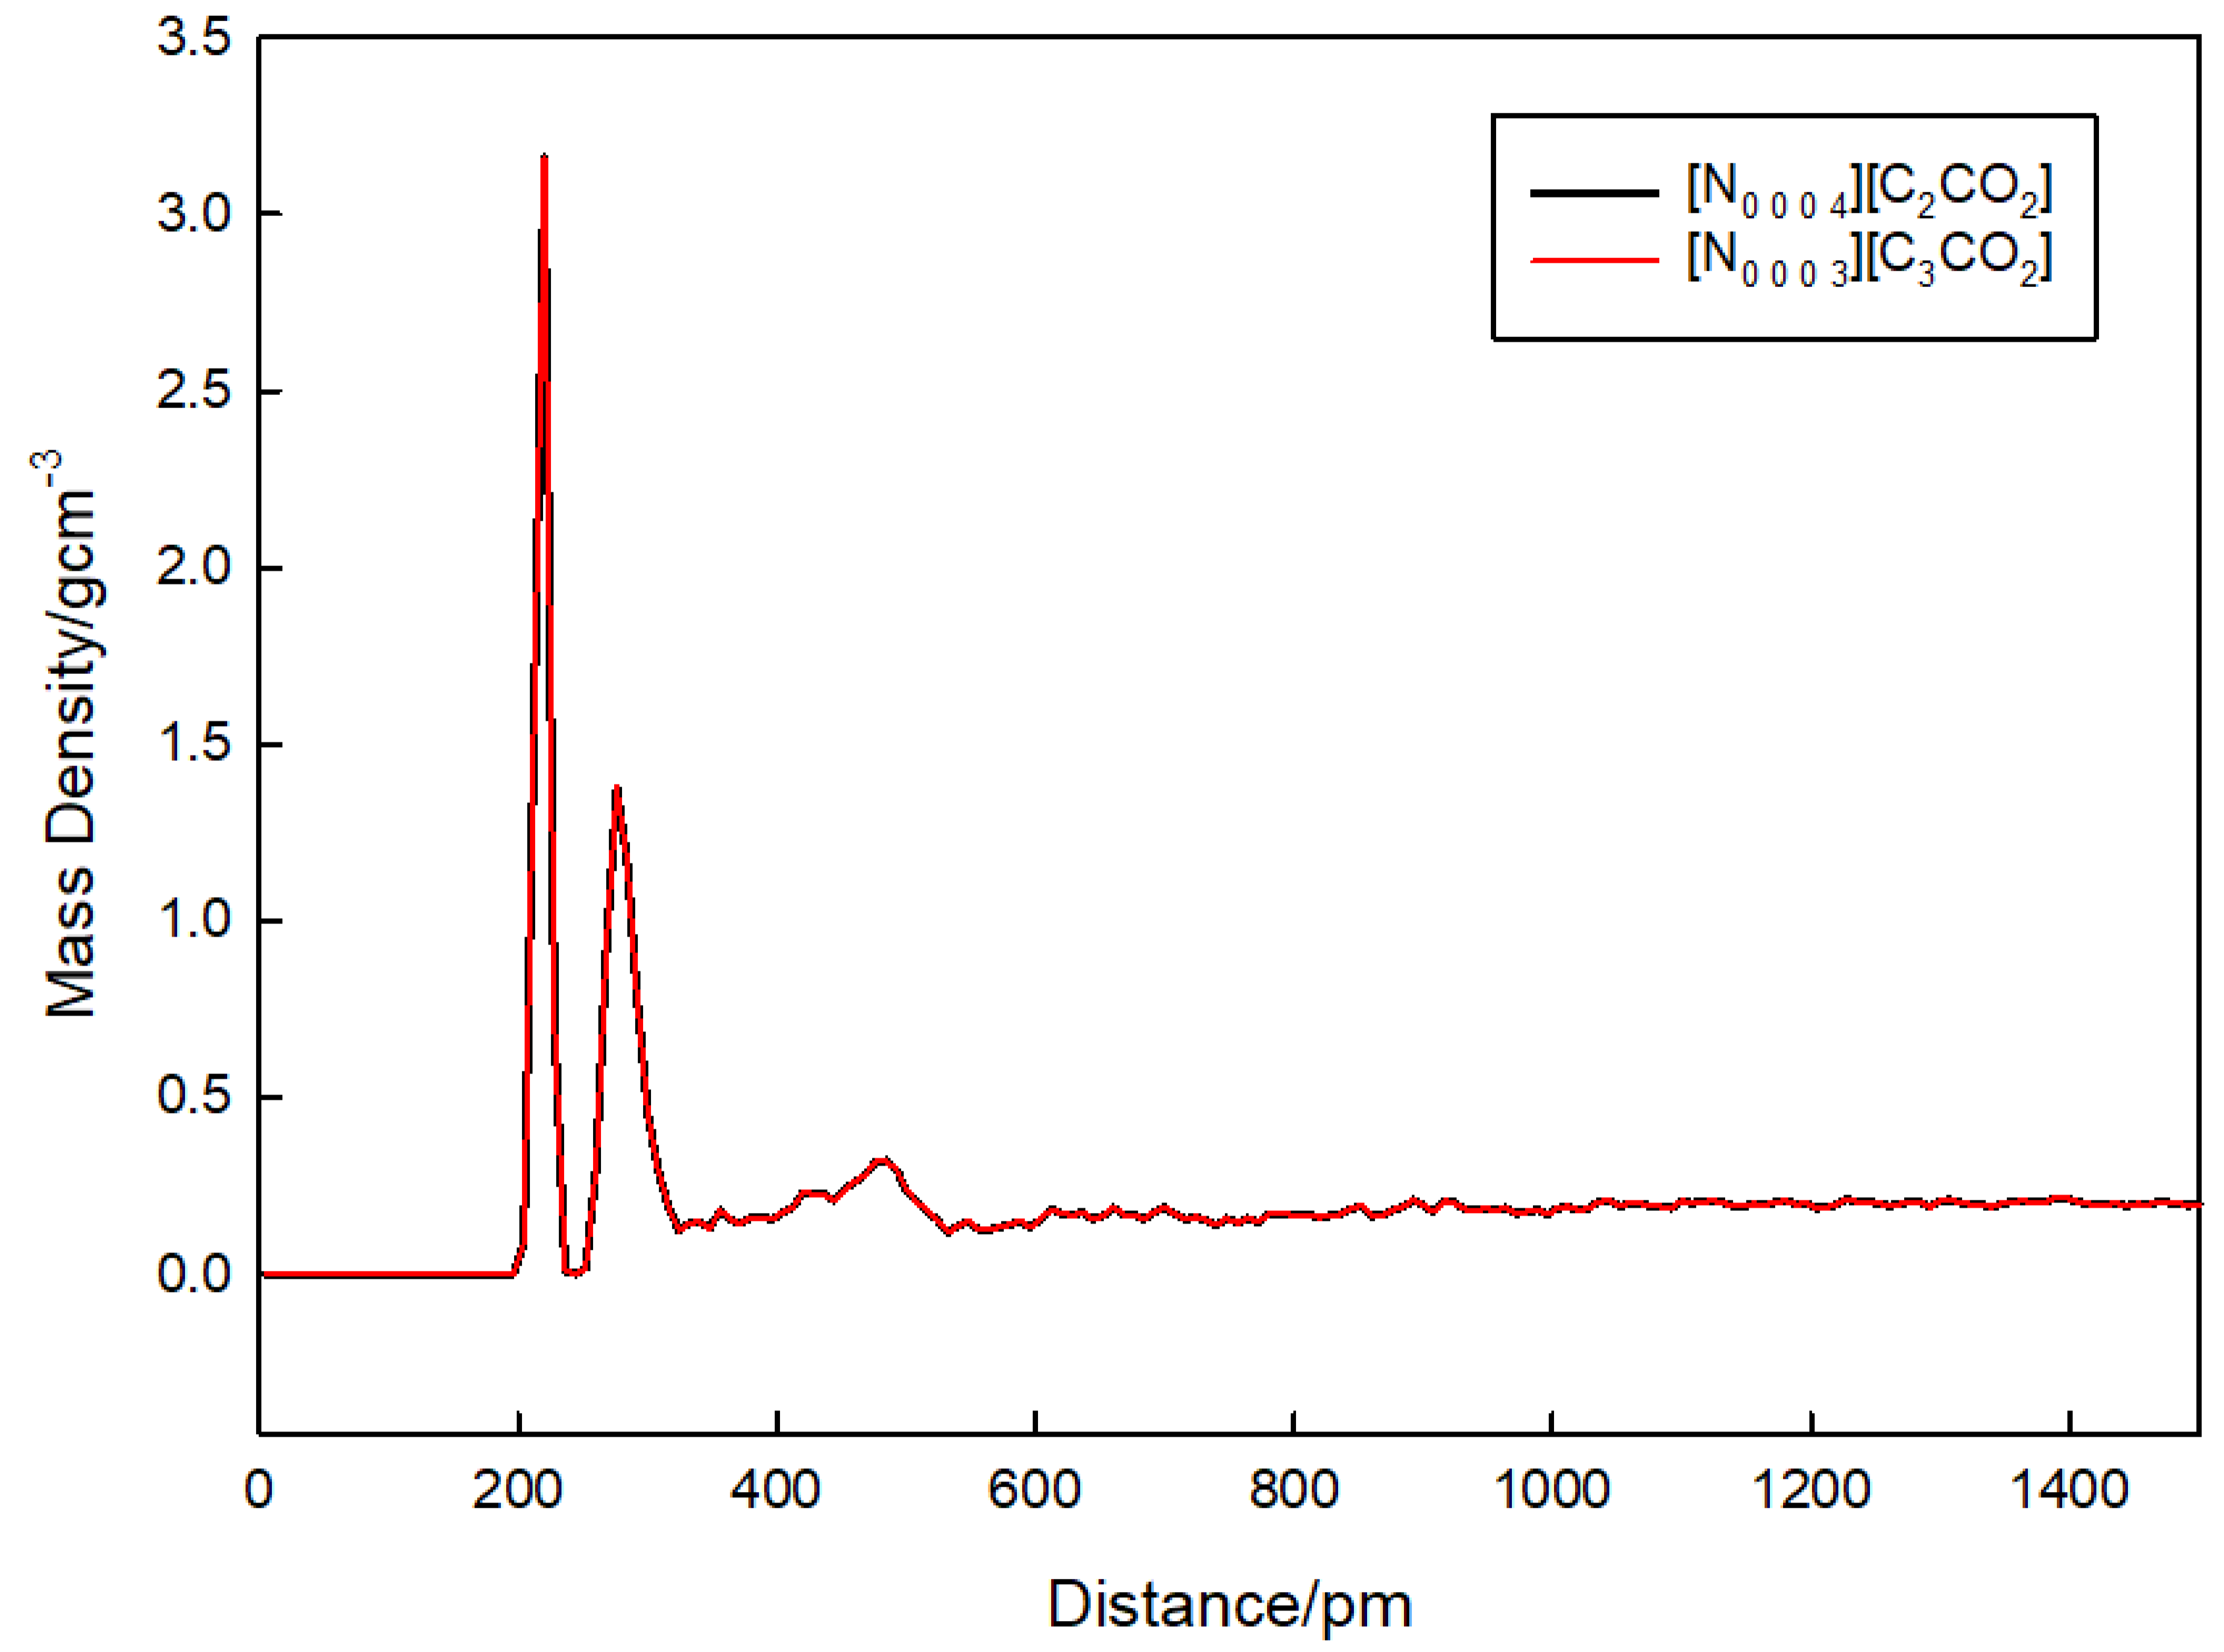
3.4. Density Analysis
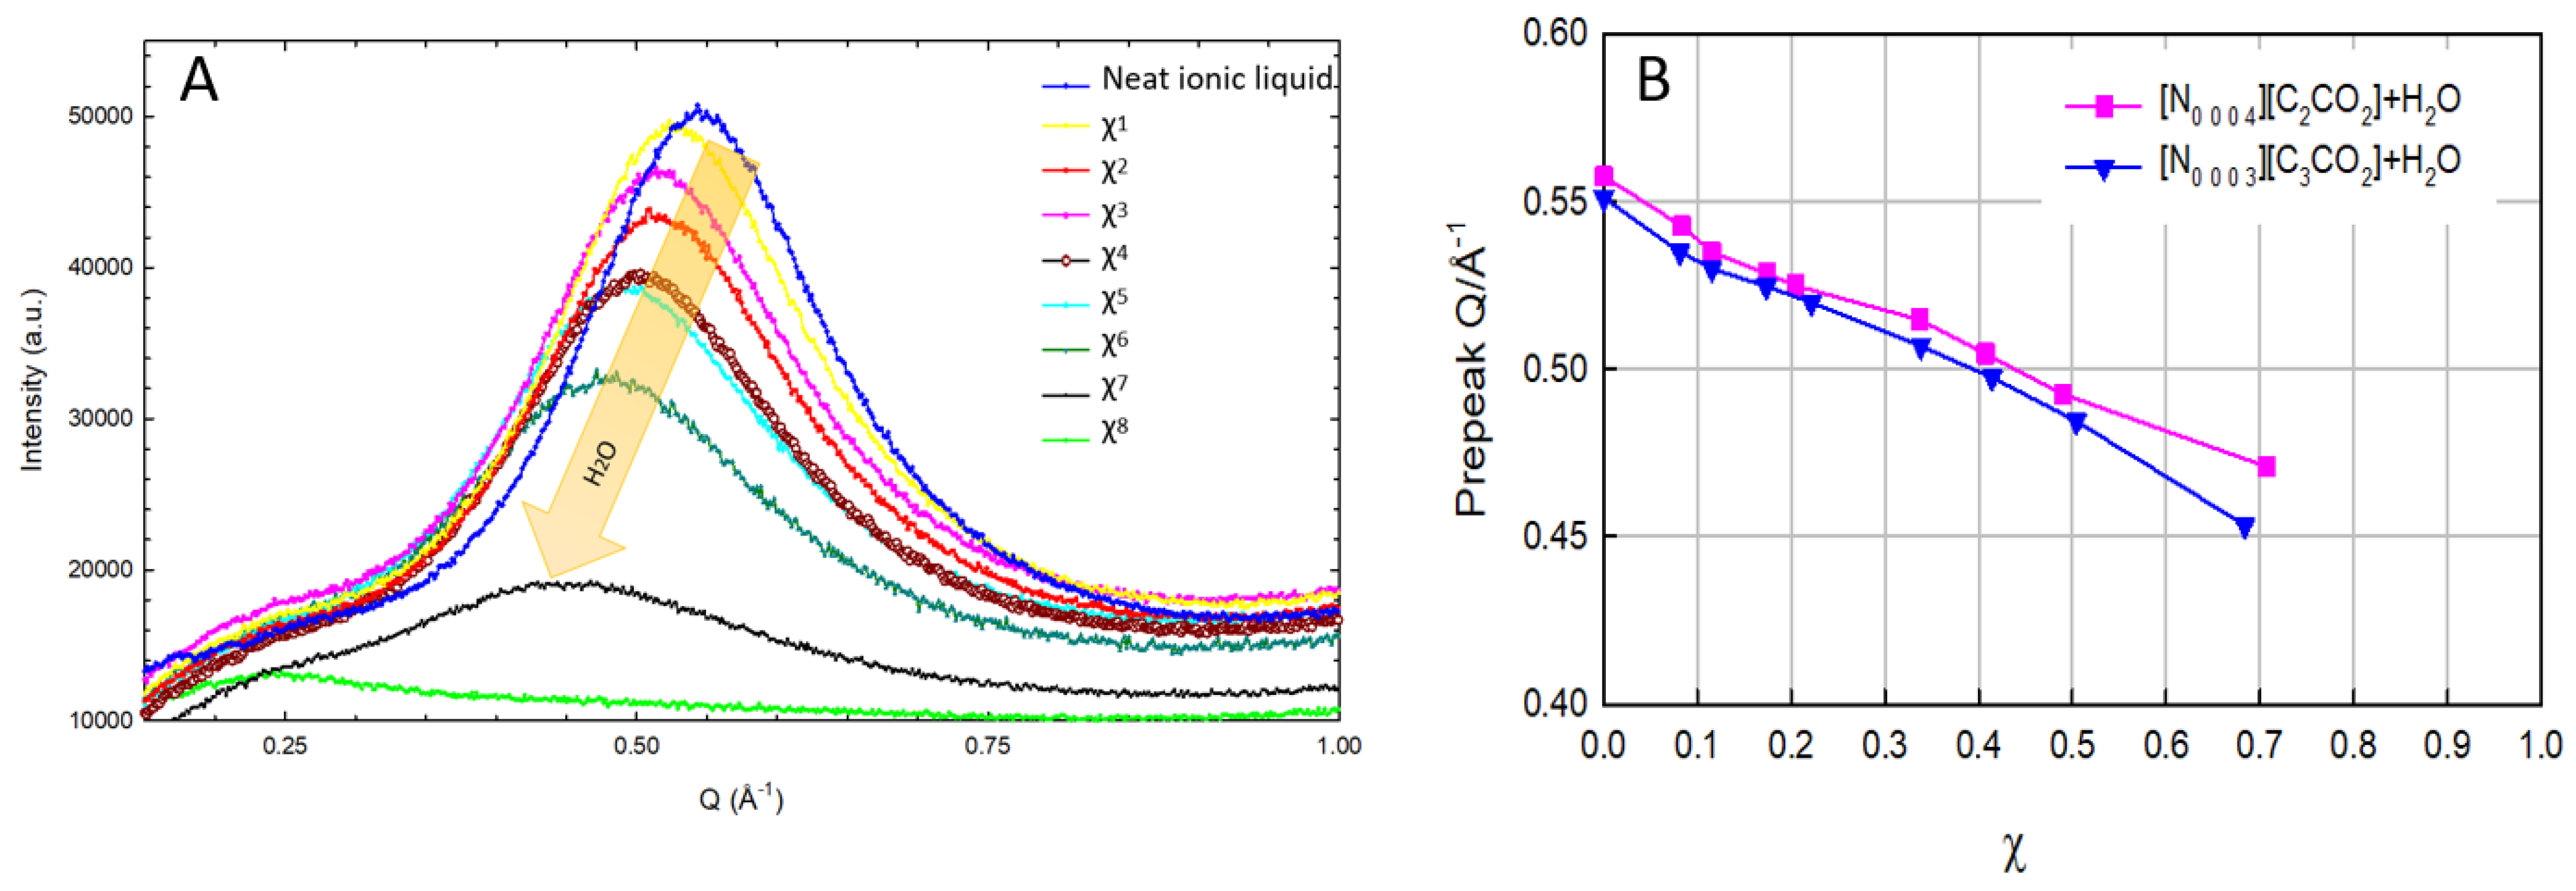
3.5. Effect of Dilution on the Nanostructure
4. Conclusions
Author Contributions
Funding
Institutional Review Board Statement
Informed Consent Statement
Data Availability Statement
Acknowledgments
Conflicts of Interest
References
- Greaves, T.L.; Drummond, C.J. Protic Ionic Liquids: Properties and Applications. Chem. Rev. 2008, 108, 206–237. [Google Scholar] [CrossRef] [PubMed]
- Greaves, T.L.; Ha, K.; Muir, B.W.; Howard, S.C.; Weerawardena, A.; Kirby, N.; Drummond, C.J. Protic Ionic Liquids (PILs) Nanostructure and Physicochemical Properties: Development of High-Throughput Methodology for PIL Creation and Property Screens. Phys. Chem. Chem. Phys. 2015, 17, 2357–2365. [Google Scholar] [CrossRef] [PubMed]
- Plechkova, N.V.; Seddon, K.R. Applications of Ionic Liquids in the Chemical Industry. Chem. Soc. Rev. 2008, 37, 123–150. [Google Scholar] [CrossRef] [PubMed]
- Yalcin, D.; Drummond, C.J.; Greaves, T.L. Solvation Properties of Protic Ionic Liquids and Molecular Solvents. Phys. Chem. Chem. Phys. 2020, 22, 114–128. [Google Scholar] [CrossRef] [PubMed]
- Chiappe, C. Nanostructural Organization of Ionic Liquids: Theoretical and Experimental Evidences of the Presence of Well Defined Local Structures in Ionic Liquids. Monatsh. Chem. 2007, 138, 1035–1043. [Google Scholar] [CrossRef]
- Hayes, R.; Warr, G.G.; Atkin, R. Structure and Nanostructure in Ionic Liquids. Chem. Rev. 2015, 115, 6357–6426. [Google Scholar] [CrossRef] [PubMed]
- Misenan, M.S.M.; Hempelmann, R.; Gallei, M.; Eren, T. Phosphonium-Based Polyelectrolytes: Preparation, Properties, and Usage in Lithium-Ion Batteries. Polymers 2023, 15, 2920. [Google Scholar] [CrossRef] [PubMed]
- Richu; Sharmhal, A.; Kumar, A.; Kumar, A. Insights into the Applications and Prospects of Ionic Liquids towards the Chemistry of Biomolecules. J. Mol. Liq. 2022, 368, 120580. [Google Scholar] [CrossRef]
- Marlow, J.B.; Atkin, R.; Warr, G.G. How Does Nanostructure in Ionic Liquids and Hybrid Solvents Affect Surfactant Self-Assembly? J. Phys. Chem. B 2023, 127, 1490–1498. [Google Scholar] [CrossRef]
- Wang, J.; Buzolic, J.J.; Mullen, J.W.; Fitzgerald, P.A.; Aman, Z.M.; Forsyth, M.; Li, H.; Silvester, D.S.; Warr, G.G.; Atkin, R. Nanostructure of Locally Concentrated Ionic Liquids in the Bulk and at Graphite and Gold Electrodes. ACS Nano 2023, 17, 21567–21584. [Google Scholar] [CrossRef]
- Russina, O.; Celso, F.L.; Plechkova, N.; Jafta, C.J.; Appetecchi, G.B.; Triolo, A. Mesoscopic Organization in Ionic Liquids. In Ionic Liquids II; Kirchner, B., Perlt, E., Eds.; Topics in Current Chemistry Collections; Springer International Publishing: Cham, Switzerland, 2017; pp. 247–263. ISBN 978-3-319-89793-6. [Google Scholar]
- Haarmann, N.; Enders, S.; Sadowski, G. Heterosegmental Modeling of Long-Chain Molecules and Related Mixtures Using PC-SAFT: 1. Polar Compounds. Ind. Eng. Chem. Res. 2019, 58, 2551–2574. [Google Scholar] [CrossRef]
- Kapoor, U.; Shah, J.K. Globular, Sponge-like to Layer-like Morphological Transition in 1-n-Alkyl-3-Methylimidazolium Octylsulfate Ionic Liquid Homologous Series. J. Phys. Chem. B 2018, 122, 213–228. [Google Scholar] [CrossRef]
- Canongia Lopes, J.N.A.; Pádua, A.A.H. Nanostructural Organization in Ionic Liquids. J. Phys. Chem. B 2006, 110, 3330–3335. [Google Scholar] [CrossRef] [PubMed]
- Russina, O.; Triolo, A.; Gontrani, L.; Caminiti, R.; Xiao, D.; Hines Jr, L.G.; Bartsch, R.A.; Quitevis, E.L.; Pleckhova, N.; Seddon, K.R. Morphology and Intermolecular Dynamics of 1-Alkyl-3-Methylimidazolium Bis{(Trifluoromethane)Sulfonyl}amide Ionic Liquids: Structural and Dynamic Evidence of Nanoscale Segregation. J. Phys. Condens. Matter 2009, 21, 424121. [Google Scholar] [CrossRef]
- Dzida, M.; Musiał, M.; Zorębski, E.; Zorębski, M.; Jacquemin, J.; Goodrich, P.; Wojnarowska, Z.; Paluch, M. Comparative Study of Effect of Alkyl Chain Length on Thermophysical Characteristics of Five N-Alkylpyridinium Bis(Trifluoromethylsulfonyl)Imides with Selected Imidazolium-Based Ionic Liquids. J. Mol. Liq. 2019, 278, 401–412. [Google Scholar] [CrossRef]
- Pings, C.J.; Waser, J. Analysis of Scattering Data for Mixtures of Amorphous Solids or Liquids. J. Chem. Phys. 1968, 48, 3016–3018. [Google Scholar] [CrossRef]
- Keen, D.A. A Comparison of Various Commonly Used Correlation Functions for Describing Total Scattering. J. Appl. Crystallogr. 2001, 34, 172–177. [Google Scholar] [CrossRef]
- Gontrani, L.; Russina, O.; Marincola, F.C.; Caminiti, R. An Energy Dispersive X-ray Scattering and Molecular Dynamics Study of Liquid Dimethyl Carbonate. J. Chem. Phys. 2009, 131, 244503. [Google Scholar] [CrossRef] [PubMed]
- Tsau, J.; Gilson, D. Polymorphism in N-Alkylammonium Halides. A Differential Scanning Calorimetric Study. J. Phys. Chem. 1968, 72, 4082–4085. [Google Scholar] [CrossRef]
- Wang, J.; Wolf, R.M.; Caldwell, J.W.; Kollman, P.A.; Case, D.A. Development and Testing of a General Amber Force Field. J. Comput. Chem. 2004, 25, 1157–1174. [Google Scholar] [CrossRef]
- Song, L.F.; Lee, T.-S.; Zhu, C.; York, D.M.; Merz, K.M. Using AMBER18 for Relative Free Energy Calculations. J. Chem. Inf. Model. 2019, 59, 3128–3135. [Google Scholar] [CrossRef] [PubMed]
- Cieplak, P.; Cornell, W.D.; Bayly, C.; Kollman, P.A. Application of the Multimolecule and Multiconformational RESP Methodology to Biopolymers: Charge Derivation for DNA, RNA, and Proteins. J. Comput. Chem. 1995, 16, 1357–1377. [Google Scholar] [CrossRef]
- Martínez, L.; Andrade, R.; Birgin, E.G.; Martínez, J.M. PACKMOL: A Package for Building Initial Configurations for Molecular Dynamics Simulations. J. Comput. Chem. 2009, 30, 2157–2164. [Google Scholar] [CrossRef]
- Brehm, M.; Thomas, M.; Gehrke, S.; Kirchner, B. TRAVIS—A Free Analyzer for Trajectories from Molecular Simulation. J. Chem. Phys. 2020, 152, 164105. [Google Scholar] [CrossRef] [PubMed]
- Salma, U.; Plechkova, N.V.; Caminiti, R.; Gontrani, L. The Opposite Effect of Water and N -Methyl-2-Pyrrolidone Cosolvents on the Nanostructural Organization of Ethylammonium Butanoate Ionic Liquid: A Small- and Wide-Angle X-ray Scattering and Molecular Dynamics Simulations Study. J. Phys. Chem. B 2017, 121, 6399–6407. [Google Scholar] [CrossRef]
- Salma, U.; Usula, M.; Caminiti, R.; Gontrani, L.; Plechkova, N.V.; Seddon, K.R. X-ray and Molecular Dynamics Studies of Butylammonium Butanoate–Water Binary Mixtures. Phys. Chem. Chem. Phys. 2017, 19, 1975–1981. [Google Scholar] [CrossRef] [PubMed]
- He, Y.; Li, H.; Qu, C.; Cao, W.; Ma, M. Recent Understanding of Solid-Liquid Friction in Ionic Liquids. Green Chem. Eng. 2021, 2, 145–157. [Google Scholar] [CrossRef]
- Haddad, J.; Pontoni, D.; Murphy, B.M.; Festersen, S.; Runge, B.; Magnussen, O.M.; Steinrück, H.-G.; Reichert, H.; Ocko, B.M.; Deutsch, M. Surface Structure Evolution in a Homologous Series of Ionic Liquids. Proc. Natl. Acad. Sci. USA 2018, 115, E1100–E1107. [Google Scholar] [CrossRef] [PubMed]
- Salma, U.; Ballirano, P.; Usula, M.; Caminiti, R.; Plechkova, N.V.; Seddon, K.R.; Gontrani, L. A New Insight into the Nanostructure of Alkylammonium Alkanoates Based Ionic Liquids in Water. Phys. Chem. Chem. Phys. 2016, 18, 11497–11502. [Google Scholar] [CrossRef]
- Gontrani, L.; Caminiti, R.; Salma, U.; Campetella, M. A Structural and Theoretical Study of the Alkylammonium Nitrates Forefather: Liquid Methylammonium Nitrate. Chem. Phys. Lett. 2017, 684, 304–309. [Google Scholar] [CrossRef]
- Urahata, S.M.; Ribeiro, M.C.C. Structure of Ionic Liquids of 1-Alkyl-3-Methylimidazolium Cations: A Systematic Computer Simulation Study. J. Chem. Phys. 2004, 120, 1855–1863. [Google Scholar] [CrossRef] [PubMed]
- Shi, B. The Strengths of van Der Waals and Electrostatic Forces in 1-Alkyl-3-Methylimidazolium Ionic Liquids Obtained through Lifshitz Theory and Coulomb Formula. J. Mol. Liq. 2020, 320, 114412. [Google Scholar] [CrossRef]
- Aoun, B.; Goldbach, A.; González, M.A.; Kohara, S.; Price, D.L.; Saboungi, M.-L. Nanoscale Heterogeneity in Alkyl-Methylimidazolium Bromide Ionic Liquids. J. Chem. Phys. 2011, 134, 104509. [Google Scholar] [CrossRef] [PubMed]
- Kirchner, B.; Hollóczki, O.; Canongia Lopes, J.N.; Pádua, A.A.H. Multiresolution Calculation of Ionic Liquids. WIREs Comput. Mol. Sci. 2015, 5, 202–214. [Google Scholar] [CrossRef]
- Brennecke, J.F.; Rogers, R.D.; Seddon, K.R. (Eds.) Ionic Liquids IV: Not Just Solvents Anymore; ACS Symposium Series; American Chemical Society: Washington, DC, USA, 2007; Volume 975, ISBN 978-0-8412-7445-7. [Google Scholar]
- Santos, D.; Santos, M.; Franceschi, E.; Dariva, C.; Barison, A.; Mattedi, S. Experimental Density of Ionic Liquids and Thermodynamic Modeling with Group Contribution Equation of State Based on the Lattice Fluid Theory. J. Chem. Eng. Data 2016, 61, 348–353. [Google Scholar] [CrossRef]
- Fan, W.; Zhou, Q.; Sun, J.; Zhang, S. Density, Excess Molar Volume, and Viscosity for the Methyl Methacrylate + 1-Butyl-3-Methylimidazolium Hexafluorophosphate Ionic Liquid Binary System at Atmospheric Pressure. J. Chem. Eng. Data 2009, 54, 2307–2311. [Google Scholar] [CrossRef]
- Gaciño, F.M.; Comuñas, M.J.P.; Regueira, T.; Segovia, J.J.; Fernández, J. On the Viscosity of Two 1-Butyl-1-Methylpyrrolidinium Ionic Liquids: Effect of the Temperature and Pressure. J. Chem. Thermodyn. 2015, 87, 43–51. [Google Scholar] [CrossRef]
- Huo, Y.; Xia, S.; Ma, P. Densities of Ionic Liquids, 1-Butyl-3-Methylimidazolium Hexafluorophosphate and 1-Butyl-3-Methylimidazolium Tetrafluoroborate, with Benzene, Acetonitrile, and 1-Propanol at T = (293.15 to 343.15) K. J. Chem. Eng. Data 2007, 52, 2077–2082. [Google Scholar] [CrossRef]
- Hayashi, S.; Ozawa, R.; Hamaguchi, H. Raman Spectra, Crystal Polymorphism, and Structure of a Prototype Ionic-Liquid [Bmim]Cl. Chem. Lett. 2003, 32, 498–499. [Google Scholar] [CrossRef]
- Fumino, K.; Wittler, K.; Ludwig, R. The Anion Dependence of the Interaction Strength between Ions in Imidazolium-Based Ionic Liquids Probed by Far-Infrared Spectroscopy. J. Phys. Chem. B 2012, 116, 9507–9511. [Google Scholar] [CrossRef]
- Katsyuba, S.A.; Dyson, P.J.; Vandyukova, E.E.; Chernova, A.V.; Vidiš, A. Molecular Structure, Vibrational Spectra, and Hydrogen Bonding of the Ionic Liquid 1-Ethyl-3-methyl-1 H -imidazolium Tetrafluoroborate. Helv. Chim. Acta 2004, 87, 2556–2565. [Google Scholar] [CrossRef]


| Ionic Liquid | Pre-Peak (Q1), Å−1 | Correlation Distance (d1), Å | Principal Peak (Q2), Å−1 | Correlation Distance (d2), Å |
|---|---|---|---|---|
| [N0 0 0 3][C3CO2] | 0.55 | 11.42 | 1.47 | 4.27 |
| [N0 0 0 4][C2CO2] | 0.55 | 11.42 | 1.47 | 4.27 |
| Ionic Liquid | Densities Density (g/cm3) Experimental Simulated | Percentage Difference | |
|---|---|---|---|
| [N0 0 0 3][C3CO2] | 0.9441 | 0.9599 | 1.66% |
| [N0 0 0 4][C2CO2] | 0.9450 | 0.9556 | 1.12% |
Disclaimer/Publisher’s Note: The statements, opinions and data contained in all publications are solely those of the individual author(s) and contributor(s) and not of MDPI and/or the editor(s). MDPI and/or the editor(s) disclaim responsibility for any injury to people or property resulting from any ideas, methods, instructions or products referred to in the content. |
© 2024 by the authors. Licensee MDPI, Basel, Switzerland. This article is an open access article distributed under the terms and conditions of the Creative Commons Attribution (CC BY) license (https://creativecommons.org/licenses/by/4.0/).
Share and Cite
Salma, U.; Plechkova, N.V.; Gontrani, L.; Carbone, M. Ionic Twin Nanostructural Comparison: Propylammonium Butanoate vs. Butylammonium Propanoate and Their Interactions with Water. Materials 2024, 17, 4071. https://doi.org/10.3390/ma17164071
Salma U, Plechkova NV, Gontrani L, Carbone M. Ionic Twin Nanostructural Comparison: Propylammonium Butanoate vs. Butylammonium Propanoate and Their Interactions with Water. Materials. 2024; 17(16):4071. https://doi.org/10.3390/ma17164071
Chicago/Turabian StyleSalma, Umme, Natalia V. Plechkova, Lorenzo Gontrani, and Marilena Carbone. 2024. "Ionic Twin Nanostructural Comparison: Propylammonium Butanoate vs. Butylammonium Propanoate and Their Interactions with Water" Materials 17, no. 16: 4071. https://doi.org/10.3390/ma17164071
APA StyleSalma, U., Plechkova, N. V., Gontrani, L., & Carbone, M. (2024). Ionic Twin Nanostructural Comparison: Propylammonium Butanoate vs. Butylammonium Propanoate and Their Interactions with Water. Materials, 17(16), 4071. https://doi.org/10.3390/ma17164071