
A Lab-Scale Evaluation of Parameters Influencing the Mechanical Activation of Kaolin Using the Design of Experiments

 , ,
, ,
Abstract
1. Introduction
2. Materials and Methods
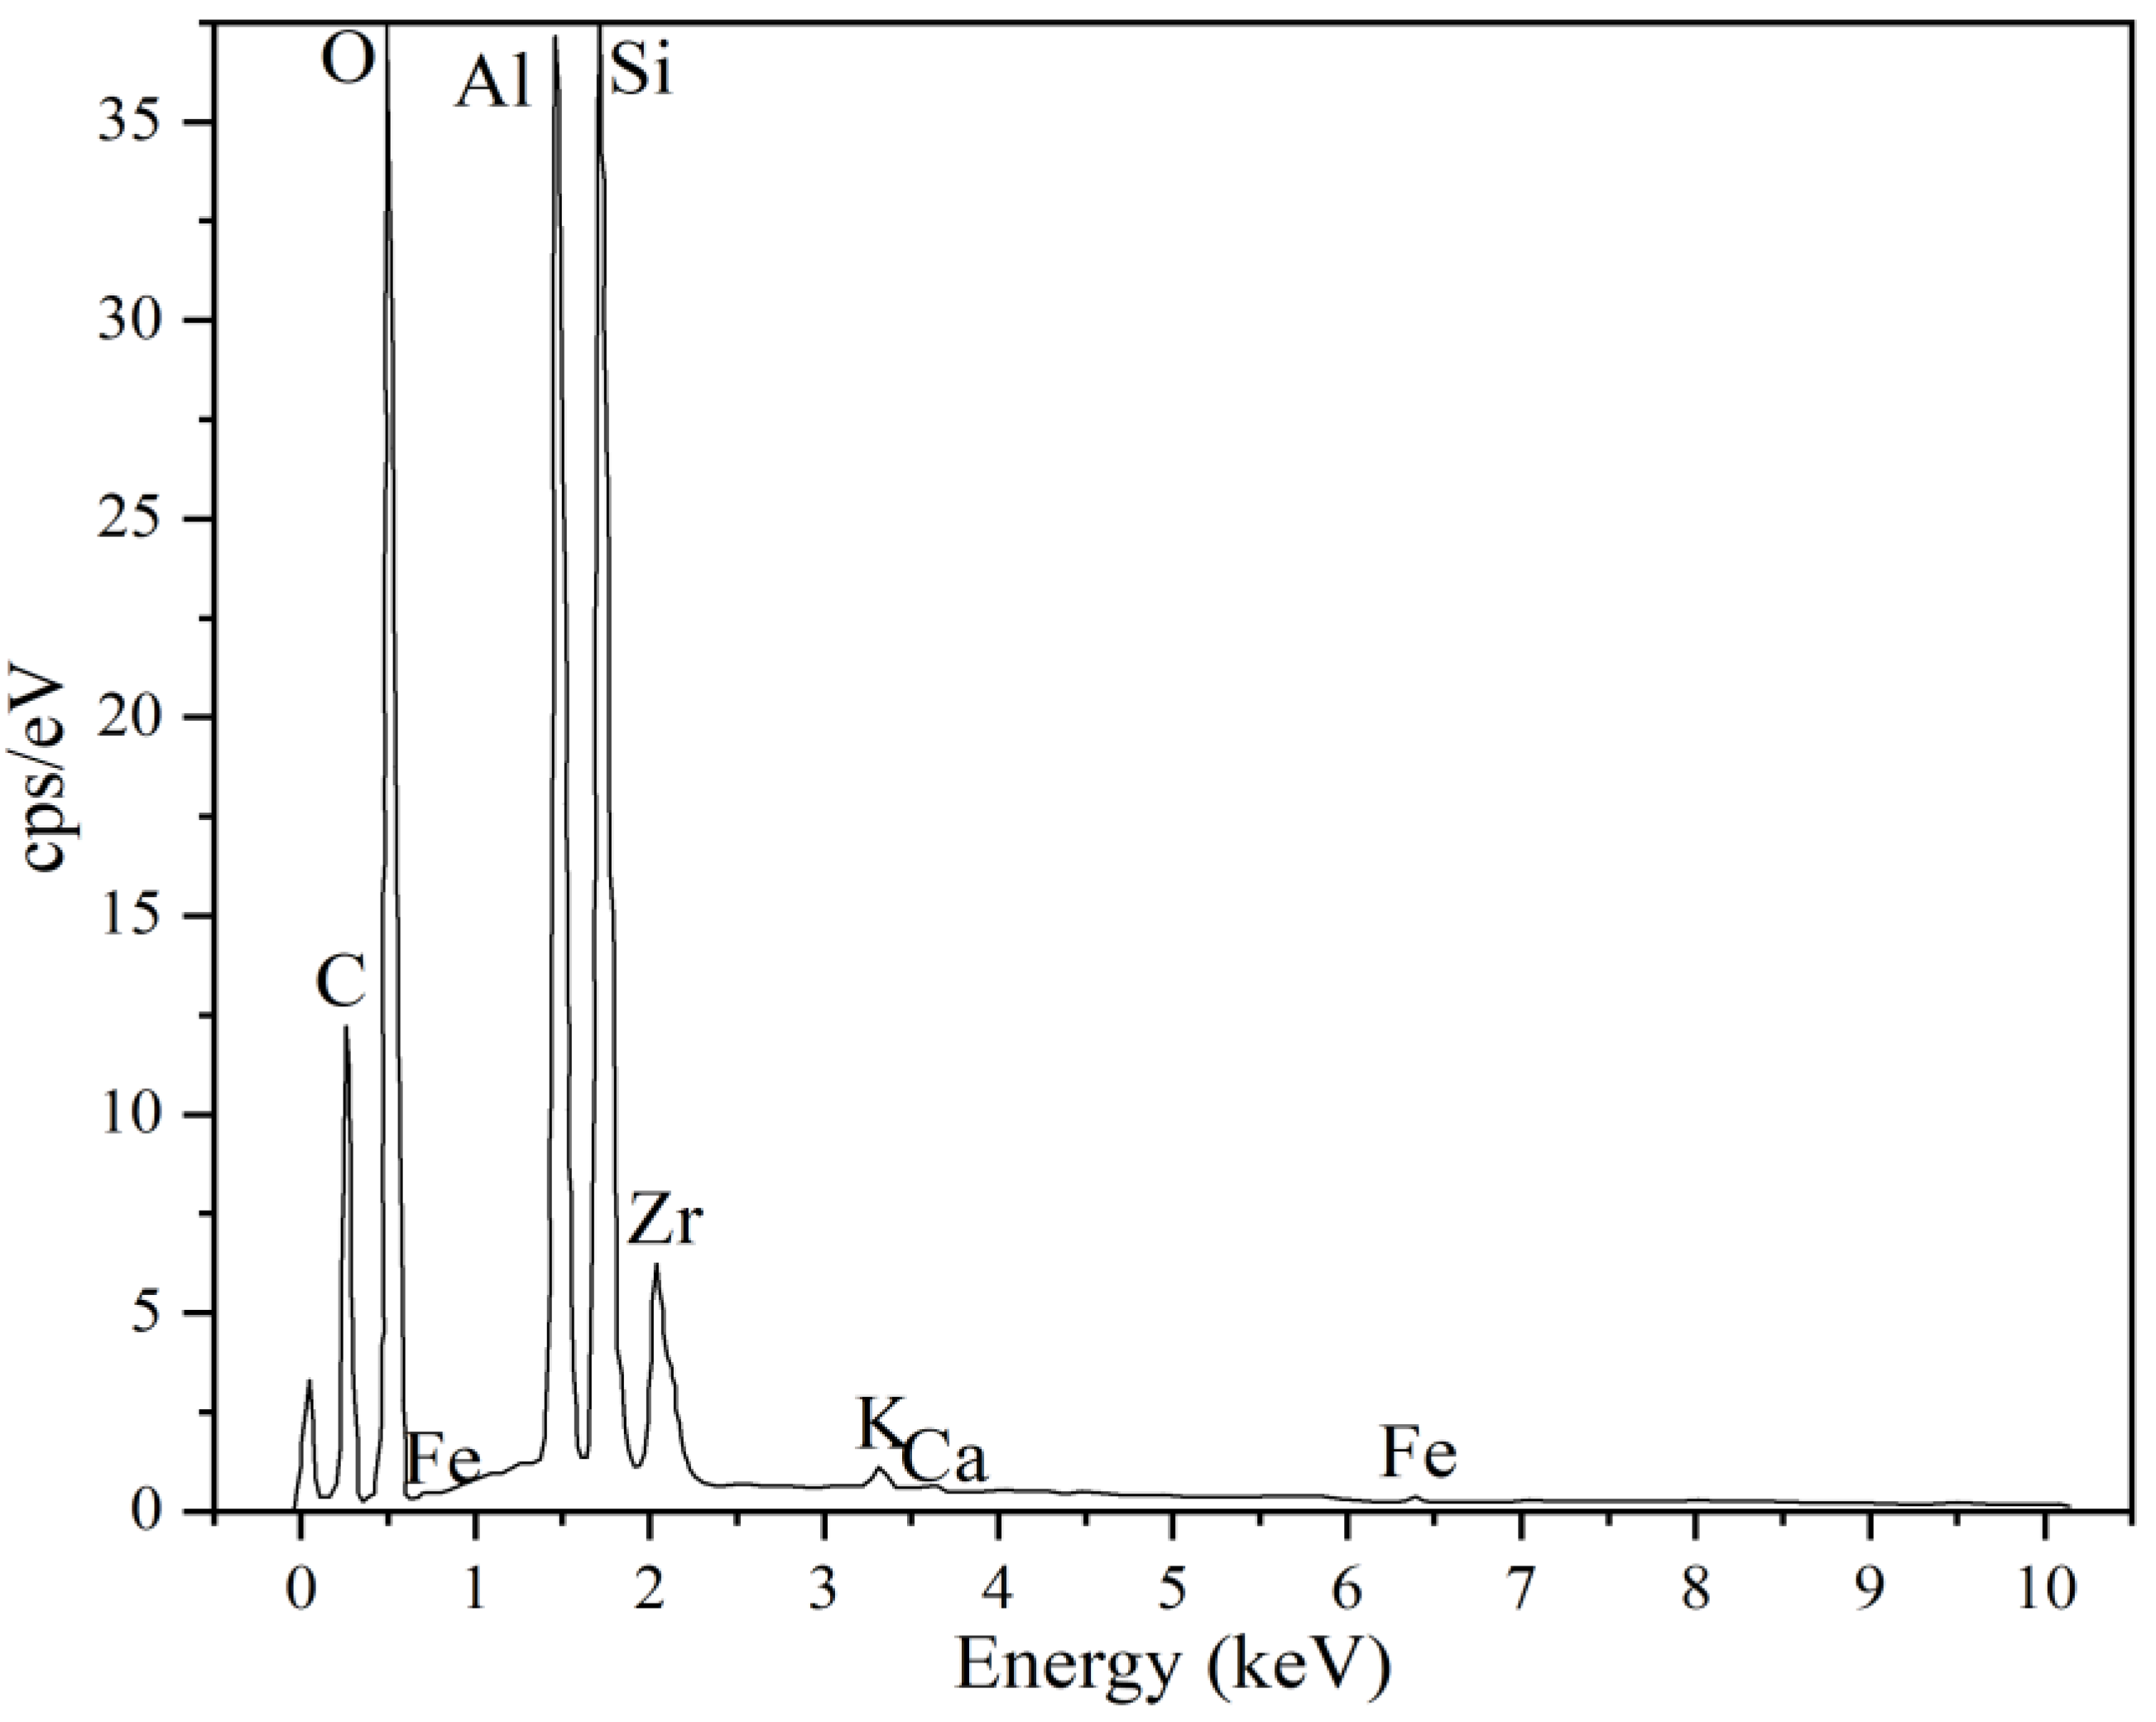
2.1. Materials and Characterization
2.2. Mechanical Activation
2.3. Design of Experiments (DoE)
- i.
- Maximize the amorphous content (Y1), as it is significantly more reactive than crystalline phases. While the amorphous content is mainly from Kaol transformation, the other crystalline phases in K (illite, microcline, and quartz) may also contribute to the total amorphous content through partial or complete amorphization.
- ii.
- Minimize the impurity of ZrO2 (Y2) to avoid impurities in the material and prevent the deterioration of the milling media.
- iii.
- Achieve a minimum (≈0%; target = 0) of crystalline Kaol (Y3) to ensure complete amorphization of the initial Kaol.
3. Results
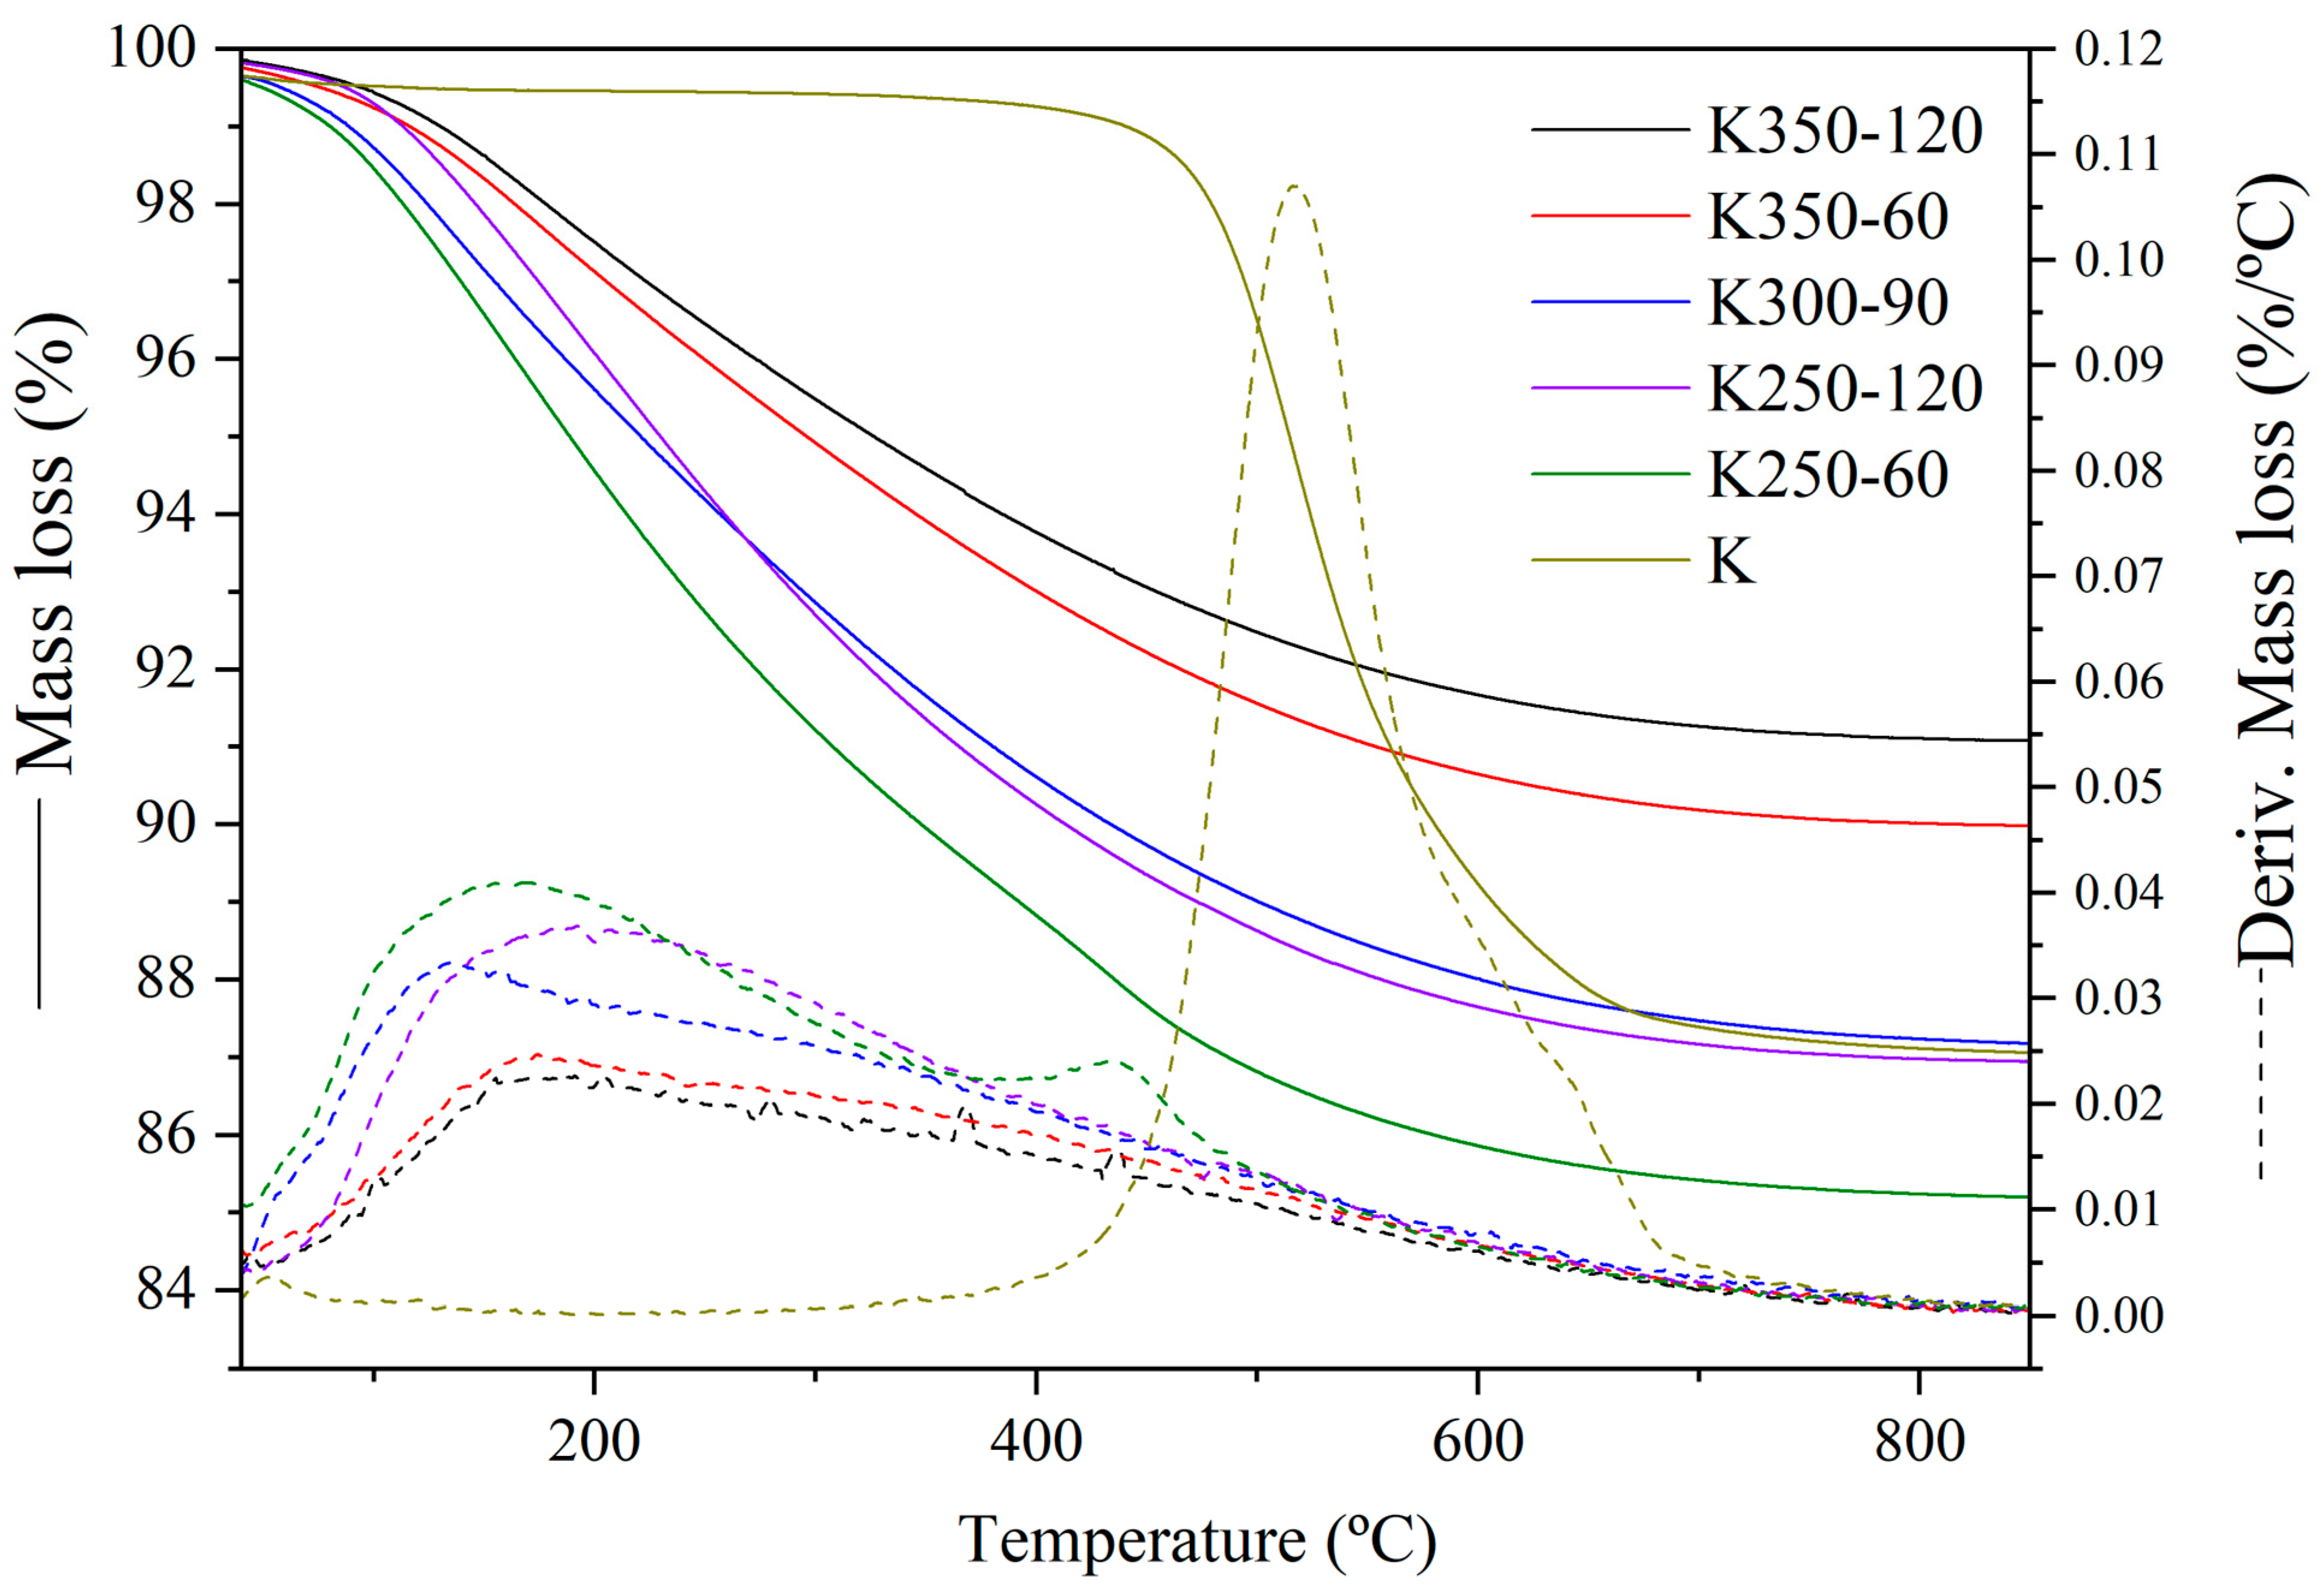
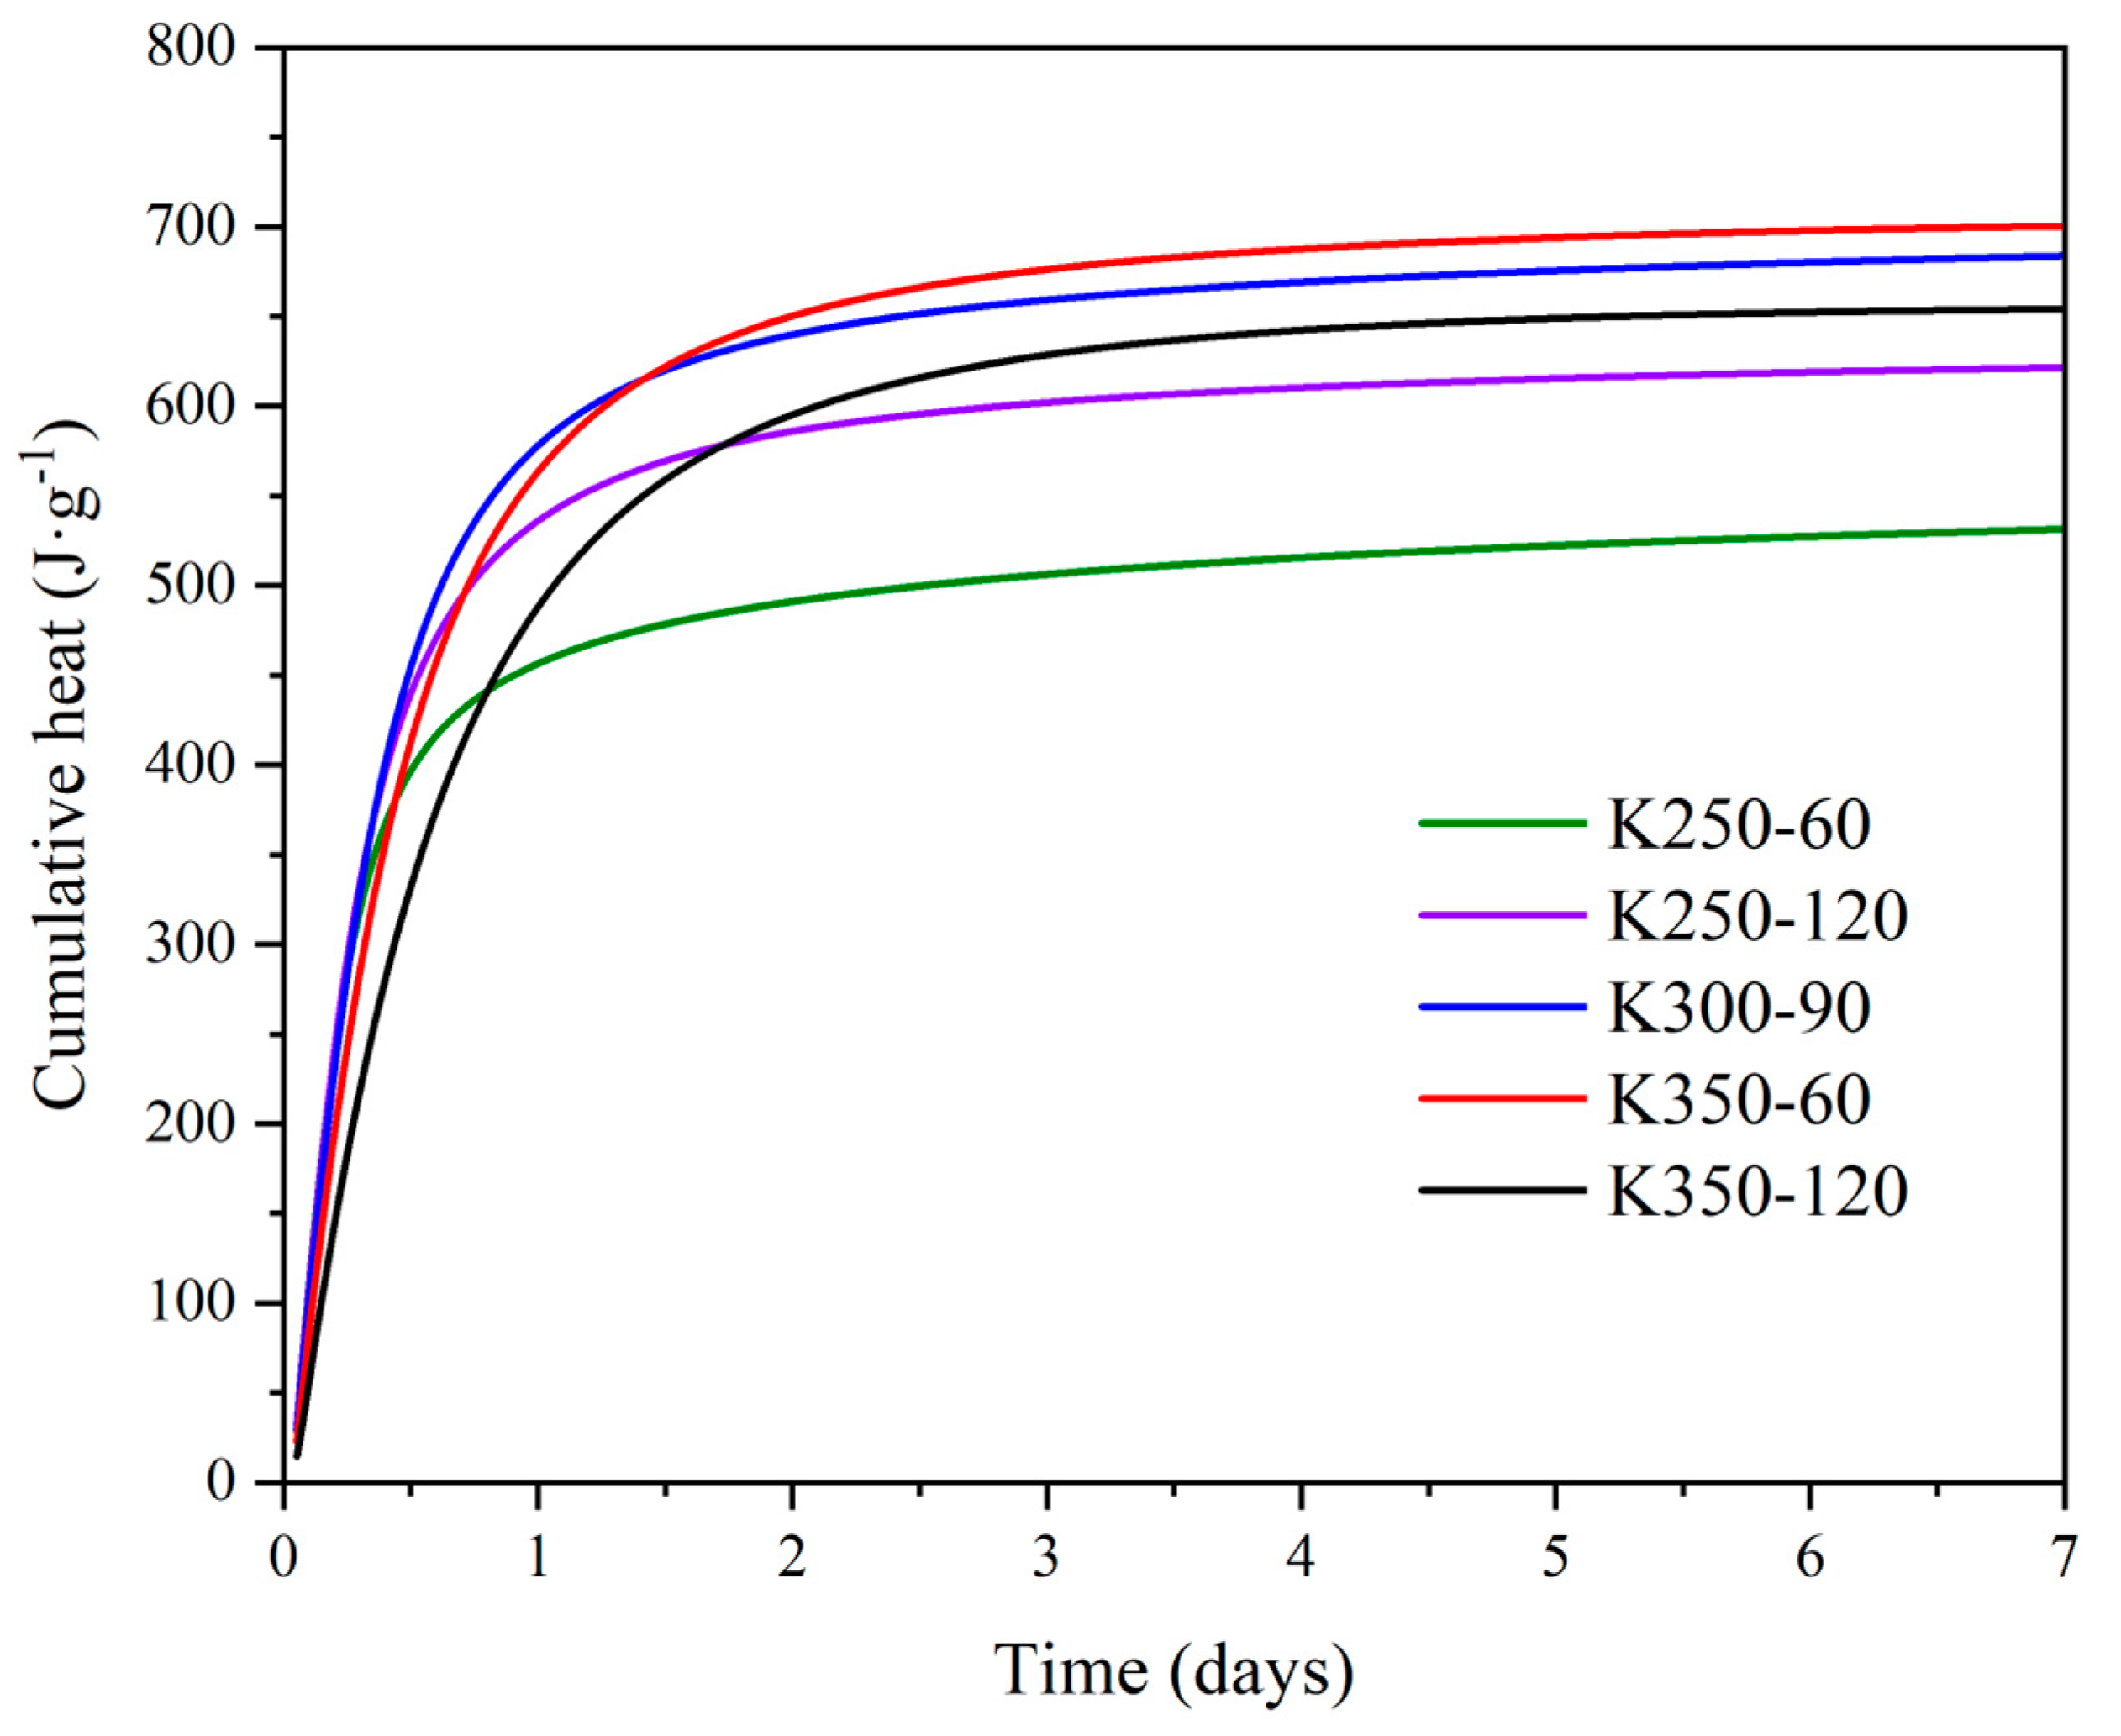
DoE Results
4. Discussion
5. Conclusions
Author Contributions
Funding
Data Availability Statement
Acknowledgments
Conflicts of Interest
References
- Winnefeld, F.; Leemann, A.; German, A.; Lothenbach, B. CO2 storage in cement and concrete by mineral carbonation. Curr. Opin. Green Sustain. Chem. 2022, 38, 100672. [Google Scholar] [CrossRef]
- Mohamad, N.; Muthusamy, K.; Embong, R.; Kusbiantoro, A.; Hashim, M.H. Environmental impact of cement production and Solutions: A review. Mater. Today Proc. 2022, 48, 741–746. [Google Scholar] [CrossRef]
- Yao, Y.; Ding, S.; Chen, Y. Modeling of the Thermal Efficiency of a Whole Cement Clinker Calcination System and Its Application on a 5000 MT/D Production Line. Energies 2020, 13, 5257. [Google Scholar] [CrossRef]
- Hosten, C.; Fidan, B. An industrial comparative study of cement clinker grinding systems regarding the specific energy consumption and cement properties. Powder Technol. 2012, 221, 183–188. [Google Scholar] [CrossRef]
- Supriya; Chaudhury, R.; Sharma, U.; Thapliyal, P.C.; Singh, L.P. Low-CO2 emission strategies to achieve net zero target in cement sector. J. Clean. Prod. 2023, 417, 137466. [Google Scholar] [CrossRef]
- Abdul-Wahab, S.A.; Al-Dhamri, H.; Ram, G.; Chatterjee, V.P. An overview of alternative raw materials used in cement and clinker manufacturing. Int. J. Sustain. Eng. 2021, 14, 743–760. [Google Scholar] [CrossRef]
- Pisciotta, M.; Pilorgé, H.; Davids, J.; Psarras, P. Opportunities for cement decarbonization. Clean. Eng. Technol. 2023, 15, 100667. [Google Scholar] [CrossRef]
- Chatterjee, A.; Sui, T. Alternative fuels—Effects on clinker process and properties. Cem. Concr. Res. 2019, 123, 105777. [Google Scholar] [CrossRef]
- Aguirre Castillo, J.; Broström, M.; Eriksson, M. Phase evolution and burnability of cement raw meal. Adv. Cem. Res. 2023, 35, 577–587. [Google Scholar] [CrossRef]
- Krour, H.; Trauchessec, R.; Lecomte, A.; Diliberto, C.; Barnes-Davin, L.; Bolze, B.; Delhay, A. Incorporation rate of recycled aggregates in cement raw meals. Constr. Build. Mater. 2020, 248, 118217. [Google Scholar] [CrossRef]
- Kriven, W.M.; Leonelli, C.; Provis, J.L.; Boccaccini, A.R.; Attwell, C.; Ducman, V.S.; Ferone, C.; Rossignol, S.; Luukkonen, T.; van Deventer, J.S.J.; et al. Why geopolymers and alkali-activated materials are key components of a sustainable world: A perspective contribution. J. Am. Ceram. Soc. 2024, 107, 5159–5177. [Google Scholar] [CrossRef]
- Shah, I.H.; Miller, S.A.; Jiang, D.; Myers, R.J. Cement substitution with secondary materials can reduce annual global CO2 emissions by up to 1.3 gigatons. Nat. Commun. 2022, 13, 5758. [Google Scholar] [CrossRef] [PubMed]
- Scrivener, K.L.; John, V.M.; Gartner, E.M. Eco-efficient cements: Potential economically viable solutions for a low-CO2 cement-based materials industry. Cem. Concr. Res. 2018, 114, 2–26. [Google Scholar] [CrossRef]
- Nehdi, M.L.; Marani, A.; Zhang, L. Is net-zero feasible: Systematic review of cement and concrete decarbonization technologies. Renew. Sustain. Energy Rev. 2024, 191, 114169. [Google Scholar] [CrossRef]
- Juenger, M.C.G.; Snellings, R.; Bernal, S.A. Supplementary cementitious materials: New sources, characterization, and performance insights. Cem. Concr. Res. 2019, 122, 257–273. [Google Scholar] [CrossRef]
- Suraneni, P.; Hajibabaee, A.; Ramanathan, S.; Wang, Y.; Weiss, J. New insights from reactivity testing of supplementary cementitious materials. Cem. Concr. Compos. 2019, 103, 331–338. [Google Scholar] [CrossRef]
- Scrivener, K.; Martirena, F.; Bishnoi, S.; Maity, S. Calcined clay limestone cements (LC3). Cem. Concr. Res. 2018, 114, 49–56. [Google Scholar] [CrossRef]
- Saillio, M.; Baroghel-Bouny, V.; Bertin, M.; Pradelle, S.; Vincent, J. Phase assemblage of cement pastes with SCM at different ages. Constr. Build. Mater. 2019, 224, 144–157. [Google Scholar] [CrossRef]
- Alvarez-Coscojuela, A.; Marco-Gibert, J.; Mañosa, J.; Formosa, J.; Chimenos, J.M. Thermal activation of kaolinite through potassium acetate intercalation: A structural and reactivity study. Appl. Clay Sci. 2024, 259, 107515. [Google Scholar] [CrossRef]
- Alujas Diaz, A.; Almenares Reyes, R.S.; Hanein, T.; Irassar, E.F.; Juenger, M.; Kanavaris, F.; Maier, M.; Marsh, A.T.; Sui, T.; Thienel, K.-C.; et al. Properties and occurrence of clay resources for use as supplementary cementitious materials: A paper of RILEM TC 282-CCL. Mater. Struct. 2022, 55, 139. [Google Scholar] [CrossRef]
- Weise, K.; Ukrainczyk, N.; Koenders, E. Pozzolanic Reactions of Metakaolin with Calcium Hydroxide: Review on Hydrate Phase Formations and Effect of Alkali Hydroxides, Carbonates and Sulfates. Mater. Des. 2023, 231, 112062. [Google Scholar] [CrossRef]
- Zunino, F.; Scrivener, K. Reactivity of kaolinitic clays calcined in the 650 °C–1050 °C temperature range: Towards a robust assessment of overcalcination. Cem. Concr. Compos. 2024, 146, 105380. [Google Scholar] [CrossRef]
- Daou, I.; Lecomte-Nana, G.L.; Tessier-Doyen, N.; Peyratout, C.; Gonon, M.F.; Guinebretiere, R. Probing the Dehydroxylation of Kaolinite and Halloysite by In Situ High Temperature X-ray Diffraction. Minerals 2020, 10, 480. [Google Scholar] [CrossRef]
- Hanein, T.; Thienel, K.-C.; Zunino, F.; Marsh, A.T.M.; Maier, M.; Wang, B.; Canut, M.; Juenger, M.C.G.; Ben Haha, M.; Avet, F.; et al. Clay calcination technology: State-of-the-art review by the RILEM TC 282-CCL. Mater. Struct. 2021, 55, 3. [Google Scholar] [CrossRef]
- Fitos, M.; Badogiannis, E.G.; Tsivilis, S.G.; Perraki, M. Pozzolanic activity of thermally and mechanically treated kaolins of hydrothermal origin. Appl. Clay Sci. 2015, 116–117, 182–192. [Google Scholar] [CrossRef]
- Balczár, I.; Korim, T.; Kovács, A.; Makó, É. Mechanochemical and thermal activation of kaolin for manufacturing geopolymer mortars—Comparative study. Ceram. Int. 2016, 42, 15367–15375. [Google Scholar] [CrossRef]
- Souri, A.; Kazemi-Kamyab, H.; Snellings, R.; Naghizadeh, R.; Golestani-Fard, F.; Scrivener, K. Pozzolanic activity of mechanochemically and thermally activated kaolins in cement. Cem. Concr. Res. 2015, 77, 47–59. [Google Scholar] [CrossRef]
- Mañosa, J.; Gómez-Carrera, A.M.; Svobodova-Sedlackova, A.; Maldonado-Alameda, A.; Fernández-Jiménez, A.; Chimenos, J.M. Potential reactivity assessment of mechanically activated kaolin as alternative cement precursor. Appl. Clay Sci. 2022, 228, 106648. [Google Scholar] [CrossRef]
- Mañosa, J.; Calvo de la Rosa, J.; Silvello, A.; Maldonado, A.; Chimenos, J. Kaolinite structural modifications induced by mechanical activation. Appl. Clay Sci. 2023, 238, 106918. [Google Scholar] [CrossRef]
- Bizley, D. World Cement. 2023. Available online: https://www.worldcement.com/product-news/12122023/thyssenkrupp-polysius-presents-new-meca-clay-clinker-reduction-solution/ (accessed on 19 September 2024).
- Li, J.; Hitch, M. Mechanical activation of magnesium silicates for mineral carbonation, a review. Miner. Eng. 2018, 128, 69–83. [Google Scholar] [CrossRef]
- Li, X.; Snellings, R.; Antoni, M.; Alderete, N.M.; Ben Haha, M.; Bishnoi, S.; Cizer, Ö.; Cyr, M.; De Weerdt, K.; Dhandapani, Y.; et al. Reactivity tests for supplementary cementitious materials: RILEM TC 267-TRM phase 1. Mater. Struct. 2018, 51, 151. [Google Scholar] [CrossRef]
- Ababneh, A.; Matalkah, F.; Matalkeh, B. Effects of kaolin characteristics on the mechanical properties of alkali-activated binders. Constr. Build. Mater. 2022, 318, 126020. [Google Scholar] [CrossRef]
- Avet, F.; Snellings, R.; Alujas Diaz, A.; Ben Haha, M.; Scrivener, K. Development of a new rapid, relevant and reliable (R3) test method to evaluate the pozzolanic reactivity of calcined kaolinitic clays. Cem. Concr. Res. 2016, 85, 1–11. [Google Scholar] [CrossRef]
- Farhanchi, M.; Neysari, M.; Vatankhah Barenji, R.; Heidarzadeh, A.; Taherzadeh Mousavian, R. Mechanical activation process for self-propagation high-temperature synthesis of ceramic-based composites. J. Therm. Anal. Calorim. 2015, 122, 123–133. [Google Scholar] [CrossRef]
- ASTM C1897-20; ASTM International Standard Test Methods for Measuring the Reactivity of Supplementary Cementitious Materials by Isothermal Calorimetry and Bound Water Measurements. ASTM: West Conshohocken, PA, USA, 2020.
- Chen, G.; Xiong, K.; Peng, J.; Chen, J. Optimization of combined mechanical activation-roasting parameters of titania slag using response surface methodology. Adv. Powder Technol. 2010, 21, 331–335. [Google Scholar] [CrossRef]
- Sperinck, S.; Raiteri, P.; Marks, N.; Wright, K. Dehydroxylation of kaolinite to metakaolin—A molecular dynamics study. J. Mater. Chem. 2011, 21, 2118–2125. [Google Scholar] [CrossRef]
- Horváth, E.; Kristóf, J.; Frost, R.L. Vibrational Spectroscopy of Intercalated Kaolinites. Part I. Appl. Spectrosc. Rev. 2010, 45, 130–147. [Google Scholar] [CrossRef]
- Alex, T.C.; Kumar, R.; Roy, S.K.; Mehrotra, S.P. Mechanical Activation of Al-oxyhydroxide Minerals–A Review. Miner. Process. Extr. Metall. Rev. 2016, 37, 1–26. [Google Scholar] [CrossRef]
- Sun, D.; Li, B.; Li, Y.; Yu, C.; Zhang, B.; Fei, H. Characterization of exfoliated/delamination kaolinite. Mater. Res. Bull. 2011, 46, 101–104. [Google Scholar] [CrossRef]
- D’Elia, A.; Pinto, D.; Eramo, G.; Giannossa, L.C.; Ventruti, G.; Laviano, R. Effects of processing on the mineralogy and solubility of carbonate-rich clays for alkaline activation purpose: Mechanical, thermal activation in red/ox atmosphere and their combination. Appl. Clay Sci. 2018, 152, 9–21. [Google Scholar] [CrossRef]
- Ptáček, P.; Opravil, T.; Šoukal, F.; Havlica, J.; Másilko, J.; Wasserbauer, J. Preparation of dehydroxylated and delaminated talc: Meta-talc. Ceram. Int. 2013, 39, 9055–9061. [Google Scholar] [CrossRef]
- Sánchez-Soto, P.J.; del Carmen Jiménez de Haro, M.; Pérez-Maqueda, L.A.; Varona, I.; Pérez-Rodríguez, J.L. Effects of Dry Grinding on the Structural Changes of Kaolinite Powders. J. Am. Ceram. Soc. 2000, 83, 1649–1657. [Google Scholar] [CrossRef]
- Ilić, B.; Radonjanin, V.; Malešev, M.; Zdujić, M.; Mitrović, A. Effects of mechanical and thermal activation on pozzolanic activity of kaolin containing mica. Appl. Clay Sci. 2016, 123, 173–181. [Google Scholar] [CrossRef]
- Miyazaki, M.; Kamitani, M.; Nagai, T.; Kano, J.; Saito, F. Amorphization of kaolinite and media motion in grinding by a double rotating cylinders mill—A comparison with a tumbling ball mill. Adv. Powder Technol. 2000, 11, 235–244. [Google Scholar] [CrossRef]
- Baláž, P. Mechanochemistry in Nanoscience and Minerals Engineering; Springer: Berlin/Heidelberg, Germany, 2008; ISBN 978-3-642-09426-2. [Google Scholar]
- Horváth, E.; Frost, R.L.; Makó, É.; Kristóf, J.; Cseh, T. Thermal treatment of mechanochemically activated kaolinite. Thermochim. Acta 2003, 404, 227–234. [Google Scholar] [CrossRef]
- Yao, G.; Cui, T.; Zhang, J.; Wang, J.; Lyu, X. Effects of mechanical grinding on pozzolanic activity and hydration properties of quartz. Adv. Powder Technol. 2020, 31, 4500–4509. [Google Scholar] [CrossRef]


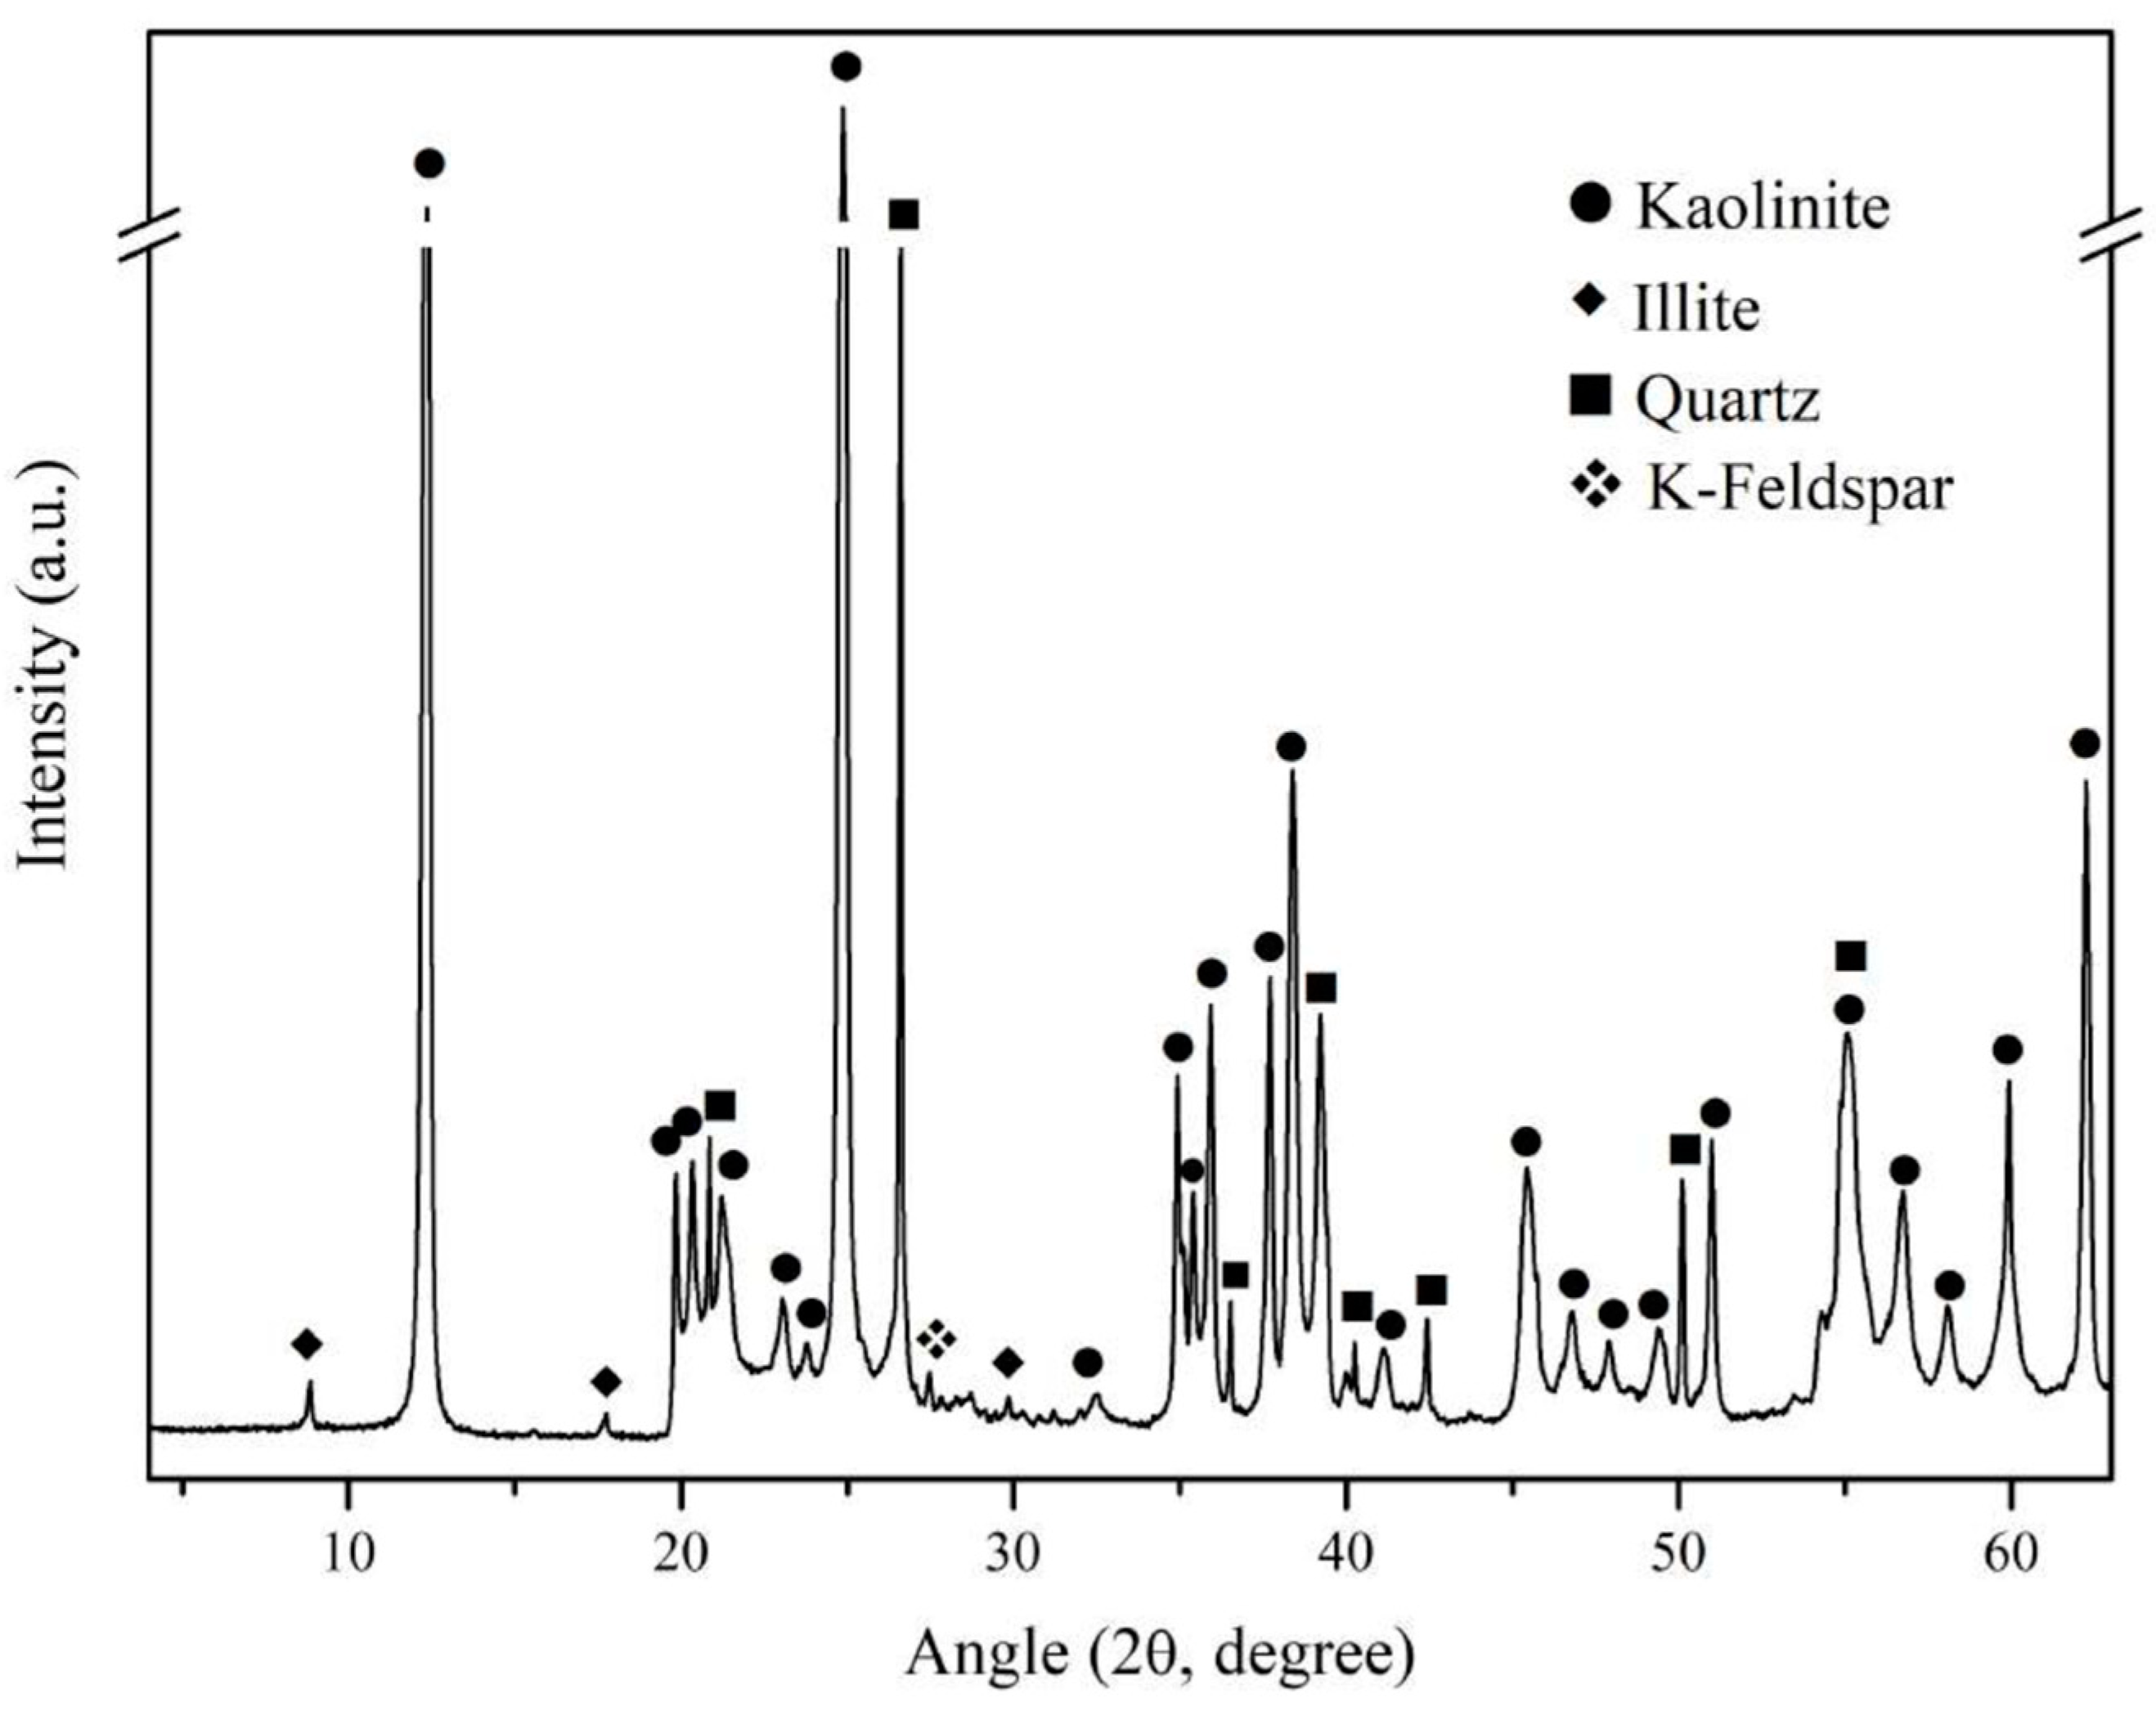
| Compound | SiO2 | Al2O3 | K2O | Fe2O3 | CaO | TiO2 | Na2O | MgO | P2O5 | LOI a |
|---|---|---|---|---|---|---|---|---|---|---|
| wt.% | 49.85 | 36.31 | 0.69 | 0.47 | 0.16 | 0.15 | 0.13 | 0.11 | 0.08 | 12.50 |
| Mineral Phases | (wt.%) |
|---|---|
| Kaolinite | 82.0 |
| Quartz | 5.7 |
| Illite | 5.3 |
| K-feldspar | 1.6 |
| Amorphous content | 5.4 |
| Independent Variables | Symbol | Range and Levels | ||
|---|---|---|---|---|
| −1 | 0 | +1 | ||
| Rotation speed (rpm) | X1 | 250 | 300 | 350 |
| Milling time (min) | X2 | 60 | 90 | 120 |
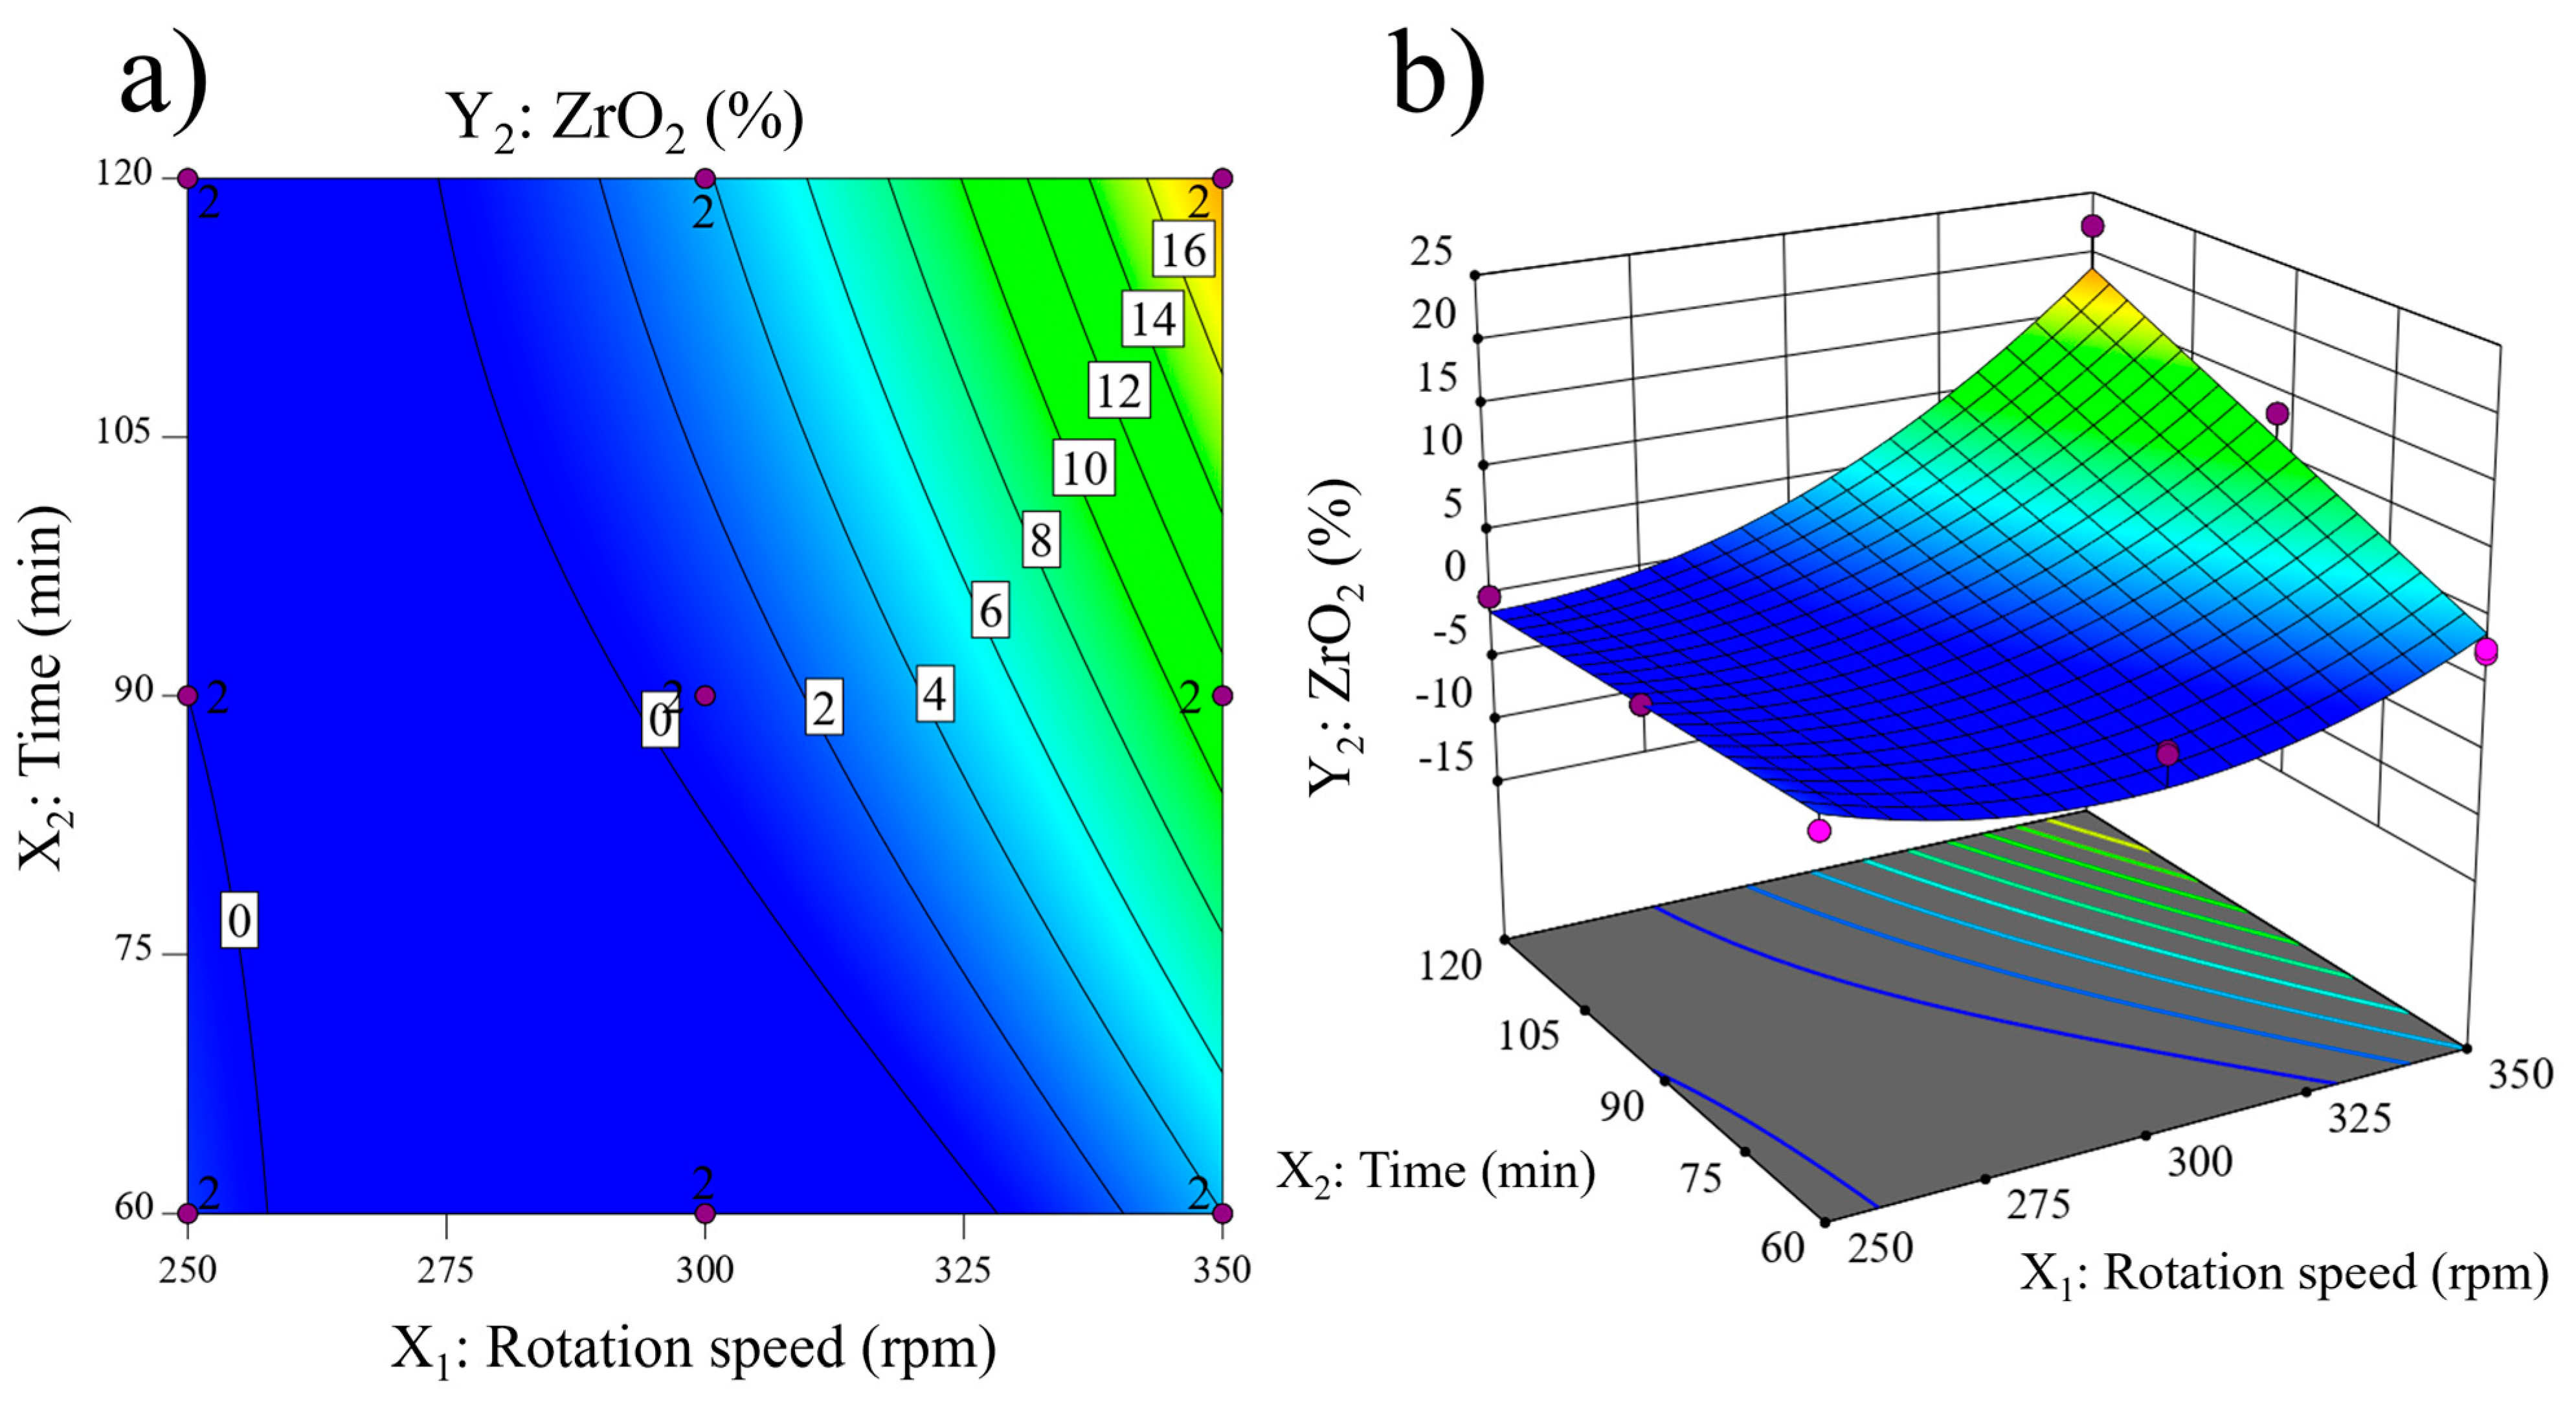
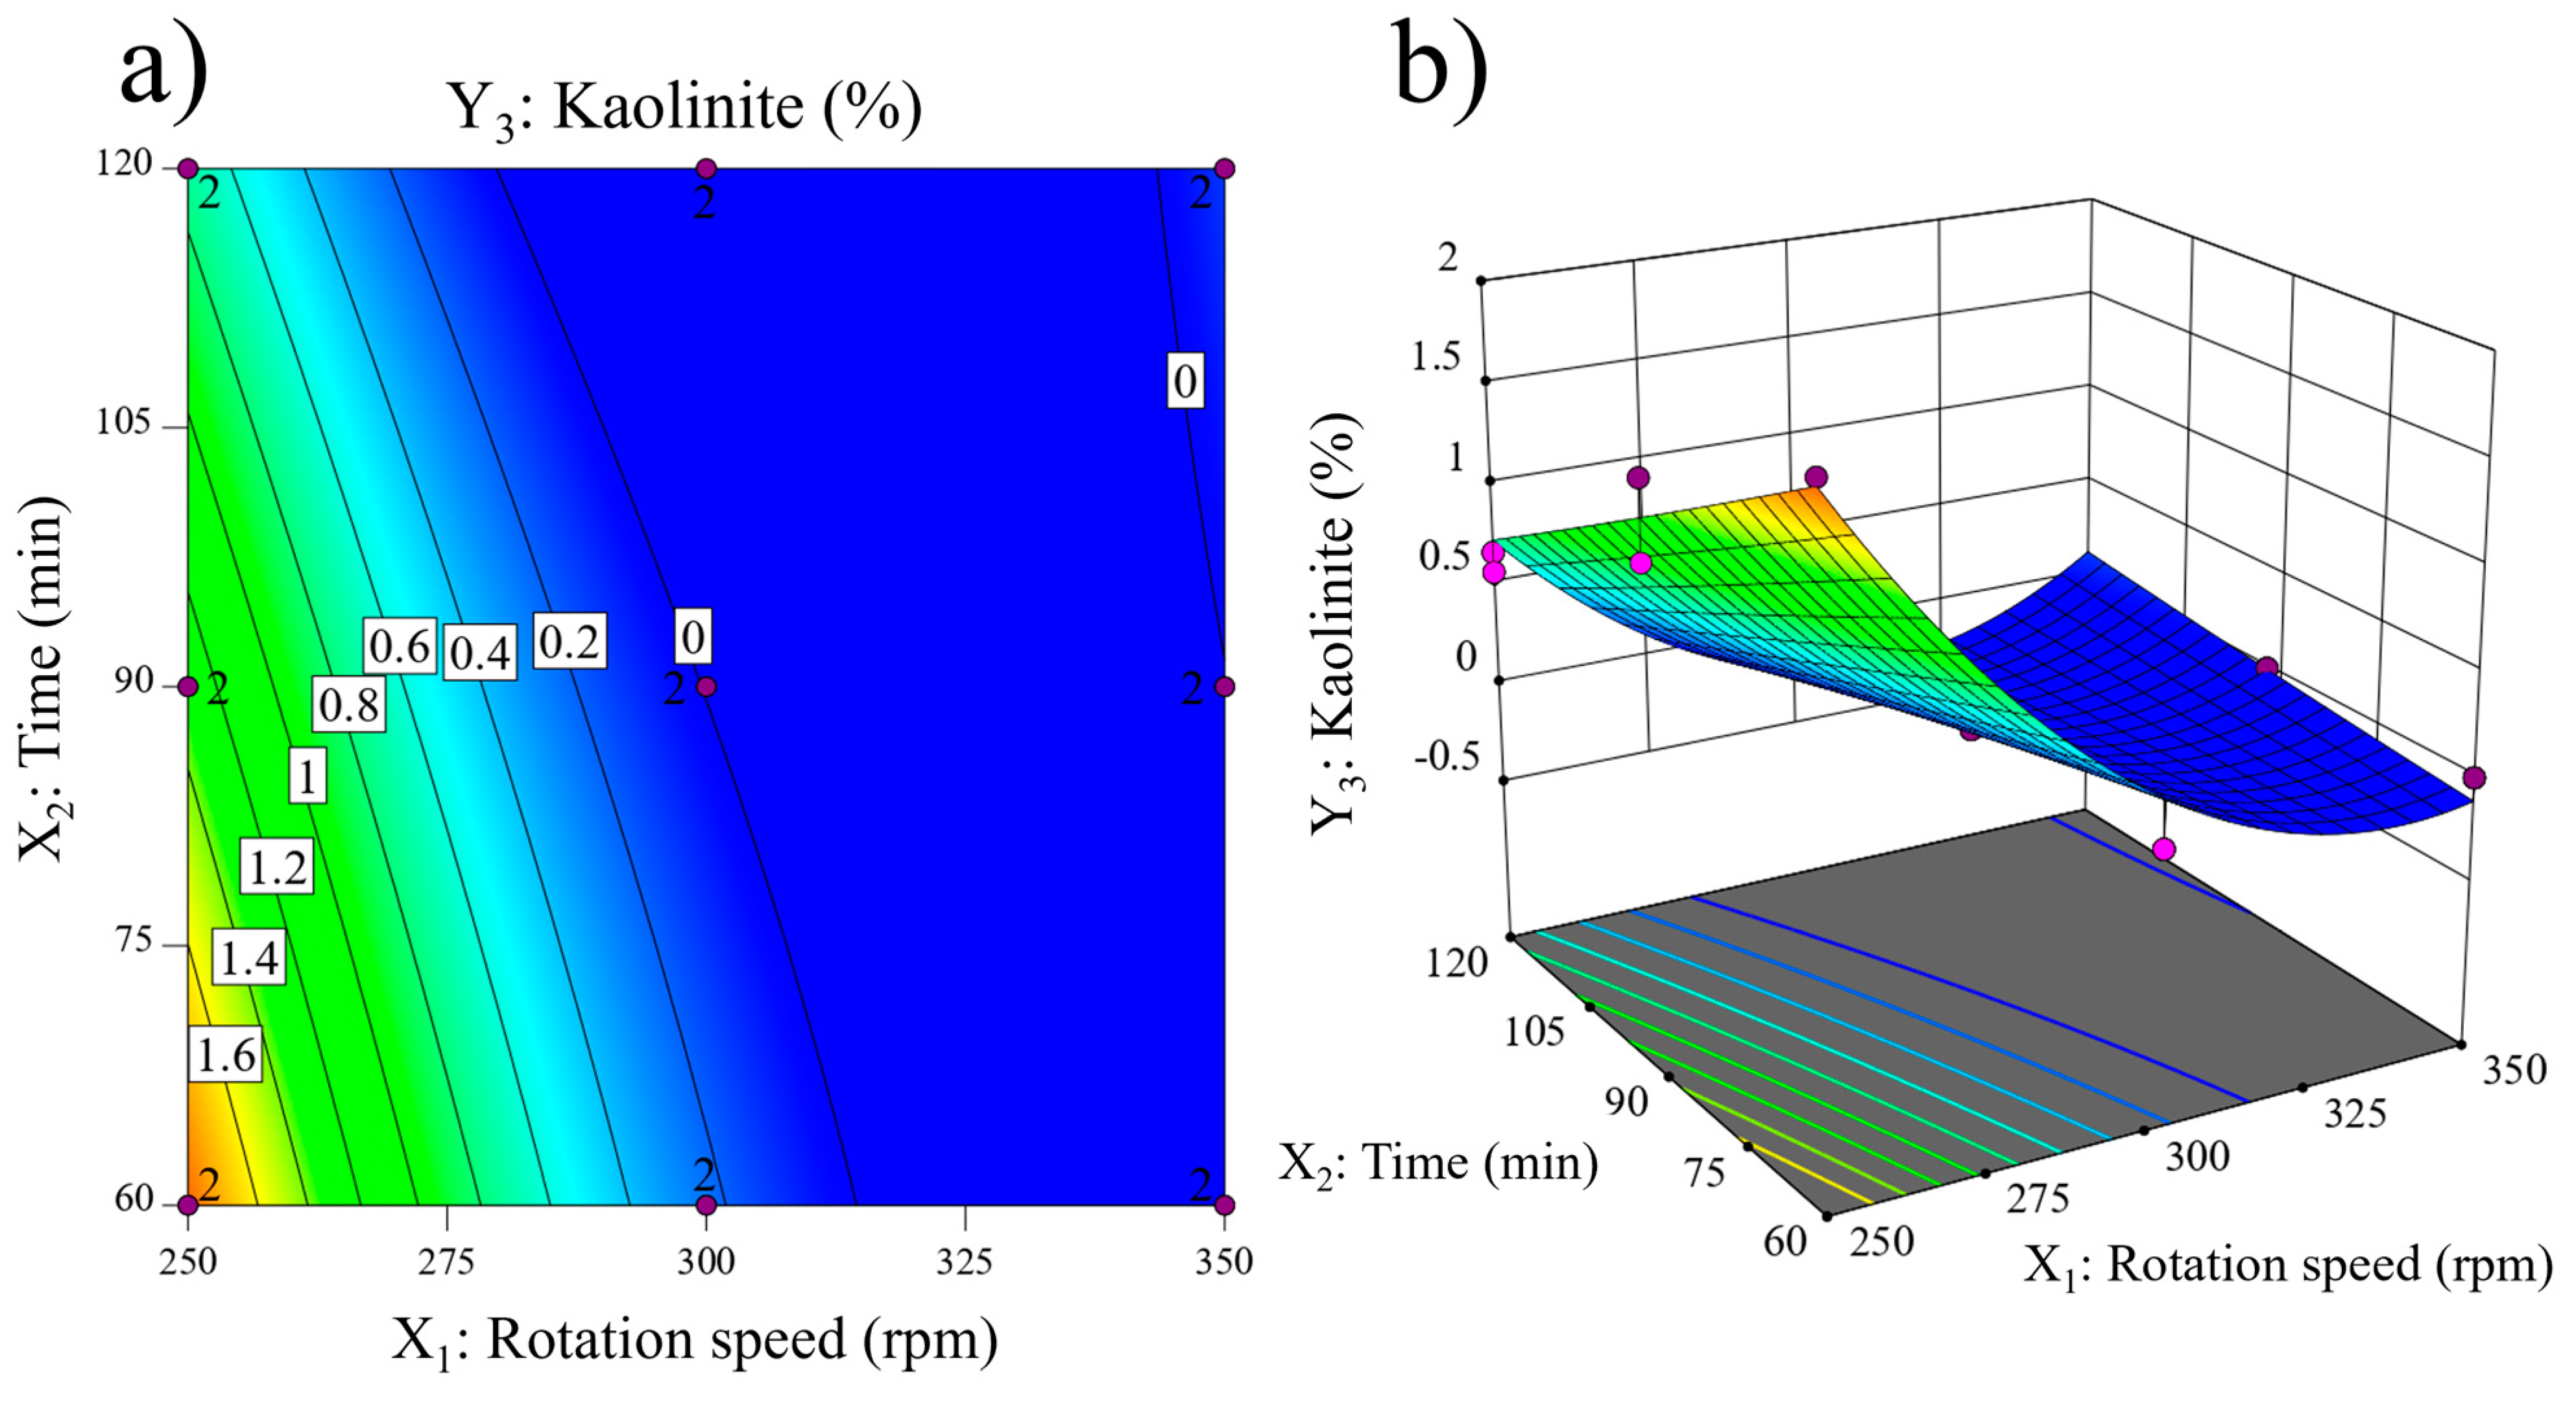
| Experiment | X1 (rpm) | X2 (Min) | Y1 (%) | Y2 (%) | Y3 (%) |
|---|---|---|---|---|---|
| 1 | 250 (−1) | 60 (−1) | 89.92 | - | 1.94 |
| 2 | 250 (−1) | 60 (−1) | 89.71 | - | 2.11 |
| 3 | 350 (+1) | 60 (−1) | 87.73 | 2.46 | - |
| 4 | 350 (+1) | 60 (−1) | 87.94 | 2.83 | - |
| 5 | 250 (−1) | 120 (+1) | 91.92 | - | 0.67 |
| 6 | 250 (−1) | 120 (+1) | 92.05 | - | 0.57 |
| 7 | 350 (+1) | 120 (+1) | 67.24 | 22.25 | - |
| 8 | 350 (+1) | 120 (+1) | 71.81 | 17.48 | - |
| 9 | 250 (−1) | 90 (0) | 91.26 | - | 1.10 |
| 10 | 250 (−1) | 90 (0) | 91.09 | - | 1.49 |
| 11 | 350 (+1) | 90 (0) | 74.54 | 13.38 | - |
| 12 | 350 (+1) | 90 (0) | 79.40 | 10.00 | - |
| 13 | 300 (0) | 60 (−1) | 91.72 | 0.31 | - |
| 14 | 300 (0) | 60 (−1) | 92.82 | 0.03 | - |
| 15 | 300 (0) | 120 (+1) | 88.51 | 2.00 | - |
| 16 | 300 (0) | 120 (+1) | 90.88 | 1.17 | - |
| 17 | 300 (0) | 90 (0) | 91.94 | 0.57 | - |
| 18 | 300 (0) | 90 (0) | 92.85 | 0.30 | - |
| Coefficient | Y1 | Y2 | Y3 | |||
|---|---|---|---|---|---|---|
| Value | p-Value | Value | p-Value | Value | p-Value | |
| b0 | 91.45 | 0.73 | −0.01 | |||
| b1 | −6.44 | <0.0001 | 5.70 | <0.0001 | −0.66 | <0.0001 |
| b2 | −3.12 | 0.0002 | 3.11 | 0.0002 | −0.23 | 0.0010 |
| b12 | −5.12 | <0.0001 | 4.31 | <0.0001 | 0.35 | 0.0002 |
| b11 | −6.90 | <0.0001 | 4.97 | 0.0005 | 0.66 | <0.0001 |
| b22 | 0.01 | 0.9944 * | 0.00 | 0.9981 * | 0.01 | 0.9240 * |
Disclaimer/Publisher’s Note: The statements, opinions and data contained in all publications are solely those of the individual author(s) and contributor(s) and not of MDPI and/or the editor(s). MDPI and/or the editor(s) disclaim responsibility for any injury to people or property resulting from any ideas, methods, instructions or products referred to in the content. |
© 2024 by the authors. Licensee MDPI, Basel, Switzerland. This article is an open access article distributed under the terms and conditions of the Creative Commons Attribution (CC BY) license (https://creativecommons.org/licenses/by/4.0/).
Share and Cite
Mañosa, J.; Alvarez-Coscojuela, A.; Maldonado-Alameda, A.; Chimenos, J.M. A Lab-Scale Evaluation of Parameters Influencing the Mechanical Activation of Kaolin Using the Design of Experiments. Materials 2024, 17, 4651. https://doi.org/10.3390/ma17184651
Mañosa J, Alvarez-Coscojuela A, Maldonado-Alameda A, Chimenos JM. A Lab-Scale Evaluation of Parameters Influencing the Mechanical Activation of Kaolin Using the Design of Experiments. Materials. 2024; 17(18):4651. https://doi.org/10.3390/ma17184651
Chicago/Turabian StyleMañosa, Jofre, Adrian Alvarez-Coscojuela, Alex Maldonado-Alameda, and Josep Maria Chimenos. 2024. "A Lab-Scale Evaluation of Parameters Influencing the Mechanical Activation of Kaolin Using the Design of Experiments" Materials 17, no. 18: 4651. https://doi.org/10.3390/ma17184651
APA StyleMañosa, J., Alvarez-Coscojuela, A., Maldonado-Alameda, A., & Chimenos, J. M. (2024). A Lab-Scale Evaluation of Parameters Influencing the Mechanical Activation of Kaolin Using the Design of Experiments. Materials, 17(18), 4651. https://doi.org/10.3390/ma17184651