
Marble Powder as a Soil Stabilizer: An Experimental Investigation of the Geotechnical Properties and Unconfined Compressive Strength Analysis


Abstract
1. Introduction
2. Materials and Method
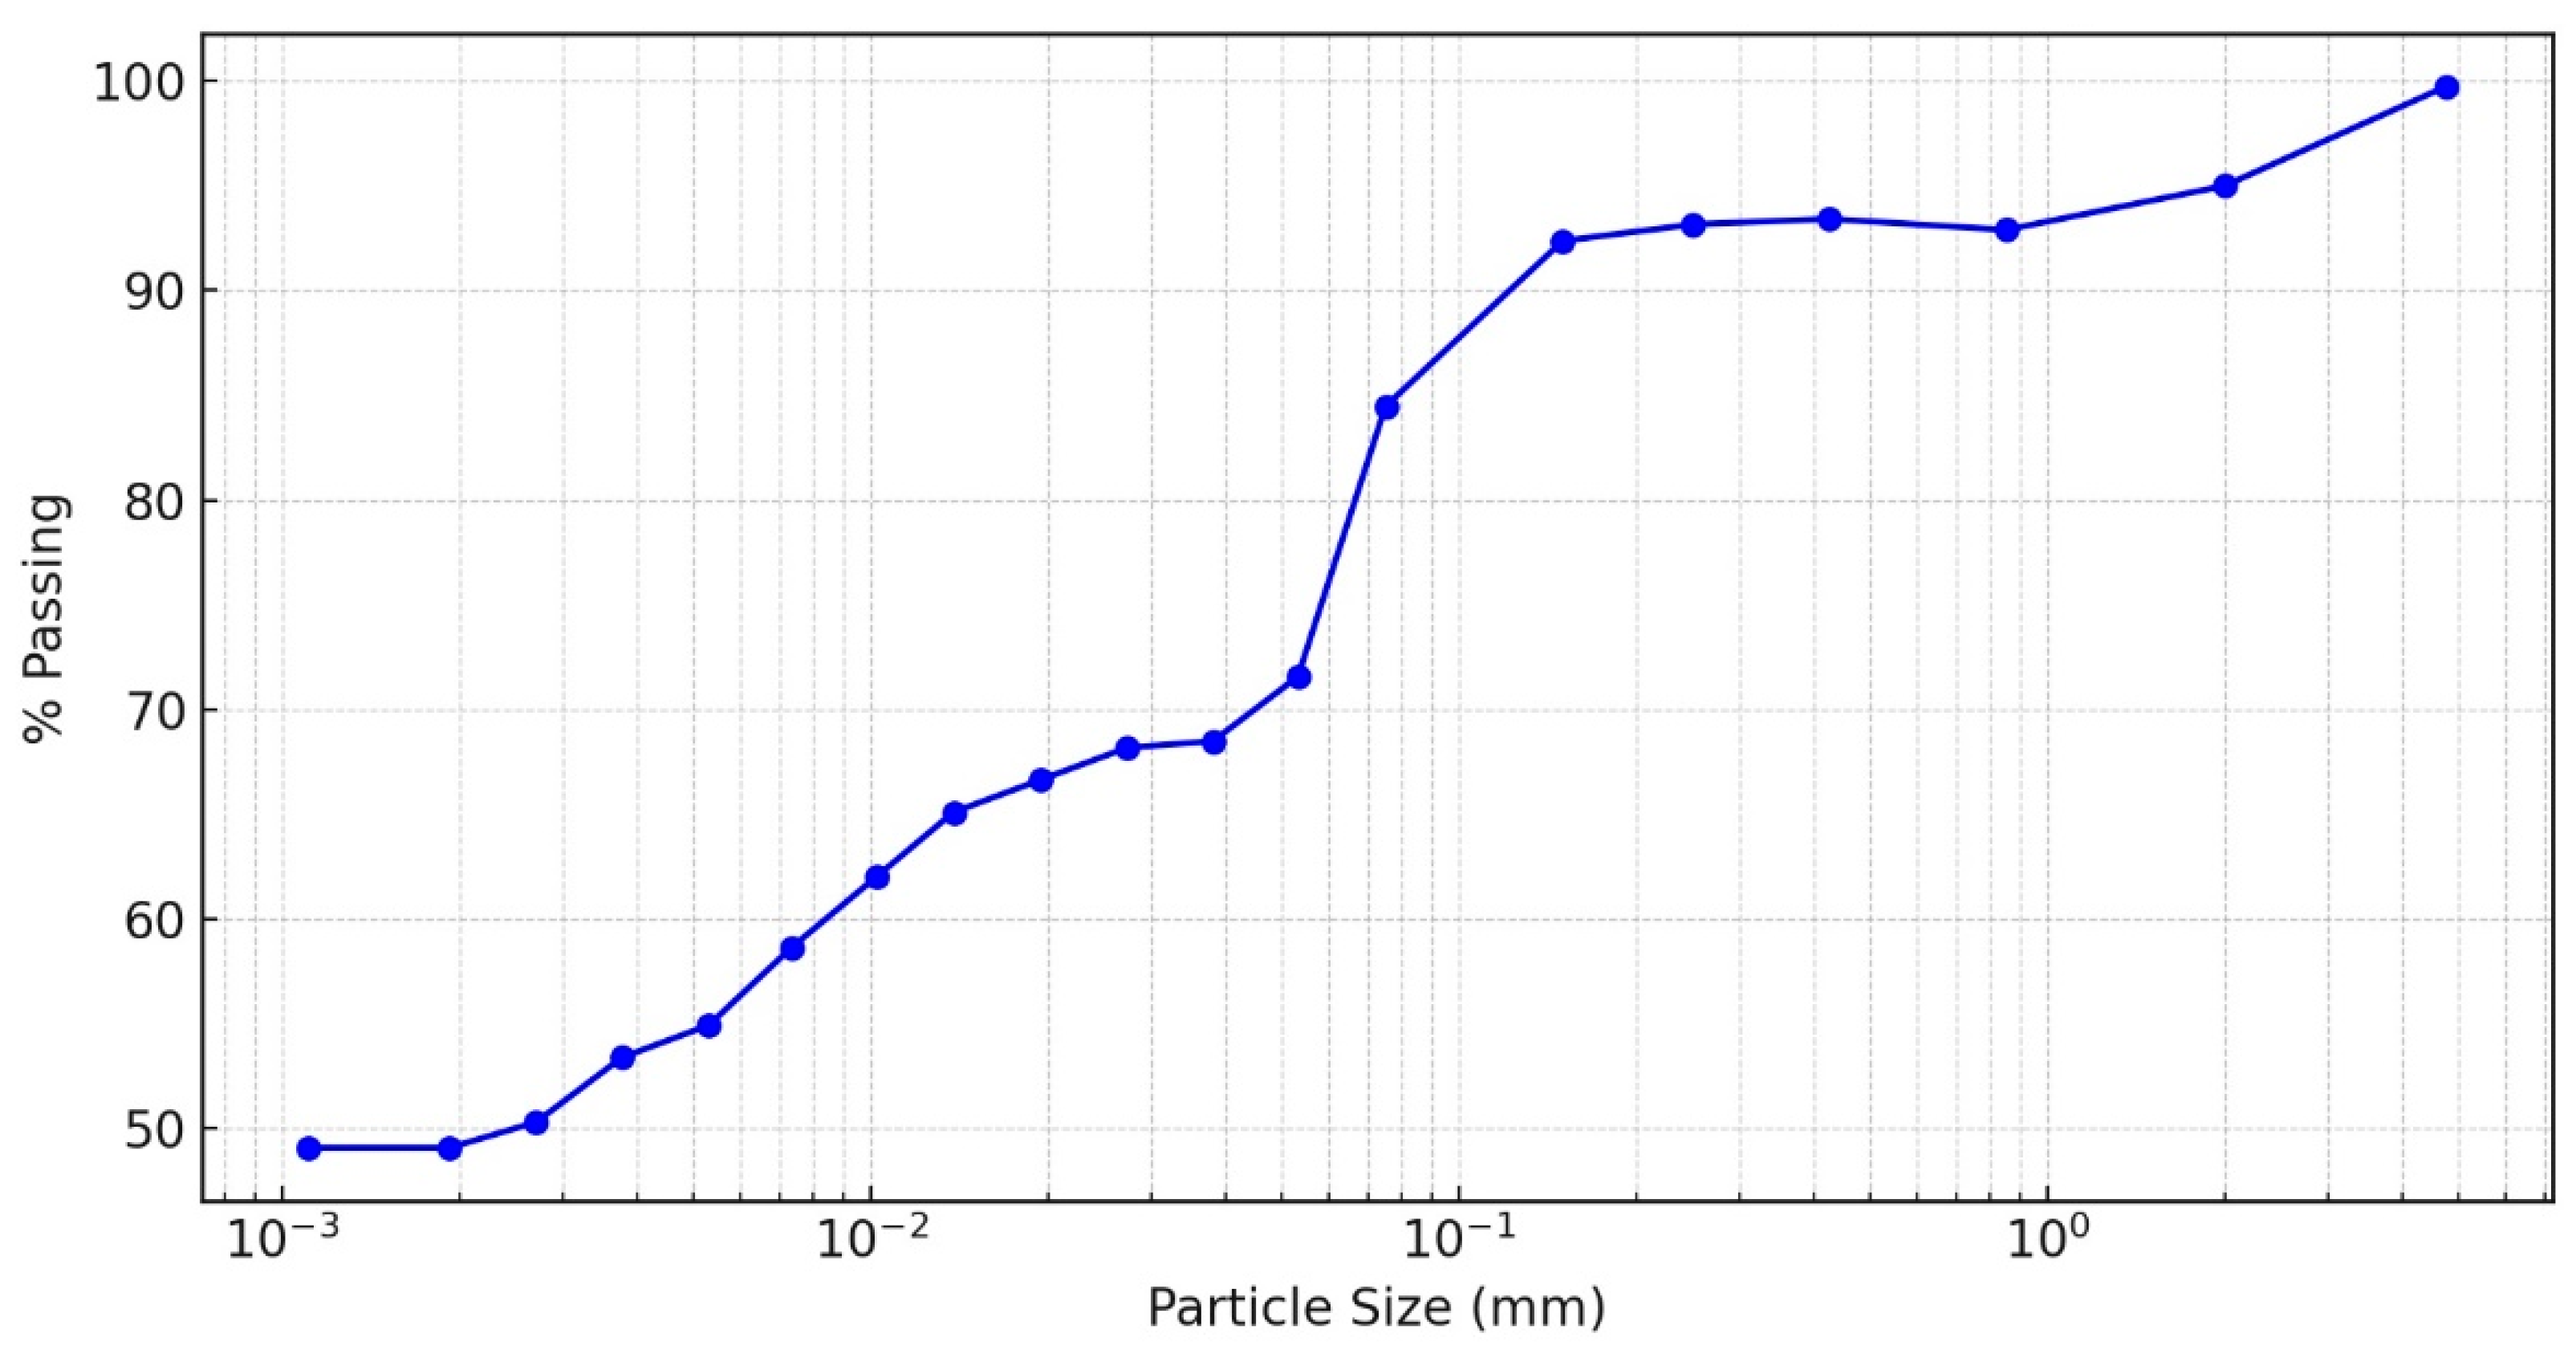
2.1. Materials
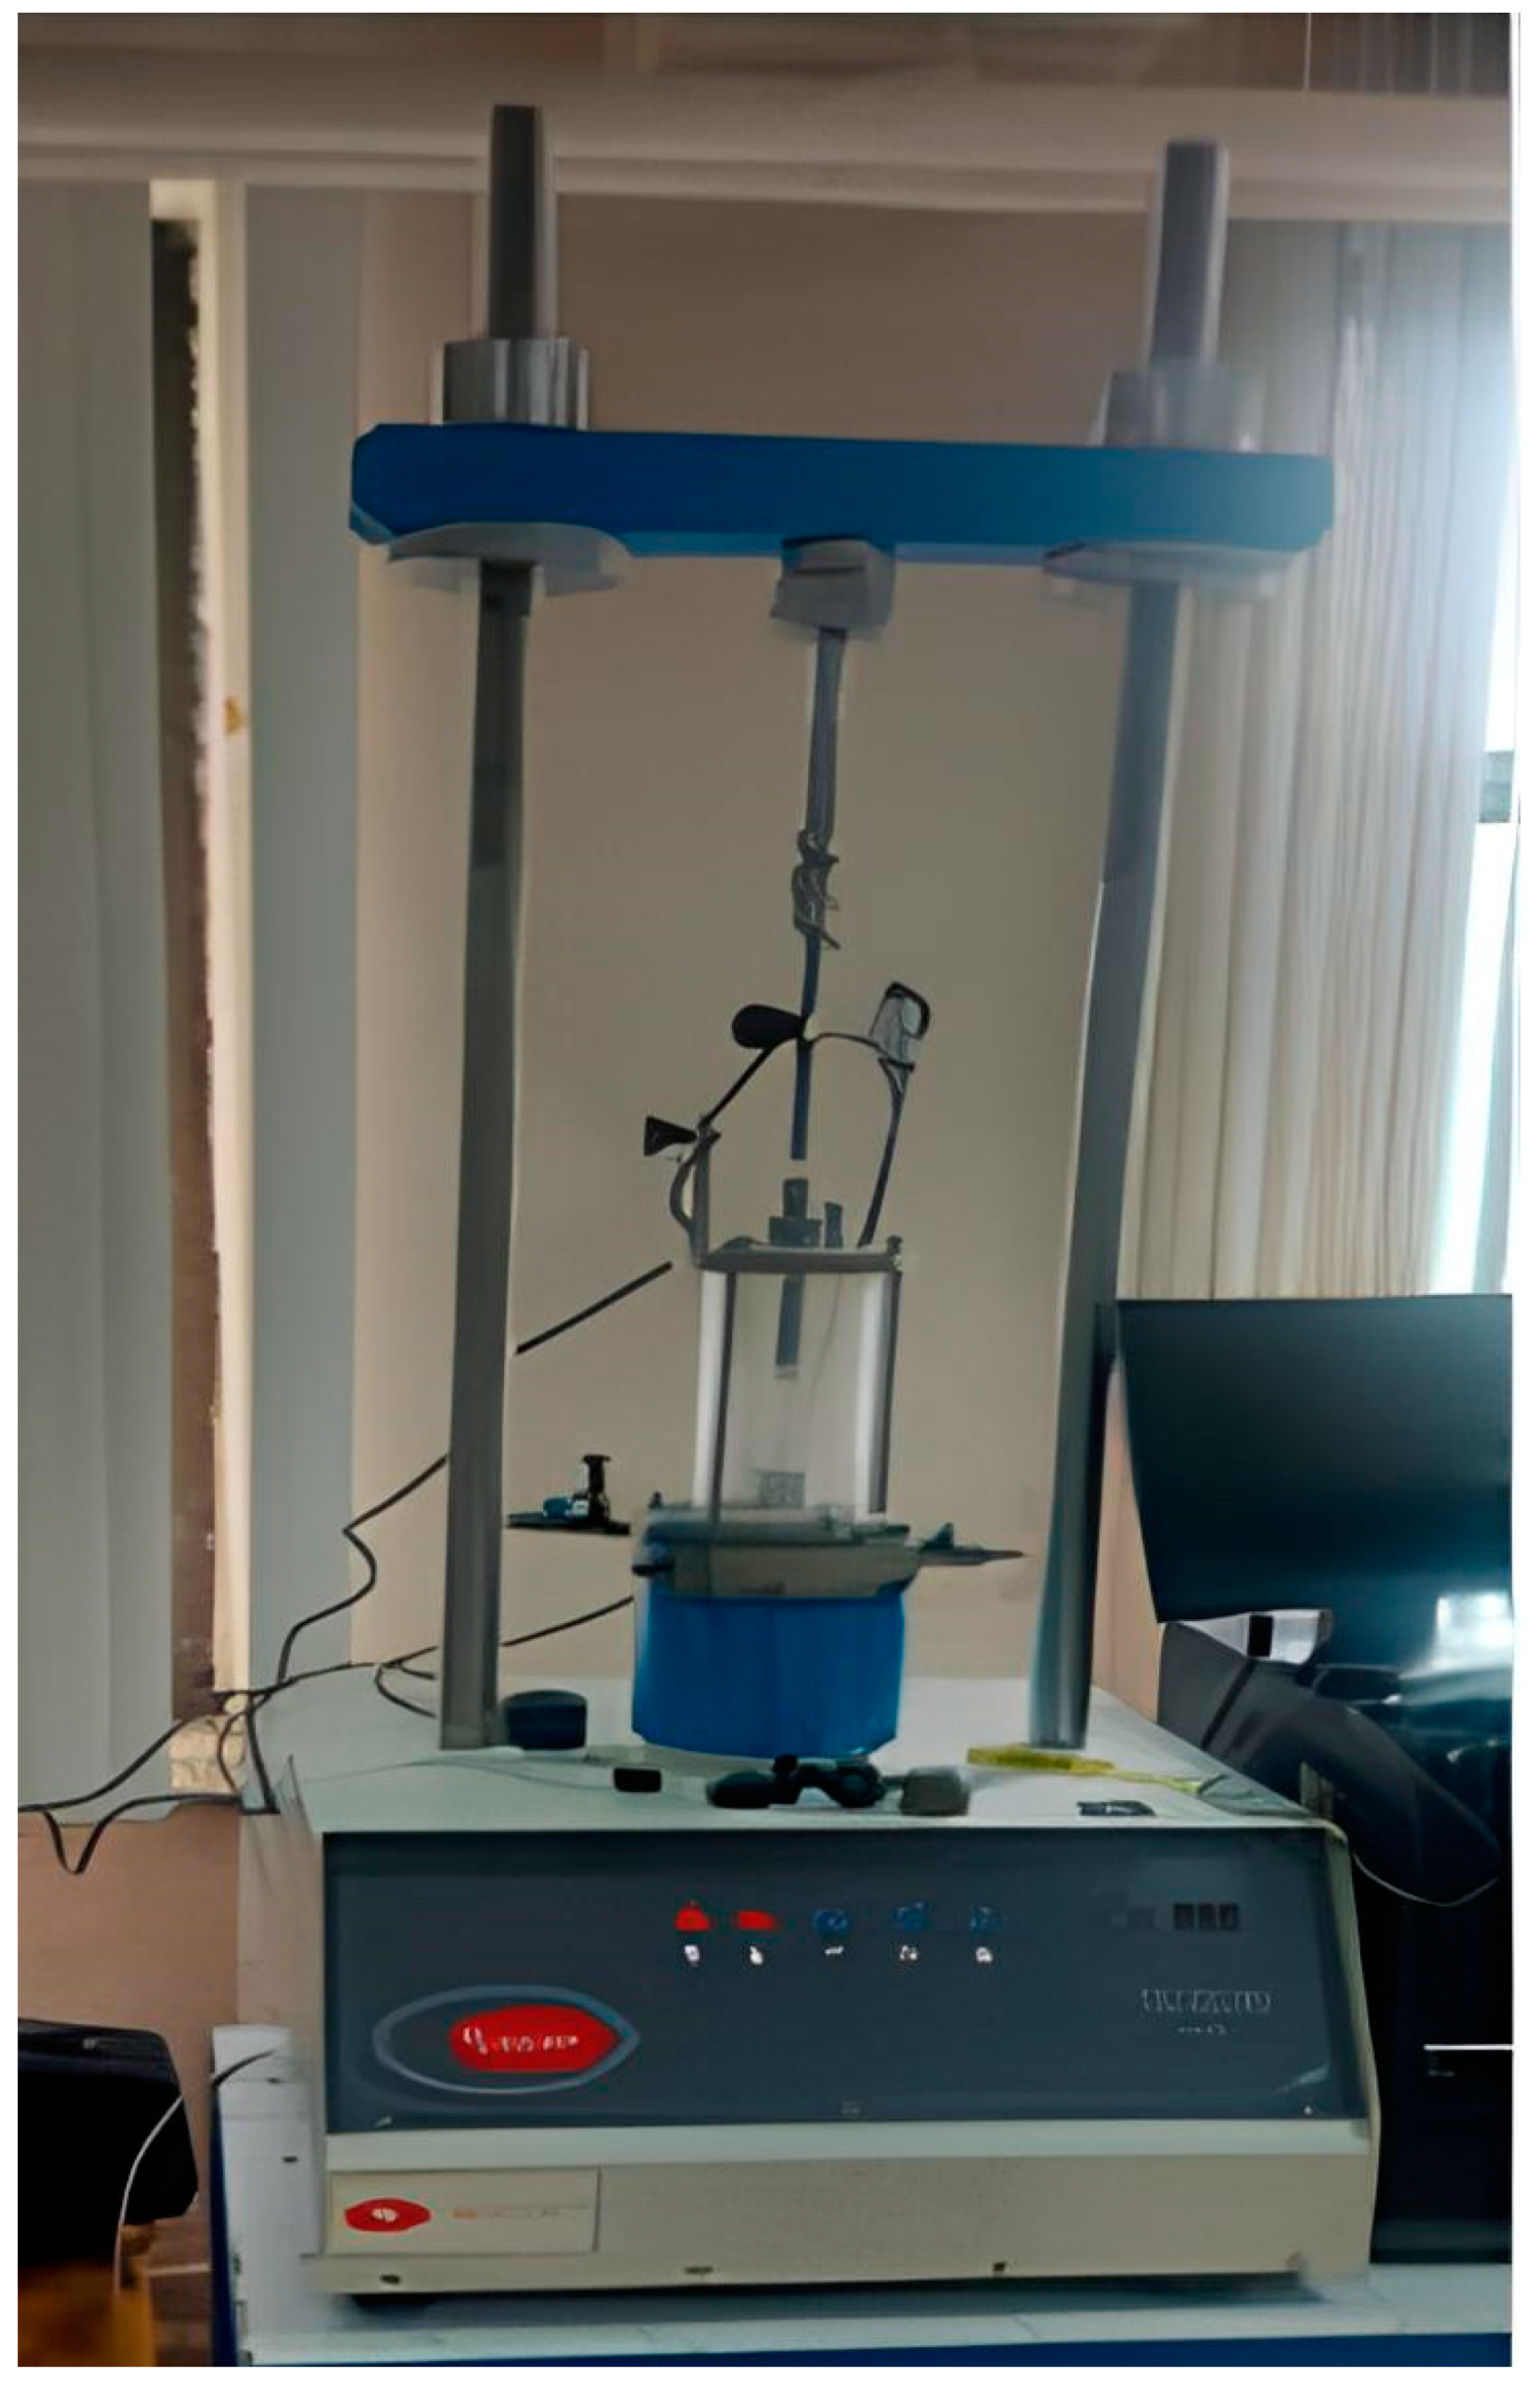
2.2. Methods
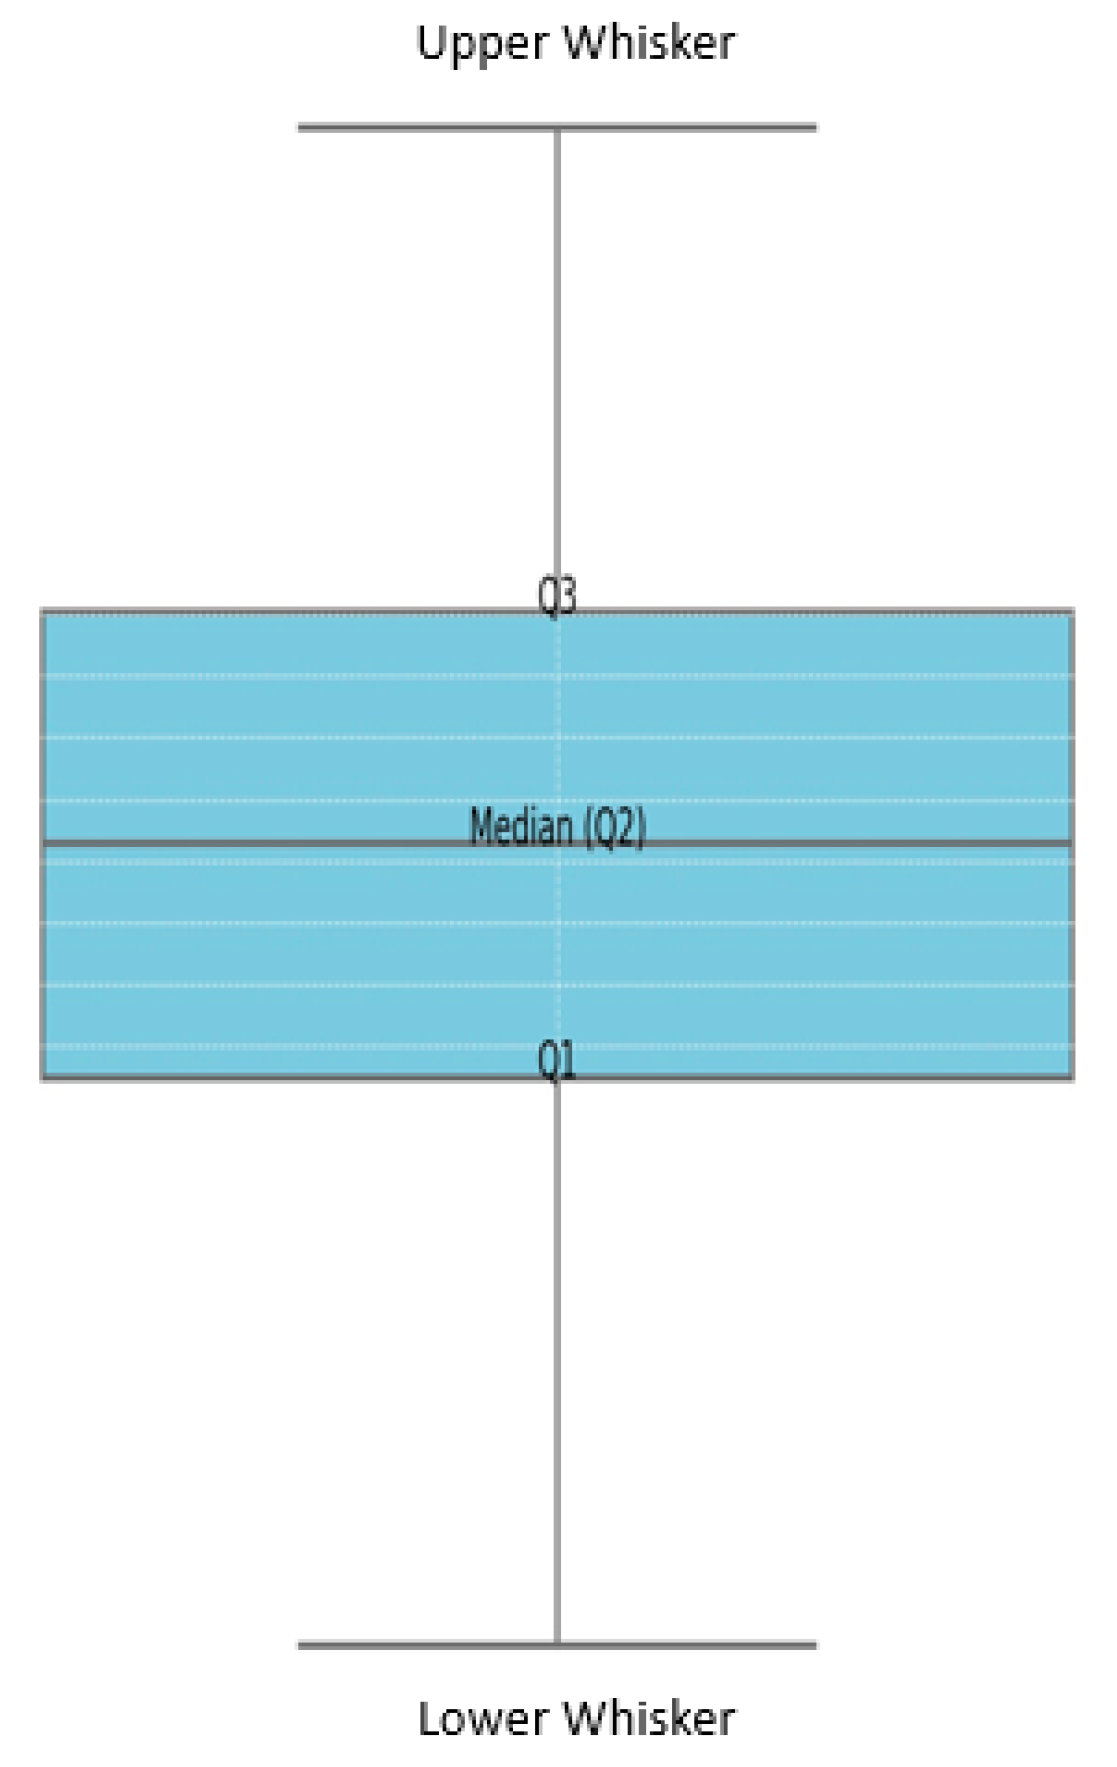
2.3. Exploratory Data Analysis (EDA)
Histogram and Boxplot
2.4. Statistical Modeling
2.4.1. Quartic Polynomial Regression Model
- Coefficient (β) = each variable characteristics on the effect of UCS
- curing time
- molding water content
- soil ratio
- powder ratio
- ) = difference between the observed and predicted values of UCS
2.4.2. Model Evaluation
- number of samples
- actual value of the response variable
- predicted value of the response variable
- Mean of the observed data =
- The total sum of squares =
- Residual sum of square =
- Coefficient of determination R2 =
3. Results and Discussion
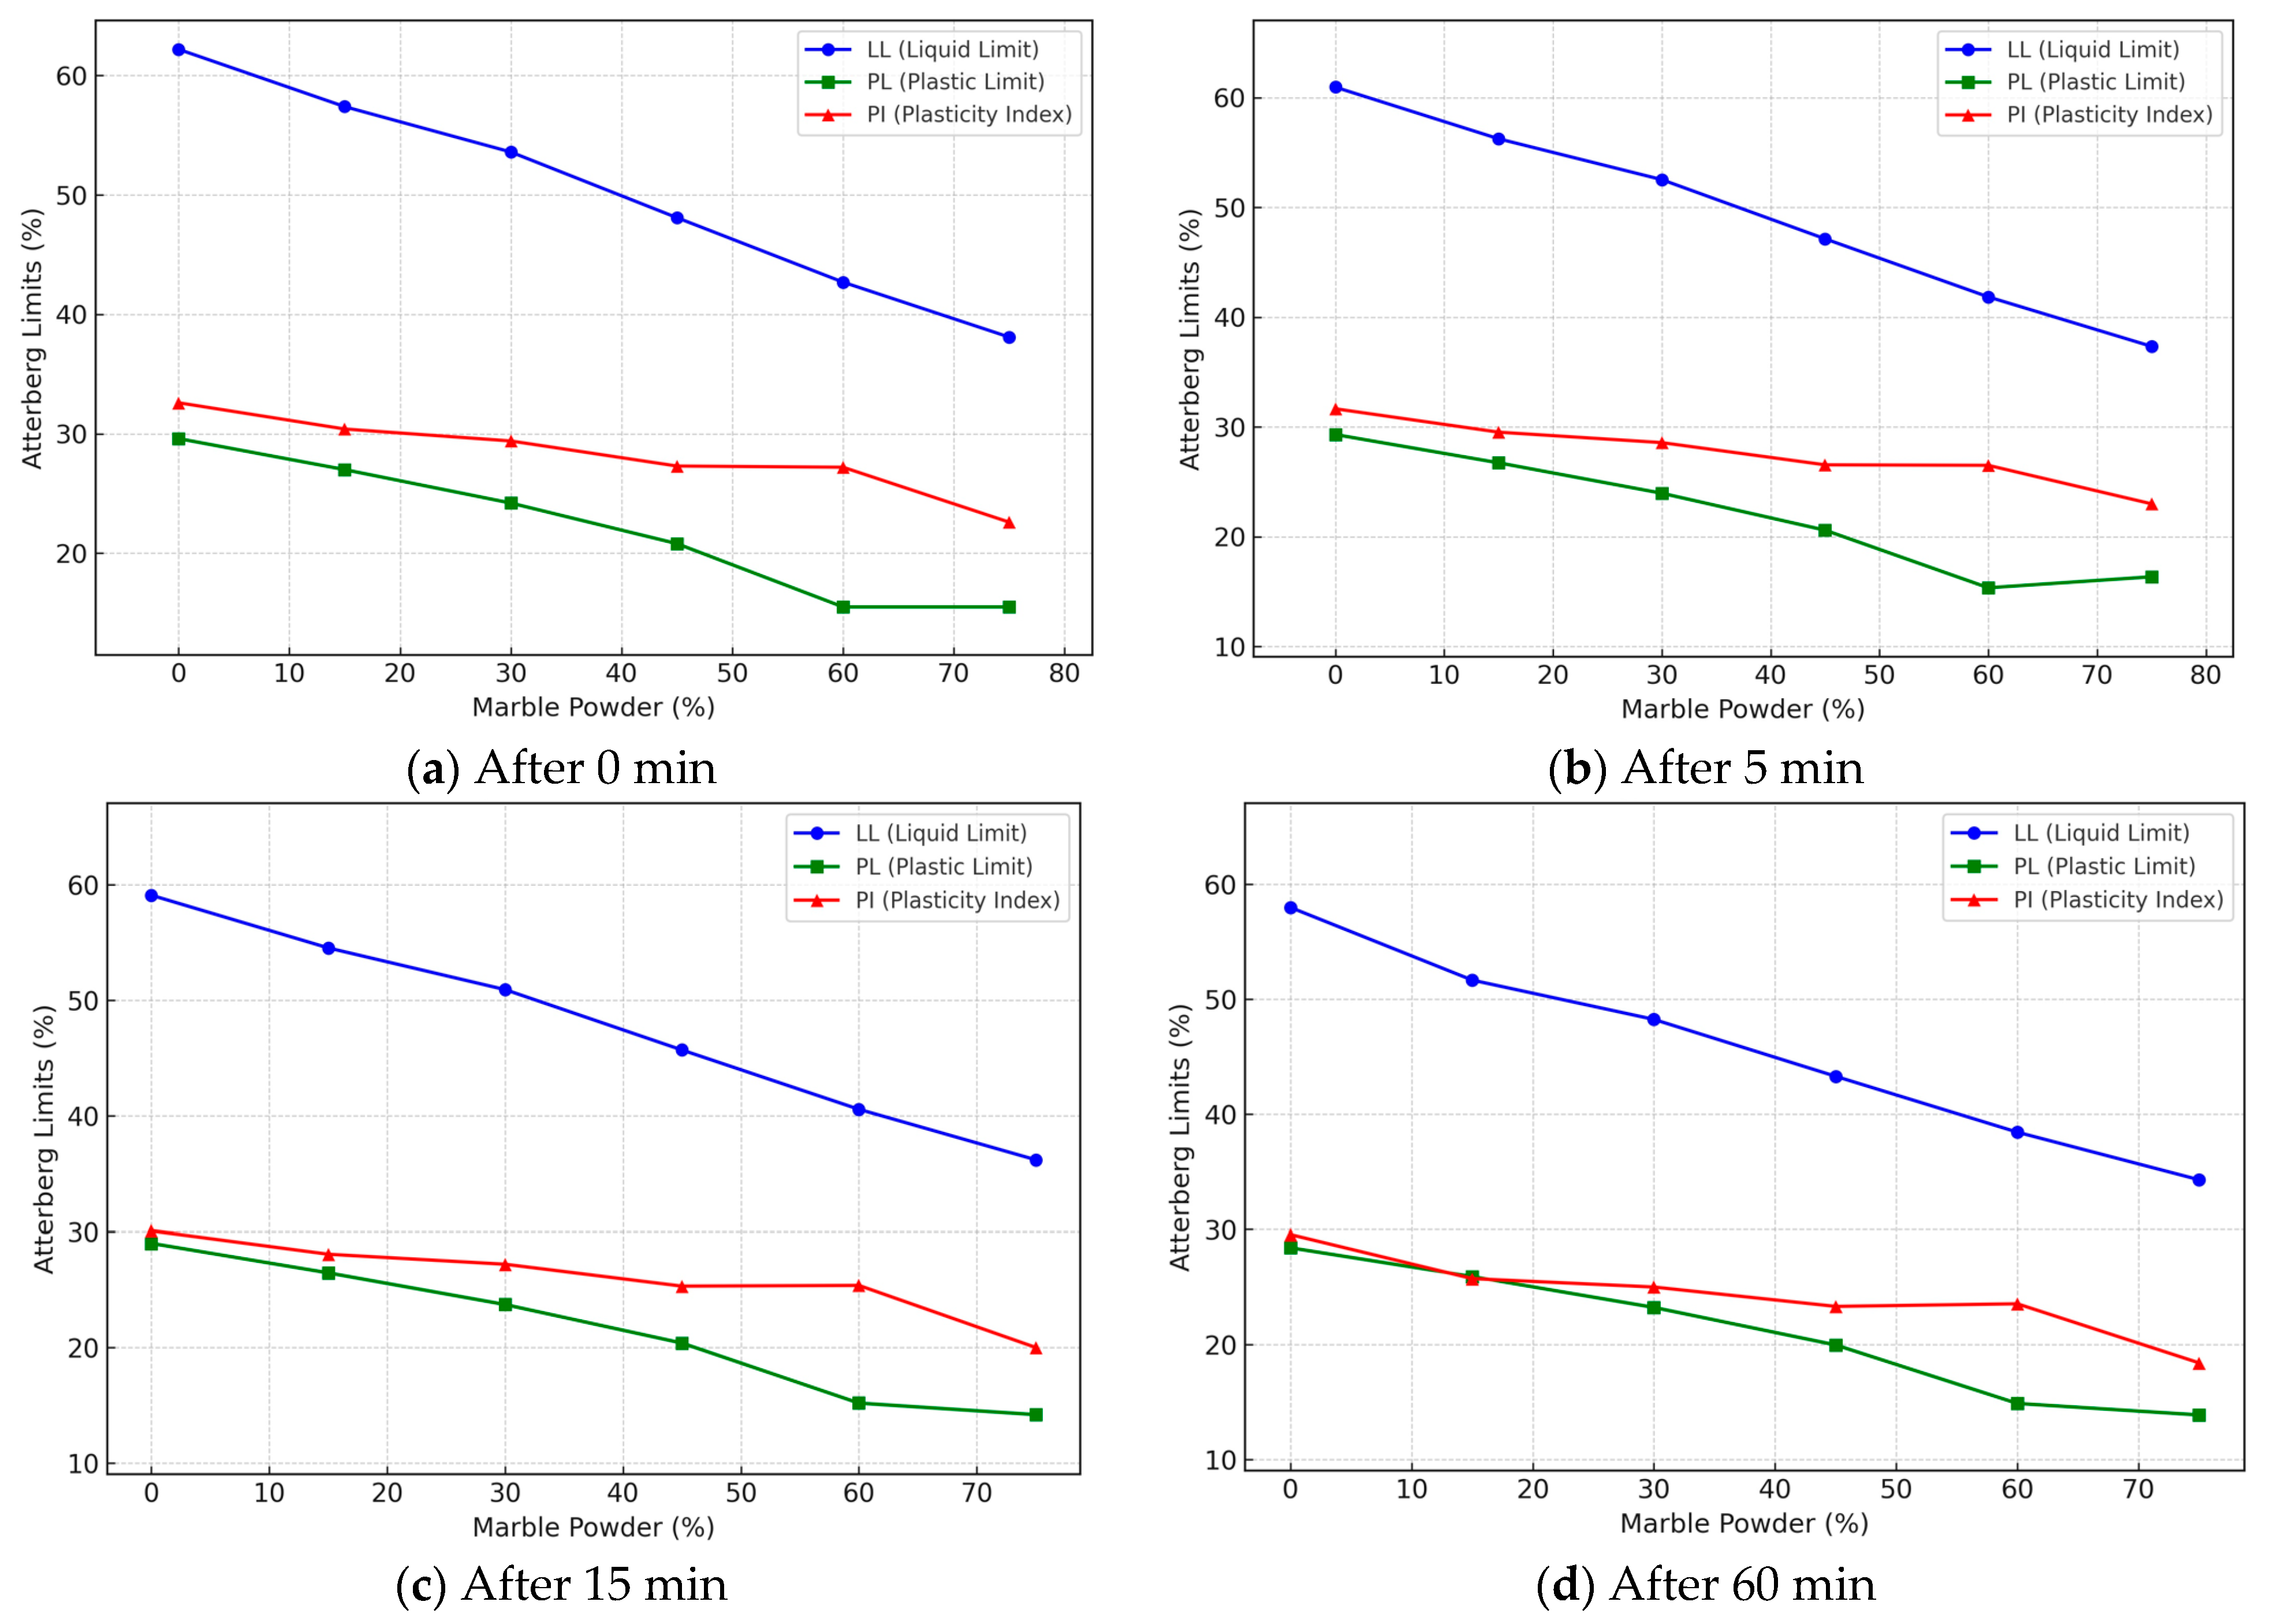
3.1. Atterberg’s Limits Characteristics
3.1.1. Effect of Marble Powder Incorporation on Liquid Limit (LL) over Time
3.1.2. Effect of Marble Powder Incorporation on Plastic Limit (PL) over Time
3.1.3. Effect of Marble Powder Incorporation on Plasticity Index (PI) over Time
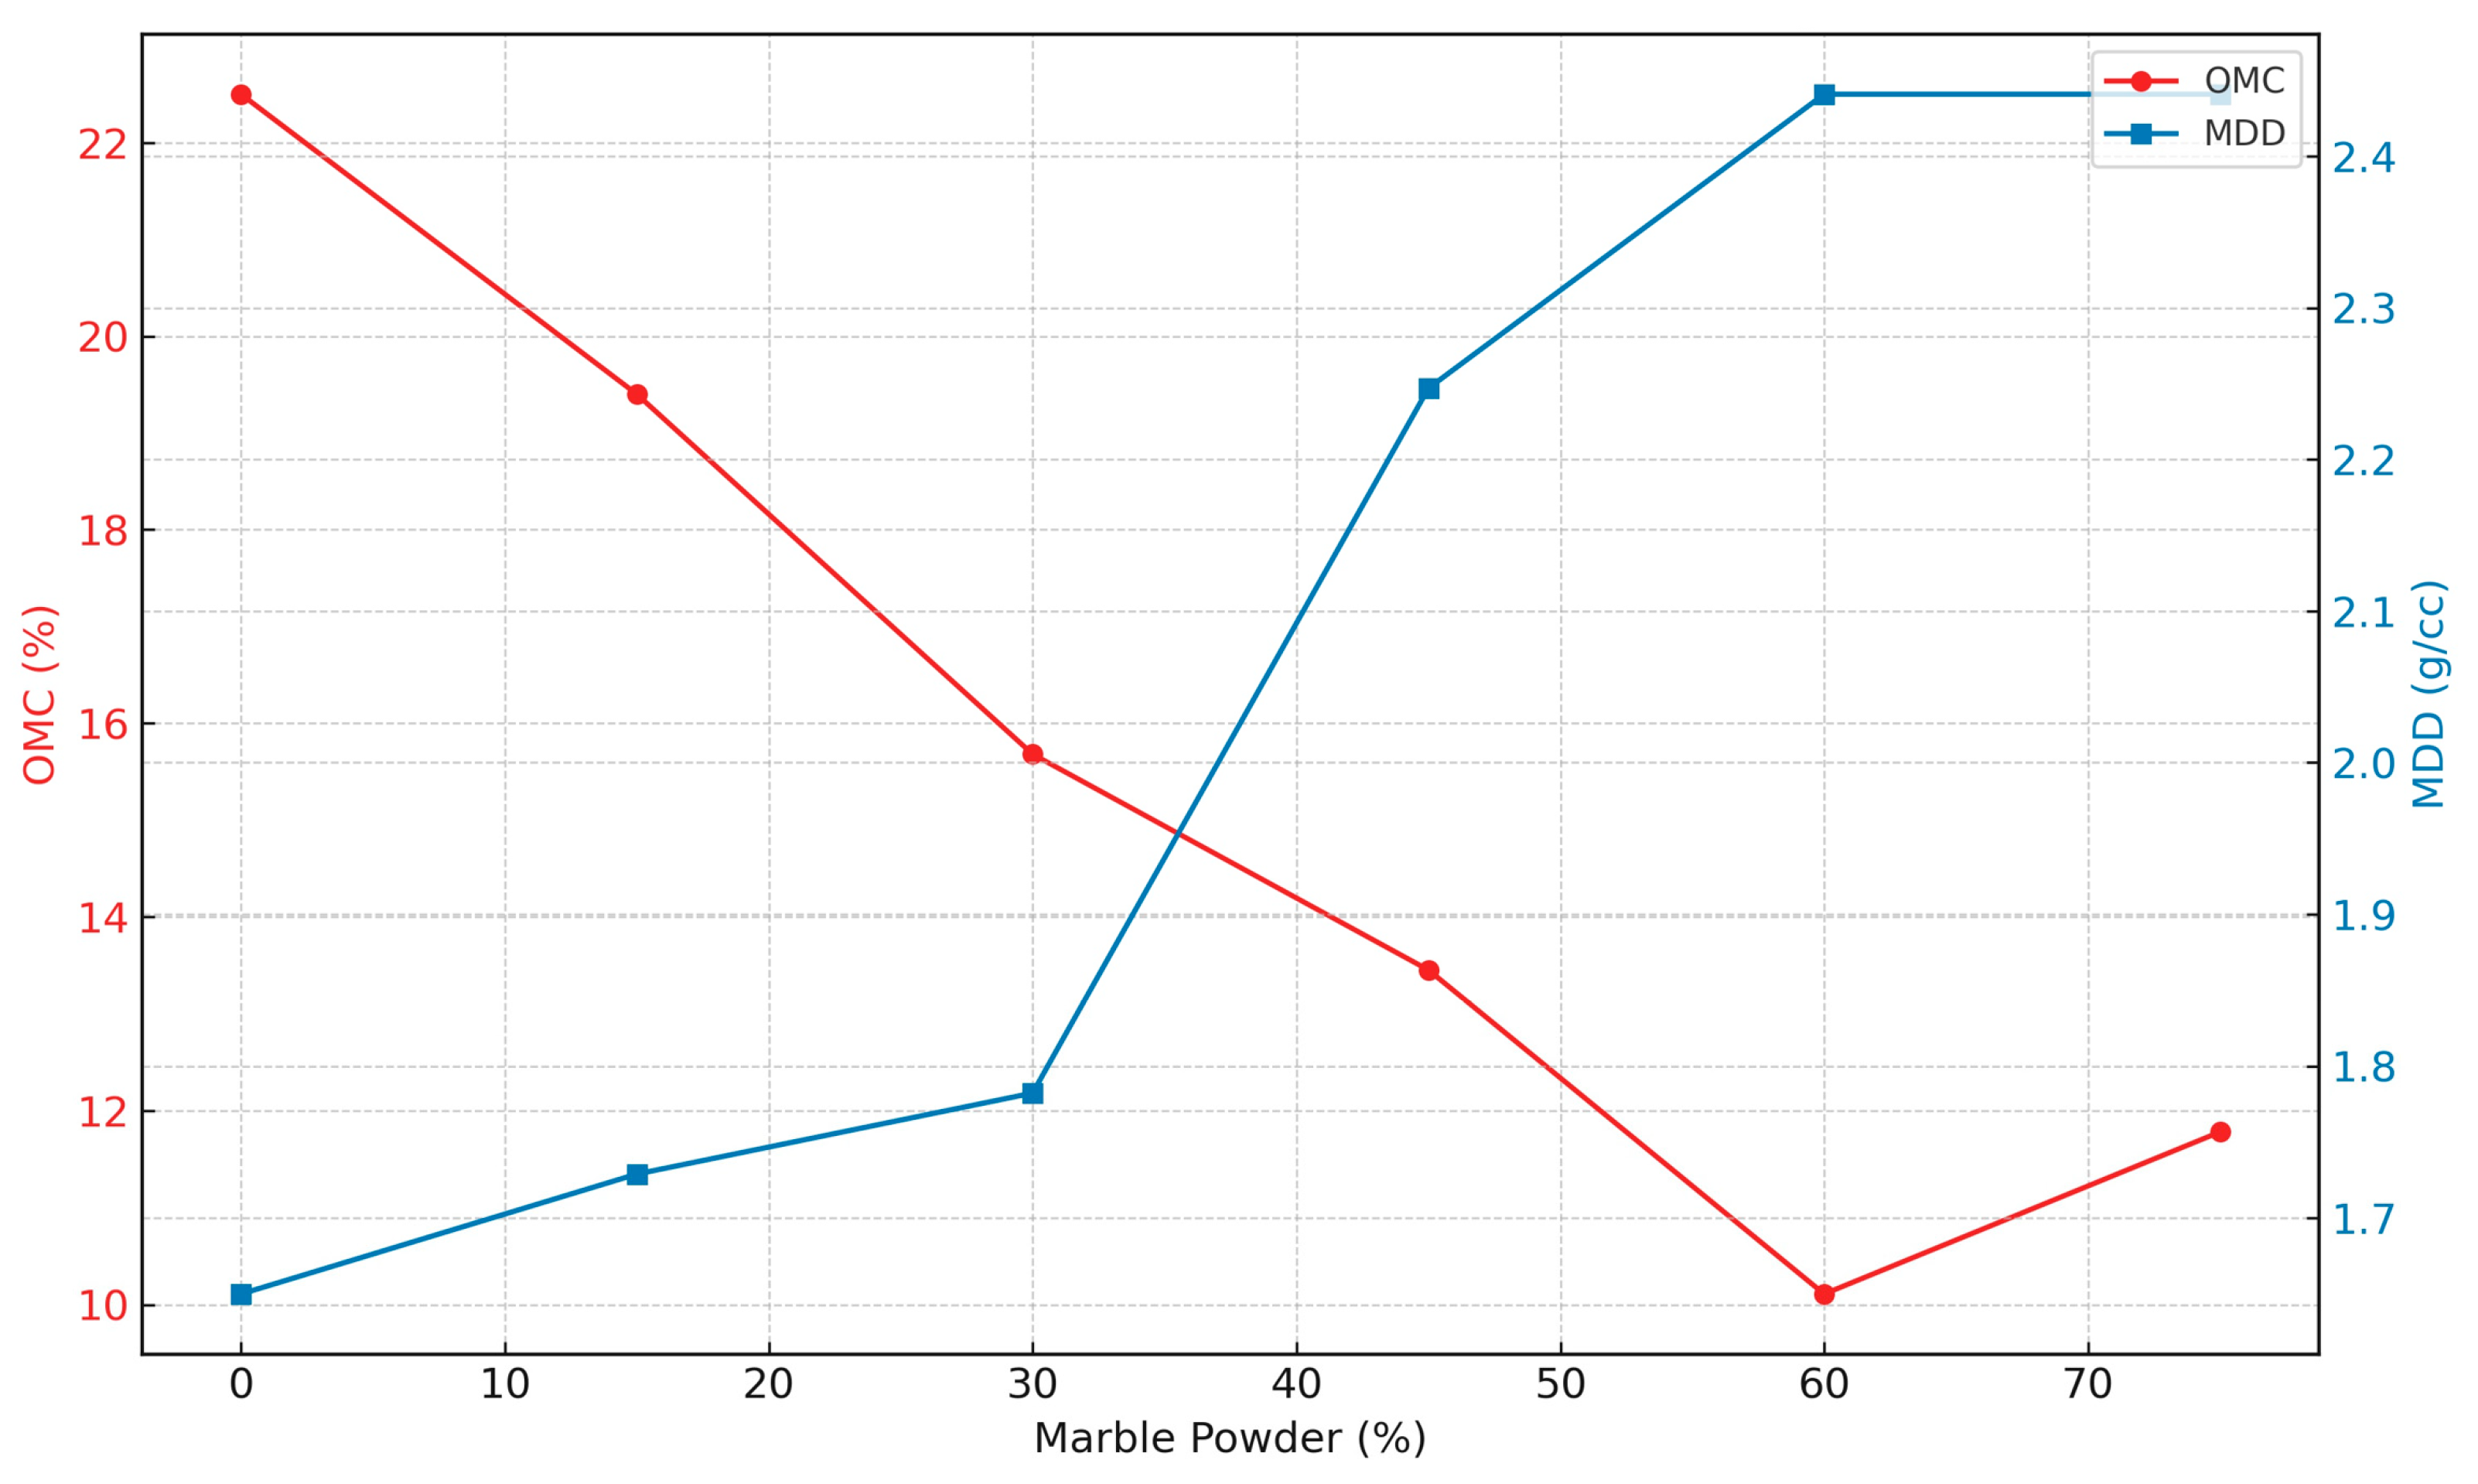
3.2. Modified Proctor Compaction Characteristics
3.3. California Bearing Ratio (CBR) Characteristics
3.3.1. Effect of Marble Powder Incorporation on Unsoaked CBR
3.3.2. Effect of Marble Powder Incorporation on Soaked CBR
3.4. Indirect Tensile Strength (ITS) Characteristics
3.5. Unconfined Compressive Strength (UCS) Characteristics
3.6. Distribution of UCS Values
3.7. UCS Values across Different Curing Times
3.8. UCS Values across Different Molding Water Contents
3.9. UCS Values across the Different Compositions of Marble Powder
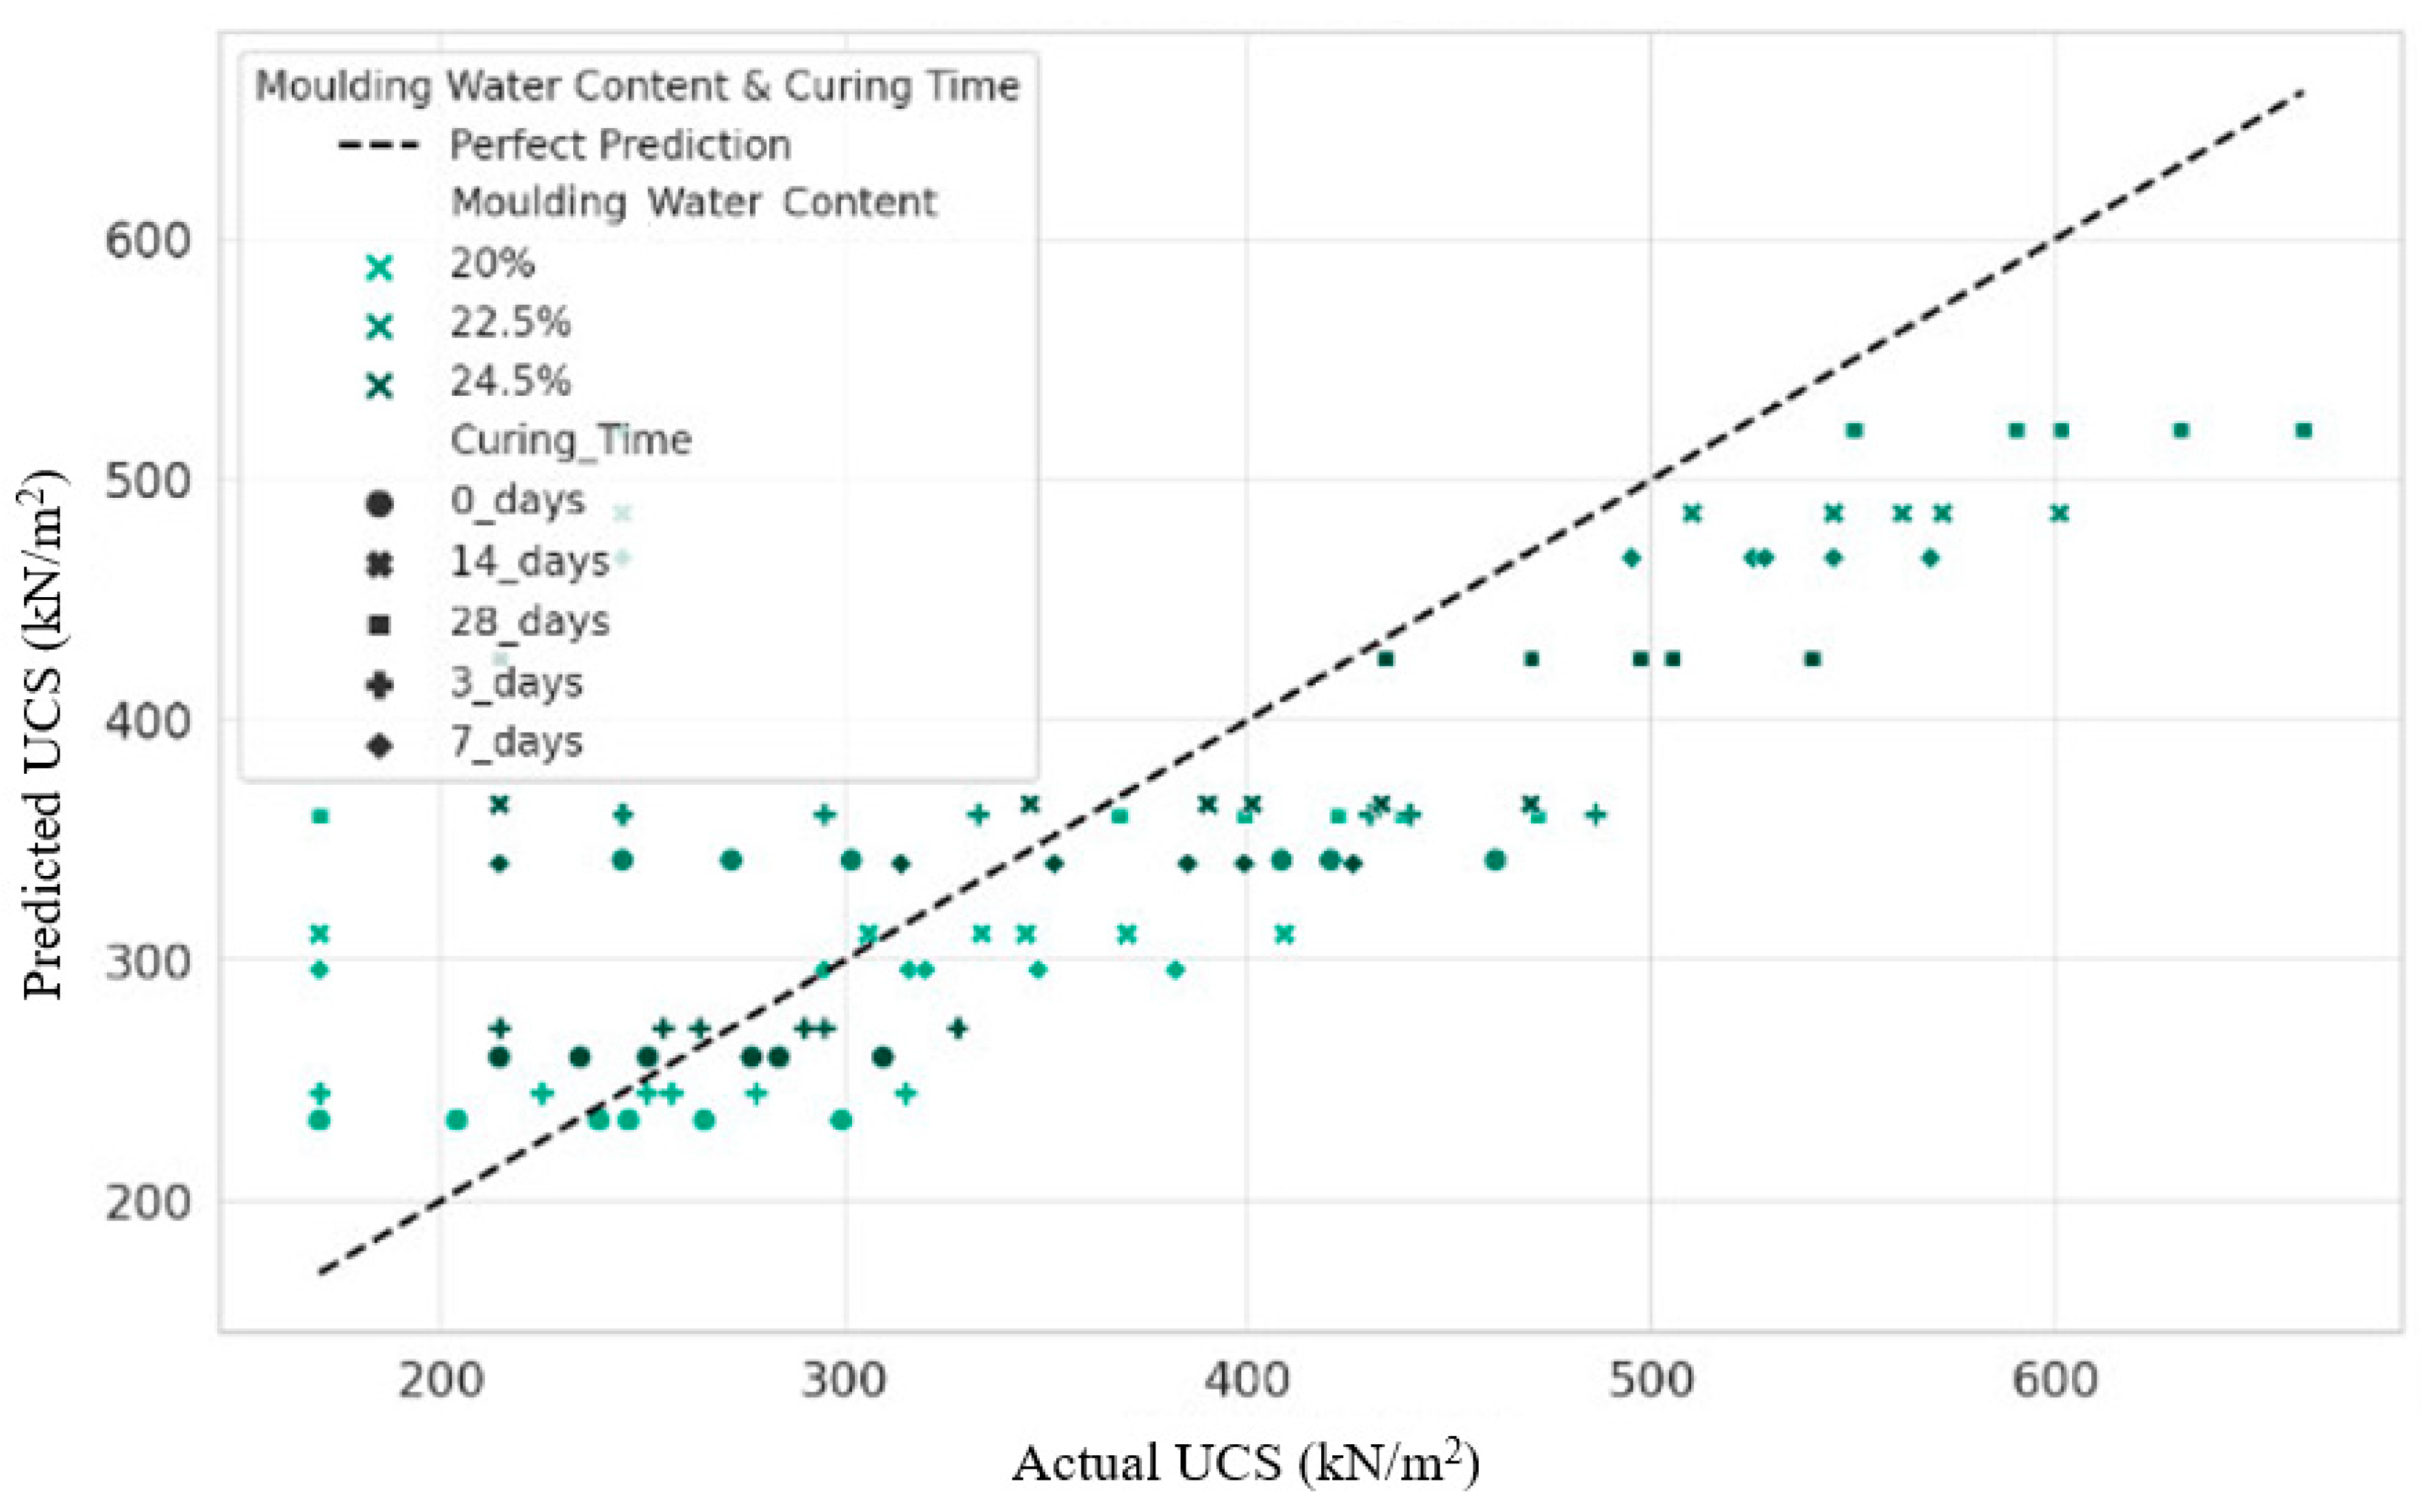
3.10. Actual vs. Predicted UCS Values
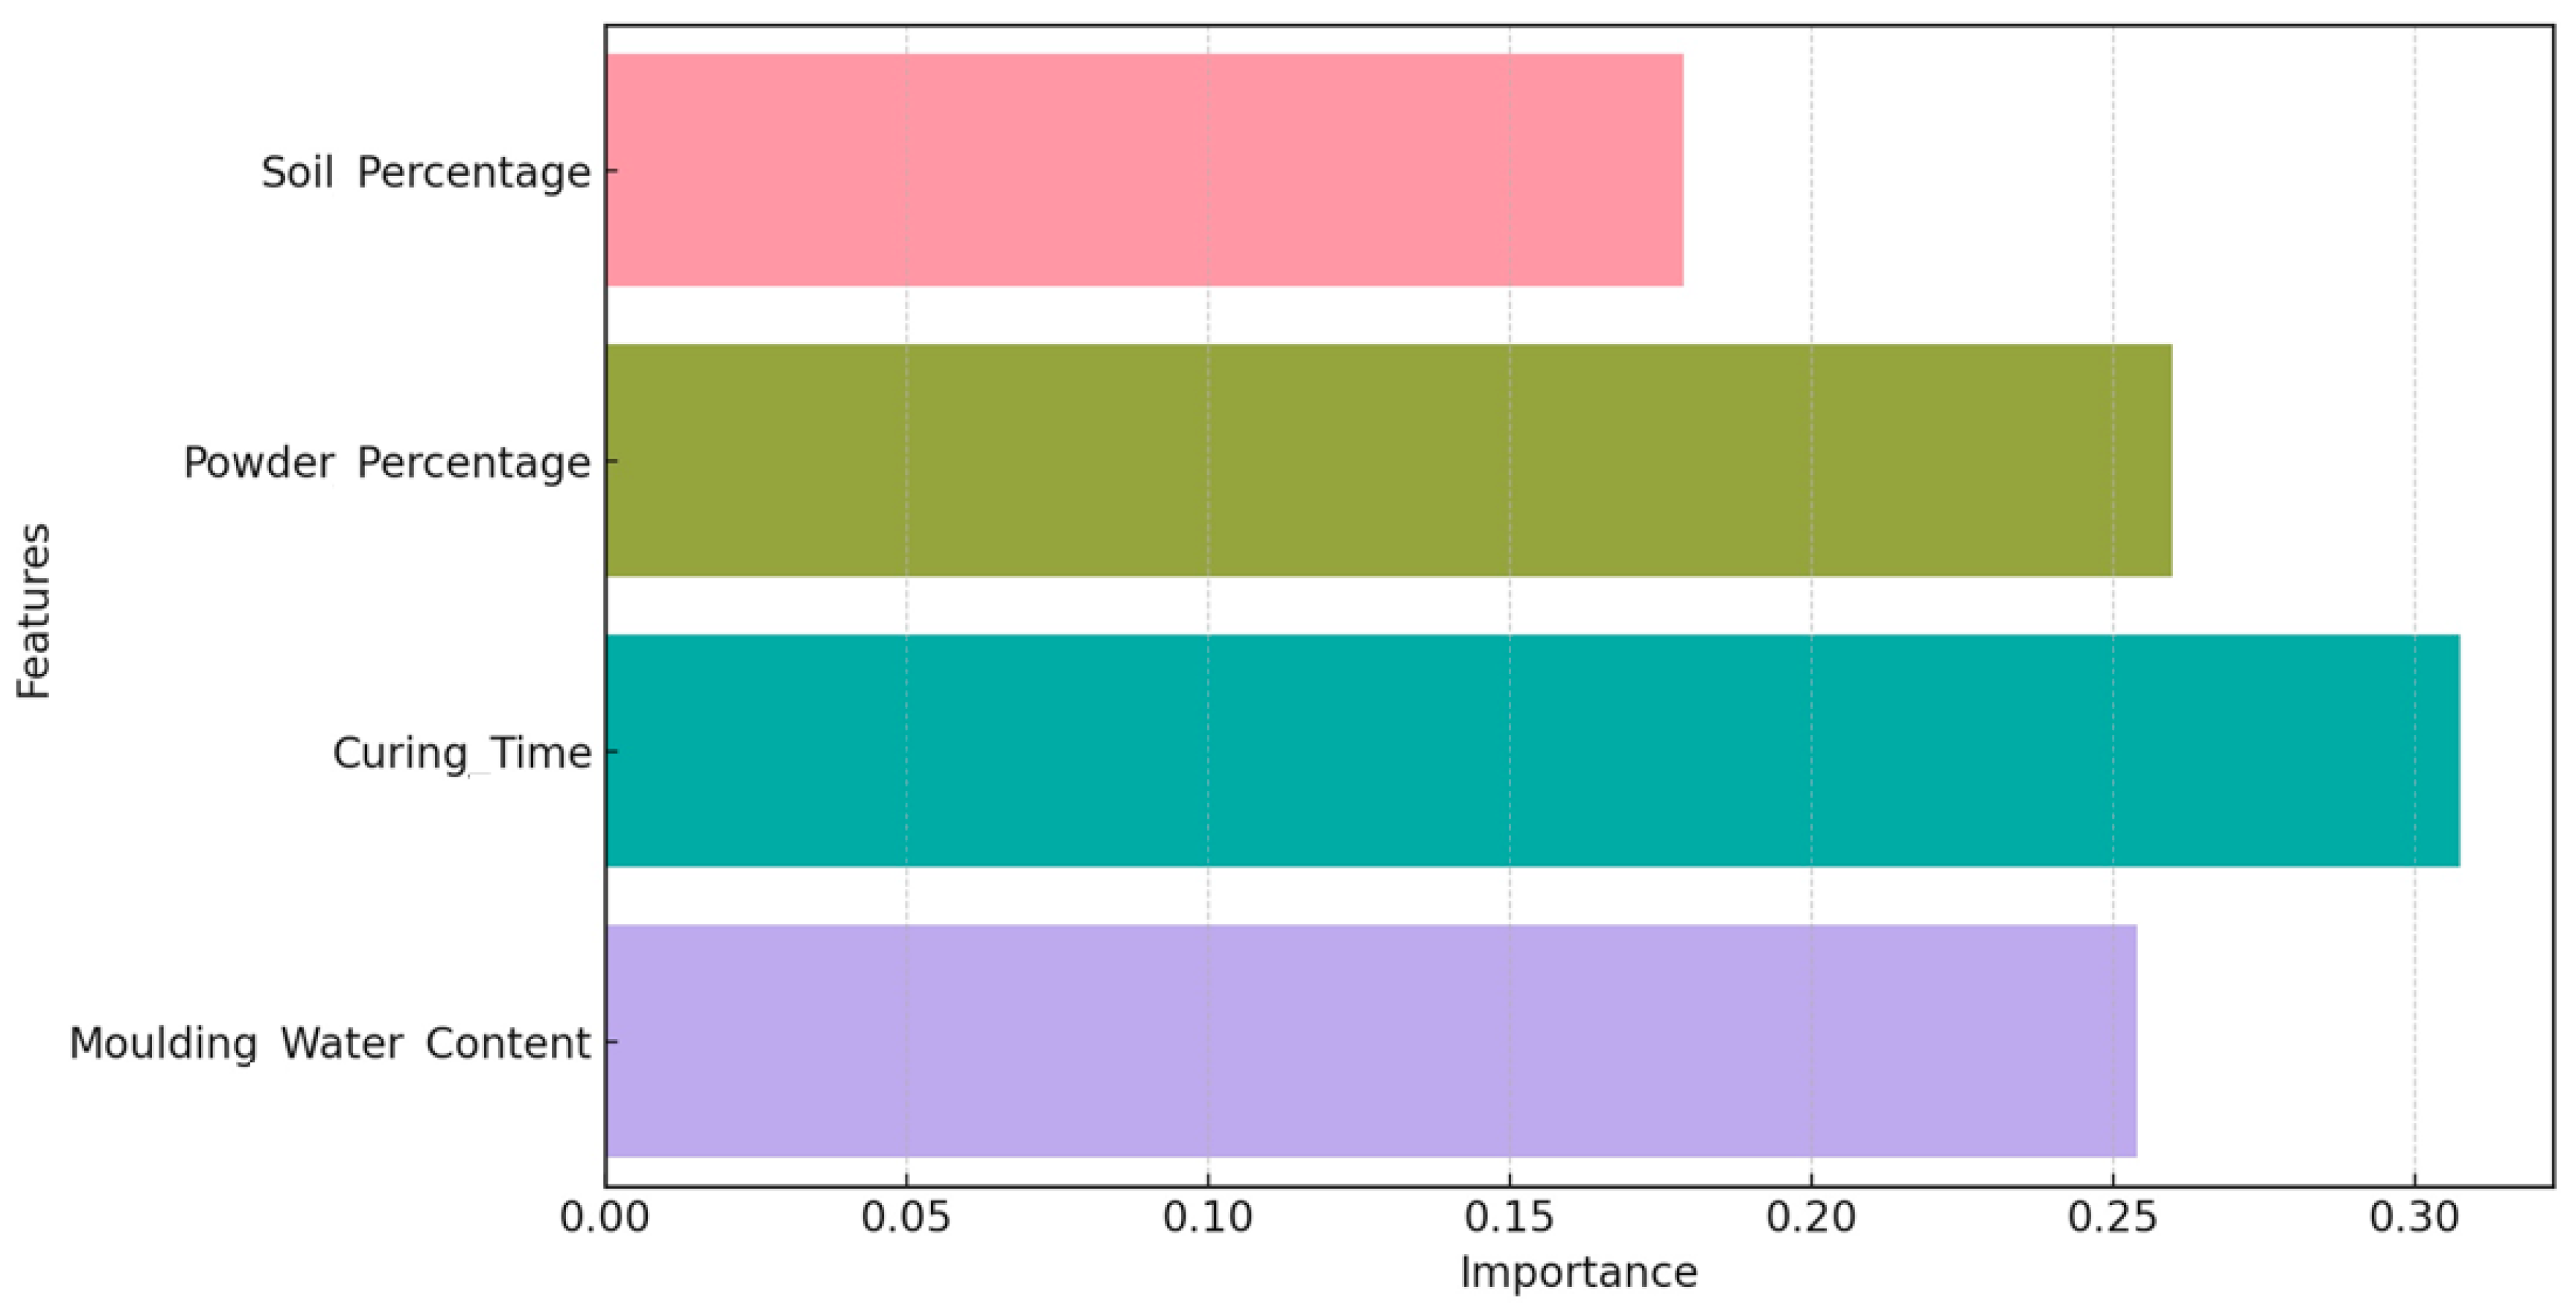
3.11. Normalizing Feature Importances for Model Prediction Improvement
4. Conclusions
Author Contributions
Funding
Institutional Review Board Statement
Informed Consent Statement
Data Availability Statement
Acknowledgments
Conflicts of Interest
References
- Umar, I.H.; Lin, H.; Ibrahim, A.S. Laboratory Testing and Analysis of Clay Soil Stabilization Using Waste Marble Powder. Appl. Sci. 2023, 13, 9274. [Google Scholar] [CrossRef]
- Athanasopoulou, A. The Role of Curing Period on The Engineering Characteristics of a Cement-Stabilized Soil. Rom. J. Transp. Infrastruct. 2016, 5, 38–52. [Google Scholar] [CrossRef]
- IUmar, H.; Muhammad, A.; Ahmad, A.; Yusif, M.A. Suitability of Geotechnical Properties of Bentonite -Bagasse Ash Mixtures Stabilized Lateritic Soil as Barrier in Engineered Waste Landfills. Muhendis. Bilim. 2021, 2022, 162–203. [Google Scholar]
- Haruna, I.U.; Kabir, M.; Yalo, S.G.; Muhammad, A.; Ibrahim, A.S. Quantitative Analysis of Solid Waste Generation from Tanneries in Kano State. J. Environ. Eng. Stud. 2022, 7, 23–30. [Google Scholar] [CrossRef]
- Umar, I.H.; Firat, M.E.O. Investigation of Unconfined Compressive Strength of Soils Stabilized with Waste Elazig Cherry Marble Powder at Different Water Contents. 14th International Conference On Engineering & Natural Sciences, 2022, 703–711. Available online: https://www.researchgate.net/publication/362680145_Investigation_Of_Unconfined_Compressive_Strength_Of_Soils_Stabilized_With_Waste_Elazig_Cherry_Marble_Powder_At_Different_Water_Contents (accessed on 29th January 2024).
- Yin, Z.; Li, R.; Lin, H.; Chen, Y.; Wang, Y.; Zhao, Y. Analysis of influencing factors of cementitious material properties of lead-zinc tailings based on orthogonal tests. Materials 2023, 16, 361. [Google Scholar] [CrossRef]
- Li, R.; Yin, Z.; Lin, H. Research status and prospects for the utilization of lead-zinc tailings as building materials. Buildings 2023, 13, 150. [Google Scholar] [CrossRef]
- Baker, M.B. The Application of Marble and Granite as Building Materials in Jordan. Jordan J. Civ. Eng. 2017, 11, 234–238. [Google Scholar]
- Sharma, D.; Sonthwal, E.V.K. A Critical Review on Enhancing Soil Properties using Marble Powder and Terrazyme. Int. Res. J. Eng. Technol. (IRJET) 2020, 7, 849–854. [Google Scholar]
- Firat, S.; Khatib, J.M.; Yilmaz, G.; Comert, A.T. Effect of curing time on selected properties of soil stabilized with fly ash, marble dust and waste sand for road sub-base materials. Waste Manag. Res. 2017, 35, 747–756. [Google Scholar] [CrossRef]
- Sabat, A.K.; Nanda, R.P. Effect of marble dust on strength and durability of Rice husk ash stabilized expansive soil. Int. J. Civ. Struct. Eng. 2011, 1, 939–948. [Google Scholar]
- Aydin, K.; Sivrikaya, O.; Uysal, F. Effects of Curing Time and Freeze—Thaw Cycle on Strength of Soils with High Plasticity Stabilized by Waste Marble Powder. J. Mater. Cycles Waste Manag. 2020, 22, 1459–1474. [Google Scholar] [CrossRef]
- Aydın, E. Effects of Elevated Temperature for the Marble Cement Paste Products for Better Sustainable Construction. J. Polytech. 2018, 900, 259–267. [Google Scholar] [CrossRef]
- Sivrikaya, O.; Uysal, F.; Yorulmaz, A.; Aydin, K. The Efficiency of Waste Marble Powder in the Stabilization of Fine-grained Soils in Terms of Volume Changes. Arab. J. Sci. Eng. 2020, 45, 8561–8576. [Google Scholar] [CrossRef]
- Rouaiguia, A.; El, A.K.A.A. Enhancement of the Geotechnical Properties of Soils Using Marble and Lime Powders, Guelma City, Algeria. Geotech. Geol. Eng. 2020, 38, 5649–5665. [Google Scholar] [CrossRef]
- Kumar, S.S.; Teja, S.L.; Needhidasan, S. Evaluation of Compaction and Stabilization of Black Cotton Soil by Using Admixtures as Marbledust and Coconut Shell Powder. Int. J. Pure Appl. Math. 2018, 119, 3111–3118. [Google Scholar]
- Yorulmaz, A.; Sivrikaya, O.; Uysal, F. Evaluation of the bearing capacity of poor subgrade soils stabilized with waste marble powder according to curing time and freeze-thaw cycles. Arab. J. Geosci. 2021, 14, 360. [Google Scholar] [CrossRef]
- Umar, I.H.; Elif, M.; Firat, O. A Study on Uniaxial Compressive Strength and Ultrasonic Non-Destructive Analysis of Fine- Grained Soil in Seasonally Frozen Regions Mevsimsel Donmuş Bölgelerde İnce Taneli Zeminlerin Tek Eksenli Basınç Dayanımları ve Ultrasonik Tahribatsız Analizleri Üzer. Turk. J. Sci. Technol. 2022, 17, 267–277. [Google Scholar] [CrossRef]
- Dassekpo, J.-B.M.; Ning, J.; Zha, X. Potential solidification/stabilization of clay-waste using green geopolymer remediation technologies. Process Saf. Environ. Prot. 2018, 117, 684–693. [Google Scholar] [CrossRef]
- Firoozi, A.A.; Olgun, C.G.; Firoozi, A.A.; Baghini, M.S. Fundamentals of soil stabilization. Int. J. Geo-Eng. 2017, 8, 1–16. [Google Scholar] [CrossRef]
- Umar, I.H.; Muhammad, A.; Yusuf, A.; Muhammad, K.I. Study on the Geotechnical Properties of Road Pavement Failures “(A Case Study of Portion of Malam Aminu Kano Way, Kano State from Tal-Udu Roundabout to Mambaya House Roundabout)”. J. of Geotech. Studies. 2020, 5, 8–15. Available online: https://www.researchgate.net/publication/348017290_Study_on_the_Geotechnical_Properties_of_Road_Pavement_Failures_A_Case_Study_of_Portion_Of_Malam_Aminu_Kano_Way_Kano_State_From_Tal-Udu_Roundabout_To_Mambaya_House_Roundabout (accessed on 29th January 2024).
- Agrawal, V.; Gupta, M. Expansive Soil Stabilization Using Marble Dust. Int. J. Earth Sci. Eng. 2011, 4, 59–62. Available online: https://www.researchgate.net/publication/228836328_Expansive_Soil_Stabilization_Using_Marble_Dust (accessed on 29th January 2024).
- Yarbaşı, N.; Kalkan, E. Freeze-Thaw Behaviors of Sandy Soils Modified by Mixtures of PET Fiber and Marble Dust. Int. J. Latest Technol. Eng. Manag. Appl. Sci. (IJLTEMAS) 2019, VIII, 38–42. [Google Scholar]
- Yarbaşı, N. Freeze-Thaw Resistance of Fine-Grained Soils Stabilized with Waste Material Mixtures. Int. J. Sci. Eng. Appl. 2020, 9, 158–163. [Google Scholar] [CrossRef]
- Jain, A.K.; Jha, A.K. Geotechnical behaviour and micro-analyses of expansive soil amended with marble dust. Soils Found. 2020, 60, 737–751. [Google Scholar] [CrossRef]
- Sakr, M.A.H.; Omar, A.E.; Saad, A.M.; Moayedi, H. Geotechnical parameters modelling and the radiation safety of expansive clayey soil treated with waste marble powder: A case study at west Gulf of Suez, Egypt. Environ. Earth Sci. 2021, 80, 1–18. [Google Scholar] [CrossRef]
- Talah, A.; Kharchi, F.; Chaid, R. Influence of Marble Powder on High Performance Concrete Behavior. Procedia Eng. 2015, 114, 685–690. [Google Scholar] [CrossRef]
- Abdelkader, H.A.M.; Hussein, M.M.A.; Ye, H. Influence of Waste Marble Dust on the Improvement of Expansive Clay Soils. Hindawi Adv. Civ. Eng. 2021, 2021, 3192122. [Google Scholar] [CrossRef]
- Assefa, B.; Tadesse, S. Investigating the Strength Characteristics of Lateritic Soil Blended with Marble Dust. Master’s Thesis, School of Graduate Studies, Addis Ababa University, Addis Ababa, Ethiopia, 2016. [Google Scholar]
- Gurbuz, A. Marble powder to stabilize clayey soils in sub- bases for road construction. Road Mater. Pavement Des. 2015, 16, 481–492. [Google Scholar] [CrossRef]
- Saygili, A. Use of Waste Marble Dust for Stabilization of Clayey Soil. Mater. Sci. 2015, 21, 601–660. [Google Scholar] [CrossRef]
- ASTM D2166-16; Standard Test Method for Unconfined Compressive Strength of Cohesive Soil. ASTM: West Conshohocken, PA, USA, 2016.
- Nanzyo, M.; Kanno, H. Primary Minerals. In Inorganic Constituents in Soil: Basics and Visuals; Nanzyo, M., Kanno, H., Eds.; Springer: Singapore, 2018; pp. 11–35. [Google Scholar]
- McKeague, J.A.; Cline, M.G. Silica in Soils11Joint contribution as No. 71 of the Soil Research Institute, Canada Department of Agriculture, Ottawa, and as Agronomy paper No. 602, Cornell University, Ithaca, New York. In Advances in Agronomy; Norman, A.G., Ed.; Academic Press: Cambridge, MA, USA, 1963; Volume 15, pp. 339–396. [Google Scholar]
- Colombo, C.; Palumbo, G.; He, J.-Z.; Pinton, R.; Cesco, S. Review on iron availability in soil: Interaction of Fe minerals, plants, and microbes. J. Soils Sediments 2014, 14, 538–548. [Google Scholar] [CrossRef]
- Li, Q.; Hu, W.; Li, L.; Li, Y. Interactions between organic matter and Fe oxides at soil micro-interfaces: Quantification, associations, and influencing factors. Sci. Total Environ. 2023, 855, 158710. [Google Scholar] [CrossRef]
- Das, B.M. Soil Mecahanics Laboratory Manual; Oxford University Press: Oxford, UK, 2002; p. 165. [Google Scholar]
- Gudivada, V.N. Chapter 2—Data Analytics: Fundamentals. In Data Analytics for Intelligent Transportation Systems; Chowdhury, M., Apon, A., Dey, K., Eds.; Elsevier: Amsterdam, The Netherlands, 2017; pp. 31–67. [Google Scholar]
- Khan, S.M.; Rahman, M.; Apon, A.; Chowdhury, M. Chapter 1—Characteristics of Intelligent Transportation Systems and Its Relationship With Data Analytics. In Data Analytics for Intelligent Transportation Systems; Chowdhury, M., Apon, A., Dey, K., Eds.; Elsevier: Amsterdam, The Netherlands, 2017; pp. 1–29. [Google Scholar]
- Luckow, A.; Kennedy, K. Chapter 5—Data Infrastructure for Intelligent Transportation Systems. In Data Analytics for Intelligent Transportation Systems; Chowdhury, M., Apon, A., Dey, K., Eds.; Elsevier: Amsterdam, The Netherlands, 2017; pp. 113–129. [Google Scholar]
- McGee, E.T.; McGregor, J.D. Chapter 8—Data Analytics in Systems Engineering for Intelligent Transportation Systems. In Data Analytics for Intelligent Transportation Systems; Chowdhury, M., Apon, A., Dey, K., Eds.; Elsevier: Amsterdam, The Netherlands, 2017; pp. 191–213. [Google Scholar]
- Plale, B.; Kouper, I. Chapter 4—The Centrality of Data: Data Lifecycle and Data Pipelines. In Data Analytics for Intelligent Transportation Systems; Chowdhury, M., Apon, A., Dey, K., Eds.; Elsevier: Amsterdam, The Netherlands, 2017; pp. 91–111. [Google Scholar]
- Xie, Y. Chapter 9—Data Analytics for Safety Applications. In Data Analytics for Intelligent Transportation Systems; Chowdhury, M., Apon, A., Dey, K., Eds.; Elsevier: Amsterdam, The Netherlands, 2017; pp. 215–239. [Google Scholar]
- Arbia, G.; Bramante, R.; Facchinetti, S. Least Quartic Regression Criterion to Evaluate Systematic Risk in the Presence of Co-Skewness and Co-Kurtosis. Risks 2020, 8, 95. [Google Scholar] [CrossRef]
- Al-Jabban, W.; Laue, J.; Knutsson, S.; Al-Ansari, N. A Comparative Evaluation of Cement and By-Product Petrit T in Soil Stabilization. Appl. Sci. 2019, 9, 5238. [Google Scholar] [CrossRef]
- Bayat, M.R.A.M.; Mousivand, M. Effects of cement and lime treatment on geotechnical properties of a low plasticity clay. In Proceedings of the International Conference on Civil Engineering Architecture & Urban Sustainable Development, Tabriz, Iran, 27–28 November 2013. [Google Scholar]
- Bhuvaneshwari, S.; Robinson, R.; Gandhi, S. Behaviour of Lime Treated Cured Expansive Soil Composites. Indian Geotech. J. 2014, 44, 278–293. [Google Scholar] [CrossRef]
- Pourakbar, S.; Asadi, A.; Huat, B.; Fasihnikoutalab, M. Soil stabilization with alkali-activated agro-waste. Environ. Geotech. 2015, 2, 359–370. [Google Scholar] [CrossRef]
- Nitin, M.; Guleria, H. To Study the Basic Geotechnical Characteristics of Fly Ash-Limegypsum Commix with Quarry Dust. Int. J. Adv. Res. Eng. Technol. 2020, 11, 921–930. [Google Scholar]
- Parsons, R.L.; Kneebone, E.; Milburn, J.P. Use of Cement Kiln Dust for Subgrade Stabilization; University of Kansas, Dept. of Transportation: Lawrence, KS, USA, 2004. [Google Scholar]
- Akshaya, K.; Sabat, A. A Study on Some Geotechnical Properties of Lime Stabilised Expansive Soil –Quarry Dust Mixes. Int. J. Emerg. Trends Eng. Dev. 2012, 1, 42–49. [Google Scholar]
- Sabat, A. Prediction of california bearing ratio of a soil stabilized with lime and quarry dust using artificial neural network. Electron. J. Geotech. Eng. 2013, 18, 3261–3272. [Google Scholar]
- FJalal, E.; Xu, Y.; Jamhiri, B.; Memon, S.A. On the Recent Trends in Expansive Soil Stabilization Using Calcium-Based Stabilizer Materials (CSMs): A Comprehensive Review. Adv. Mater. Sci. Eng. 2020, 2020, 1510969. [Google Scholar] [CrossRef]
- ASTM D1883-21; Standard Test Method for California Bearing Ratio (CBR) of Laboratory-Compacted Soils. ASTM: West Conshohocken, PA, USA, 2021.
- Farooq, K.; Rehman, Z.U.; Shahzadi, M.; Mujtaba, H.; Khalid, U. Optimization of Sand-Bentonite Mixture for the Stable Engineered Barriers using Desirability Optimization Methodology: A Macro-Micro-Evaluation. KSCE J. Civ. Eng. 2023, 27, 40–52. [Google Scholar] [CrossRef]
- ASTM D4644-16; Standard Test Method for Slake Durability of Shales and Other Similar Weak Rocks. ASTM: West Conshohocken, PA, USA, 2016.
- Babu, S.V.; Sharmila, M.R. Soil stabilization using marble dust. Int. J. Civ. Eng. Technol. (IJCIET) 2017, 8, 1706–1713. [Google Scholar]
- Lai, T.; Lei, H.; Ji, Z.; Liang, Y. Effects of Cement-Modified Soil as Blocking Cushion of Saline Soil Subgrade. Rev. Des Compos. Matériaux Avancés 2020, 30, 49–53. [Google Scholar] [CrossRef]
- Rosone, M.; Celauro, C. A Sustainable Option to Reuse Scaly Clays as Geomaterial for Earthworks. Geosciences 2024, 14, 17. [Google Scholar] [CrossRef]
- Xie, J.; He, B.; Chen, T.; Zhang, N.; Peng, X.; Nie, X.; Ma, F. Characterization of red mud and fly ash based for co-curing of Cu2+-contaminated soil. Case Stud. Constr. Mater. 2024, 20, e02769. [Google Scholar] [CrossRef]
- Soltaninejad, S.; Marandi, S.M.; Bp, N. Performance Evaluation of Clay Plastic Concrete of Cement and Epoxy Resin Composite as a Sustainable Construction Material in the Durability Process. Sustainability 2023, 15, 8987. [Google Scholar] [CrossRef]
- Yilmaz, F.; Demir, E. Strength and Durability Performance of Clayey Soil Stabilized with Lime and Marble Powder. Düzce Üniversitesi Bilim Ve Teknol. Derg. 2021, 9, 511–520. [Google Scholar] [CrossRef]
- Mollamahmutoglu, M.; Yilmaz, Y.; Güngör, A.G. Effect of a Class C Fly Ash on the Geotechnical Properties of an Expansive Soil. Int. J. Eng. Res. Dev. 2009, 1, 2–7. [Google Scholar]
- Dikmen, S.; Dikmen, Z.; Yilmaz, G.; Firat, S. Mechanical Activation of Fly Ash: Physical, Mineralogical and Morphological Characterization of Ground Fly Ashes. Eskişehir Tech. Univ. J. Sci. Technol. A-Appl. Sci. Eng. 2019, 20, 66–76. [Google Scholar] [CrossRef]
- Akkaya, U.G.; Cinku, K.; Yilmaz, E. Characterization of Strength and Quality of Cemented Mine Backfill Made up of Lead-Zinc Processing Tailings. Front. Mater. 2021, 8, 740116. [Google Scholar] [CrossRef]
- Ijaz, N.; Ye, W.-M.; Rehman, Z.U.; Ijaz, Z.; Junaid, M.F. Global insights into micro-macro mechanisms and environmental implications of limestone calcined clay cement (LC3) for sustainable construction applications. Sci. Total Environ. 2024, 907, 167794. [Google Scholar] [CrossRef]
- Amran, M.; Onaizi, A.M.; Makul, N.; Abdelgader, H.S.; Tang, W.C.; Alsulami, B.T.; Alluqmani, A.E.; Gamil, Y. Shrinkage mitigation in alkali-activated composites: A comprehensive insight into the potential applications for sustainable construction. Results Eng. 2023, 20, 101452. [Google Scholar] [CrossRef]
- Boushehri, S.A.-O.S.; Essig, K.; Chlis, N.-K.; Herter, S.; Bacac, M.; Theis, F.J.; Glasmacher, E.; Marr, C. Explainable machine learning for profiling the immunological synapse and functional characterization of therapeutic antibodies. Nat. Commun. 2023, 14, 7888. [Google Scholar] [CrossRef] [PubMed]
- Ali, S.; Abuhmed, T.; El-Sappagh, S.; Muhammad, K.; Alonso-Moral, J.M.; Confalonieri, R.; Guidotti, R.; Del Ser, J.; Díaz-Rodríguez, N.; Herrera, F. Explainable Artificial Intelligence (XAI): What we know and what is left to attain Trustworthy Artificial Intelligence. Inf. Fusion 2023, 99, 101805. [Google Scholar] [CrossRef]
- Arias-Jaramillo, Y.P.; Gómez-Cano, D.; Carvajal, G.I.; Hidalgo, C.A.; Muñoz, F. Evaluation of the Effect of Binary Fly Ash-Lime Mixture on the Bearing Capacity of Natural Soils: A Comparison with Two Conventional Stabilizers Lime and Portland Cement. Materials 2023, 16, 3996. [Google Scholar] [CrossRef] [PubMed]
- Tang, F. Effects of Small Gaps on the Relationship Among Soil Properties, Topography, and Plant Species in Subtropical Rhododendron Secondary Forest, Southwest China. Int. J. Environ. Res. Public Health 2019, 16, 1919. [Google Scholar] [CrossRef]


| S/N | Test Class | w (%) | Tests | Curing Period (Days) | |
|---|---|---|---|---|---|
| Natural soil (%) | Marble powder (%) | ||||
| 1 | 100 | 0 | 20, 20.5, 24.5 | UCS | 0, 3, 7, 14, 28 |
| 2 | 85 | 15 | |||
| 3 | 70 | 30 | |||
| 4 | 55 | 45 | |||
| 5 | 40 | 60 | |||
| 6 | 25 | 75 | |||
| Basic Properties | Amount | |
|---|---|---|
| Specific Gravity, % | 2.73 | |
| Atterberg Limits | Liquid Limit, % | 62.2 |
| Plastic Limit,% | 29.6 | |
| Plasticity Index, % | 32.6 | |
| Finer Component | % Passed NO. 200 Mesh, % | 71.6 |
| USCS Classification | CH | - |
| Compaction Parameter | Optimum Moisture Content, % | 22.5 |
| Maximum Dry Density, Mg/m3 | 1.60 | |
| UCS, kN/m2 | - | 245 |
| Initial Void Ratio (eo) | - | 0.665 |
| Color | - | Dark Beige |
| PH | - | 5.51 |
| Dominate soil mineral | - | Kaolinite |
| Composition | CaO | SiO2 | P2O5 | Fe2O3 | Al2O3 | MnO | Na2O | K2O | MgO | LOI | Total |
|---|---|---|---|---|---|---|---|---|---|---|---|
| Values (%) | 56.33 | 0.28 | 0.01 | 0.37 | 0.07 | 0.01 | 0.06 | 0.02 | 0.65 | 42.27 | 100.07 |
| Soil/Powder Composition | UCS (kN/m2) for 0 Day | UCS (kN/m2) for 3 Days | UCS (kN/m2) for 7 Days | UCS (kN/m2) for 14 Days | UCS (kN/m2) for 28 Days |
|---|---|---|---|---|---|
| 20% molding water content | |||||
| 100%soil/0%powder | 170 | 170 | 170 | 170 | 170 |
| 85%soil/15%powder | 204 | 225 | 295 | 306 | 368 |
| 70%soil/30%powder | 239 | 251 | 316 | 334 | 399 |
| 55%soil/45%powder | 265 | 278 | 348 | 370 | 438 |
| 40%soil/60%powder | 299 | 315 | 382 | 409 | 472 |
| 25%soil/75%powder | 247 | 257 | 320 | 345 | 422 |
| 22.5% molding water content | |||||
| 100%soil/0%powder | 245 | 245 | 245 | 245 | 245 |
| 85%soil/15%powder | 272 | 295 | 495 | 510 | 550 |
| 70%soil/30%powder | 302 | 333 | 525 | 545 | 590 |
| 55%soil/45%powder | 420 | 440 | 545 | 572 | 631 |
| 40%soil/60%powder | 461 | 486 | 569 | 601 | 661 |
| 25%soil/75%powder | 408 | 430 | 528 | 562 | 601 |
| 24.5% molding water content | |||||
| 100%soil/0%powder | 215 | 215 | 215 | 215 | 215 |
| 85%soil/15%powder | 235 | 255 | 314 | 346 | 434 |
| 70%soil/30%powder | 251 | 264 | 352 | 390 | 470 |
| 55%soil/45%powder | 284 | 295 | 399 | 433 | 505 |
| 40%soil/60%powder | 310 | 328 | 426 | 470 | 540 |
| 25%soil/75%powder | 277 | 290 | 385 | 401 | 497 |
| Curing Time | Mean UCS (kN/m2) | Standard Deviation (kN/m2) | 95% CI Lower Bound (kN/m2) | 95% CI Upper Bound (kN/m2) |
|---|---|---|---|---|
| 20% molding water content | ||||
| 0 day | 237.3871 | 45.49191 | 189.6463 | 285.128 |
| 3 days | 249.3333 | 49.15554 | 197.7478 | 300.9189 |
| 7 days | 305.1667 | 72.73078 | 228.8404 | 381.4929 |
| 14 days | 322.3333 | 82.34723 | 235.9152 | 408.7515 |
| 28 days | 378.1454 | 107.8354 | 264.979 | 491.3117 |
| 22.5% molding water content | ||||
| 0 day | 351.4384 | 89.61126 | 257.3971 | 445.4796 |
| 3 days | 371.5 | 94.40498 | 272.4281 | 470.5719 |
| 7 days | 484.5 | 119.8361 | 358.7397 | 610.2603 |
| 14 days | 505.8333 | 131.282 | 368.0613 | 643.6054 |
| 28 days | 546.4111 | 152.3853 | 386.4925 | 706.3297 |
| 24.5% molding water content | ||||
| 0 day | 261.7992863 | 34.85796559 | 225.2180949 | 298.3804778 |
| 3 days | 274.4291991 | 38.99795432 | 233.503356 | 315.3550423 |
| 7 days | 348.4291991 | 76.19327185 | 268.4692641 | 428.3891342 |
| 14 days | 375.7625325 | 89.29012196 | 282.0582962 | 469.4667688 |
| 28 days | 443.3529503 | 117.530932 | 320.0118014 | 566.6940991 |
Disclaimer/Publisher’s Note: The statements, opinions and data contained in all publications are solely those of the individual author(s) and contributor(s) and not of MDPI and/or the editor(s). MDPI and/or the editor(s) disclaim responsibility for any injury to people or property resulting from any ideas, methods, instructions or products referred to in the content. |
© 2024 by the authors. Licensee MDPI, Basel, Switzerland. This article is an open access article distributed under the terms and conditions of the Creative Commons Attribution (CC BY) license (https://creativecommons.org/licenses/by/4.0/).
Share and Cite
Umar, I.H.; Lin, H. Marble Powder as a Soil Stabilizer: An Experimental Investigation of the Geotechnical Properties and Unconfined Compressive Strength Analysis. Materials 2024, 17, 1208. https://doi.org/10.3390/ma17051208
Umar IH, Lin H. Marble Powder as a Soil Stabilizer: An Experimental Investigation of the Geotechnical Properties and Unconfined Compressive Strength Analysis. Materials. 2024; 17(5):1208. https://doi.org/10.3390/ma17051208
Chicago/Turabian StyleUmar, Ibrahim Haruna, and Hang Lin. 2024. "Marble Powder as a Soil Stabilizer: An Experimental Investigation of the Geotechnical Properties and Unconfined Compressive Strength Analysis" Materials 17, no. 5: 1208. https://doi.org/10.3390/ma17051208
APA StyleUmar, I. H., & Lin, H. (2024). Marble Powder as a Soil Stabilizer: An Experimental Investigation of the Geotechnical Properties and Unconfined Compressive Strength Analysis. Materials, 17(5), 1208. https://doi.org/10.3390/ma17051208