
Optical Temperature-Sensing Performance of La2Ce2O7:Ho3+ Yb3+ Powders

Engineering Research Center of Optical Instrument and System, Ministry of Education and Shanghai Key Laboratory of Modern Optical System, University of Shanghai for Science and Technology, No. 516 Jungong Road, Shanghai 200093, China
*
Author to whom correspondence should be addressed.
Materials 2024, 17(7), 1692; https://doi.org/10.3390/ma17071692
Submission received: 17 March 2024
/
Revised: 31 March 2024
/
Accepted: 4 April 2024
/
Published: 7 April 2024
(This article belongs to the Section Materials Physics)
Abstract
:In this paper, La2Ce2O7 powders co-activated by Ho3+ and Yb3+ were synthesized by a high temperature solid-state reaction. Both Ho3+ and Yb3+ substitute the La3+ sites in the La2Ce2O7 lattice, where the Ho3+ concentration is 0.5 at.% and the Yb3+ concentration varies in the range of 10~18% at.%. Pumped by a 980 nm laser, the up-conversion (UC) green emission peak at 547 nm and the red emission at 661 nm were detected. When the doping concentration of Ho3+ and Yb3+ are 0.5 at.% and 14% at.%, respectively, the UC emission reaches the strongest intensity. The temperature-sensing performance of La2Ce2O7:Ho3+ with Yb3+ was studied in the temperature range of 303–483 K, where the highest relative sensitivity (Sr) is 0.0129 K−1 at 483 K. The results show that the powder La2Ce2O7:Ho3+, Yb3+ can be a potential candidate for remote temperature sensors.
1. Introduction
Since the concept of UC luminescence was first proposed by the French scientist Auzel in 1966 [1], it has been widely concerned in the application fields of remote thermometers [2], stimulated emission depletion [3], solar cells [4], etc. Remote thermometers based on UC luminescent materials are suitable for harsh environments, such as strong magnetic fields and corrosion [5]. Theoretically, the fluorescence intensity, fluorescence intensity ratio (FIR), fluorescence lifetime, and full width at half maximum (FWHM) of luminescent materials will change with the variation in temperature [6]. Based on these characteristics, the purpose of temperature sensing can be feasibly realized.
The optical properties of fluorescent materials are usually temperature-dependent within a certain temperature range. However, it should be pointed out that the measurement of fluorescence lifetime and intensity is highly dependent on the intensity of excitation light source, background noise, and other factors, so it is difficult to ensure the accuracy of the temperature measurement based on the above factors. At present, most of the research works on optical temperature measurement are based on FIR with good anti-interference ability [7,8,9,10,11]. Moreover, the UC luminescent materials activated by rare earth ions usually have abundant but narrow linear luminescence bands, which naturally feature more excellent FIR, and make it possess unique advantages in the field of temperature sensing.
UC luminescent materials for optical temperature measurement need to have high luminescence intensity, for which the selection of the host materials is very important. In recent years, the research on A2B2O7 compounds has been blooming, a general formula that describes most pyrochlores as A2B2O6O’, where the A site is occupied by a 3+ or 2+ cation with eight-fold coordination, the B site is occupied by a 4+ or 5+ cation with six-fold coordination, and there are two distinct oxygen atom sites [12]. At present, the reported A2B2O7 compounds are mainly La2Ce2O7 [13], Gd2Ce2O7 [14], Nd2Ce2O7 [15], etc., and the main application scenario focuses on the application of a thermal barrier coating, but few reports are found in the field of temperature sensing based on the fluorescence performance. La2Ce2O7 belongs to the structure of defective fluorite, where the A site is occupied by La3+, and the B site is occupied by Ce4+, as shown in Figure 1a. La2Ce2O7 has a high melting point (>2000 °C), excellent chemical stability, and high temperature phase stability and catalytic performance, which is widely used in thermal barrier coatings, infrared radiation ceramic materials, catalytic materials, etc. [16,17]. However, reports on the optical temperature-sensing performance of rare earth-doped La2Ce2O7 materials are few [18,19].
Due to the small energy gap between 2H11/2 and 4S3/2 of the Er3+ ions, the FIR conforms to the Boltzmann distribution and has a high sensitivity to temperature variation; Er3+ has been most extensively investigated by researchers [19,20]. In addition, in recent years, there have been numerous studies on the temperature-sensing performance of Ho3+-activated phosphor materials [21,22]. Particularly, some studies have shown that Ho3+-doped UC luminescent materials have excellent temperature-sensing performance [23,24]. Ho3+ can efficiently emit colorful UC fluorescence with the assistance of a Yb3+ sensitizer under an excitation of the 980 nm near-infrared laser [25,26]. Govind B. Nair et al. [27] prepared Ho3+/Yb3+ co-doped BaY2F8, and investigated the UC luminescence with temperature change in the temperature range of 303–623 K, and obtained the maximum relative sensitivity (Sr) of 0.006051 K−1 at 303 K.
In this work, a series of La2Ce2O7:Ho3+ Yb3+ powders were prepared by high temperature solid-state reaction. The temperature dependence of the UC emission intensity has been investigated. The results show that La2Ce2O7:Ho3+ Yb3+ powders are good candidates for optical temperature sensing.
2. Experimental
2.1. Materials Preparation
High purity powder Ho2O3 (99.99%), Yb2O3 (99.99%), CeO2 (99.99%), and La2O3 (99.999%) were used as raw materials and weighed according to the chemical composition of (Ho0.005YbxLa0.995−x)2Ce2O7 (x = 0.10, 0.12, 0.14, 0.16, 0.18). Since La2O3 is easy to absorb moisture, it is kept in the oven at 120 °C before use. The mixed powders were ground with an agate grinder for 1 h. The resultant powder mixtures were thermally treated in a Muffle furnace by the following sintering procedure: raised to 1370 K from room temperature within 150 min, then raised to 1890 K within 120 min and kept for 300 min, and finally cooled down to room temperature naturally. For the following characterizations, the obtained products were ground into fine powders with an agate grinder for 1 h.
2.2. Characterizations
X-ray diffraction (XRD, Rigaku SmartLab, Japan, Akishima City, Tokyo) was used to analyze the phase and crystal structure of the (Ho0.005YbxLa0.995−x)2Ce2O7 (x = 0.10, 0.12, 0.14, 0.16, and 0.18) samples. The scanning range is 20–90°, the step size is 0.02°, and the scanning speed is 8°/min. The UC emission spectra under excitation of a 980 nm laser were recorded by a fluorescence spectrometer (FLS1000, Edinburg Instruments, UK, Edinburgh) with a resolution of 0.05 nm. In addition, the temperature-dependent PL spectra were measured in the 303–483 K temperature range, and the thermal recovery property and repeatability of the samples were also measured on the fluorescence spectrometer.
3. Results and Discussion
Figure 1b shows the XRD θ-2θ scanning patterns of La2Ce2O7 and (Ho0.005YbxLa0.995−x)2Ce2O7 (x = 0.10, 0.12, 0.14, 0.16, and 0.18) powder samples thermally treated at 1890 K for 5 h. The diffraction patterns of all the Ho3+ and Yb3+ co-doped samples were the same as La2Ce2O7, without other phases detected. The difference is that the diffraction peaks are all shifted to higher angles, indicating that Ho and Yb have been successfully doped into the lattice of La2Ce2O7. The shift of the diffraction peaks to a higher angle is caused by lattice shrinkage by the substitution of La3+ (RLa3+ = 1.22 Å) ions with larger ionic radii by Ho3+ (RHo3+ = 1.03 Å) and Yb3+ (RYb3+ = 0.887 Å) ions with a smaller ionic radius.
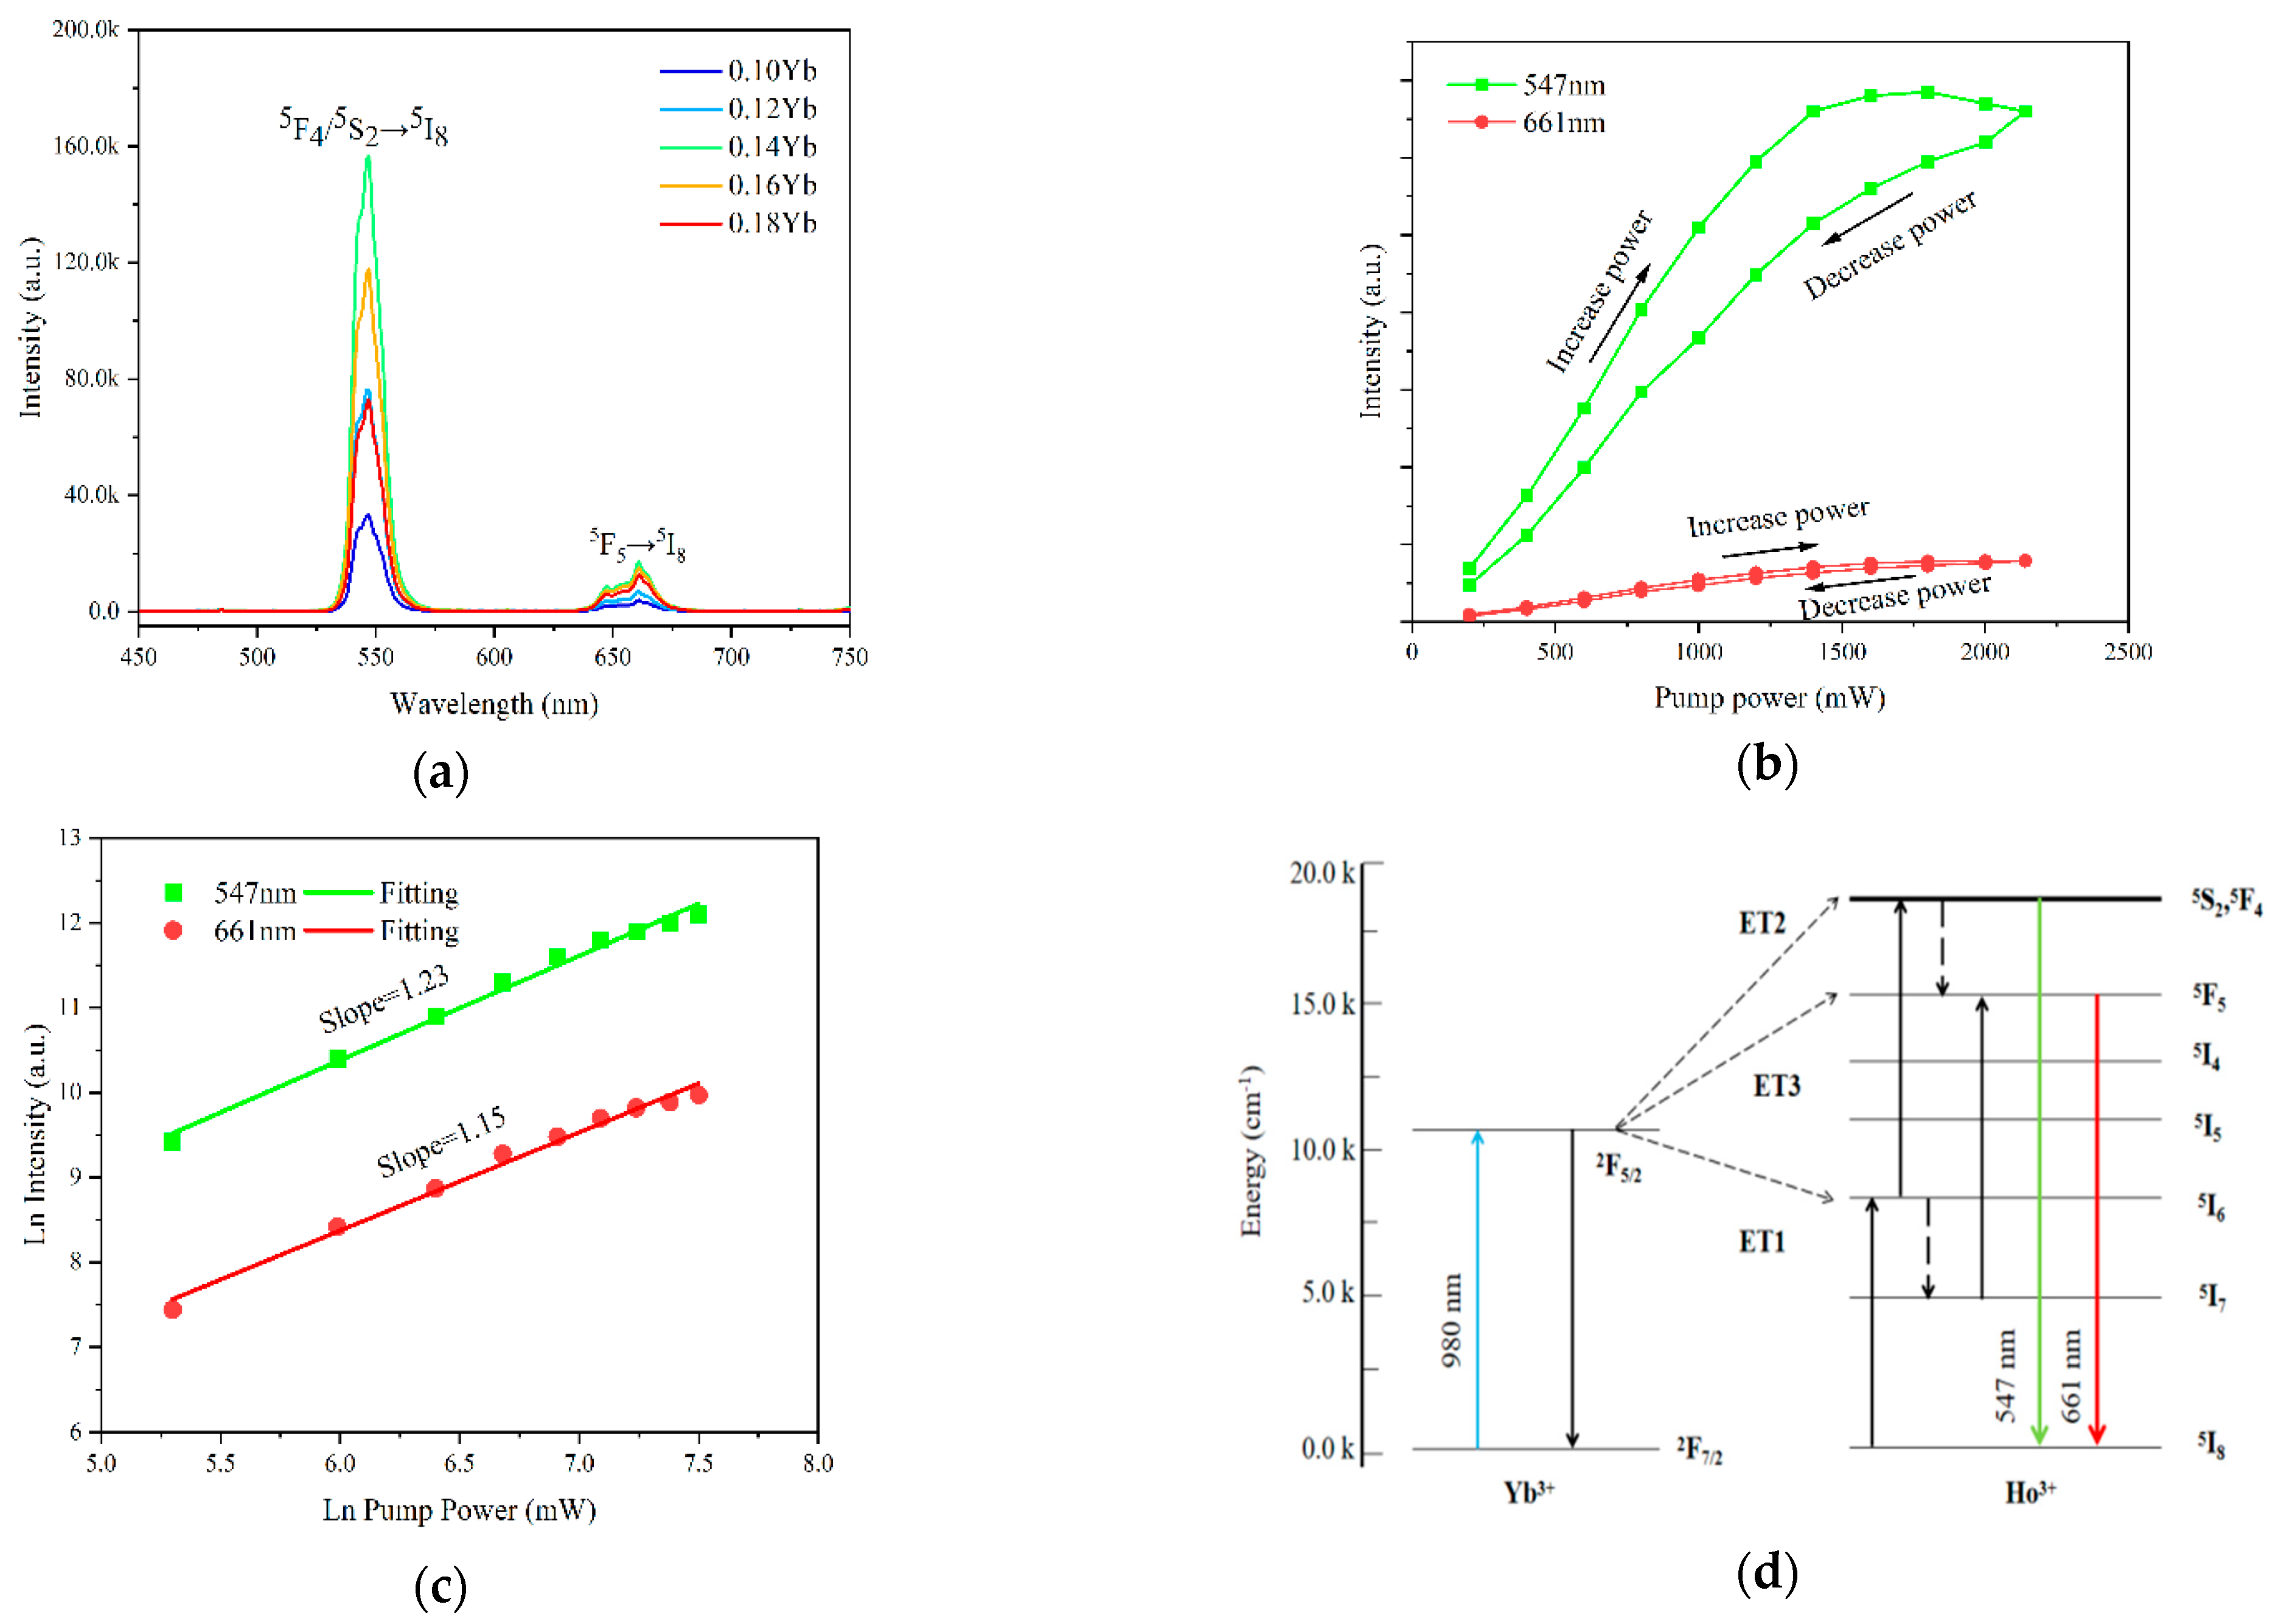
Figure 2a shows the UC emission spectra of the (Ho0.005YbxLa0.995−x)2Ce2O7 (x = 0.10, 0.12, 0.14, 0.16, and 0.18) powders under the excitation of a 980 nm laser (pumping power 150 mW) at room temperature. Although the doping amount of Yb3+ is various, the UC emission is mainly composed of a strong green emission peak at 547 nm (Ho3+: 5S2/5F4→5I8) and a weak red emission peak at 661 nm (Ho3+: 5F5→5I8). When the substitution amount of Yb3+ reaches x = 0.14, both the UC intensity of the green and red reach the maximum value. And, when x > 0.14, the UC intensity was gradually decreased, which was caused by the energy loss in the energy transfer (ET) between the Yb3+ ions or during the Yb3+→Ho3+ ET process.
Figure 2b shows the UC emission intensity spectra of the (Ho0.005Yb0.14La0.855)2Ce2O7 sample under the excitation of a 980 nm laser with different pumping powers (200–2140 mW) at room temperature. It can be clearly seen that with the increase in laser power, the 547 nm UC emission intensity (I547) and the 661 nm UC emission intensity (I661) rapidly increases. The initial UC emission intensity increases with the increase in excitation power, then gradually decreases when the power reaches 1800 mW. When the excitation power is less than 1400 mW, the UC emission intensity changes rapidly, and when the power is more than 1400 mW, the UC emission intensity changes slowly. A hysteresis-like loop was observed for the Ho3+: 5F4/5S2→5I8 transitions of ions when the pump power was increased from 200 mW to 2140 mW for the (Ho0.005Yb0.14La0.855)2Ce2O7 sample, and, conversely, for the excitation optical power down process. It can be seen from Figure 2b that with the pumping power increased, the UC emission intensity first increases and then decreases owing to the multi-phonon assisted non-radiative relaxations. However, in the “power-down” process, it does not take the same path, but rather follows a path with a slightly lower intensity and gives rise to a hysteresis curve. The same output power corresponds to two different emission intensities, and there is a loss in the intensity in the reverse process. The obtained hysteresis loop is clarifying the evidence of intrinsic optical bi-stability (IOB). The existence of emission intensity lag within a complete excitation power period is an indicator of inherent optical bi-stability [28]. At the same time, the increase in temperature caused by the increase in laser power is also one of the reasons for the hysteresis cycle of UC emission intensity.
According to the UC emission intensity theory, the UC emission intensity is proportional to the pumping power intensity, where n is the number of photons required for UC emission. In the UC emission process, the relationship between UC emission intensity (I) and excitation power (P) [29,30,31] can be expressed by the following formula:
The logarithm of pump power and the logarithm of luminescence intensity are used for linear fitting, and the slope of the line obtained is the number of photons required for UC emission, n, which can be obtained by the logarithm of Equation (1):
For the (Ho0.005Yb0.14La0.855)2Ce2O7 sample, the logarithmic relationship plotting between the intensity of the 547 nm and 661 nm UC emissions and the excitation power P is shown in Figure 2c. The slopes of the linear fitting for the 547 nm and 661 nm UC emissions are 1.23 and 1.15, respectively, indicating that both of the two UC emissions are based on the two-photon process. For the two-photon process, n should be equal to or approximately equal to 2, but the n value of both sets of experimental data are less than 2. This may be caused by the competition between linear decay and UC processes for the depletion in the intermediate excited states [32]. As reported by Xue et al. [33], when UC is dominant, the intensity is proportional to the excitation power density, and when the intermediate excited state energy level is dominated by linear decay, the intensity is proportional to the square of the excited power. Therefore, since n is closer to 1 (n = 1.23, 1.15), the linear decay of the intermediate excited state is dominant in this work.
In order to better understand the UC emission process of La2Ce2O7:Ho3+ Yb3+, the energy level diagrams of Ho3+ and Yb3+ and the possible energy transfer during the UC emission process are provided in Figure 2d. Under the excitation of a 980 nm laser, the Yb3+:2F7/2 ground state electrons absorb the energy and transit to the Yb3+:2F5/2 excited state, while the Ho3+:5I8 ground state electrons jump to the Ho3+:5I6 excited state through the energy transfer (ET1) from Yb3+ to Ho3+. The intermediate level of Ho3+:5I6 has a long life, which can continue to absorb energy and, in the meantime, transit to the excited state of Ho3+:5F4/5/5S2 of higher energy via excited state absorption (ESA). Some electrons decay from the Ho3+:5I6 state to the Ho3+:5I7 state through multi-phonon relaxation. Electrons in the Ho3+:5I7 state can go up to the Ho3+:5F5 state, which is also an ESA process. Finally, electrons transit from the Ho3+:5F4/5/5S2 and Ho3+:5F5 states to the Ho3+:5I8 ground state. Above all, the green and red UC emissions are generated.
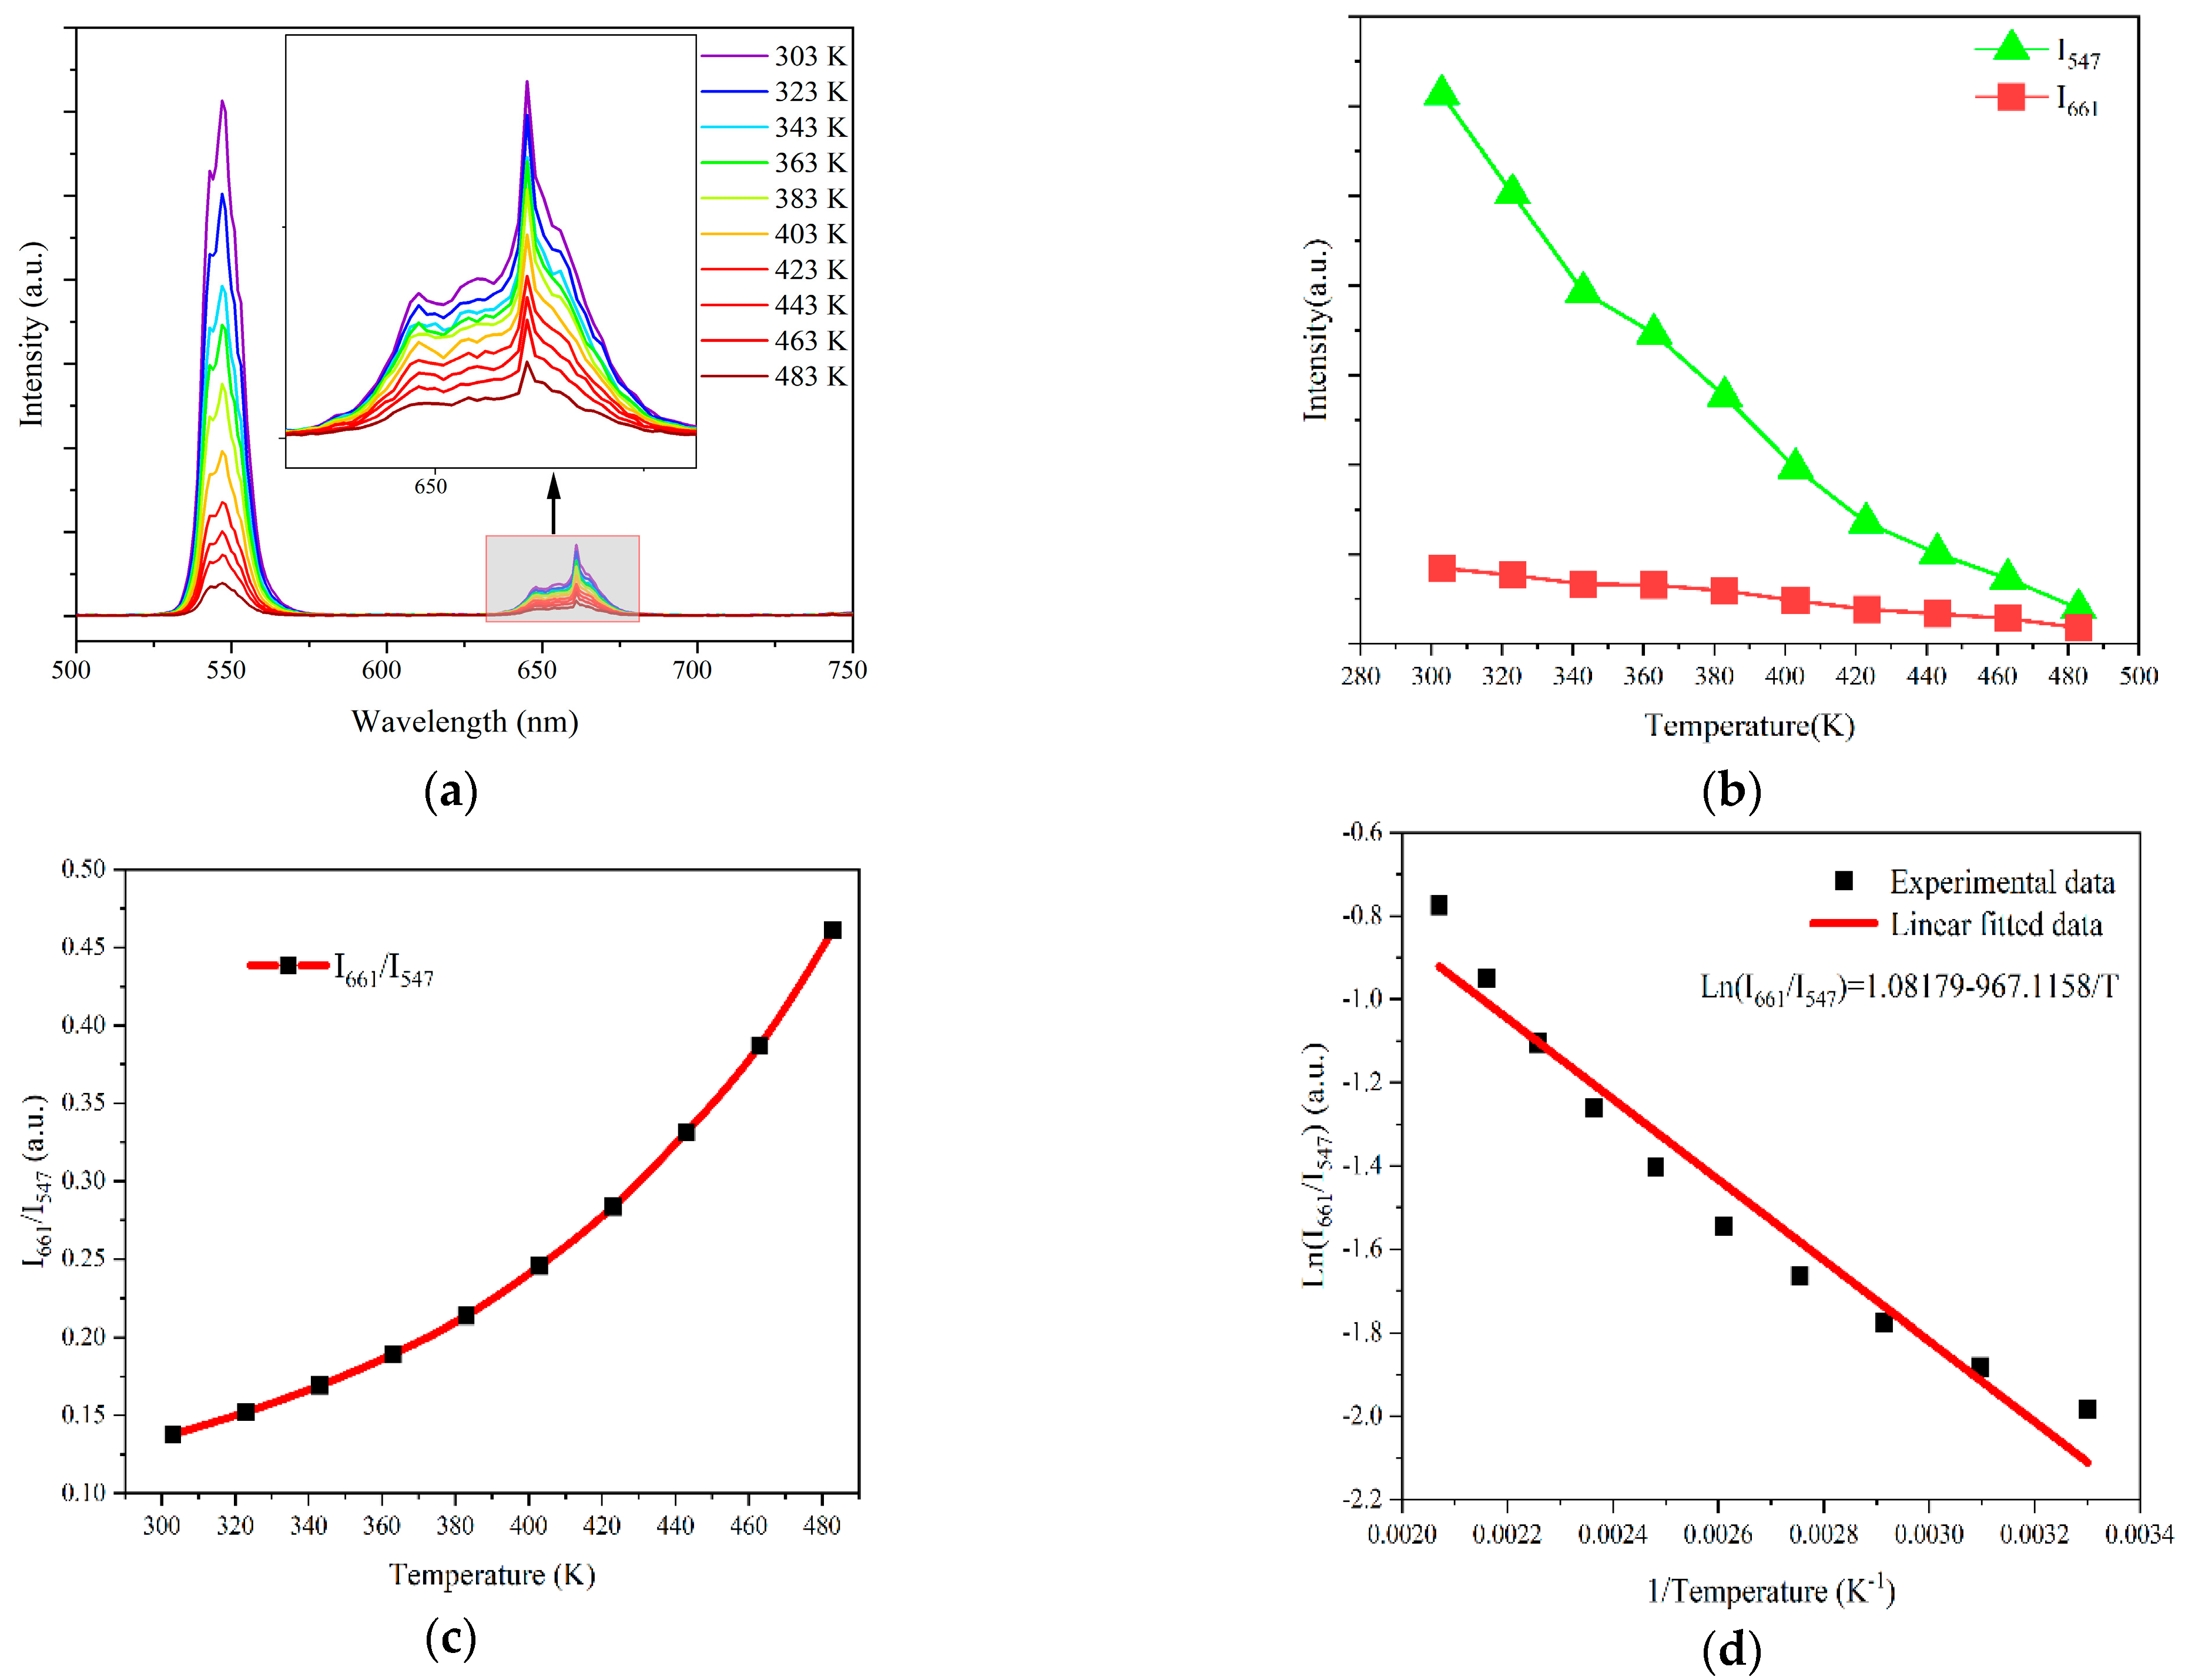
In order to study the temperature-sensing performance of Yb3+ and Ho3+ co-doped La2Ce2O7 UC-emitting powders, temperature-dependent UC emission spectra under the excitation of a 980 nm laser were measured in the range of 303–483 K, as shown in Figure 3a. The inset shows the enlarged view of the red UC emission spectra in the wavelength range of 640–680 nm. It can be observed that with the increase in temperature, the intensity of the green and the red UC emissions gradually weakens, due to the thermal quenching. With the increase in temperature, phonon vibration in the lattice is enhanced, leading to the increase in the probability of non-radiative relaxation, and the excessive energy is lost in the form of heat, resulting in the reduced UC emission intensity [10,34,35].
Specifically, as shown in Figure 3b, I661 has no obvious tendency to change with temperature; however, I547 decreased evidently when the temperature increased from 303 K to 483 K, which may be because the probability of non-radiative relaxation from 5F4/5S2 level to 5F5 level increased with increasing temperature. At the same time, the increase in temperature will also produce thermal excitation to promote the electron transition to the higher energy level of 5F4/5S2. The different response of these two energy levels to temperature provides favorable conditions for obtaining excellent temperature sensitivity [36].
Non-thermally coupled energy levels involve two independent excited energy levels, each with a unique temperature dependence. FIR based on non-thermally coupled levels of 5F4/5S2→5I8 and 5F5→5I8 can be used for optical temperature measurement. Since the intensity of 547 nm and 661 nm UC emissions are temperature-dependent, the FIR of corresponding energy levels can be used for temperature sensing. Figure 3c shows the plot of the FIR of the 661 nm and 547 nm UC emissions against the absolute temperature. The ratio I661/I547 increased from 0.13 to 0.46 with the temperature increasing from 303 K to 483 K. Figure 3d shows the plot of Ln (I661/I547) as a function of the inverse absolute temperature, which presents a straight line with a slope of −967.1158 and an intercept of 1.08179. In addition, the sensitivity is a very major parameter to estimate the performance of the sensor. The absolute sensitivity (Sa) and the relative sensitivity (Sr) can be given as the following [37]:
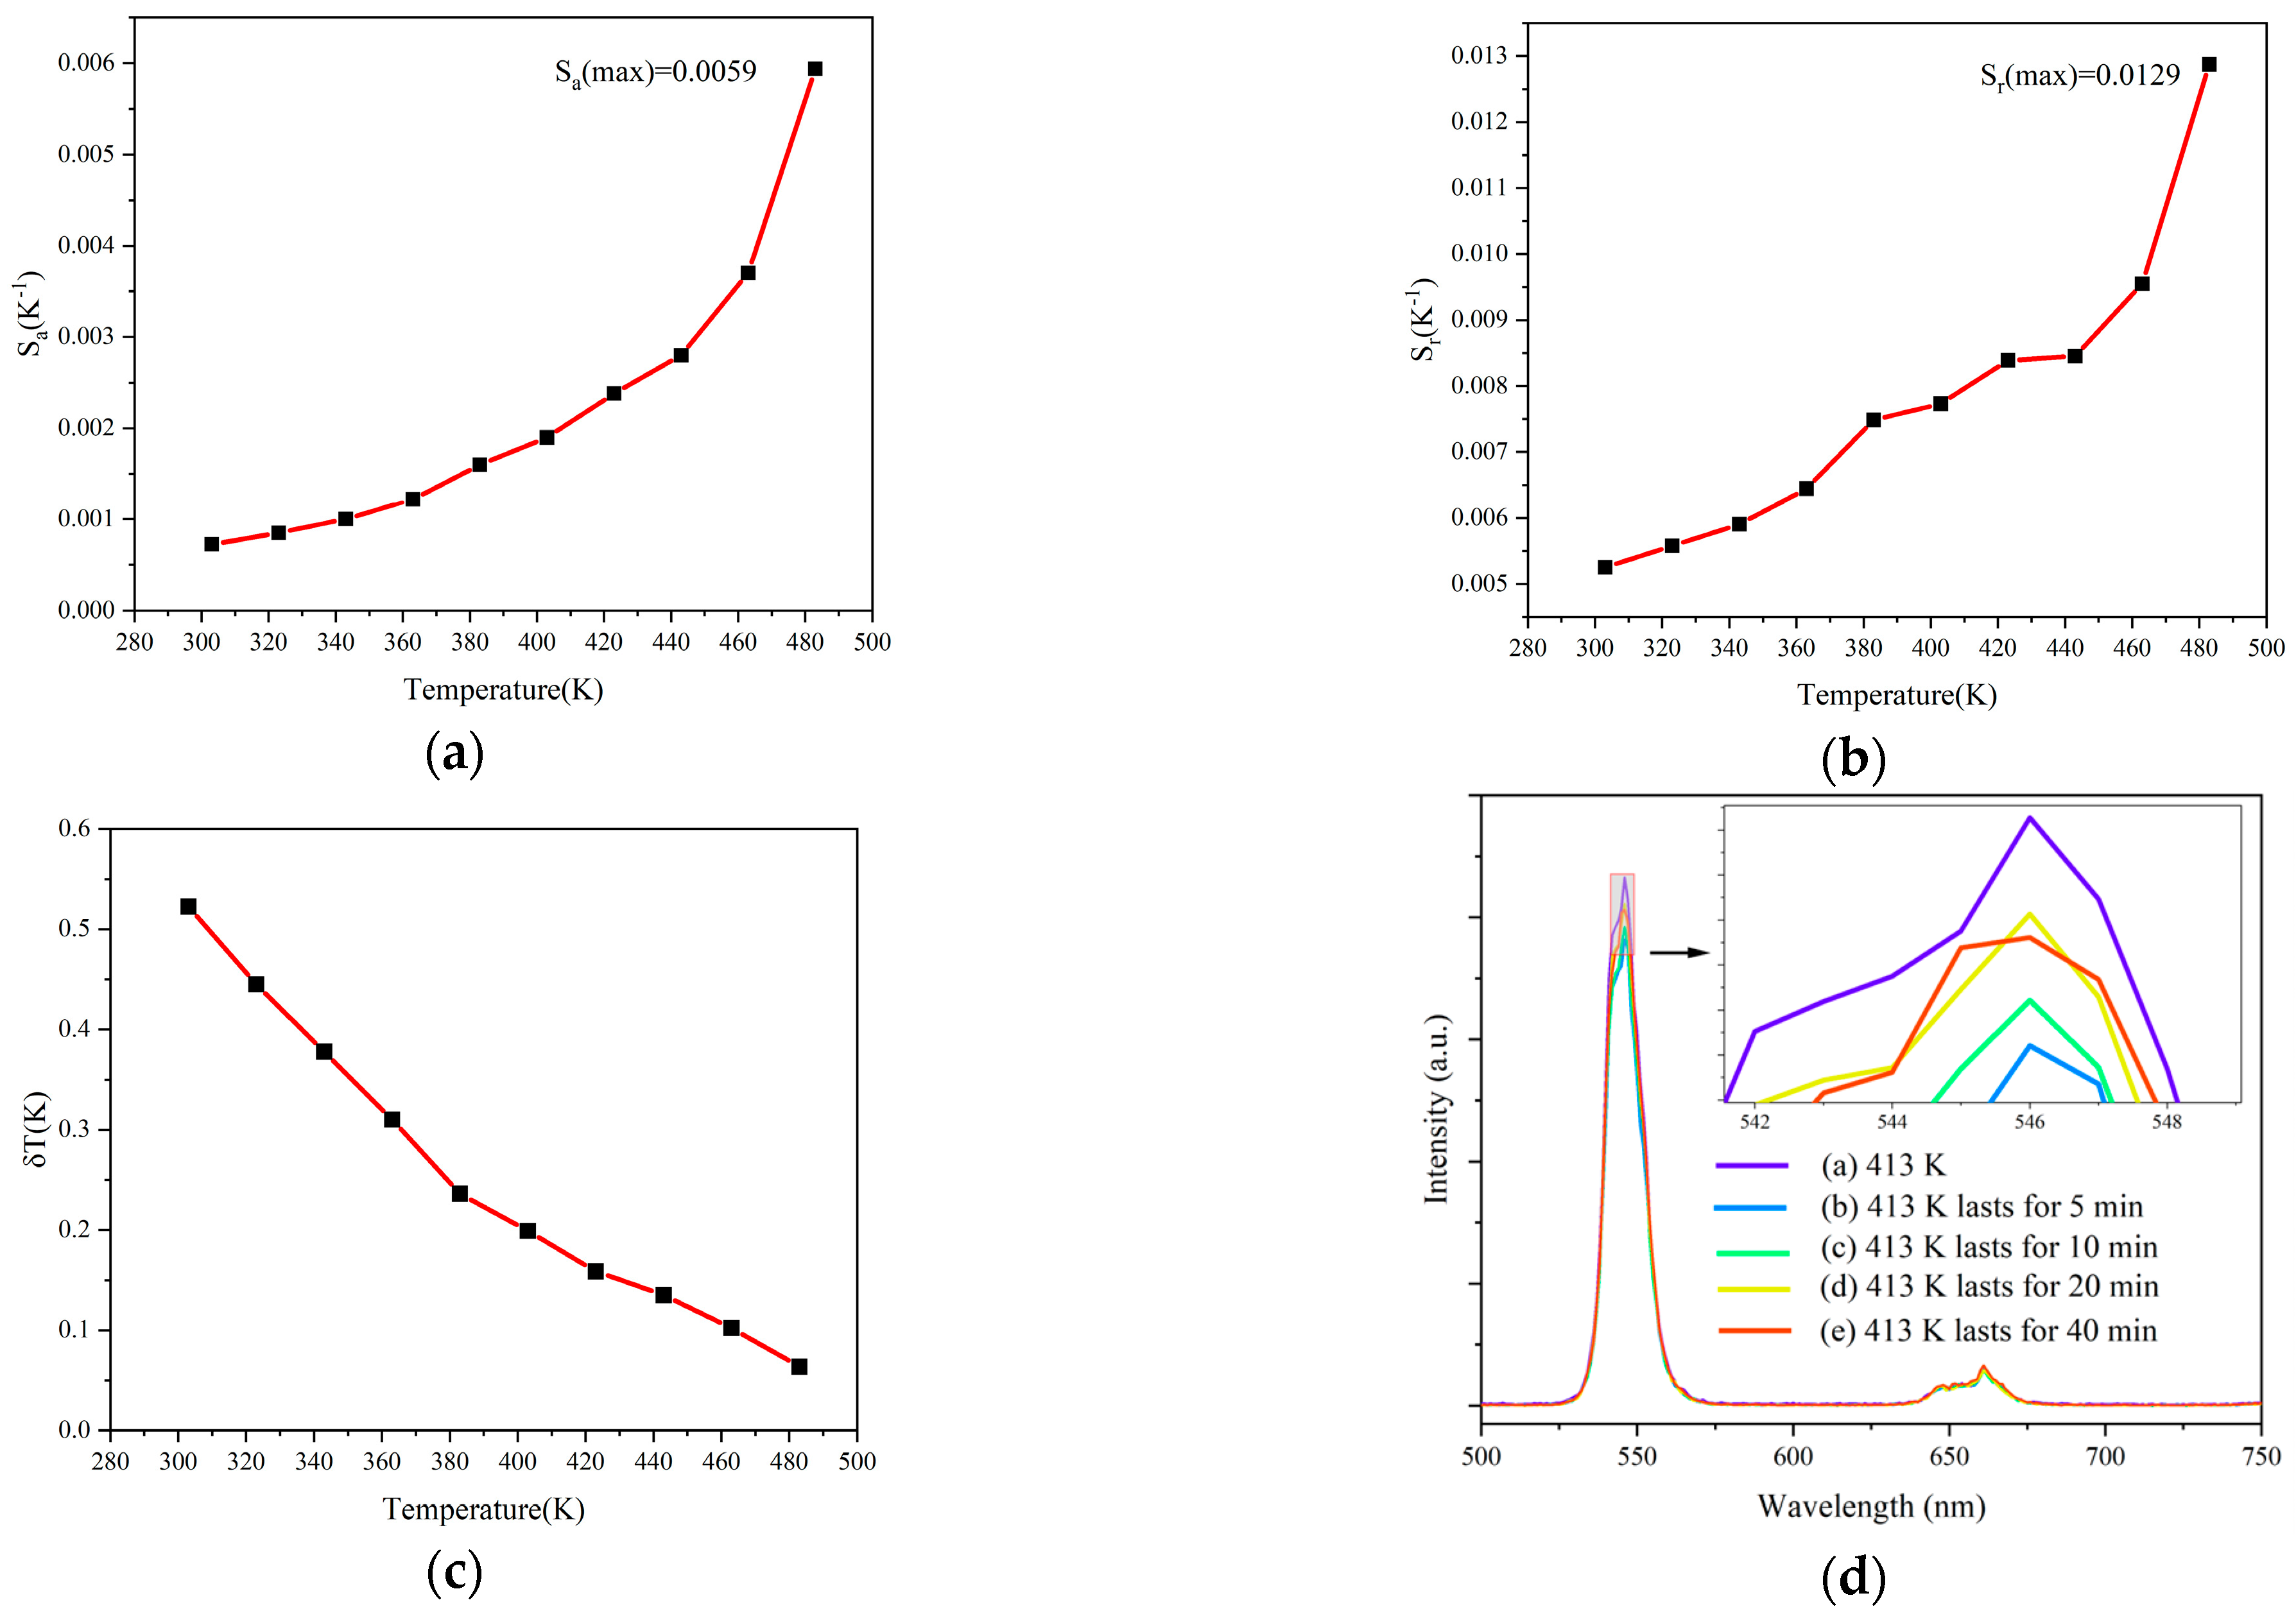
Figure 4a,b show the variation in the Sa and Sr of samples with temperature within the temperature range of 303–483 K. It can be seen that the absolute sensitivity Sa of the sample increases with the increase in temperature. Under the excitation of a 980 nm laser, the maximal Sa value is 0.0059 K−1 at 483 K. Sr shows fluctuating variation with the temperature, reaching a maximal value of 0.0129 K−1 around 483 K.
Temperature resolution (δT) is an important parameter for evaluating the performance of temperature sensing, indicating the smallest detectable temperature change. The temperature resolution obtained through experiments is generally expressed as [38]
In the above equation, δFIR represents the precision of the FIR, while δFIR/FIR is primarily determined by the properties of the detector. By conducting three measurements of the emitted spectrum and calculating their variances, the standard deviation of FIR at room temperature is determined to be 0.0378%. Utilizing this value, the temperature resolution can be computed, as illustrated in Figure 4c. It can be observed that the δT values range between 0.064 and 0.52, with an average δT value of around 0.25 K.
In order to investigate the thermal recovery performance of (Ho0.005Yb0.14La0.855)2Ce2O7 powder, five emission spectra were measured under 1400 mW: (a) when the temperature rises to 413 K, the emission spectrum was measured immediately; (b) when 413 K lasts for 5 min; (c) when 413 K lasts for 10 min; (d) when 413 K lasts for 20 min; and (e) when 413 K lasts for 40 min. As shown in Figure 4d, after 413 K lasts for 5 min, the UC emission intensity decreased significantly, but after holding the powder for 10 min, 20 min, and 40 min, the UC emission intensity was gradually increased and recovered to the height of “(a)”, indicating that the thermal recovery performance of La2Ce2O7 powder is good.
The optical temperature-sensing performance of materials doped with Ho3+ and Yb3+ based on the FIR technology are shown in Table 1. The relative sensitivity of (Ho0.005Yb0.14La0.855)2Ce2O7 phosphor is higher than that of most of the materials listed in Table 1, which shows that Ho3+ and Yb3+-doped La2Ce2O7 powder is a potential candidate for optical temperature sensing.
4. Conclusions
In this work, Ho3+ and Yb3+ co-doped La2Ce2O7 powders were prepared by solid-state reaction at 1890 K. Under excitation by a 980 nm laser, green UC emission peaks were observed at 547 nm and red UC emission peaks at 661 nm at room temperature, with the UC emission intensity decreasing as the temperature increased. A quite clear relationship can be observed between the Ho3+/Yb3+ UC emission and the temperature. The highest relative sensitivity was 0.0129 K−1 at the temperature of 483 K. These properties indicate that La2Ce2O7:Ho3+ Yb3+ powder is a potential candidate material for optical temperature sensing.
Author Contributions
Conceptualization, H.L. and D.Z.; methodology, D.Y.; software, D.Y.; validation, R.H. and Z.H.; formal analysis, R.H.; investigation, J.C.; resources, H.L.; data curation, J.C.; writing—original draft preparation, J.C.; writing—review and editing, J.C.; visualization, C.T.; supervision, D.Z.; project administration, H.L.; funding acquisition, H.L. All authors have read and agreed to the published version of the manuscript.
Funding
This work was sponsored by the National Key R&D Program of China (Grant No. 2022YFE0107400) and the Science and Technology Commission of Shanghai Municipality (Grant No. 23530730500).
Informed Consent Statement
Not applicable.
Data Availability Statement
The data of this paper are available on request from the corresponding author.
Conflicts of Interest
The authors declare no conflict of interest.
References
- Auzel, F. Stimulated emission of Er1s in a fluorophosphate glass. Comptes Rendus I Acad. Sci. 1966, 263, 765. [Google Scholar]
- Zhang, J.; Jin, C. Electronic structure, upconversion luminescence and optical temperature sensing behavior of Yb3+-Er3+/Ho3+ doped NaLaMgWO6. J. Alloys Compd. 2019, 783, 84–94. [Google Scholar] [CrossRef]
- Plöschner, M.; Denkova, D.; De Camillis, S.; Das, M.; Parker, L.M.; Zheng, X.; Lu, Y.; Ojosnegros, S.; Piper, J.A. Simultaneous super-linear excitation-emission and emission depletion allows imaging of upconversion nanoparticles with higher sub-diffraction resolution. Opt. Express 2020, 28, 24308–24326. [Google Scholar] [CrossRef]
- Tadge, P.; Yadav, R.S.; Vishwakarma, P.K.; Rai, S.B.; Chen, T.M.; Sapra, S.; Ray, S. Enhanced photovoltaic performance of Y2O3: Ho3+/Yb3+ upconversion nanophosphor based DSSC and investigation of color tunability in Ho3+/Tm3+/Yb3+ tridoped Y2O3. J. Alloys Compd. 2020, 821, 153230. [Google Scholar] [CrossRef]
- Fischer, L.H.; Harms, G.S.; Wolfbeis, O.S. Upconverting nanoparticles for nanoscale thermometry. Angew. Chem. Int. Ed. 2011, 50, 4546–4551. [Google Scholar] [CrossRef]
- Kumar, A.; Tiwari, S.P.; Sardar, A.; Kumar, K.; da Silva, J.C.E. Role of Ca2+ co-dopants on structural and optical properties of YF3: Tm3+/Yb3+ upconversion phosphor for improved optical thermometry. Sens. Actuators A Phys. 2018, 280, 179–187. [Google Scholar] [CrossRef]
- Wu, Y.; Suo, H.; He, D.; Guo, C. Highly sensitive up-conversion optical thermometry based on Yb3+-Er3+ co-doped NaLa (MoO4)2 green phosphors. Mater. Res. Bull. 2018, 106, 14–18. [Google Scholar] [CrossRef]
- Quintanilla, M.; Cantelar, E.; Cussó, F.; Villegas, M.; Caballero, A.C. Temperature sensing with up-converting submicron-sized LiNbO3: Er3+/Yb3+ particles. Appl. Phys. Express 2011, 4, 22601. [Google Scholar] [CrossRef]
- Haro-González, P.; Martín, I.R.; Martín, L.L.; León-Luis, S.F.; Pérez-Rodríguez, C.; Lavín, V. Characterization of Er3+ and Nd3+ doped Strontium Barium Niobate glass ceramic as temperature sensors. Opt. Mater. 2011, 33, 742–745. [Google Scholar] [CrossRef]
- Soni, A.K.; Rai, V.K.; Kumar, S. Cooling in Er3+: BaMoO4 phosphor on codoping with Yb3+ for elevated temperature sensing. Sens. Actuators B Chem. 2016, 229, 476–482. [Google Scholar] [CrossRef]
- Fan, H.; Lu, Z.; Meng, Y.; Chen, P.; Zhou, L.; Zhao, J.; He, X. Optical temperature sensor with superior sensitivity based on Ca2LaSbO6: Mn4+, Eu3+ phosphor. Opt. Laser Technol. 2022, 148, 107804. [Google Scholar] [CrossRef]
- Subramanian, M.A.; Aravamudan, G.; Rao, G.V.S. Oxide pyrochlores-a review. Prog. Solid State Chem. 1983, 1, 55–143. [Google Scholar] [CrossRef]
- Cao, X.; Vassen, R.; Fischer, W.; Tietz, F.; Jungen, W.; Stöver, D. Lanthanum-cerium oxide as a thermal barrier-coating material for high-temperature applications. Adv. Mater. 2003, 15, 1438–1442. [Google Scholar] [CrossRef]
- Patel, M.; Aguiar, J.A.; Sickafus, K.E.; Baldinozzi, G. Radiation effects in Gd2Ce2O7: Role of anion sublattice in disordering and limitations of Gibbons model for damage evolution in disordered systems. In Proceedings of the 29th Conference of the Condensed Matter Division of the European Physical Society, Manchester, UK, 24 August 2022. [Google Scholar]
- Patwe, S.J.; Ambekar, B.R.; Tyagi, A.K. Synthesis, characterization and lattice thermal expansion of some compounds in the system Gd2CexZr2−xO7. J. Alloys Compd. 2005, 389, 243–246. [Google Scholar] [CrossRef]
- Ma, W.; Gong, S.; Xu, H.; Cao, X. On improving the phase stability and thermal expansion coefficients of lanthanum cerium oxide solid solutions. Scr. Mater. 2006, 54, 1505–1508. [Google Scholar] [CrossRef]
- Andrievskaya, E.R.; Kornienk, O.A.; Sameljuk, A.V.; Sayir, A. Phase relation studies in the CeO2-La2O3 system at 1100–1500 °C. J. Eur. Ceram. Soc. 2011, 31, 1277–1283. [Google Scholar] [CrossRef]
- Shi, S.; Wang, L.; Fang, M.; Fu, L.; Carlos, L.D.; Ferreira, R.A.; Wang, S. Blue-light excitable La2Ce2O7:Eu3+ red powders for white light-emitting diodes. J. Alloys Compd. 2020, 814, 152226. [Google Scholar] [CrossRef]
- Banwal, A.; Bokolia, R. Enhanced upconversion luminescence and optical temperature sensing performance in Er3+ doped BaBi2Nb2O9 ferroelectric ceramic. Ceram. Int. 2022, 48, 2230–2240. [Google Scholar] [CrossRef]
- Galvao, R.; dos Santos, L.F.; de Oliveira Lima, K.; Goncalves, R.R.; de Souza Menezes, L. Single Er3+/Yb3+-codoped yttria nanocrystals for temperature sensing: Experimental characterization and theoretical modeling. J. Phys. Chem. C 2021, 125, 14807–14817. [Google Scholar] [CrossRef]
- Dinić, I.; Vuković, M.; Rabanal, M.E.; Milošević, M.; Bukumira, M.; Tomić, N.; Tomić, M.; Mančić, L.; Ignjatović, N. Temperature Sensing Properties of Biocompatible Yb/Er-Doped GdF3 and YF3 Mesocrystals. J. Funct. Biomater. 2023, 15, 6. [Google Scholar] [CrossRef]
- Van Swieten, T.P.; Yu, D.; Yu, T.; Vonk, S.J.; Suta, M.; Zhang, Q.; Rabouw, F.T. A Ho3+-based luminescent thermometer for sensitive sensing over a wide temperature range. Adv. Opt. Mater. 2021, 9, 2001518. [Google Scholar] [CrossRef]
- Saidi, K.; Chaabani, W.; Dammak, M. Highly sensitive optical temperature sensing based on pump-power-dependent upconversion luminescence in LiZnPO4: Yb3+-Er3+/Ho3+ phosphors. RSC Adv. 2021, 11, 30926–30936. [Google Scholar] [CrossRef]
- Doğan, A.; Erdem, M.; Esmer, K.; Eryürek, G. Upconversion luminescence and temperature sensing characteristics of Ho3+/Yb3+ co-doped tellurite glasses. J. Non-Cryst. Solids 2021, 571, 121055. [Google Scholar] [CrossRef]
- Singh, P.; Yadav, R.S.; Singh, P.; Rai, S.B. Upconversion and downshifting emissions of Ho3+-Yb3+ co-doped ATiO3 perovskite phosphors with temperature sensing properties in Ho3+-Yb3+ co-doped BaTiO3 phosphor. J. Alloys Compd. 2021, 855, 157452. [Google Scholar] [CrossRef]
- Dey, R.; Kumari, A.; Soni, A.K.; Rai, V.K. CaMoO4:Ho3+-Yb3+-Mg2+ upconverting powder for application in lighting devices and optical temperature sensing. Sens. Actuators B Chem. 2015, 210, 581–588. [Google Scholar] [CrossRef]
- Nair, G.B.; Sharma, A.K.; Dhoble, S.J.; Swart, H.C. Upconversion process in BaY2F8:Yb3+, Ho3+ powder for optical thermometry. Luminescence 2021, 36, 1847–1850. [Google Scholar] [CrossRef]
- Yadav, R.S.; Rai, E.; Purohit, L.P.; Rai, S.B. Realizing enhanced downconversion photoluminescence and high color purity in Dy3+ doped MgTiO3 powder in presence of Li+ ion. J. Lumin. 2020, 217, 116810. [Google Scholar] [CrossRef]
- Perrella, R.V.; Debasu, M.L.; Rezende, T.K.; Carneiro, J.A.; Barbosa, H.P.; Ferreirab, R.A.; Carlos, L.D.; Ferrari, J.L. Temperature sensing based on upconversion properties of Yb3+/Ho3+/Tm3+ tri-doped Y2O3 micro particles phosphors obtained by conventional precipitation method. Mater. Sci. Eng. B 2023, 297, 116780. [Google Scholar] [CrossRef]
- Trupke, T.; Green, M.A.; Würfel, P. Improving solar cell efficiencies by down-conversion of high-energy photons. J. Appl. Phys. 2002, 92, 1668–1674. [Google Scholar] [CrossRef]
- Ankur, S.; Yadav, R.S.; Gupta, A.K.; Sreenivas, K. Temperature-dependent light upconversion and thermometric properties of Er 3+/Yb 3+-codoped SrMoO4 sintered ceramics. J. Mater. Sci. 2021, 56, 12716–12731. [Google Scholar]
- Zhang, X.; Wang, M.; Ding, J.; Song, X.; Liu, J.; Shao, J.; Li, Y. LiYF4:Yb3+, Er3+ upconverting submicro-particles: Synthesis and formation mechanism exploration. RSC Adv. 2014, 4, 40223–40231. [Google Scholar] [CrossRef]
- Xue, X.; Uechi, S.; Tiwari, R.N.; Duan, Z.; Liao, M.; Yoshimura, M.; Ohishi, Y. Size-dependent Upconversion Luminescence in Er3+/Yb3+ Codoped LiYF4 Nano/Microcrystals. In Proceedings of the Conference on Lasers and Electro-Optics/Pacific Rim, Kyoto, Japan, 30 June–4 July 2013; TuPI_28. Optica Publishing Group: Washington, DC, USA, 2013. [Google Scholar]
- Blasse, G.; Grabmaier, B.C.; Blasse, G.; Grabmaier, B.C. A General Introduction to Luminescent Materials; Springer: Berlin/Heidelberg, Germany, 1994; pp. 1–9. [Google Scholar]
- Ansari, A.A.; Parchur, A.K.; Nazeeruddin, M.K.; Tavakoli, M.M. Luminescent lanthanide nanocomposites in thermometry: Chemistry of dopant ions and host matrices. Coord. Chem. Rev. 2021, 444, 214040. [Google Scholar] [CrossRef]
- Zhou, S.; Jiang, G.; Li, X.; Jiang, S.; Wei, X.; Chen, Y.; Duan, C. Strategy for thermometry via Tm3+-doped NaYF4 core-shell nanoparticles. Opt. Lett. 2014, 39, 6687–6690. [Google Scholar] [CrossRef] [PubMed]
- Ćirić, A.; Gavrilović, T.; Dramićanin, M.D. Luminescence intensity ratio thermometry with Er3+: Performance overview. Crystals 2021, 11, 189. [Google Scholar] [CrossRef]
- Jahanbazi, F.; Mao, Y. Recent advances on metal oxide-based luminescence thermometry. J. Mater. Chem. C 2021, 9, 16410–16439. [Google Scholar] [CrossRef]
- Li, W.; Hu, L.; Chen, W.; Sun, S.; Guzik, M.; Boulon, G. The effect of temperature on green and red upconversion emissions of LiYF4: 20Yb3+, 1Ho3+ and its application for temperature sensing. J. Alloys Compd. 2021, 866, 158813. [Google Scholar] [CrossRef]
- Zhang, C.; Ding, S.; Wang, M.; Ren, H.; Tang, X.; Zou, Y.; Dou, R.; Liu, W. Upconversion luminescence and optical thermometry behaviors of Yb3+ and Ho3+ co-doped GYTO crystal. Front. Optoelectron. 2023, 16, 31. [Google Scholar] [CrossRef]
- Nonaka, T.; Sugiura, T.; Tsukamoto, T.; Yamamoto, S.I. Green upconversion luminescence and temperature sensitivity of LaOF: Yb, Ho phosphors. J. Korean Ceram. Soc. 2022, 59, 889–894. [Google Scholar] [CrossRef]
- Makumbane, V.; Yagoub, M.Y.; Xia, Z.; Kroon, R.E.; Swart, H.C. Up-Conversion Luminescence and Optical Temperature Sensing Behaviour of Y2O3: Ho3+, Yb3+ Phosphors. Crystals 2023, 13, 1288. [Google Scholar] [CrossRef]
Figure 1.
(a) A schematic diagram of La2Ce2O7 crystal structure. (b) XRD θ-2θ scanning patterns of the La2Ce2O7:Ho3+, Yb3+ powders with different doping concentrations of Yb.
Figure 1.
(a) A schematic diagram of La2Ce2O7 crystal structure. (b) XRD θ-2θ scanning patterns of the La2Ce2O7:Ho3+, Yb3+ powders with different doping concentrations of Yb.
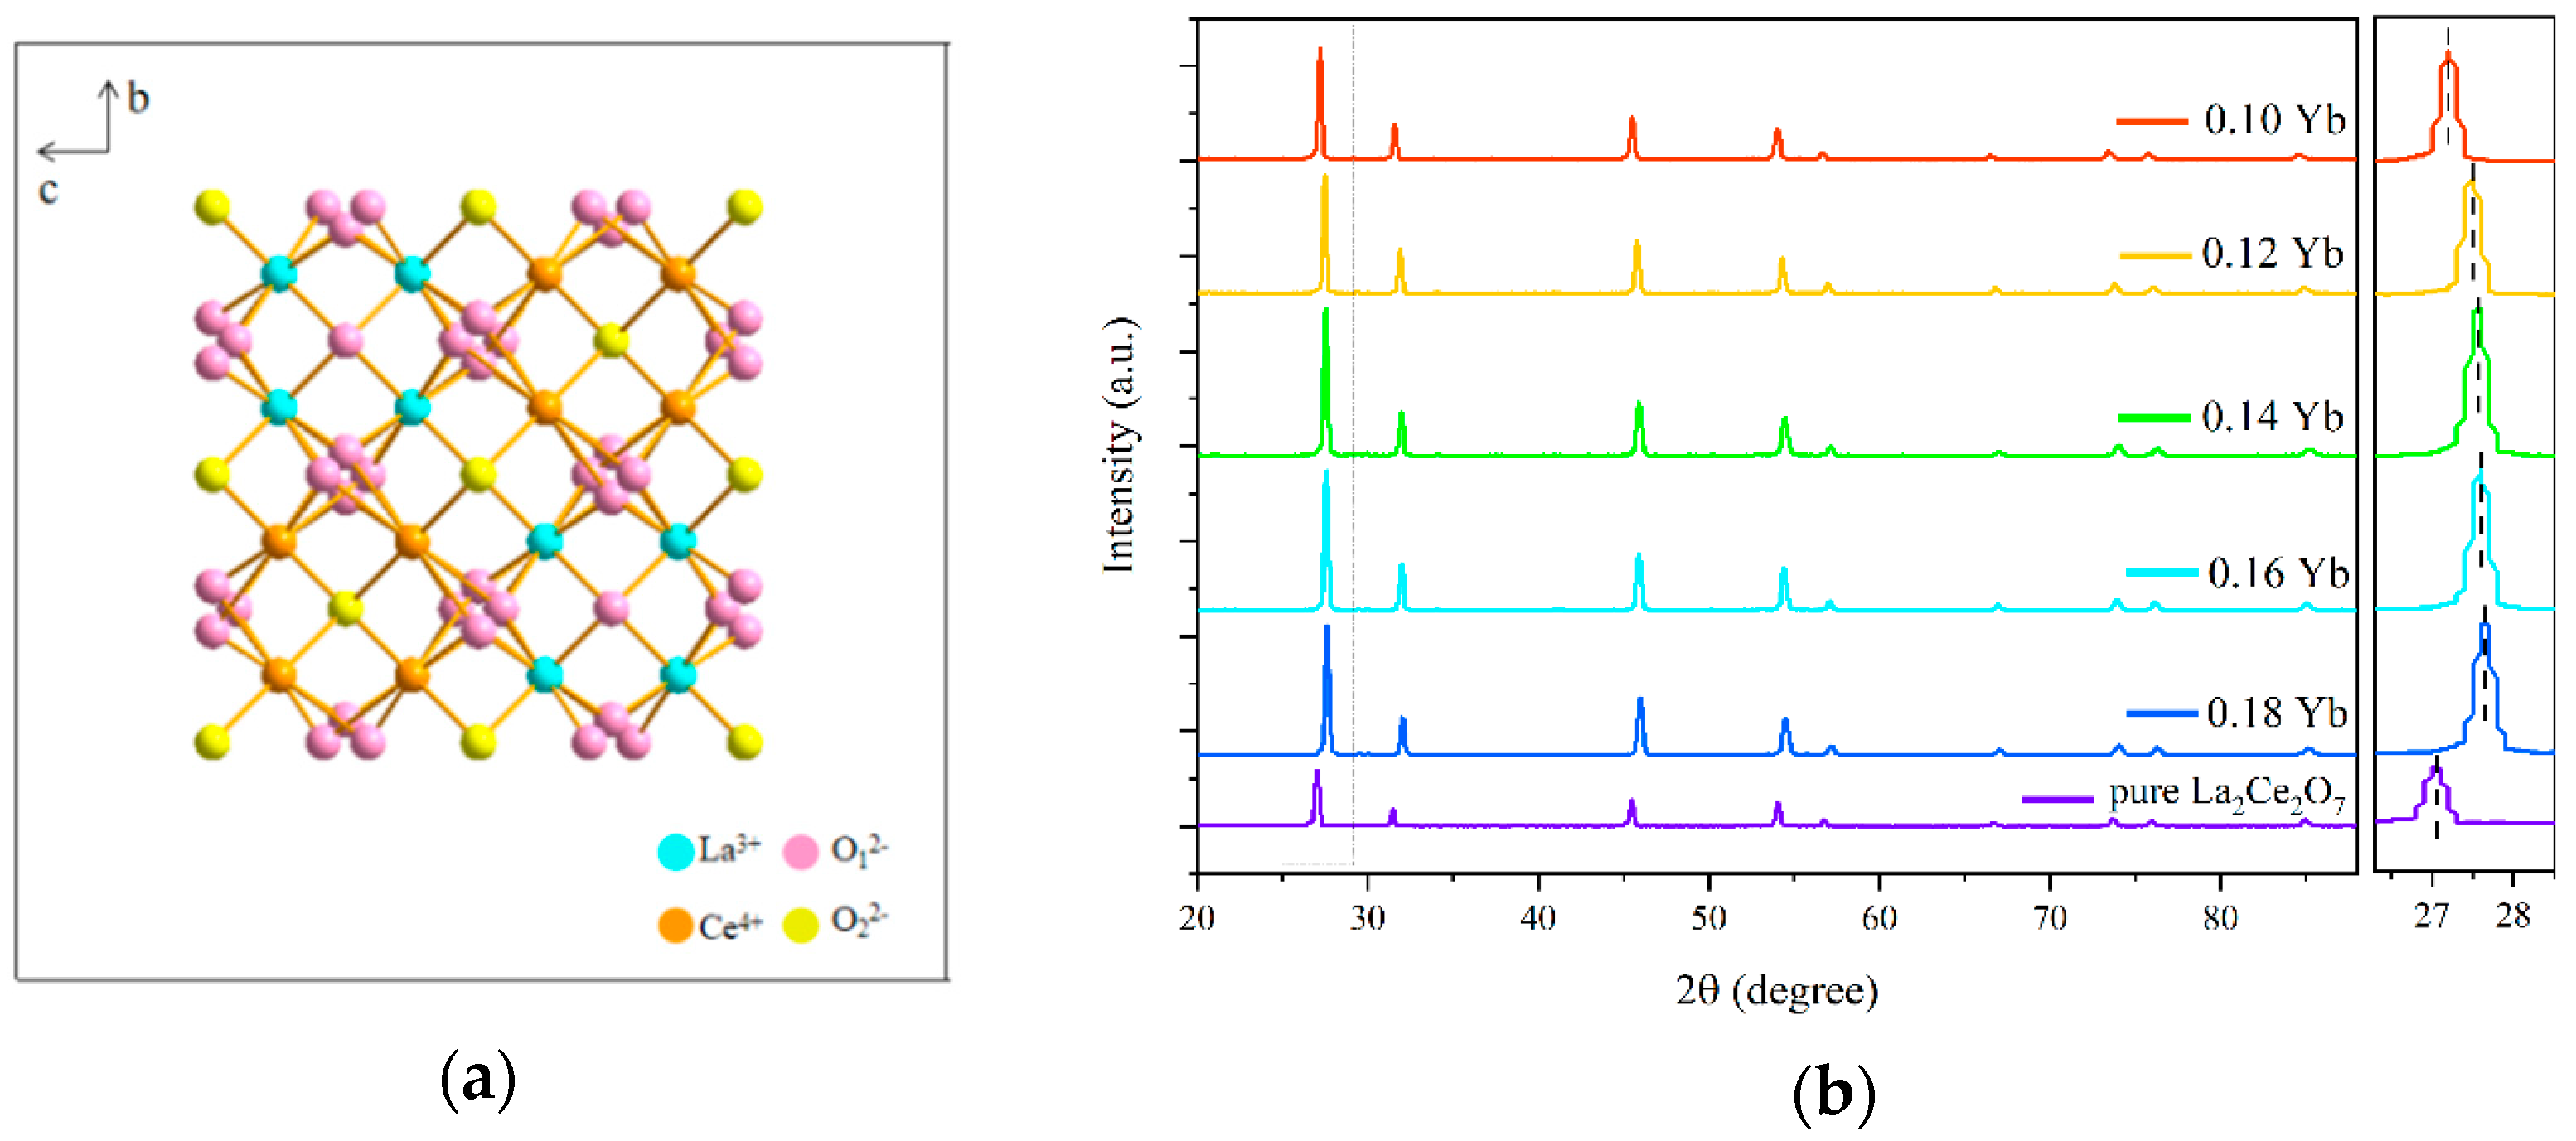
Figure 2.
(a) UC emission spectra of the (Ho0.005YbxLa0.995−x)2Ce2O7 (x = 0.10, 0.12, 0.14, 0.16, and 0.18) powders under the excitation of a 980 nm laser. (b) The UC emission intensity of the (Ho0.005Yb0.14La0.855)2Ce2O7 in a power cycle (increase power and decrease power) varies with different pumping power (200 mW–2140 mW) laser excitation. (c) The pumping power dependence of the UC emission intensity of the (Ho0.005Yb0.14La0.855)2Ce2O7 sample under the excitation of a 980 nm laser. (d) Schematic energy level diagram of Yb3+ and Ho3+ ions and proposed energy transfer routes for the UC emission.

Figure 3.
(a) Temperature-dependent UC emission spectra of the (Ho0.005Yb0.14La0.855)2Ce2O7 powder under the excitation of a 980 nm laser. (b) The green and red UC emission intensity as a function of temperature. (c) Temperature dependence of the UC emission spectra intensity ratio (I661/I547) of 661 nm and 547 nm emissions. (d) Ln (I661/I547) as a function of the inverse absolute temperature.

Figure 4.
(a) Absolute sensitivity of the (Ho0.005Yb0.14La0.855)2Ce2O7 powder at various temperatures. (b) Relative sensitivity of the (Ho0.005Yb0.14La0.855)2Ce2O7 powder at various temperatures. (c) Temperature resolution (δT). (d) Thermal recovery property of the (Ho0.005Yb0.14La0.855)2Ce2O7 powder.


Table 1.
Optical temperature-sensing properties of Ho3+/Yb3+-doped materials.
| Materials | Temperature Range (K) | λex (nm) | Sr (K−1) (Max) | References |
|---|---|---|---|---|
| NaLaMgWO6 | 293–553 | 980 | 0.01079 (508 K) | [2] |
| Ba0.77Ca0.23TiO3 | 93–300 | 980 | 0.0053 (93 K) | [10] |
| Tellurite glass | 303–503 | 975 | 0.011 (503 K) | [24] |
| BaTiO3 | 303–513 | 980 | 0.0034 (303 K) | [25] |
| CaMoO4 | 303–543 | 980 | 0.0066 (353 K) | [26] |
| LiYF4 | 100–500 | 976 | 0.0129 (150 K) | [39] |
| Gd0.74Y0.2TaO4 | 330–660 | 980 | 0.0037 (660 K) | [40] |
| LaOF | 298–548 | 980 | 0.00451 (298 K) | [41] |
| Y2O3 | 303–623 | 980 | 0.0064 (423 K) | [42] |
| (Ho0.005Yb0.14La0.855)2Ce2O7 | 293–428 | 980 | 0.0129 (428 K) | This work |
Disclaimer/Publisher’s Note: The statements, opinions and data contained in all publications are solely those of the individual author(s) and contributor(s) and not of MDPI and/or the editor(s). MDPI and/or the editor(s) disclaim responsibility for any injury to people or property resulting from any ideas, methods, instructions or products referred to in the content. |
© 2024 by the authors. Licensee MDPI, Basel, Switzerland. This article is an open access article distributed under the terms and conditions of the Creative Commons Attribution (CC BY) license (https://creativecommons.org/licenses/by/4.0/).
Share and Cite
MDPI and ACS Style
Chao, J.; Lin, H.; Yu, D.; Hong, R.; Han, Z.; Tao, C.; Zhang, D. Optical Temperature-Sensing Performance of La2Ce2O7:Ho3+ Yb3+ Powders. Materials 2024, 17, 1692. https://doi.org/10.3390/ma17071692
AMA Style
Chao J, Lin H, Yu D, Hong R, Han Z, Tao C, Zhang D. Optical Temperature-Sensing Performance of La2Ce2O7:Ho3+ Yb3+ Powders. Materials. 2024; 17(7):1692. https://doi.org/10.3390/ma17071692
Chicago/Turabian StyleChao, Jiameng, Hui Lin, Dechao Yu, Ruijin Hong, Zhaoxia Han, Chunxian Tao, and Dawei Zhang. 2024. "Optical Temperature-Sensing Performance of La2Ce2O7:Ho3+ Yb3+ Powders" Materials 17, no. 7: 1692. https://doi.org/10.3390/ma17071692
Note that from the first issue of 2016, this journal uses article numbers instead of page numbers. See further details here.