
Biomechanics of the Human Osteochondral Unit: A Systematic Review

 ,
,  , ,
, ,  and
and 
Abstract
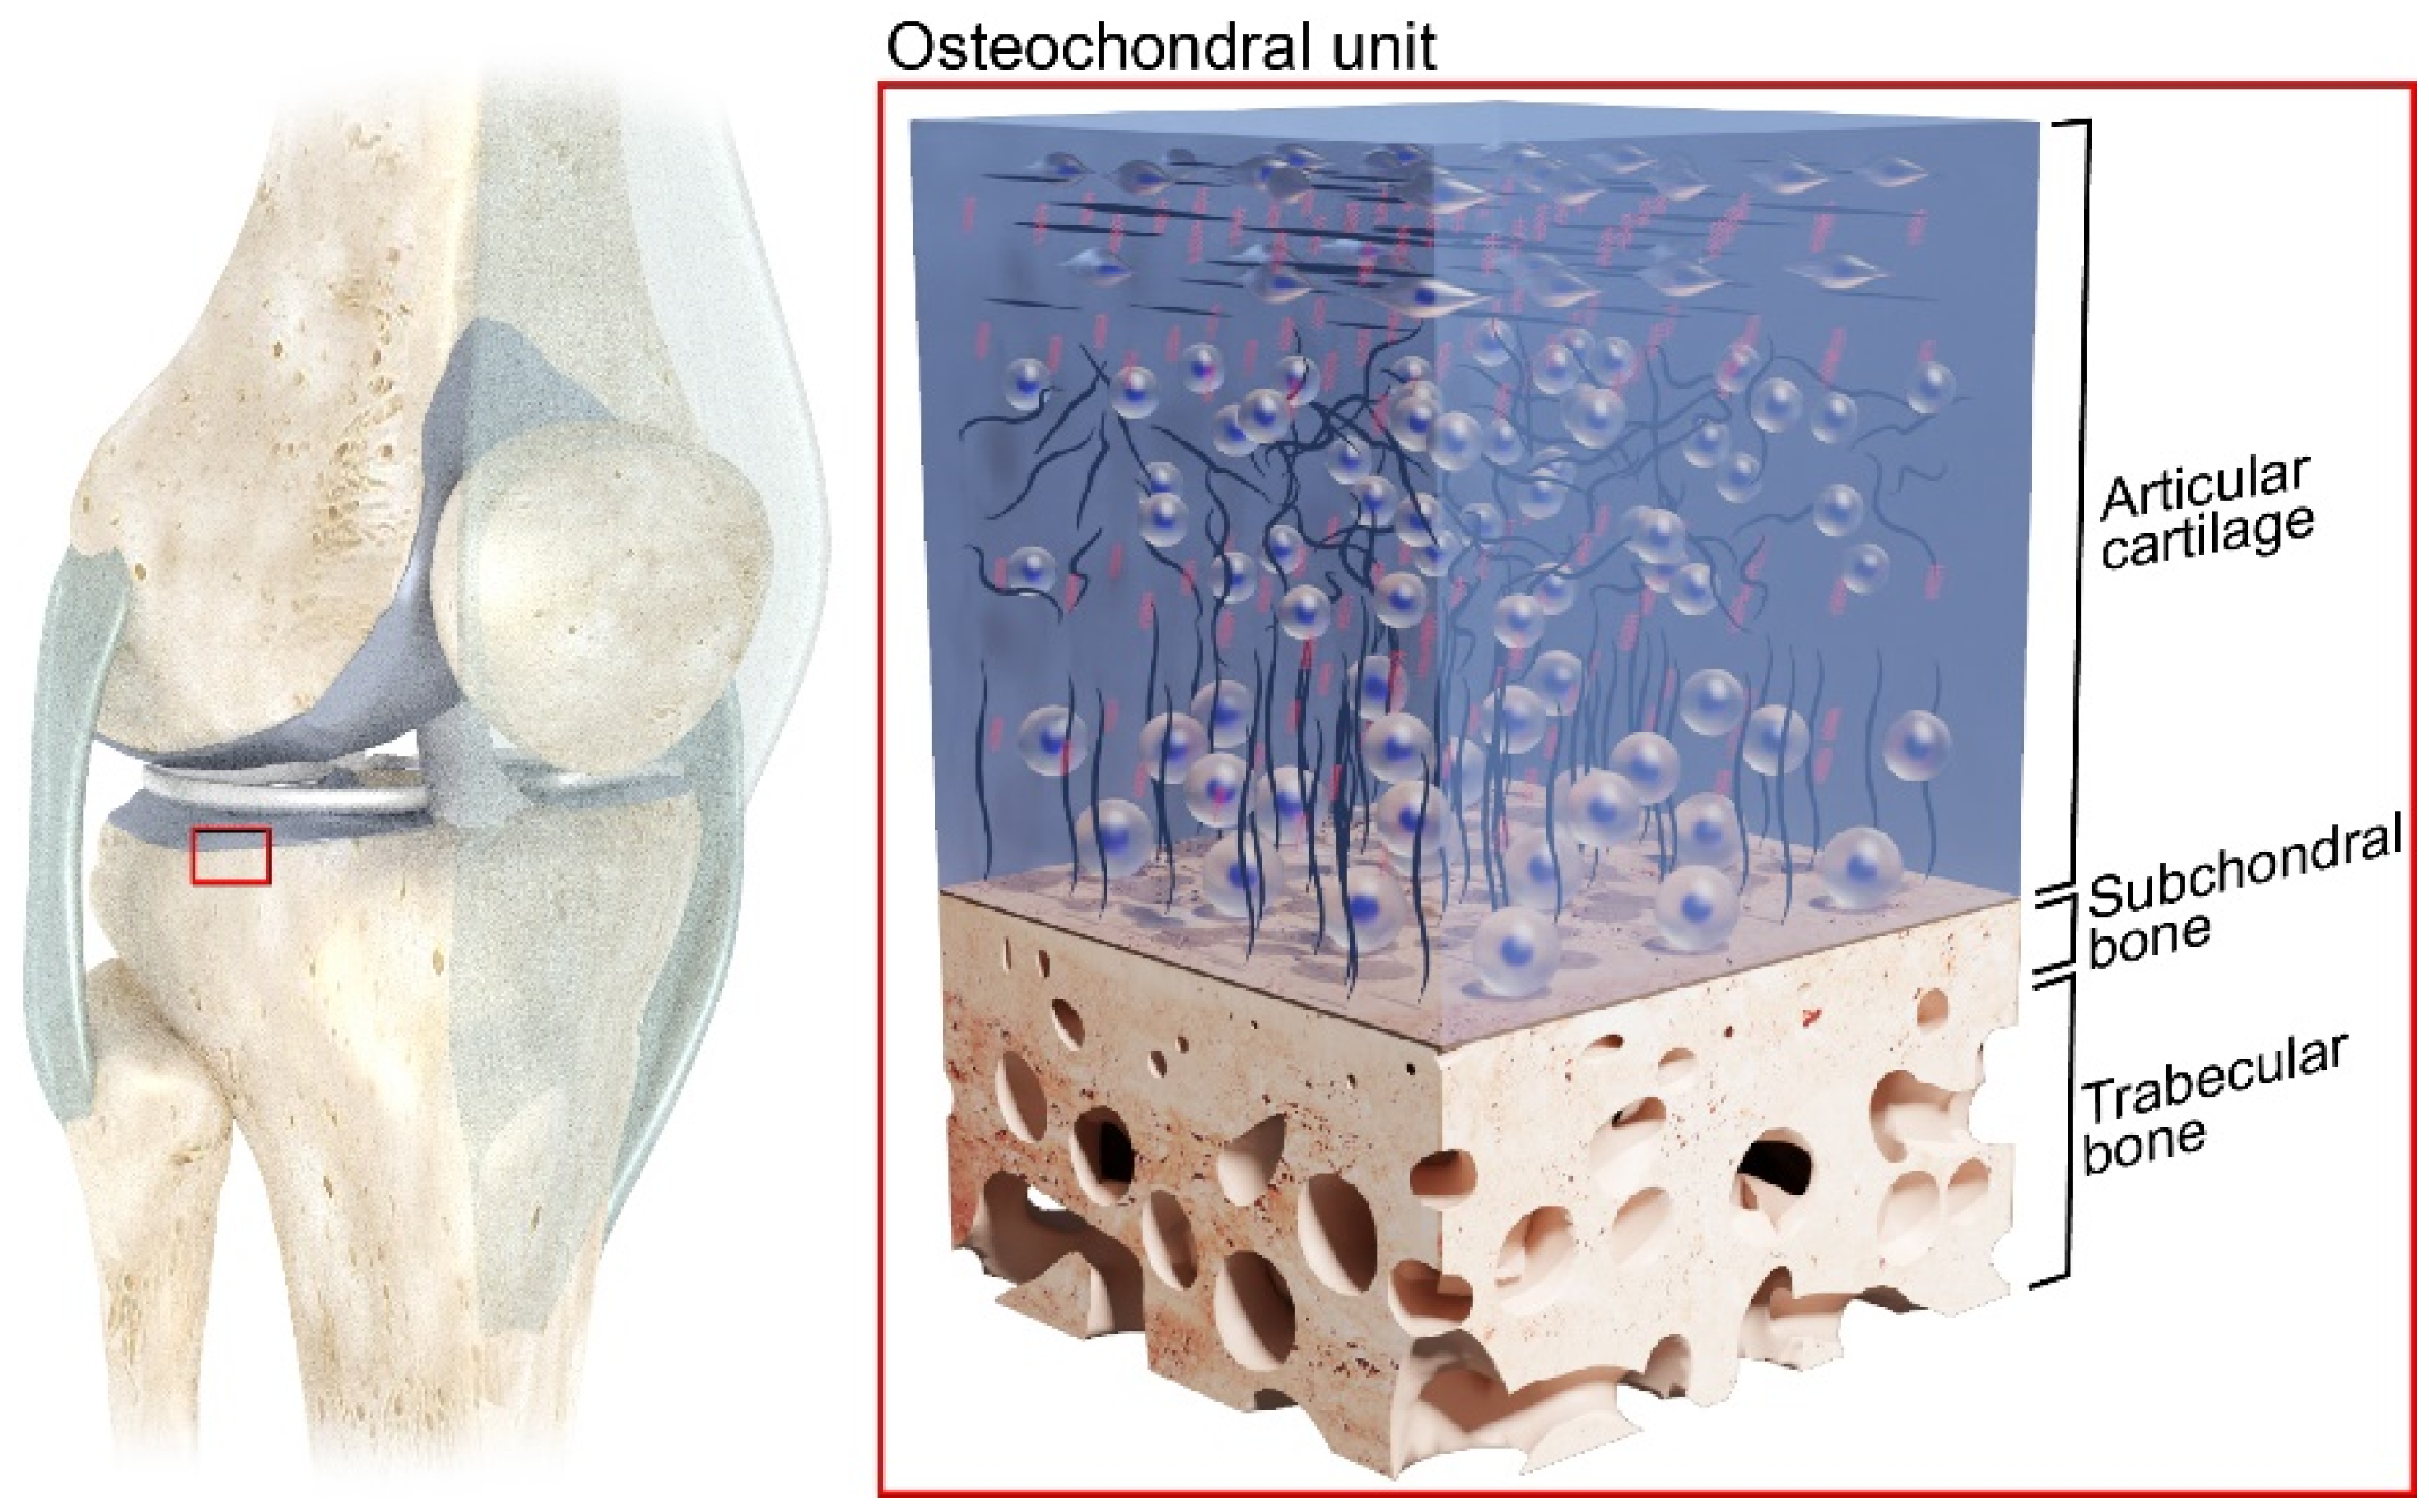
1. Introduction
2. Constitutive Models of the Last Century
3. Methods
3.1. Eligibility Criteria
3.2. Search Strategies
3.3. Study Selection
3.4. Extraction of the Data
3.5. Systematic Assessment of the Scientific Quality of the Studies
4. Results and Discussion
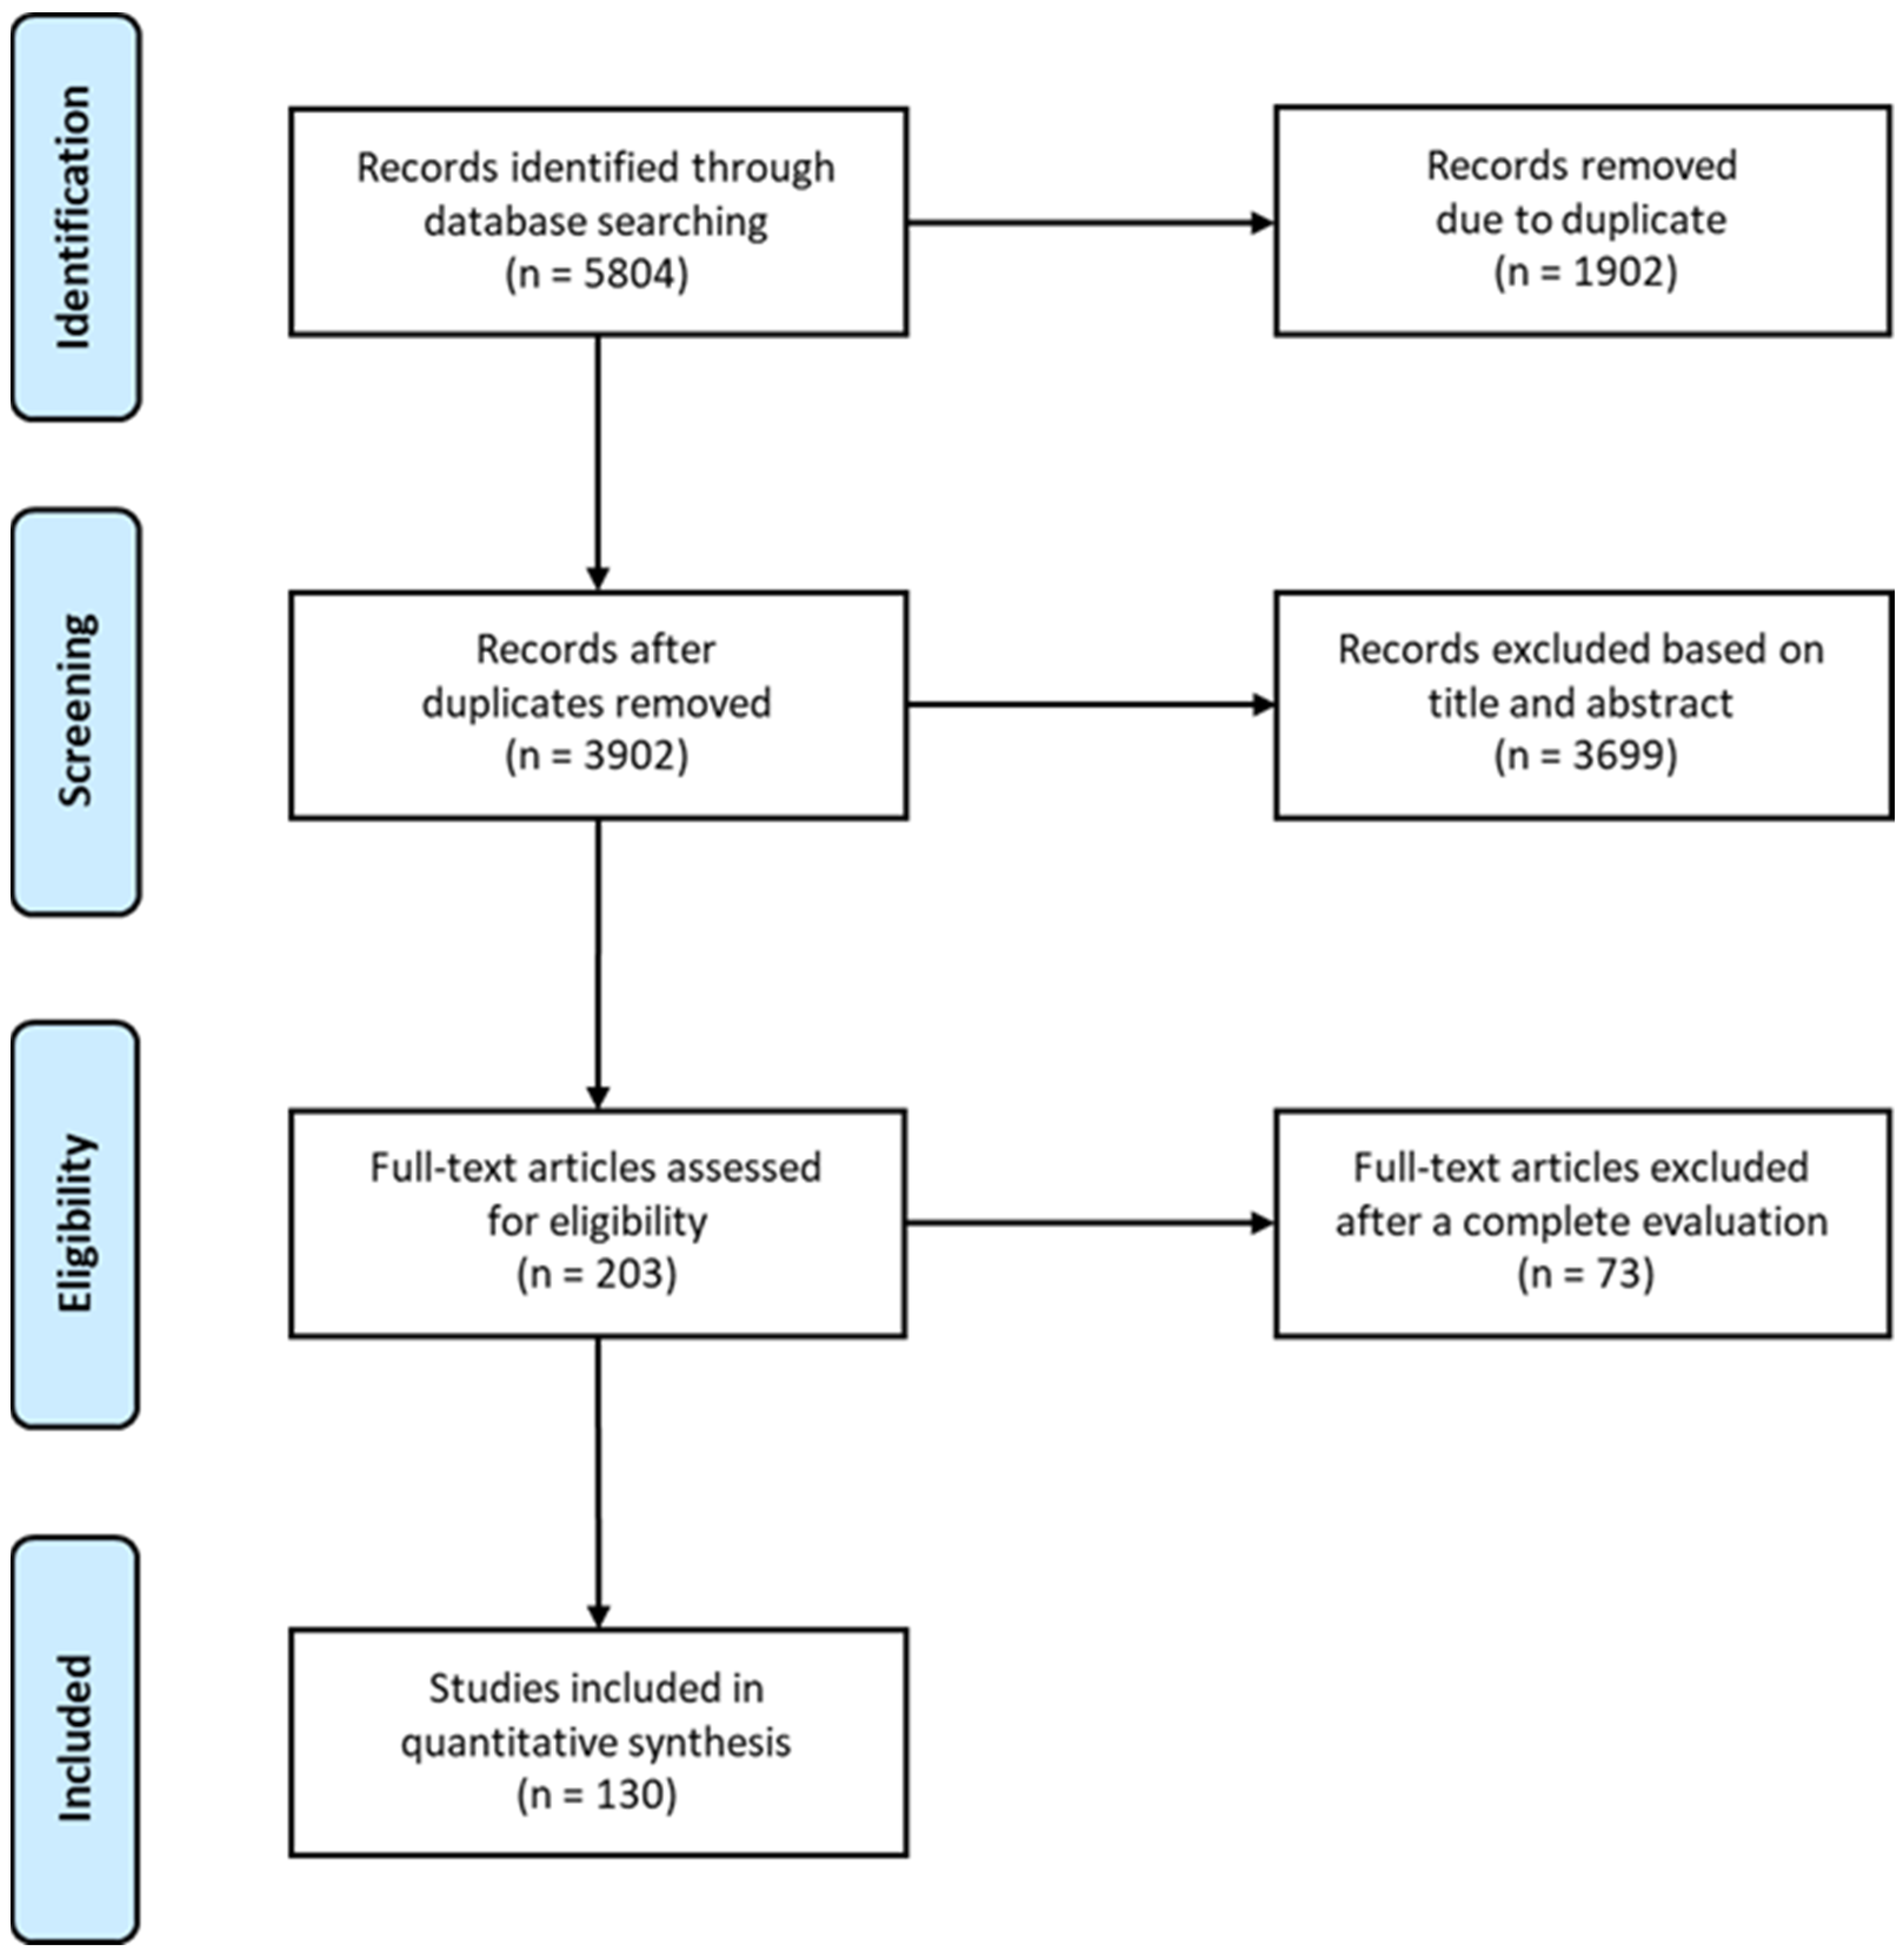
4.1. Selection of the Studies

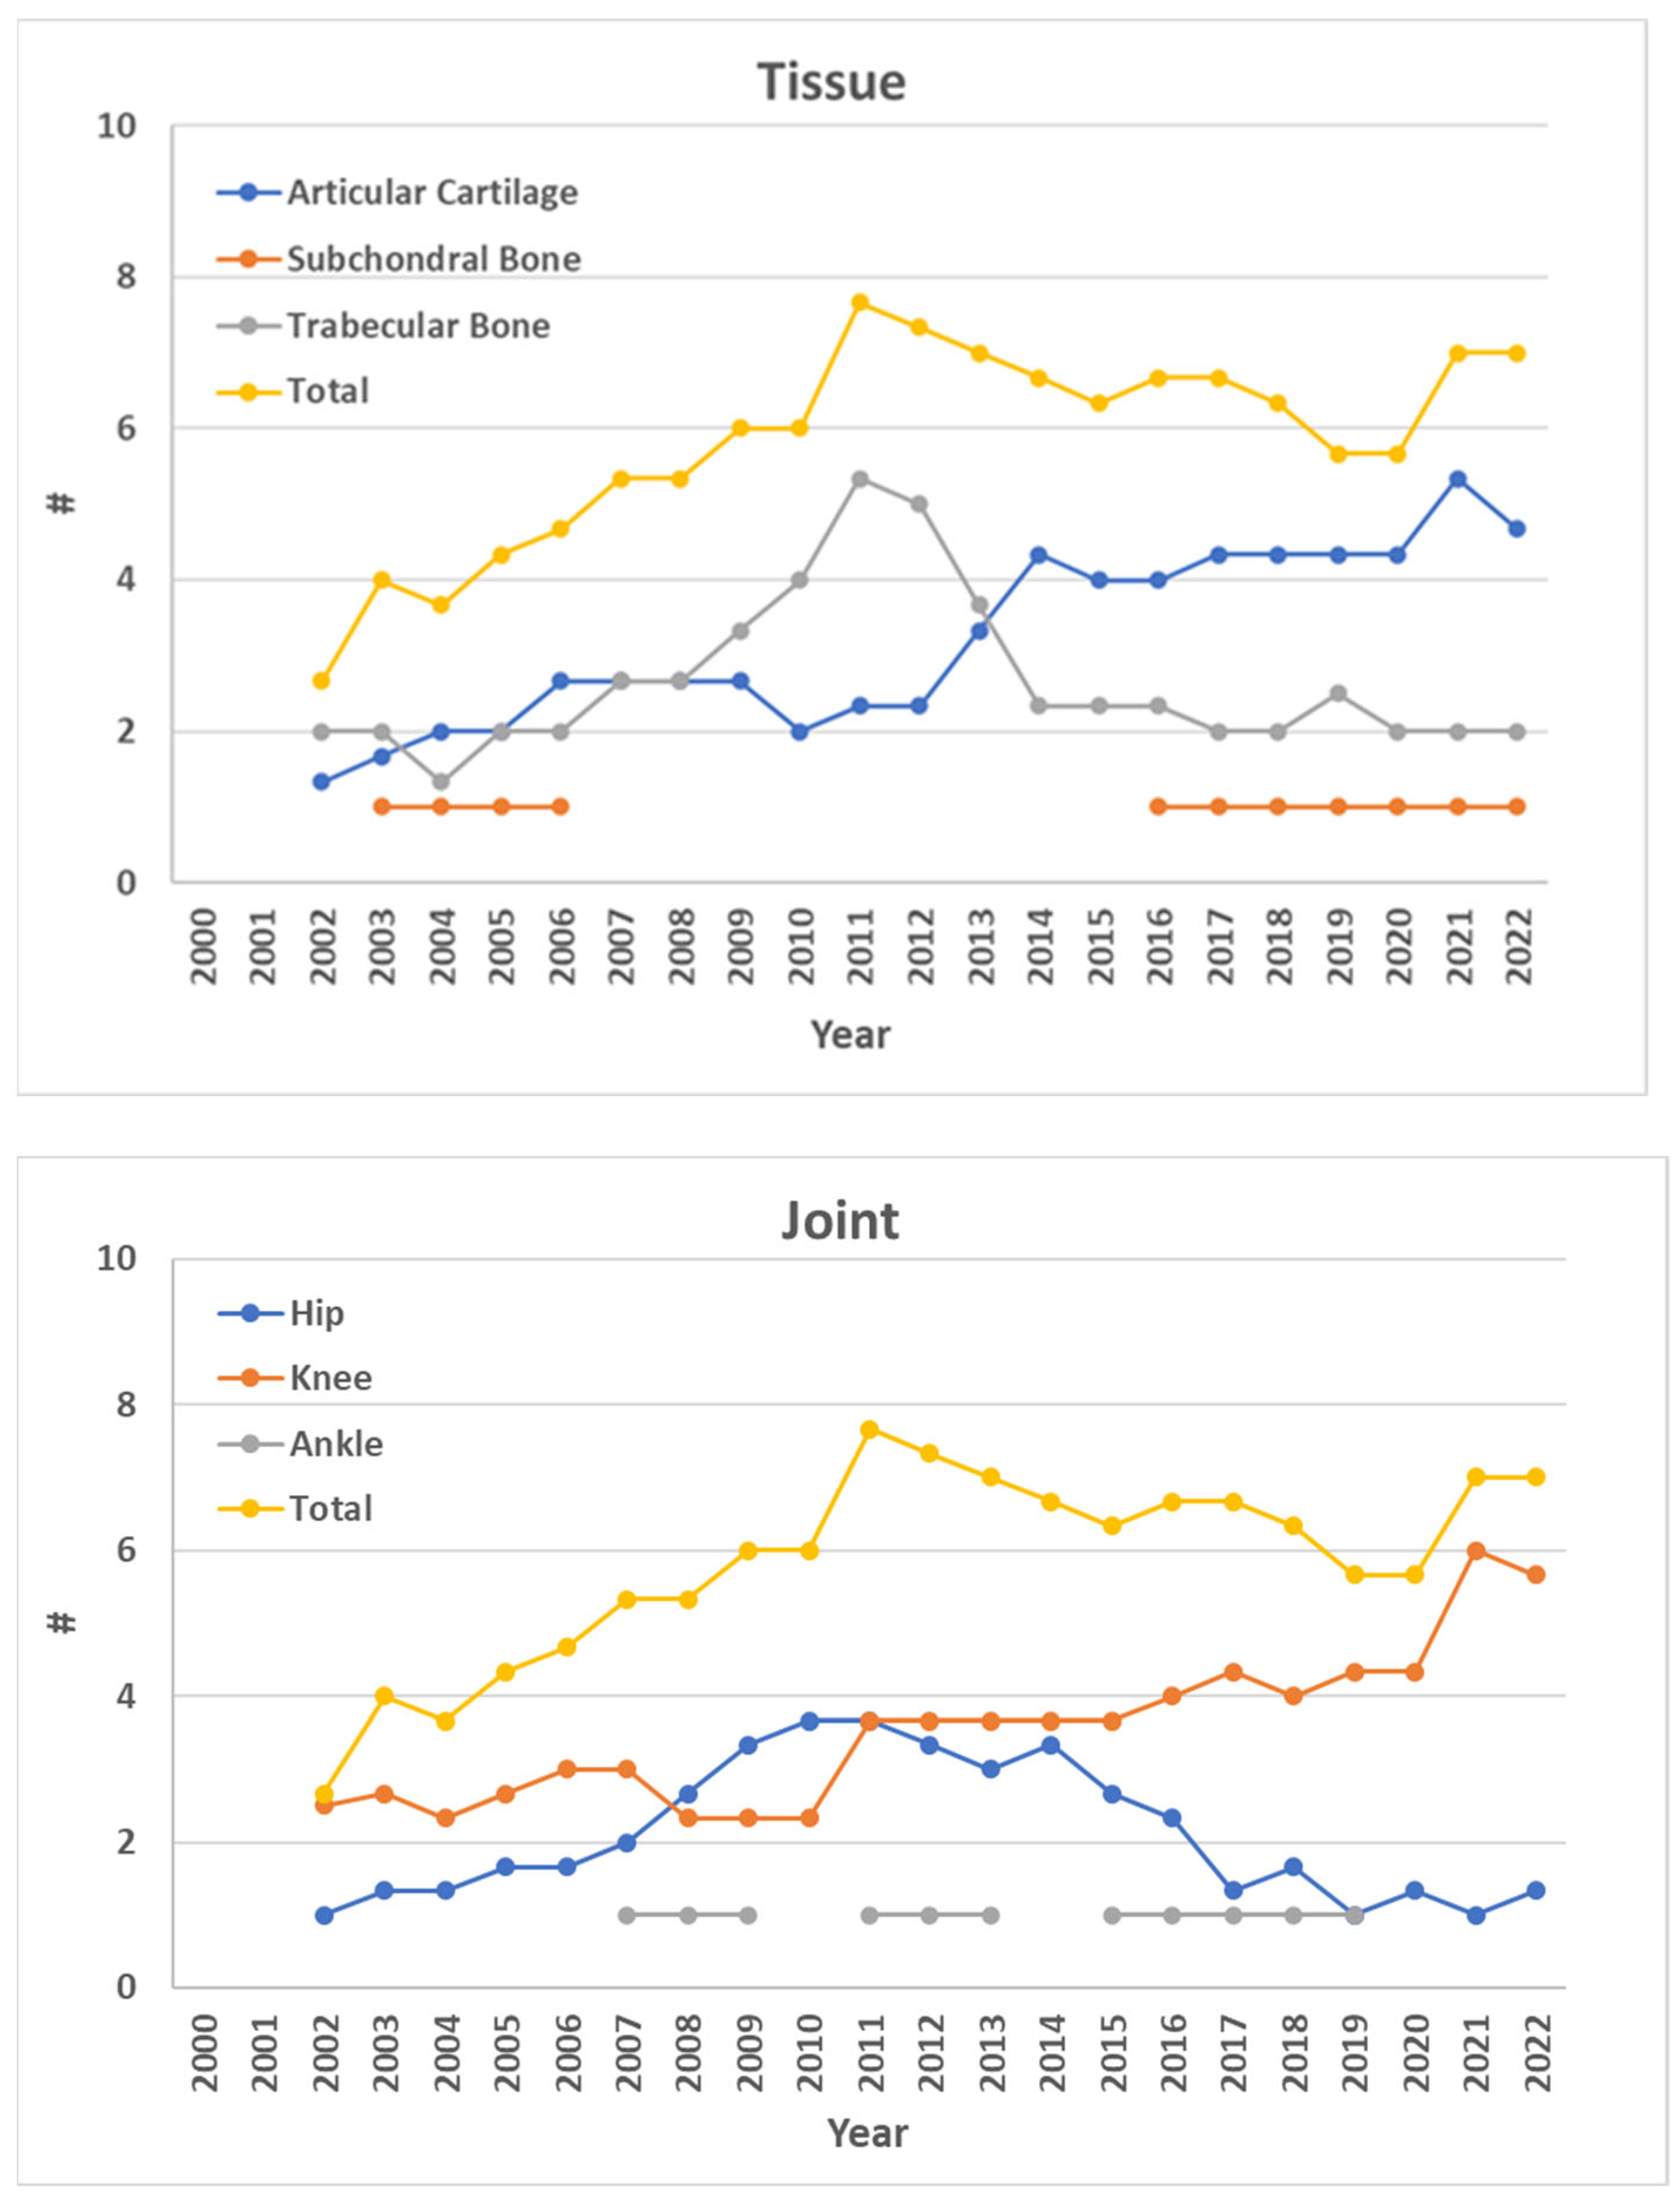
4.2. Trend over Time of Eligible Studies
4.3. Articular Cartilage

| Reference | Type of Study | Pathology | Joint | Anatomical Position | Experimental Technique (Mode) | Dimensional Scale | Model | Stiffness (N/mm) | Elastic or Young’s Modulus, E (MPa) | Shear Modulus (MPa) | Electromechanical Quantitative Parameter | Poisson’s Ratio | Strain | Instantaneous Elastic Modulus E0, (MPa) | Strain-Dependent Instantaneous Elastic Modulus E0, (MPa) | Initial Fibril Network Modulus, Ef (MPa) | Strain-dependent Fibril Network Modulus, Ef (MPa) | Non-Fibrillar Matrix Modulus, Em (MPa) | Equilibrium or Aggregate Modulus, Eeq or HA (MPa) | Condition |
|---|---|---|---|---|---|---|---|---|---|---|---|---|---|---|---|---|---|---|---|---|
| Kurkijärvi et al. [105] | In | None | K | Femoral Condyle; Tibial Plateau; Patella; Trochlear Groove | Compression (stress–relaxation) | mm | LE | - | - | - | - | - | - | - | - | - | - | - | 0.90 ± 0.43 | No disease |
| Jeffrey et al. [98] | In | None | H | Femoral Head | Indentation; Compression | mm | LEI (Hayes) | - | - | - | - | - | 10.3 ± 1.6 (indenter); 64 ± 13 (unconfined compression); 14.4 ± 3.5 (indenter, maximum modulus); 85.1 ± 4.9 (unconfined compression, maximum modulus) | - | - | - | - | - | No disease | |
| Temple et al. [93] | In; Co | Aging | K | Femoral Condyle | Tensile test (stress–relaxation; dynamic mechanical analysis) | mm | LE | - | - | - | - | - | - | - | - | - | 0.1–30.0 (Tensile, low strain rate); 0.1–70 (Tensile, high strain rate) | No disease | ||
| Keenan et al. [110] | In | None | K | Tibial Plateau | Indentation (creep) | mm | B (Mow) | - | - | - | - | 0.00–0.05 | - | - | - | - | - | - | 0.48–1.58 | No disease |
| Wong et al. [103] | In | None | K | Femoral Condyle; Tibial Plateau | Shear Test; Compression (stress–relaxation) | mm, µm (strain) | LE | - | 0.1–0.9 | 0.01–5.00 | - | - | 0.01–0.40 (compressive); 0.01–0.50 (shear) | - | - | - | - | - | - | No disease |
| Deneweth et al. [104] | In | None | K | Tibial Plateau | Compression | mm | LE | - | - | - | - | - | - | 7.0 ± 6.0 * (not covered by menisci); 10.0 ± 8.0 * (covered by menisci, anterior); 22.0 ± 15.0 * (covered by menisci, exterior); 20.0 ± 15.0 * (covered by menisci, posterior) | - | - | - | - | - | No disease |
| Griebel et al. [106] | In; Co | OA | K | Femoral Condyle; Tibial Plateau | Compression | mm | Anisotropic elasticity; depth dependent distribution of strain | - | - | - | - | - | 0.0–0.12 | - | - | - | - | - | - | No disease |
| Mäkelä et al. [111] | In; Co | OA | H | Femoral Head | Indentation (stress–relaxation) | mm | FRPVE | - | - | - | - | - | - | - | - | 0.59 ± 0.48 | 0.61 ± 0.61 | 0.23 ± 0.22 | - | No disease |
| Liukkonen et al. [96] | In; Me | None | K | Femoral Condyle | Indentation (stress–relaxation; dynamic mechanical analysis) | mm | LEI (Hayes) | - | - | - | - | - | - | 0.1–0.4 | - | - | - | - | - | No disease |
| Burgin et al. [102] | In | None | H | Femoral Head | Compression | mm | LE | - | 1.1–3.3 (quasi-static); 0.5–4.98 (0.1 M Pa); 40–120 (impact) | - | - | - | - | - | - | - | - | - | - | No disease |
| Rautiainen et al. [95] | Co | OA | K | Tibial Plateau | Indentation (stress–relaxation; dynamic mechanical analysis) | mm | LE | - | - | - | - | - | - | - | - | - | - | - | 1.2 ± 0.3 | Early OA |
| Rautiainen et al. [95] | Co | OA | K | Tibial Plateau | Indentation (stress–relaxation; dynamic mechanical analysis) | mm | LE | - | - | - | - | - | - | - | - | - | - | - | 0.2 ± 0.3 | Advanced OA |
| Sim et al. [112] | In; Co | OA | K | Femoral Condyle; Trochlear Groove | Indentation; Compression (stress–relaxation) | mm | FRPVE | - | - | - | - | - | - | 0.1–38 * | 0.1–2.2 * | - | No disease | |||
| Afara et al. [94] | In | None | K | Femoral Condyle; Tibial Plateau; Trochlear Groove | Indentation (stress–relaxation; dynamic mechanical analysis) | mm | LE | - | - | - | - | - | - | - | - | - | - | - | 0.9 ± 0.4 (0.15–2.14) | No disease |
| Waldstein et al. [20] | Co | OA | K | Femoral Condyle; Tibial Plateau; Patella; Trochlear Groove | Indentation (creep) | mm | B | - | 1.0–17.0 * | - | - | - | - | - | - | - | - | - | 0.4–2.4 * | OARSI grade 0 |
| Waldstein et al. [20] | Co | OA | K | Femoral Condyle; Tibial Plateau; Patella; Trochlear Groove | Indentation (creep) | mm | B | - | 1.5–8.0 * | - | - | - | - | - | - | - | - | - | 0.3–1.5 * | OARSI grade 1 |
| Waldstein et al. [20] | Co | OA | K | Femoral Condyle; Tibial Plateau; Patella; Trochlear Groove | Indentation (creep) | mm | B | - | 0.5–9.5 * | - | - | - | - | - | - | - | - | - | 0.2–1.3 * | OARSI grade 2 |
| Waldstein et al. [20] | Co | OA | K | Femoral Condyle; Tibial Plateau; Patella; Trochlear Groove | Indentation (creep) | mm | B | - | 1.0–7.5 * | - | - | - | - | - | - | - | - | - | 0.3–1.4 * | OARSI grade 3 |
| Waldstein et al. [20] | Co | OA | K | Femoral Condyle; Tibial Plateau; Patella; Trochlear Groove | Indentation (creep) | mm | B | - | 1.0–4.5 * | - | - | - | - | - | - | - | - | - | 0.3–1.2 * | OARSI grade 4 |
| Waldstein et al. [20] | Co | OA | K | Femoral Condyle; Tibial Plateau; Patella; Trochlear Groove | Indentation (creep) | mm | B | - | 1.0–2.0 * | - | - | - | - | - | - | - | - | - | 0.2–1.0 * | OARSI grade 5 |
| Nebelung et al. [99] | In | None | K | Femoral Condyle | Compression | mm | LE | - | 0.419 ± 0.143 | - | - | - | - | - | - | - | - | - | - | No disease |
| Sim et al. [92] | Co | OA | K | Femoral Condyle; Tibial Plateau | Indentation; Compression (stress–relaxation) | mm | LEI (Hayes); FRPVE | - | - | - | - | - | - | 2.0 ± 1.0 * | 8.5 ± 3.0 * | - | 1.2 ± 0.1 * | - | Abnormal cartilage (ICRS grade > 0) | |
| Sim et al. [92] | Co | OA | K | Femoral Condyle; Tibial Plateau | Indentation; Compression (stress–relaxation) | mm | LEI (Hayes); FRPVE | - | - | - | - | - | - | 4.5 ± 1.0 * | 13.0 ± 2.0 * | - | 1.3 ± 0.2 * | - | Area surrounding abnormal cartilage | |
| Sim et al. [92] | Co | OA | K | Femoral Condyle; Tibial Plateau | Indentation; Compression (stress–relaxation) | mm | LEI (Hayes); FRPVE | - | - | - | - | - | - | 7.0 ± 1.0 * | 18.5 ± 2.0 * | - | 1.1 ± 0.2 * | - | Remaining normal articular cartilage (ICRS grade 0) | |
| Sim et al. [97] | Co | OA | K | Femoral Condyle; Tibial Plateau; Patella | Indentation (electromechanical probe) | mm | LE | - | - | - | 0.1 ± 0.5 * | - | - | - | - | - | - | - | - | ICRS grade 0 |
| Sim et al. [97] | Co | OA | K | Femoral Condyle; Tibial Plateau; Patella | Indentation (electromechanical probe) | mm | LE | - | - | - | 1.5 ± 0.6 * | - | - | - | - | - | - | - | - | ICRS grade 1 |
| Sim et al. [97] | Co | OA | K | Femoral Condyle; Tibial Plateau; Patella | Indentation (electromechanical probe) | mm | LE | - | - | - | 2.5 ± 0.6 * | - | - | - | - | - | - | - | - | ICRS grade 2 |
| Sim et al. [97] | Co | OA | K | Femoral Condyle; Tibial Plateau; Patella | Indentation (electromechanical probe) | mm | LE | - | - | - | 3.2 ± 0.5 * | - | - | - | - | - | - | - | - | ICRS grade 3 |
| Sim et al. [97] | Co | OA | K | Femoral Condyle; Tibial Plateau; Patella | Indentation (electromechanical probe) | mm | LE | - | - | - | 4.0 * | - | - | - | - | - | - | - | - | ICRS grade 4 |
| Nebelung et al. [100] | In | OA (but macroscopically intact samples) | K | Femoral Condyle; Tibial Plateau | Compression | mm | LE | - | 0.69 ± 0.40 (range, 0.20–1.69) | - | - | - | - | - | - | - | - | - | - | OA |
| Ebrahimi et al. [89] | Co | OA | K | Tibial Plateau | Indentation (stress–relaxation; dynamic mechanical analysis) | mm | LEI (Hayes); FRPVE | - | - | - | - | - | - | 6.44 ± 4.85 | 56.09 ± 33.22 | 0.41 ± 0.37 | 15.42 ± 12.34 | 0.35 ± 0.28 | 1.19 ± 0.56 | OARSI 0-1 |
| Ebrahimi et al. [89] | Co | OA | K | Tibial Plateau | Indentation (stress–relaxation; dynamic mechanical analysis) | mm | LEI (Hayes); FRPVE | - | - | - | - | - | - | 0.42 ± 1.34 | 50.05 ± 28.01 | 0.07 ± 0.17 | 18.29 ± 13.89 | 0.10 ± 0.05 | 0.42 ± 0.25 | OARSI 2-3 |
| Ebrahimi et al. [89] | Co | OA | K | Tibial Plateau | Indentation (stress–relaxation; dynamic mechanical analysis) | mm | LEI (Hayes); FRPVE | - | - | - | - | - | - | 0.00 ± 0.76 | 21.68 ± 14.12 | 0.002 ± 0.07 | 7.65 ± 6.00 | 0.05 ± 0.04 | 0.21 ± 0.15 | OARSI 4 |
| Chokhandre et al. [107] | In; Me | None | K | Femoral Condyle; Tibial Plateau; Patella; Trochlear Groove | Tensile, Compression, and Confined compression (stress–relaxation) | mm | LE (Strain-dependent) | - | - | - | - | - | - | 0.1–70.0 (Tensile); 0.1–8.0 (Confined Compression); 0.1–6.0 (Unconfined Compression) | - | - | 0.1–60.0 (Tensile); 0.1–0.7 (Confined Compression); 0.1–0.8 (Unconfined Compression) | No disease | ||
| Ebrahimi et al. [91] | Co | OA | K | Tibial Plateau | Indentation (stress–relaxation; dynamic mechanical analysis) | mm | LEI (Hayes); FRPVE; Dynamic | - | - | - | - | - | - | 0.1–12.0 * | 0.01–0.9 * | 0.15–0.80 * | 0.65–2.1 * | OARSI 0-1 | ||
| Ebrahimi et al. [91] | Co | OA | K | Tibial Plateau | Indentation (stress–relaxation; dynamic mechanical analysis) | mm | LEI (Hayes); FRPVE; Dynamic | - | - | - | - | - | - | 0.1–3.0 * | 0.01–0.35 * | 0.10–0.20 * | 0.20–0.80 * | OARSI 2-3 | ||
| Ebrahimi et al. [91] | Co | OA | K | Tibial Plateau | Indentation (stress–relaxation; dynamic mechanical analysis) | mm | LEI (Hayes); FRPVE; Dynamic | - | - | - | - | - | - | 0.1–2.0 * | 0.01–0.10 * | 0.01–0.15 * | 0.10–0.50 * | OARSI 4 | ||
| Berni et al. [90] | Me | None | K | Tibial Plateau | Indentation | mm | LEI (Hayes) | - | - | - | - | - | - | 2.26–25.43 | - | - | - | - | - | No disease |
| Reference | Type of Study | Pathology | Joint | Anatomical Position | Experimental Technique (mode) | Dimensional Scale | Model | Instantaneous Elastic Modulus E0, (MPa) | Strain-Dependent Instantaneous Elastic Modulus E0, (MPa) | Initial Fibril Network Modulus, Ef (MPa) | Strain-Dependent Fibril Network Modulus, Ef (MPa) | Non-Fibrillar Matrix Modulus, Em (MPa) | Equilibrium or Aggregate Modulus, Eeq or HA (MPa) | Initial Permeability, k (m4/N s) | Permeability Strain-Dependency Coefficient, M | Condition |
|---|---|---|---|---|---|---|---|---|---|---|---|---|---|---|---|---|
| Keenan et al. [110] | In | None | K | Tibial Plateau | Indentation (creep) | mm | B (Mow) | - | - | - | - | - | 0.48–1.58 | (1.7–5.4) × 10−15 | - | No disease |
| Mäkelä et al. [111] | In; Co | OA | H | Femoral Head | Indentation (stress–relaxation) | mm | FRPVE | - | - | 0.59 ± 0.48 | 0.61 ± 0.61 | 0.23 ± 0.22 | - | (3.66 ± 2.86) × 10−15 | 17.26 ± 14.64 | OA |
| Sim et al. [112] | In; Co | OA | K | Femoral Condyle; Trochlear Groove | Indentation; Compression (stress–relaxation) | mm | FRPVE | - | - | 0.1–38 | - | 0.1–2.2 | - | (0.0001–3) × 10−12 | - | OA |
| Sim et al. [92] | Co | OA | K | Femoral Condyle; Tibial Plateau | Indentation; Compression (stress–relaxation) | mm | LEI (Hayes); FRPVE | 2.0 ± 1.0 * | - | 8.5 ± 3.0 * | - | 1.2 ± 0.1 * | - | Trend across different regions | - | Abnormal cartilage (ICRS grade > 0) |
| Sim et al. [92] | Co | OA | K | Femoral Condyle; Tibial Plateau | Indentation; Compression (stress–relaxation) | mm | LEI (Hayes); FRPVE | 4.5 ± 1.0 * | - | 13.0 ± 2.0 * | - | 1.3 ± 0.2 * | - | Trend across different regions | - | Area surrounding abnormal cartilage |
| Sim et al. [92] | Co | OA | K | Femoral Condyle; Tibial Plateau | Indentation; Compression (stress–relaxation) | mm | LEI (Hayes); FRPVE | 7.0 ± 1.0 * | - | 18.5 ± 2.0 * | - | 1.1 ± 0.2 * | - | Trend across different regions | - | Remaining normal articular cartilage (ICRS grade 0) |
| Ebrahimi et al. [89] | Co | OA | K | Tibial Plateau | Indentation (stress–relaxation; dynamic mechanical analysis) | mm | LEI (Hayes); FRPVE | 6.44 ± 4.85 | 56.09 ± 33.22 | 0.41 ± 0.37 | 15.42 ± 12.34 | 0.35 ± 0.28 | 1.19 ± 0.56 | (1.19 ± 0.33) × 10−15 | 3.36 ± 2.07 | OARSI 0-1 |
| Ebrahimi et al. [89] | Co | OA | K | Tibial Plateau | Indentation (stress–relaxation; dynamic mechanical analysis) | mm | LEI (Hayes); FRPVE | 0.42 ± 1.34 | 50.05 ± 28.01 | 0.07 ± 0.17 | 18.29 ± 13.89 | 0.10 ± 0.05 | 0.42 ± 0.25 | (15.94 ± 47.45) × 10−15 | 4.19 ± 3.78 | OARSI 2-3 |
| Ebrahimi et al. [89] | Co | OA | K | Tibial Plateau | Indentation (stress–relaxation; dynamic mechanical analysis) | mm | LEI (Hayes); FRPVE | 0.00 ± 0.76 | 21.68 ± 14.12 | 0.002 ± 0.07 | 7.65 ± 6.00 | 0.05 ± 0.04 | 0.21 ± 0.15 | (20.88 ± 20.34) × 10−15 | 3.52 ± 4.45 | OARSI 4 |
| Ebrahimi et al. [91] | Co | OA | K | Tibial Plateau | Indentation (stress–relaxation; dynamic mechanical analysis) | mm | LEI (Hayes); FRPVE | 0.1–12.0 * | - | 0.01–0.9 * | - | 0.15–0.80 * | 0.65–2.1 * | Only significant correlations with the components of the tissue are reported | Only significant correlations with the components of the tissue are reported | OARSI 0-1 |
| Ebrahimi et al. [91] | Co | OA | K | Tibial Plateau | Indentation (stress–relaxation; dynamic mechanical analysis) | mm | LEI (Hayes); FRPVE | 0.1–3.0 * | - | 0.01–0.35 * | - | 0.10–0.20 * | 0.20–0.80 * | Only significant correlations with the components of the tissue are reported | Only significant correlations with the components of the tissue are reported | OARSI 2-3 |
| Ebrahimi et al. [91] | Co | OA | K | Tibial Plateau | Indentation (stress–relaxation; dynamic mechanical analysis) | mm | LEI (Hayes); FRPVE | 0.1–2.0 * | - | 0.01–0.10 * | - | 0.01–0.15 * | 0.10–0.50 * | Only significant correlations with the components of the tissue are reported | Only significant correlations with the components of the tissue are reported | OARSI 4 |
| Reference | Type of Study | Pathology | Joint | Anatomical Position | Experimental Technique (Mode) | Dimensional Scale | Model | Shear Modulus (MPa) | C10 Constant (MPa) | C20 Constant (MPa) | C1 Veronda Westmann (MPa) | C1 Veronda Westmann (a.u.) | Condition |
|---|---|---|---|---|---|---|---|---|---|---|---|---|---|
| Henak et al. [114] | In | None | H | Femoral Head; Acetabulum | Compression | mm | HE (neo-Hookean; Veronda Westmann) | 5.32 ± 2.32 | - | - | 0.34 ± 0.24 | 6.55 ± 2.07 | No disease |
| Robinson et al. [113] | Co | OA | K | Femoral Condyle; Tibial Plateau | Compression | mm | HE (neo-Hookean; Yeoh) | 6.0 ± 1.6 | 1.7 ± 0.8 | 3.9 ± 3.4 | - | - | No disease |
| Robinson et al. [113] | Co | OA | K | Femoral Condyle; Tibial Plateau | Compression | mm | HE (neo-Hookean; Yeoh) | 4.6 ± 1.8 | 1.1 ± 0.8 | 2.0 ± 1.5 | - | - | OA |
| Khajehsaeid et al. [115] | Co | OA | K | Femoral Condyle | Tensile | mm | HE (Gent) | Only normalised values were reported | - | - | - | - | OA |
| Reference | Type of Study | Pathology | Joint | Anatomical Position | Experimental Technique (Mode) | Dimensional Scale | Model | Creep (mm) | Creep Rate | Viscosity Coefficient, η (MPas) | Condition |
|---|---|---|---|---|---|---|---|---|---|---|---|
| Barker et al. [120] | In | None | K | Femoral Condyle; Tibial Plateau | Indentation (stress–relaxation; dynamic mechanical analysis) | mm | VE | - | 257–1352 * | - | No disease |
| Thambyah et al. [119] | In | None | k | Tibial Plateau | Indentation (creep) | mm | VE (model only for the elastic behaviour, i.e., LEI, Hayes) | 0.05–0.23 | - | - | No disease |
| Richard et al. [121] | Co; Mo | OA | H | Femoral Head | Indentation | mm | VE | - | - | 218.7 ± 150.6 | No disease |
| Richard et al. [121] | Co; Mo | OA | H | Femoral Head | Indentation | mm | VE | - | - | 36.0 ± 41.4 | OA |
| Reference | Type of Study | Pathology | Joint | Anatomical Position | Experimental Technique (Mode) | Dimensional Scale | Model | Strength (MPa) | Energy of Deformation (mJ) | Condition |
|---|---|---|---|---|---|---|---|---|---|---|
| Temple et al. [93] | In; Co | Aging | K | Femoral Condyle | Tensile test (stress–relaxation; dynamic mechanical analysis) | mm | P | 0.1–21 * (Tensile) | - | Alteration induced by the age |
| Burgin et al. [102] | In | None | H | Femoral Head | Compression | mm | P | - | 75.5 ± 1.8 | No disease |
| Reference | Type of Study | Pathology | Joint | Anatomical Position | Experimental Technique (Mode) | Dimensional Scale | Model | Shear Storage Modulus, G′ (MPa) | Loss Modulus, G″ (MPa) | Dynamic Modulus, Edyn (MPa) | Condition |
|---|---|---|---|---|---|---|---|---|---|---|---|
| Kurkijärvi et al. [105] | In | None | K | Femoral Condyle; Tibial Plateau; Patella; Trochlear Groove | Compression (stress–relaxation) | mm | D | - | - | 7.83 ± 3.59 | No disease |
| Liukkonen et al. [96] | In; Me | None | K | Femoral Condyle | Indentation (stress–relaxation; dynamic mechanical analysis) | mm | D | - | - | 0.1–10 * | No disease |
| Rautiainen et al. [95] | Co | OA | K | Tibial Plateau | Indentation (stress–relaxation; dynamic mechanical analysis) | mm | D | - | - | 6.8 ± 1.7 | Early OA |
| Rautiainen et al. [95] | Co | OA | K | Tibial Plateau | Indentation (stress–relaxation; dynamic mechanical analysis) | mm | D | - | - | 1.9 ± 2.3 | Advanced OA |
| Afara et al. [94] | In | None | K | Femoral Condyle; Tibial Plateau; Trochlear Groove | Indentation (stress–relaxation; dynamic mechanical analysis) | mm | D | - | - | 8.0 ± 3.5 (0.80—15.13) | No disease |
| Temple et al. [122] | In | None | H | Femoral Head | Compression (Dynamic Mechanical Analysis) | mm | D | A = 2.5 ± 0.6 MPa and B = 50.1 ± 12.5 MPa | 4.8 ± 1.0 (range, 3.0–7.2) | - | No disease |
| Ebrahimi et al. [89] | Co | OA | K | Tibial Plateau | Indentation (stress–relaxation; dynamic mechanical analysis) | mm | D | - | - | 6.87 ± 2.57 | OARSI 0-1 |
| Ebrahimi et al. [89] | Co | OA | K | Tibial Plateau | Indentation (stress–relaxation; dynamic mechanical analysis) | mm | D | - | - | 3.69 ± 2.07 | OARSI 2-3 |
| Ebrahimi et al. [89] | Co | OA | K | Tibial Plateau | Indentation (stress–relaxation; dynamic mechanical analysis) | mm | D | - | - | 1.67 ± 1.08 | OARSI 4 |
| Ebrahimi et al. [91] | Co | OA | K | Tibial Plateau | Indentation (stress–relaxation; dynamic mechanical analysis) | mm | D | - | - | Only the correlation coefficients with structure and composition of AC are reported | OARSI 0-1 |
| Ebrahimi et al. [91] | Co | OA | K | Tibial Plateau | Indentation (stress–relaxation; dynamic mechanical analysis) | mm | D | - | - | Only the correlation coefficients with structure and composition of AC are reported | OARSI 2-3 |
| Ebrahimi et al. [91] | Co | OA | K | Tibial Plateau | Indentation (stress–relaxation; dynamic mechanical analysis) | mm | D | - | - | Only the correlation coefficients with structure and composition of AC are reported | OARSI 4 |
| Reference | Type of Study | Pathology | Joint | Anatomical Position | Experimental Technique (Mode) | Dimensional Scale | Model | Elastic or Young Modulus, E (MPa) | Strain | Shear Storage Modulus, G′ (MPa) | Loss Modulus, G″ (MPa) | Condition |
|---|---|---|---|---|---|---|---|---|---|---|---|---|
| Wong et al. [103] | In | None | K | Femoral Condyle; Tibial Plateau | Shear Test; Compression (stress–relaxation) | mm, µm (strain) | LE | 0.1–0.9 | 0.01–0.40 (compressive); 0.01–0.50 (shear) | - | - | No disease |
| Griebel et al. [106] | In; Co | OA | K | Femoral Condyle; Tibial Plateau | Compression | mm, µm | Anisotropic elasticity; depth-dependent distribution of strain | - | 0.0–0.12 | - | - | Different grades of OA severity |
| Peters et al. [16] | Co | OA; Aging | K | Femoral Condyle; Tibial Plateau | Indentation (Dynamic Mechanical Analysis) | µm | VE; D | 0.04–8.13 | - | 0.90 ± 0.10 * | 0.01–3.23 * | ICRS grade 0 |
| Peters et al. [16] | Co | OA; Aging | K | Femoral Condyle; Tibial Plateau | Indentation (Dynamic Mechanical Analysis) | µm | VE; D | 0.04–8.13 | - | 0.57 ± 0.07 * | 0.01–3.23 * | ICRS grade 1 |
| Peters et al. [16] | Co | OA; Aging | K | Femoral Condyle; Tibial Plateau | Indentation (Dynamic Mechanical Analysis) | µm | VE; D | 0.04–8.13 | - | 0.27 ± 0.07 * | 0.01–3.23 * | ICRS grade 2 |
| Peters et al. [16] | Co | OA; Aging | K | Femoral Condyle; Tibial Plateau | Indentation (Dynamic Mechanical Analysis) | µm | VE; D | 0.04–8.13 | - | 0.11 ± 0.05 * | 0.01–3.23 * | ICRS grade 3 |
| Peters et al. [16] | Co | OA; Aging | K | Femoral Condyle; Tibial Plateau | Indentation (Dynamic Mechanical Analysis) | µm | VE; D | 0.04–8.13 | - | 0.16 ± 0.06 * | 0.01–3.23 * | ICRS grade 4 |
4.4. Subchondral Bone
4.5. Trabecular Bone
| Reference | Type of Study | Pathology | Joint | Anatomical Position | Experimental Technique (Mode) | Dimensional Scale | Model | Elastic Modulus (GPa) | Hardness (GPa) | Condition |
|---|---|---|---|---|---|---|---|---|---|---|
| Birnbaum et al. [144] | In | None | H | Femoral head | Compression | mm | LE | 0.051–0.32 | - | No disease |
| Pattijn et al. [145] | In; Me | None | H | Proximal femur | Ultrasonography (US); Compression | mm | LE | US: 0.052–0.306; UC: 0.021–1.514 | - | No disease |
| Morgan et al. [146] | In | None | K | Proximal Tibia | Tension; Compression | mm | LE | 0.1–3.0 | - | No disease |
| Ohman et al. [147] | Me | None | H | Femoral head | Micro-indentation (Vickers); Compression (C) | µm; mm | LE | 2.73 ± 1.06 (aligned); 1.59 ± 0.66 (misaligned) | 32.5 ± 2.9 (aligned); 31.1 ± 3.1 (misaligned) | Aligned or misaligned to the trabecular main direction |
| Dall’Ara et al. [161] | In | None | H | Femoral head | Micro-indentation (Vickers); Compression | mm; µm | LE | 0.5–4.5 * | 32.9 ± 6.6 (wet); 35.1 ± 5.3 (dry); 44.6 ± 6.0 (embedded) | Wet vs. Dry vs. Embedded |
| Lancianese et al. [148] | In | None | K | Proximal Tibia | Compression | mm | LE | Discussed, without presenting computed values | - | No disease |
| Karim et al. [150] | In | None | K | Tibial plateau | Compression | mm | LE | Discussed, without presenting computed values | - | No disease |
| Schwiedrzik et al. [149] | In | None | H | Femoral head | Compression; Confined Compression | mm | LE | 0.319 ± 0.164 (Compression) | - | No disease |
| Karim et al. [151] | In | NEG | K | Tibial plateau | Compression | mm | LE | Only coefficients of correlation with structural features are reported | - | No disease |
| Rodrigues et al. [152] | Co | OA | H | Femoral head | Compression | mm | LE | 0.437 ± 0.237 | - | OA |
| Rodrigues et al. [152] | Co | HF | H | Femoral head | Compression | mm | LE | 0.324 ± 0.192 | - | HF |
| Novitskaya et al. [156] | In; Co | OP | K | Proximal tibia | Compression | mm | LE | 0.02–0.16 * | - | OP |
| Zhou et al. [153] | In | None | K | Proximal Tibia | Compression | mm | LE | 0.27–1.58 | - | No disease |
| Chen et al. [154] | In | None | A | Distal tibia | Compression | mm | LE | Only coefficients of correlation with structural features are reported | - | No disease |
| Yadav et al. [155] | Co | T2D | H | Femoral head | Nano-indentation (NI); Compression | µm; mm | LE | NI: 7 ± 2 *; C: 0.20 ± 0.10 * | 0.25 ± 0.15 * | T2D |
| Yadav et al. [155] | Co | OP | H | Femoral head | Nano-indentation (NI); Compression | µm; mm | LE | NI: 9 ± 2 *; C: 0.35 ± 0.15 * | 0.30 ± 0.25 * | OP |
| Yadav et al. [155] | Co | OPE | H | Femoral head | Nano-indentation (NI); Compression | µm; mm | LE | NI: 12 ± 2 *; C: 0.50 ± 0.20 * | 0.75 ± 0.35 * | OPE |
| Reference | Type of Study | Pathology | Joint | Anatomical Position | Experimental Technique (Mode) | Dimensional Scale | Model | Final Creep Strain (µε) | Steady-State Creep Rate (sec−1) | Condition |
|---|---|---|---|---|---|---|---|---|---|---|
| Novitskaya et al. [156] | In; Co | OP | K | Proximal tibia | Compression | mm | VE | 1600–6500 * | 0.15–0.38 * | OP |
| Reference | Type of Study | Pathology | Joint | Anatomical Position | Experimental Technique (Mode) | Dimensional Scale | Model | Depth of Indentation at 1 kN (mm) | Yield strain (%) | Yield Stress/Strength (MPa) | Toughness (mJ/mm3) | Dissipated Energy Density (MPa) | Absorbed Energy at 20% Strain (J) | Condition |
|---|---|---|---|---|---|---|---|---|---|---|---|---|---|---|
| Birnbaum et al. [144] | In | None | H | Femoral head | Compression | mm | P | - | - | 2.2–7.6 | - | - | - | No disease |
| Pattijn et al. [145] | In; Me | None | H | Proximal femur | Ultrasonography (US); Compression | mm | P | - | - | - | - | - | 0.0008–0.1372 | No disease |
| Lancianese et al. [148] | In | None | K | Proximal Tibia | Compression | mm | P | - | - | 0.1–11.0 * | - | - | - | No disease |
| Steines et al. [165] | In | None | H | Proximal femur | Compression | mm | P | - | - | 0.1–18.0 * | - | - | - | No disease |
| Holstein et al. [164] | Co | HCY | H | Femoral head | Indentation (Brinell) | mm | P | 0.7–1.5 * | - | - | - | - | - | HCY |
| Holstein et al. [164] | Co | Control | H | Femoral head | Indentation (Brinell) | mm | P | 0.7–1.6 * | - | - | - | - | - | Control |
| Karim et al. [150] | In | None | K | Tibial plateau | Compression | mm | P | - | - | - | 0.002–0.044 | - | - | No disease |
| Schwiedrzik et al. [149] | In | None | H | Femoral head | Compression; Confined Compression | mm | P | - | 0.0144 ± 0.0022 | - | - | 5.668 ± 4.416 | - | No disease |
| Karim et al. [151] | In | NEG | K | Tibial plateau | Compression | mm | P | - | Only coefficients of correlation with structural features are reported | - | 0.001–0.067.5 | - | - | No disease |
| Rodrigues et al. [152] | Co | OA | H | Femoral head | Compression | mm | P | - | - | 8.7 ± 4.8 | 0.19 ± 0.18 | - | - | OA |
| Rodrigues et al. [152] | Co | HF | H | Femoral head | Compression | mm | P | - | - | 6.8 ± 4.1 | 0.13 ± 0.11 | - | - | HF |
| Zhou et al. [152] | In | None | K | Proximal Tibia | Compression | mm | P | - | 0.52–0.83 | 1.12–8.92 | - | - | - | No disease |
| Chen et al. [154] | In | None | A | Distal tibia | Compression | mm | P | - | - | Only coefficients of correlation with structural features are reported | - | - | - | No disease |
| Yadav et al. [155] | Co | T2D | H | Femoral head | Nano-indentation (NI); Compression | µm; mm | P | - | - | 3.5 ± 1.5 * | 0.065 ± 0.010 * | - | - | T2D |
| Yadav et al. [155] | Co | OP | H | Femoral head | Nano-indentation (NI); Compression | µm; mm | P | - | - | 5.0 ± 2.5 * | 0.115 ± 0.010 * | - | - | OP |
| Yadav et al. [155] | Co | OPE | H | Femoral head | Nano-indentation (NI); Compression | µm; mm | P | - | - | 6.5 ± 2.0 * | 0.185 ± 0.020 * | - | - | OPE |
| Reference | Type of Study | Pathology | Joint | Anatomical Position | Experimental Technique (Mode) | Dimensional Scale | Model | Elastic or Tangent Modulus (GPa) | Hardness (GPa) | Condition |
|---|---|---|---|---|---|---|---|---|---|---|
| Dall’Ara et al. [161] | In | None | H | Femoral head | Micro-indentation (Vickers) | µm | EP | - | 32.9 ± 6.6 (wet); 35.1 ± 5.3 (dry); 44.6 ± 6.0 (embedded) | No disease |
| Ohman et al. [147] | Me | None | H | Femoral head | Micro-indentation (Vickers); Compression | µm; mm | EP | 2.73 ± 1.06 (aligned); 1.59 ± 0.66 (misaligned) | 32.5 ± 2.9 (aligned); 31.1 ± 3.1 (misaligned) | No disease |
| Marinozzi et al. [167] | In | None | H | Femoral head | Microtensile | µm | Response of the trabecular bone at the nanoscale, by considering the tissue as a composite | 0.8–3.2 * | - | No disease |
| Cyganik et al. [166] | In | DHD; HD; FHN | H | Femoral head | FE coupled with compression on cubic samples | µm | Young’s modulus distributions assigned to the finite element models following modified Wagner et al.’s (Young’s modulus calcium content) relationship | Distribution and error made by estimating the elastic modulus through Wagner’s law | - | No disease |
| Peters et al. [16] | Co | OA; Aging | K | Femoral condyle; Tibial plate | Nano-indentation | nm; µm | EP | 12.33 ± 0.50 * | 0.11–1.05 | ICRS grade 0 |
| Peters et al. [16] | Co | OA; Aging | K | Femoral condyle; Tibial plate | Nano-indentation | nm; µm | EP | 12.57 ± 0.60 * | 0.11–1.05 | ICRS grade 0 |
| Peters et al. [16] | Co | OA; Aging | K | Femoral condyle; Tibial plate | Nano-indentation | nm; µm | EP | 12.01 ± 0.70 * | 0.11–1.05 | ICRS grade 0 |
| Peters et al. [16] | Co | OA; Aging | K | Femoral condyle; Tibial plate | Nano-indentation | nm; µm | EP | 12.94 ± 0.80 * | 0.11–1.05 | ICRS grade 0 |
| Peters et al. [16] | Co | OA; Aging | K | Femoral condyle; Tibial plate | Nano-indentation | nm; µm | EP | 12.07 ± 1.00 * | 0.11–1.05 | ICRS grade 0 |
| Yadav et al. [155] | Co | T2D | H | Femoral head | Nano-indentation (NI); Compression | µm; mm | EP | NI: 7 ± 2 *; C: 0.20 ± 0.10 * | 0.25 ± 0.15 * | T2D |
| Yadav et al. [155] | Co | OP | H | Femoral head | Nano-indentation (NI); Compression | µm; mm | EP | NI: 9 ± 2 *; C: 0.35 ± 0.15 * | 0.30 ± 0.25 * | OP |
| Yadav et al. [155] | Co | OPE | H | Femoral head | Nano-indentation (NI); Compression | µm; mm | EP | NI: 12 ± 2 *; C: 0.50 ± 0.20 * | 0.75 ± 0.35 * | OPE |
4.6. Final Considerations on OC Tissues
5. Complementary Approaches to Investigate the OC Unit’s Biomechanics
6. Conclusions and Future Perspectives
Supplementary Materials
Author Contributions
Funding
Data Availability Statement
Conflicts of Interest
Appendix A
Appendix A.1. Impact of Osteoarthritis
Appendix A.2. Search Strategies
| Database | Search Items |
|---|---|
| PubMed | (“in vitro” [Title/Abstract] OR “in vivo” [Title/Abstract] OR “cadaver*” [Title/Abstract] OR “ex vivo” [Title/Abstract] OR “experiment*” [Title/Abstract] OR “post mortem*” [Title/Abstract]) AND (“Human*” [Title/Abstract]) AND (“Hip” [Title/Abstract] OR “Femor*” [Title/Abstract] OR “Femur*” [Title/Abstract] OR “Knee” [Title/Abstract] OR “Tibia*” [Title/Abstract] OR “Patella*” [Title/Abstract] OR “Ankle” [Title/Abstract] OR “Fibula*” [Title/Abstract] OR “Talus” [Title/Abstract] OR “Talar*” [Title/Abstract]) AND (“Cartilage” [Title/Abstract] OR “Subchondral bone” [Title/Abstract] OR “Subchondral tissue” [Title/Abstract] OR “Trabecular bone” [Title/Abstract] OR “Trabecular tissue” [Title/Abstract] OR “Cancellous bone” [Title/Abstract] OR “Cancellous tissue” [Title/Abstract] OR “spongy tissue” [Title/Abstract] OR “spongy bone” [Title/Abstract] OR “Mineralized Cartilage” [Title/Abstract] OR “Calcified Cartilage” [Title/Abstract] OR “Osteochondral” [Title/Abstract]) AND (“Mechanic*” [Title/Abstract] OR “Behav*” [Title/Abstract] OR “Response” [Title/Abstract] OR “Load*” [Title/Abstract]) AND (English[Filter]) AND (2000:2022[pdat])) |
| Scopus | (TITLE-ABS-KEY (in vitro) OR TITLE-ABS-KEY (in vivo) OR TITLE-ABS-KEY (cadaver*) OR TITLE-ABS-KEY (ex vivo) OR TITLE-ABS-KEY (experiment*) OR TITLE-ABS-KEY (post mortem)) AND (TITLE-ABS-KEY (Human)) AND (TITLE-ABS-KEY (Hip) OR TITLE-ABS-KEY (Femor*) OR TITLE-ABS-KEY (Femur*) OR TITLE-ABS-KEY (Knee) OR TITLE-ABS-KEY (Tibia*) OR TITLE-ABS-KEY (Patella*) OR TITLE-ABS-KEY (Ankle) OR TITLE-ABS-KEY (Fibula*) OR TITLE-ABS-KEY (Talus) OR TITLE-ABS-KEY (Talar*)) AND (TITLE-ABS-KEY (Cartilage) OR TITLE-ABS-KEY (Subchondral bone) OR TITLE-ABS-KEY (Subchondral tissue) OR TITLE-ABS-KEY (Trabecular bone) OR TITLE-ABS-KEY (Trabecular tissue) OR TITLE-ABS-KEY (Cancellous bone) OR TITLE-ABS-KEY (Cancellous tissue) OR TITLE-ABS-KEY (spongy tissue) OR TITLE-ABS-KEY (spongy bone) OR TITLE-ABS-KEY (Miner* Cartilage) OR TITLE-ABS-KEY (Calc* Cartilage) OR TITLE-ABS-KEY (Osteochondral)) AND (TITLE-ABS-KEY (Mechanic*) OR TITLE-ABS-KEY (Behav*) OR TITLE-ABS-KEY (Response) OR TITLE-ABS-KEY (Load*)) AND (LIMIT-TO (DOCTYPE, “ar”)) AND (LIMIT-TO (LANGUAGE, “English”)) AND (LIMIT-TO (PUBYEAR, 2022) OR LIMIT-TO (PUBYEAR, 2021) OR LIMIT-TO (PUBYEAR, 2020) OR LIMIT-TO (PUBYEAR, 2019) OR LIMIT-TO (PUBYEAR, 2018) OR LIMIT-TO (PUBYEAR, 2017) OR LIMIT-TO (PUBYEAR, 2016) OR LIMIT-TO (PUBYEAR, 2015) OR LIMIT-TO (PUBYEAR, 2014) OR LIMIT-TO (PUBYEAR, 2013) OR LIMIT-TO (PUBYEAR, 2012) OR LIMIT-TO (PUBYEAR, 2011) OR LIMIT-TO (PUBYEAR, 2010) OR LIMIT-TO (PUBYEAR, 2009) OR LIMIT-TO (PUBYEAR, 2008) OR LIMIT-TO (PUBYEAR, 2007) OR LIMIT-TO (PUBYEAR, 2006) OR LIMIT-TO (PUBYEAR, 2005) OR LIMIT-TO (PUBYEAR, 2004) OR LIMIT-TO (PUBYEAR, 2003) OR LIMIT-TO (PUBYEAR, 2002) OR LIMIT-TO (PUBYEAR, 2001) OR LIMIT-TO (PUBYEAR, 2000)) |
| Web of Science | (TS = in vitro OR TS = in vivo OR TS = cadaver* OR TS = ex vivo OR TS = experiment* OR TS = post mortem) AND (TS = Human) AND (TS = Hip OR TS = Femor* OR TS = Femur* OR TS = Knee OR TS = Tibia* OR TS = Patella* OR TS = Ankle OR TS = Fibula* OR TS = Talus OR TS = Talar*) AND (TS = Cartilage OR TS = Subchondral bone OR TS = Subchondral tissue OR TS = Trabecular bone OR TS = Trabecular tissue OR TS = Cancellous bone OR TS = Cancellous tissue OR TS = spongy tissue OR TS = spongy bone OR TS = Mineralized Cartilage OR TS = Calcified Cartilage OR TS = Osteochondral) AND (TS = Mechanic* OR TS = Behav* OR TS = Response OR TS = Load*) AND Article (Document Types) AND English (Languages)—with publication Year up to 2022 |
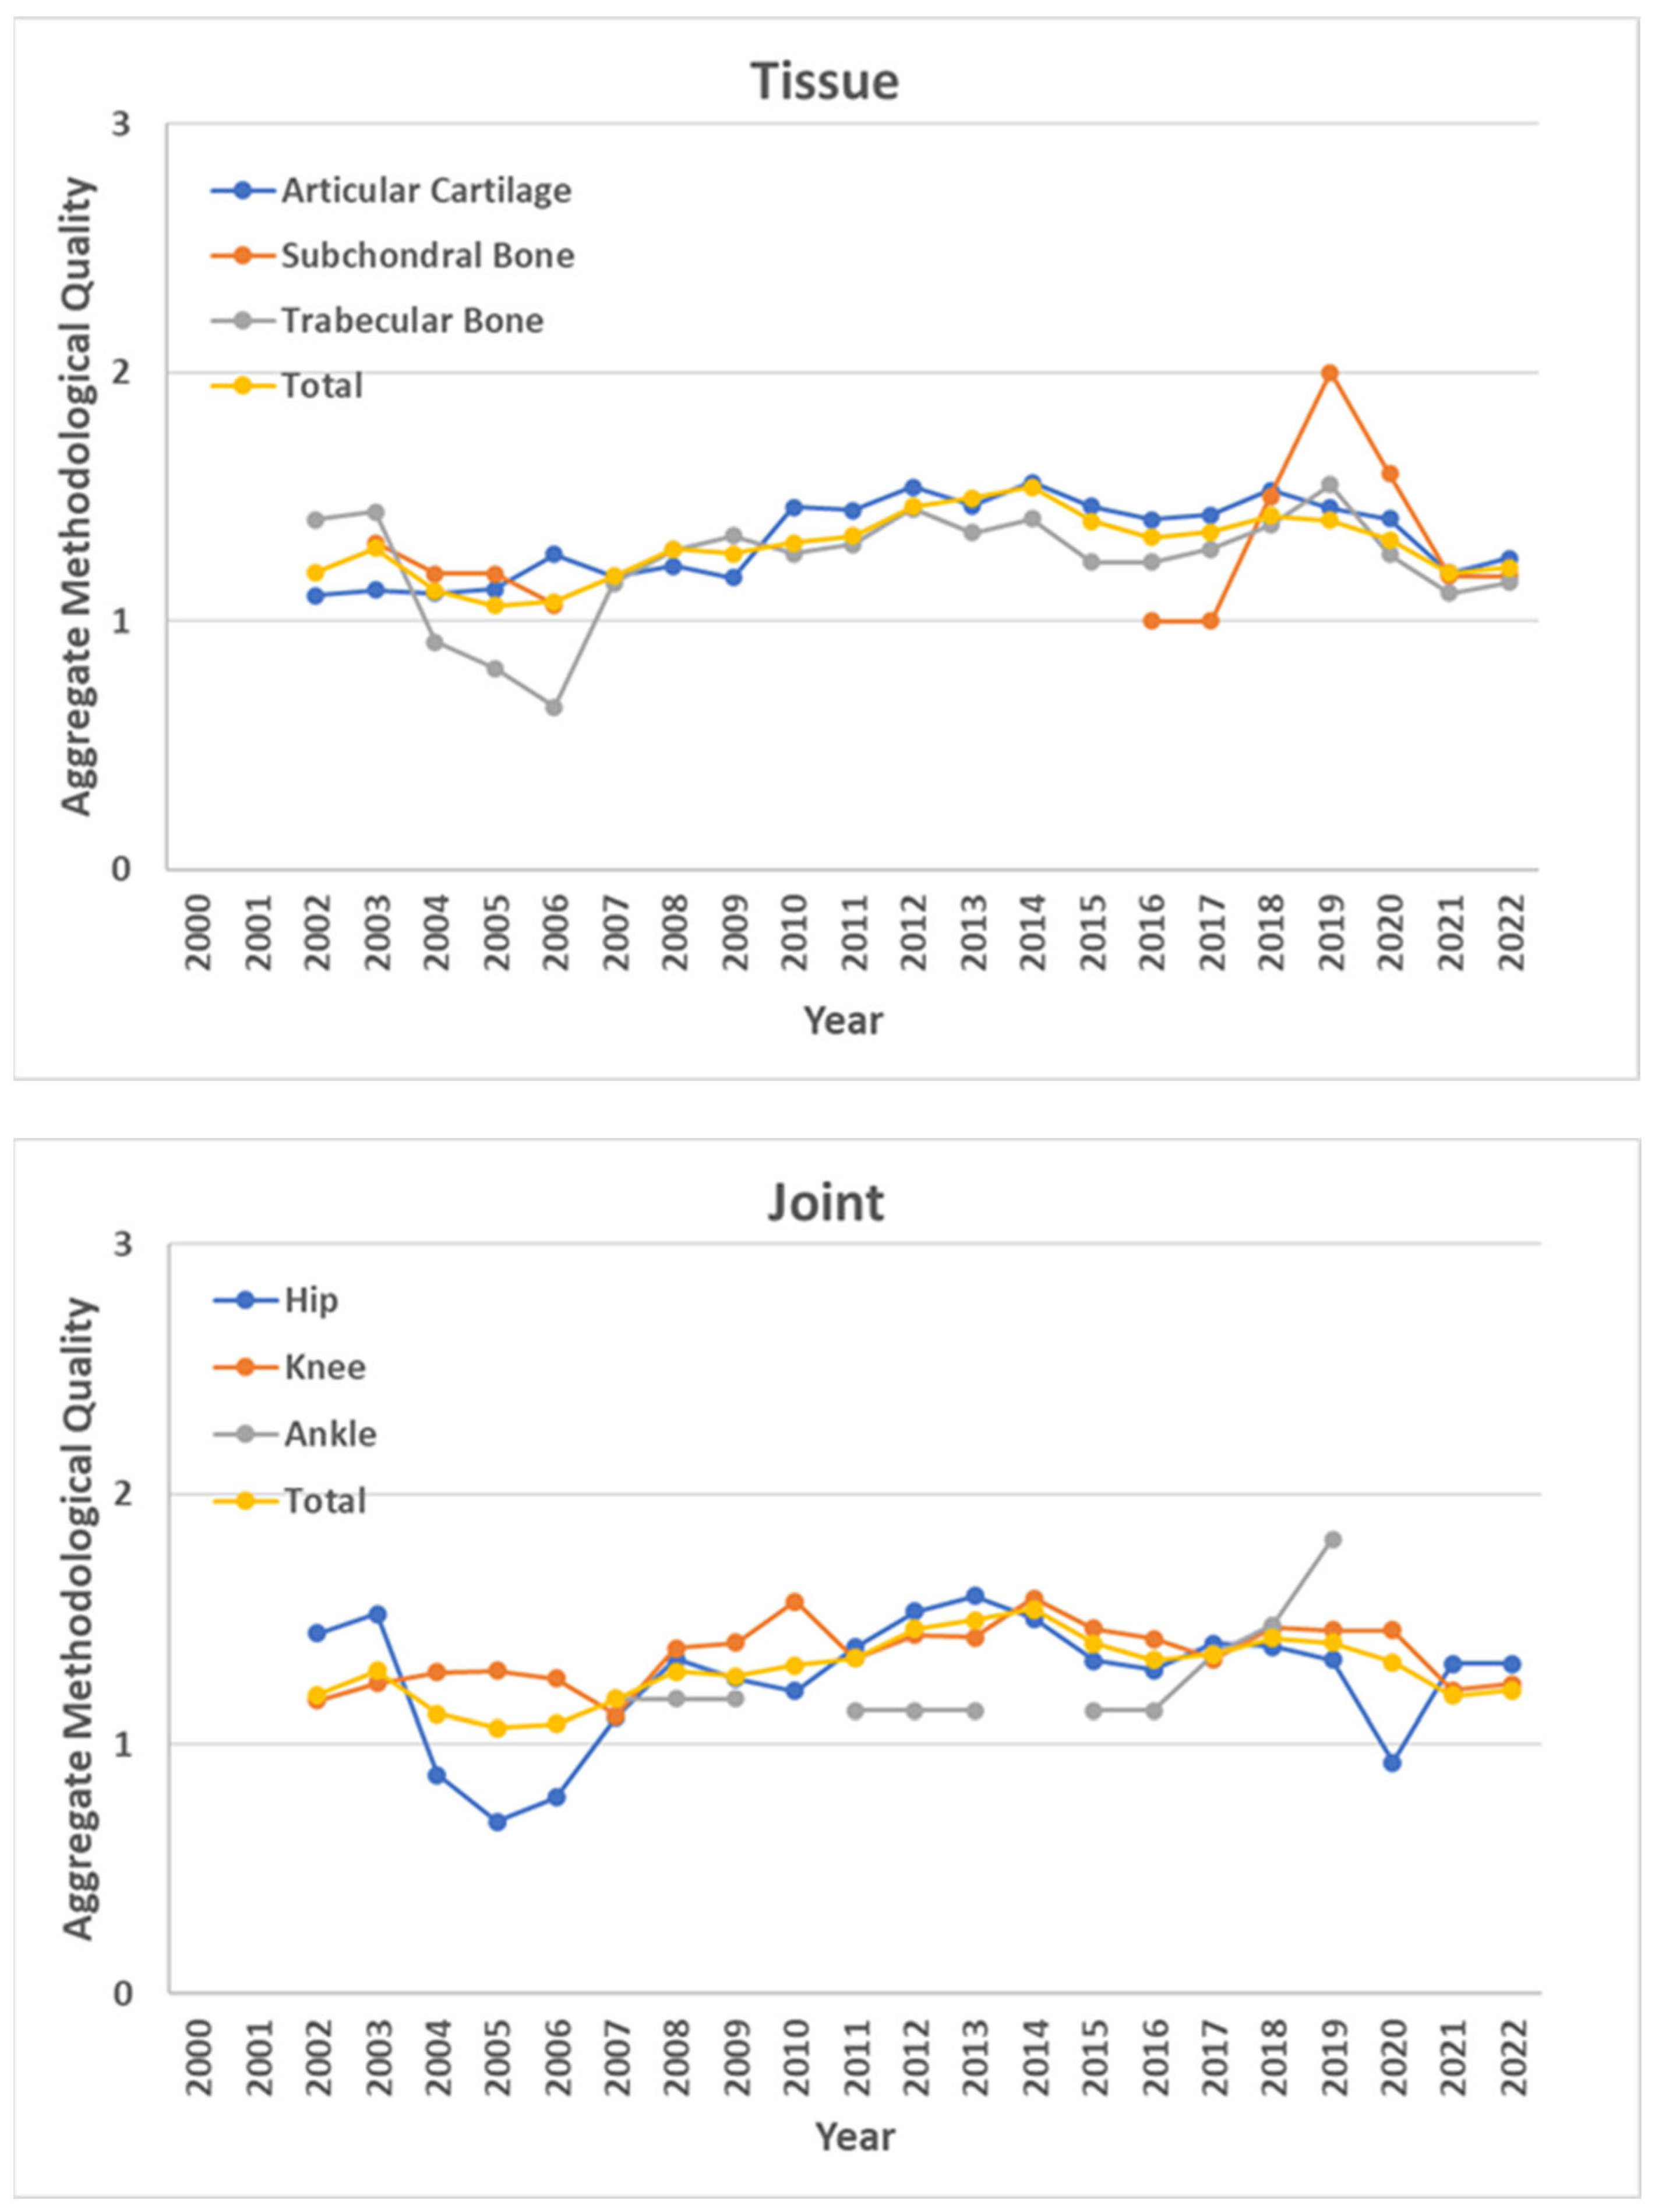
Appendix A.3. Aggregate Methodological Quality of the Studies
| Features | Score | Description |
|---|---|---|
| Methodology | 0 | Parameters and criteria of the mechanical experiment are not reported |
| 1 | Mechanical testing methods are reported, but not supported or referenced | |
| 2 | Mechanical testing methods are supported or referenced | |
| Data processing (Methodological and Modelling studies) | 0 | No statistical analysis is reported, or only a qualitative one is provided, e.g., mean and standard deviation |
| 1 | Not suitable statistical analysis, e.g., parametric test without normal distribution of data | |
| 2 | A suitable statistical analysis is provided, e.g., parametric test after checking normality of data (for comparative and investigative studies, 2 is assigned only if power analysis is also reported, otherwise 1 is assigned, despite a suitable statistical analysis | |
| Constitutive model/s | 0 | One mechanical parameter is computed by fitting the constitutive model/s on the experimental data |
| 1 | Two mechanical parameters are computed by fitting the constitutive model/s on the experimental data | |
| 2 | Three, or more, mechanical parameters are computed by fitting the constitutive model/s on the experimental data |
- The best—i.e., most important—and the worst—i.e., least important—metrics were determined according to the focus of this review; from this perspective, methodology was defined as the best criterion, while model complexity was defined as the worst.
- Preference of the best metric over the others was determined by using a number between 1 and 9, where 1 means that a metric is equally important to the best one, 9 means that a metric is extremely less important than the best one, and the other metrics are scored comparatively [78]. Therefore, 1, 5, and 9 coefficients were assigned to methodology, data processing, and constitutive models, respectively, based on the focus of this review and, moreover, in order to span the whole range of variability. Consequently, the best-to-others (BO) vector was built, in which the individual coefficients indicate the preference of the best metric over the others.
- Preference of the worst metric over the others was determined by using a number between 1 and 9, where 1 means that a metric is equally important to the worst one, 9 means that a metric is extremely more important than the worst one, and the other metrics are scored comparatively [78]. Therefore, 9, 5, and 1 coefficients were assigned to methodology, data processing, and constitutive models, respectively. Consequently, the worst-to-others (WO) vector was built, in which the individual coefficients indicate the preference of the metrics over the worst one.
- The optimal weights of the metrics were defined by minimizing the absolute difference of a linear problem, considering the previously defined coefficients, i.e., BO and WO vectors.
References
- McMahon, L.; O’Brien, F.; Prendergast, P. Biomechanics and Mechanobiology in Osteochondral Tissues. Regen. Med. 2008, 3, 743–759. [Google Scholar] [CrossRef]
- Wong, M.; Carter, D.R. Articular Cartilage Functional Histomorphology and Mechanobiology: A Research Perspective. Bone 2003, 33, 1–13. [Google Scholar] [CrossRef]
- Sophia Fox, A.J.; Bedi, A.; Rodeo, S.A. The Basic Science of Articular Cartilage: Structure, Composition, and Function. Sports Health 2009, 1, 461–468. [Google Scholar] [CrossRef]
- Tozzi, G.; Peña Fernández, M.; Davis, S.; Karali, A.; Kao, A.P.; Blunn, G. Full-Field Strain Uncertainties and Residuals at the Cartilage-Bone Interface in Unstained Tissues Using Propagation-Based Phase-Contrast XCT and Digital Volume Correlation. Materials 2020, 13, 2579. [Google Scholar] [CrossRef] [PubMed]
- Zhou, X.; Cao, H.; Yuan, Y.; Wu, W. Biochemical Signals Mediate the Crosstalk between Cartilage and Bone in Osteoarthritis. BioMed Res. Int. 2020, 2020, 5720360. [Google Scholar] [CrossRef]
- Yuan, X.L.; Meng, H.Y.; Wang, Y.C.; Peng, J.; Guo, Q.Y.; Wang, A.Y.; Lu, S.B. Bone–Cartilage Interface Crosstalk in Osteoarthritis: Potential Pathways and Future Therapeutic Strategies. Osteoarthr. Cartil. 2014, 22, 1077–1089. [Google Scholar] [CrossRef]
- Leong, D.J.; Hardin, J.A.; Cobelli, N.J.; Sun, H.B. Mechanotransduction and Cartilage Integrity. Ann. N. Y. Acad. Sci. 2011, 1240, 32–37. [Google Scholar] [CrossRef]
- Teichtahl, A.J.; Wluka, A.E.; Wijethilake, P.; Wang, Y.; Ghasem-Zadeh, A.; Cicuttini, F.M. Wolff’s Law in Action: A Mechanism for Early Knee Osteoarthritis. Arthritis Res. Ther. 2015, 17, 207. [Google Scholar] [CrossRef]
- Theocharis, A.D.; Skandalis, S.S.; Gialeli, C.; Karamanos, N.K. Extracellular Matrix Structure. Adv. Drug Deliv. Rev. 2016, 97, 4–27. [Google Scholar] [CrossRef]
- Sanchez, C.; Pesesse, L.; Gabay, O.; Delcour, J.-P.; Msika, P.; Baudouin, C.; Henrotin, Y.E. Regulation of Subchondral Bone Osteoblast Metabolism by Cyclic Compression. Arthritis Rheum. 2012, 64, 1193–1203. [Google Scholar] [CrossRef]
- Massicotte, F.; Aubry, I.; Martel-Pelletier, J.; Pelletier, J.-P.; Fernandes, J.; Lajeunesse, D. Abnormal Insulin-like Growth Factor 1 Signaling in Human Osteoarthritic Subchondral Bone Osteoblasts. Arthritis Res. Ther. 2006, 8, R177. [Google Scholar] [CrossRef] [PubMed]
- Zhang, L.; Wen, C. Osteocyte Dysfunction in Joint Homeostasis and Osteoarthritis. Int. J. Mol. Sci. 2021, 22, 6522. [Google Scholar] [CrossRef] [PubMed]
- Wu, P.-J.; Masouleh, M.I.; Dini, D.; Paterson, C.; Török, P.; Overby, D.R.; Kabakova, I.V. Detection of Proteoglycan Loss from Articular Cartilage Using Brillouin Microscopy, with Applications to Osteoarthritis. Biomed. Opt. Express 2019, 10, 2457–2466. [Google Scholar] [CrossRef] [PubMed]
- Tschaikowsky, M.; Brander, S.; Barth, V.; Thomann, R.; Rolauffs, B.; Balzer, B.N.; Hugel, T. The Articular Cartilage Surface Is Impaired by a Loss of Thick Collagen Fibers and Formation of Type I Collagen in Early Osteoarthritis. Acta Biomater. 2022, 146, 274–283. [Google Scholar] [CrossRef] [PubMed]
- Dudaric, L.; Dumic-Cule, I.; Divjak, E.; Cengic, T.; Brkljacic, B.; Ivanac, G. Bone Remodeling in Osteoarthritis-Biological and Radiological Aspects. Medicina 2023, 59, 1613. [Google Scholar] [CrossRef] [PubMed]
- Peters, A.E.; Akhtar, R.; Comerford, E.J.; Bates, K.T. The Effect of Ageing and Osteoarthritis on the Mechanical Properties of Cartilage and Bone in the Human Knee Joint. Sci. Rep. 2018, 8, 5931. [Google Scholar] [CrossRef] [PubMed]
- Sun, H.B. Mechanical Loading, Cartilage Degradation, and Arthritis. Ann. N. Y. Acad. Sci. 2010, 1211, 37–50. [Google Scholar] [CrossRef] [PubMed]
- Singh, P.; Marcu, K.B.; Goldring, M.B.; Otero, M. Phenotypic Instability of Chondrocytes in Osteoarthritis: On a Path to Hypertrophy. Ann. N. Y. Acad. Sci. 2019, 1442, 17–34. [Google Scholar] [CrossRef] [PubMed]
- Goldring, M.B. Articular Cartilage Degradation in Osteoarthritis. HSS J. 2012, 8, 7–9. [Google Scholar] [CrossRef]
- Waldstein, W.; Perino, G.; Gilbert, S.L.; Maher, S.A.; Windhager, R.; Boettner, F. OARSI Osteoarthritis Cartilage Histopathology Assessment System: A Biomechanical Evaluation in the Human Knee. J. Orthop. Res. 2016, 34, 135–140. [Google Scholar] [CrossRef]
- Pritzker, K.P.H.; Gay, S.; Jimenez, S.A.; Ostergaard, K.; Pelletier, J.-P.; Revell, P.A.; Salter, D.; van den Berg, W.B. Osteoarthritis Cartilage Histopathology: Grading and Staging. Osteoarthr. Cartil. 2006, 14, 13–29. [Google Scholar] [CrossRef] [PubMed]
- Finnilä, M.A.J.; Thevenot, J.; Aho, O.-M.; Tiitu, V.; Rautiainen, J.; Kauppinen, S.; Nieminen, M.T.; Pritzker, K.; Valkealahti, M.; Lehenkari, P.; et al. Association between Subchondral Bone Structure and Osteoarthritis Histopathological Grade. J. Orthop. Res. 2017, 35, 785–792. [Google Scholar] [CrossRef] [PubMed]
- Donell, S. Subchondral Bone Remodelling in Osteoarthritis. EFORT Open Rev. 2019, 4, 221–229. [Google Scholar] [CrossRef] [PubMed]
- Weber, A.; Chan, P.M.B.; Wen, C. Do Immune Cells Lead the Way in Subchondral Bone Disturbance in Osteoarthritis? Prog. Biophys. Mol. Biol. 2019, 148, 21–31. [Google Scholar] [CrossRef] [PubMed]
- Taheri, S.; Yoshida, T.; Böker, K.O.; Foerster, R.H.; Jochim, L.; Flux, A.L.; Grosskopf, B.; Hawellek, T.; Lehmann, W.; Schilling, A.F. Changes of the Subchondral Bone Microchannel Network in Early Osteoarthritis. Osteoarthr. Cartil. 2023, 31, 49–59. [Google Scholar] [CrossRef] [PubMed]
- Petitjean, N.; Canadas, P.; Royer, P.; Noël, D.; Le Floc’h, S. Cartilage Biomechanics: From the Basic Facts to the Challenges of Tissue Engineering. J. Biomed. Mater. Res. A 2023, 111, 1067–1089. [Google Scholar] [CrossRef] [PubMed]
- Oftadeh, R.; Perez-Viloria, M.; Villa-Camacho, J.C.; Vaziri, A.; Nazarian, A. Biomechanics and Mechanobiology of Trabecular Bone: A Review. J. Biomech. Eng. 2015, 137, 0108021–01080215. [Google Scholar] [CrossRef] [PubMed]
- Öhman-Mägi, C.; Holub, O.; Wu, D.; Hall, R.M.; Persson, C. Density and Mechanical Properties of Vertebral Trabecular Bone-A Review. JOR Spine 2021, 4, e1176. [Google Scholar] [CrossRef] [PubMed]
- Wang, H.; Zhang, Y.; Ren, C.; Ding, K.; Zhang, Q.; Zhu, Y.; Chen, W. Biomechanical Properties and Clinical Significance of Cancellous Bone in Proximal Femur: A Review. Injury 2023, 54, 1432–1438. [Google Scholar] [CrossRef]
- Keaveny, T.M.; Guo, X.E.; Wachtel, E.F.; McMahon, T.A.; Hayes, W.C. Trabecular Bone Exhibits Fully Linear Elastic Behavior and Yields at Low Strains. J. Biomech. 1994, 27, 1127–1136. [Google Scholar] [CrossRef]
- Valenta, J.; Růzicka, M.; Cihák, R. Modelling Tissue Behaviour Based on Hyperelasticity Theory. Biomed. Mater. Eng. 1994, 4, 381–395. [Google Scholar] [CrossRef] [PubMed]
- Mooney, M. A Theory of Large Elastic Deformation. J. Appl. Phys. 1940, 11, 582–592. [Google Scholar] [CrossRef]
- Rivlin, R.S. Large Elastic Deformations of Isotropic Materials IV. Further Developments of the General Theory. Philos. Trans. R. Soc. Lond. A 1948, 241, 379–397. [Google Scholar] [CrossRef]
- Rivlin, R.S.; Saunders, D.W. Large Elastic Deformations of Isotropic Materials VII. Experiments on the Deformation of Rubber. Philos. Trans. R. Soc. Lond. A 1951, 243, 251–288. [Google Scholar] [CrossRef]
- Fung, Y. Elasticity of Soft Tissues in Simple Elongation. Am. J. Physiol. 1967, 213, 1532–1544. [Google Scholar] [CrossRef] [PubMed]
- Ogden, R.W. Large Deformation Isotropic Elasticity–on the Correlation of Theory and Experiment for Incompressible Rubberlike Solids. Proc. R. Soc. Lond. A 1972, 326, 565–584. [Google Scholar] [CrossRef]
- Yeoh, O.H. Some Forms of the Strain Energy Function for Rubber. Rubber Chem. Technol. 1993, 66, 754–771. [Google Scholar] [CrossRef]
- Arruda, E.M.; Boyce, M.C. A Three-Dimensional Constitutive Model for the Large Stretch Behavior of Rubber Elastic Materials. J. Mech. Phys. Solids 1993, 41, 389–412. [Google Scholar] [CrossRef]
- Gent, A.N. A New Constitutive Relation for Rubber. Rubber Chem. Technol. 1996, 69, 59–61. [Google Scholar] [CrossRef]
- Zysset, P. A Constitutive Law for Trabecular Bone; EPFL: Lausanne, Switzerland, 2005. [Google Scholar] [CrossRef]
- Hayes, W.C.; Keer, L.M.; Herrmann, G.; Mockros, L.F. A Mathematical Analysis for Indentation Tests of Articular Cartilage. J. Biomech. 1972, 5, 541–551. [Google Scholar] [CrossRef]
- Sakamoto, M.; Li, G.; Hara, T.; Chao, E.Y. A New Method for Theoretical Analysis of Static Indentation Test. J. Biomech. 1996, 29, 679–685. [Google Scholar] [CrossRef] [PubMed]
- Armstrong, C.G.; Lai, W.M.; Mow, V.C. An Analysis of the Unconfined Compression of Articular Cartilage. J. Biomech. Eng. 1984, 106, 165–173. [Google Scholar] [CrossRef] [PubMed]
- Currey, J.D. The Mechanical Properties of Bone. Clin. Orthop. Relat. Res. 1970, 73, 209–231. [Google Scholar] [CrossRef] [PubMed]
- Pugh, J.W.; Rose, R.M.; Radin, E.L. Elastic and Viscoelastic Properties of Trabecular Bone: Dependence on Structure. J. Biomech. 1973, 6, 475–485. [Google Scholar] [CrossRef] [PubMed]
- Linde, F. Elastic and Viscoelastic Properties of Trabecular Bone by a Compression Testing Approach. Dan. Med. Bull. 1994, 41, 119–138. [Google Scholar] [PubMed]
- Bowman, S.M.; Gibson, L.J.; Hayes, W.C.; McMahon, T.A. Results from Demineralized Bone Creep Tests Suggest That Collagen Is Responsible for the Creep Behavior of Bone. J. Biomech. Eng. 1999, 121, 253–258. [Google Scholar] [CrossRef] [PubMed]
- Schoenfeld, C.M.; Lautenschlager, E.P.; Meyer, P.R. Mechanical Properties of Human Cancellous Bone in the Femoral Head. Med. Biol. Eng. 1974, 12, 313–317. [Google Scholar] [CrossRef] [PubMed]
- Rohlmann, A.; Zilch, H.; Bergmann, G.; Kölbel, R. Material Properties of Femoral Cancellous Bone in Axial Loading. Part I: Time Independent Properties. Arch. Orthop. Trauma Surg. 1980, 97, 95–102. [Google Scholar] [CrossRef] [PubMed]
- Zilch, H.; Rohlmann, A.; Bergmann, G.; Kölbel, R. Material Properties of Femoral Cancellous Bone in Axial Loading. Part II: Time Dependent Properties. Arch. Orthop. Trauma Surg. 1980, 97, 257–262. [Google Scholar] [CrossRef]
- Linde, F.; Hvid, I.; Pongsoipetch, B. Energy Absorptive Properties of Human Trabecular Bone Specimens during Axial Compression. J. Orthop. Res. 1989, 7, 432–439. [Google Scholar] [CrossRef]
- Lim, T.-H.; Hong, J.H. Poroelastic Model of Trabecular Bone in Uniaxial Strain Conditions. J. Musculoskelet. Res. 1998, 2, 167–180. [Google Scholar] [CrossRef]
- Cowin, S.C. Bone Poroelasticity. J. Biomech. 1999, 32, 217–238. [Google Scholar] [CrossRef] [PubMed]
- Kafka, V.; Jírová, J. A Structural Mathematical Model for the Viscoelastic Anisotropic Behaviour of Trabecular Bone. Biorheology 1983, 20, 795–805. [Google Scholar] [CrossRef] [PubMed]
- Deligianni, D.D.; Maris, A.; Missirlis, Y.F. Stress Relaxation Behaviour of Trabecular Bone Specimens. J. Biomech. 1994, 27, 1469–1476. [Google Scholar] [CrossRef] [PubMed]
- Biot, M.A. General Theory of Three-Dimensional Consolidation. J. Appl. Phys. 1941, 12, 155–164. [Google Scholar] [CrossRef]
- Schapery, R.A. On the Characterization of Nonlinear Viscoelastic Materials. Polym. Eng. Sci. 1969, 9, 295–310. [Google Scholar] [CrossRef]
- Taylor, R.L.; Pister, K.S.; Goudreau, G.L. Thermomechanical Analysis of Viscoelastic Solids. Int. J. Numer. Methods Eng. 1970, 2, 45–59. [Google Scholar] [CrossRef]
- Rice, J.R.; Cleary, M.P. Some Basic Stress Diffusion Solutions for Fluid-Saturated Elastic Porous Media with Compressible Constituents. Rev. Geophys. 1976, 14, 227. [Google Scholar] [CrossRef]
- Lai, J.; Bakker, A. An Integral Constitutive Equation for Nonlinear Plasto-Viscoelastic Behavior of High-Density Polyethylene. Polym. Eng. Sci. 1995, 35, 1339–1347. [Google Scholar] [CrossRef]
- Burstein, A.H.; Frankel, V.H. The Viscoelastic Properties of Some Biological Materials. Ann. N. Y. Acad. Sci. 1968, 146, 158–165. [Google Scholar] [CrossRef]
- Coletti, J.M.; Akeson, W.H.; Woo, S.L. A Comparison of the Physical Behavior of Normal Articular Cartilage and the Arthroplasty Surface. J. Bone Jt. Surg. Am. 1972, 54, 147–160. [Google Scholar] [CrossRef]
- Hayes, W.C.; Mockros, L.F. Viscoelastic Properties of Human Articular Cartilage. J. Appl. Physiol. 1971, 31, 562–568. [Google Scholar] [CrossRef] [PubMed]
- Mow, V.C.; Kuei, S.C.; Lai, W.M.; Armstrong, C.G. Biphasic Creep and Stress Relaxation of Articular Cartilage in Compression? Theory and Experiments. J. Biomech. Eng. 1980, 102, 73–84. [Google Scholar] [CrossRef] [PubMed]
- Simon, B.R. Multiphase Poroelastic Finite Element Models for Soft Tissue Structures. Appl. Mech. Rev. 1992, 45, 191–218. [Google Scholar] [CrossRef]
- Mow, V.C.; Ateshian, G.A.; Lai, W.M.; Gu, W.Y. Effects of Fixed Charges on the Stress–Relaxation Behavior of Hydrated Soft Tissues in a Confined Compression Problem. Int. J. Solids Struct. 1998, 35, 4945–4962. [Google Scholar] [CrossRef]
- Setton, L.A.; Zhu, W.; Mow, V.C. The Biphasic Poroviscoelastic Behavior of Articular Cartilage: Role of the Surface Zone in Governing the Compressive Behavior. J. Biomech. 1993, 26, 581–592. [Google Scholar] [CrossRef] [PubMed]
- Cohen, B.; Lai, W.M.; Mow, V.C. A Transversely Isotropic Biphasic Model for Unconfined Compression of Growth Plate and Chondroepiphysis. J. Biomech. Eng. 1998, 120, 491–496. [Google Scholar] [CrossRef] [PubMed]
- Bursać, P.M.; Obitz, T.W.; Eisenberg, S.R.; Stamenović, D. Confined and Unconfined Stress Relaxation of Cartilage: Appropriateness of a Transversely Isotropic Analysis. J. Biomech. 1999, 32, 1125–1130. [Google Scholar] [CrossRef] [PubMed]
- Hayes, W.C.; Bodine, A.J. Flow-Independent Viscoelastic Properties of Articular Cartilage Matrix. J. Biomech. 1978, 11, 407–419. [Google Scholar] [CrossRef]
- Mak, A.F. Unconfined Compression of Hydrated Viscoelastic Tissues: A Biphasic Poroviscoelastic Analysis. Biorheology 1986, 23, 371–383. [Google Scholar] [CrossRef]
- Suh, J.-K.; Bai, S. Finite Element Formulation of Biphasic Poroviscoelastic Model for Articular Cartilage. J. Biomech. Eng. 1998, 120, 195–201. [Google Scholar] [CrossRef] [PubMed]
- Maroudas, A.; Bayliss, M.T.; Venn, M.F. Further Studies on the Composition of Human Femoral Head Cartilage. Ann. Rheum. Dis. 1980, 39, 514–523. [Google Scholar] [CrossRef] [PubMed]
- Akizuki, S.; Mow, V.C.; Müller, F.; Pita, J.C.; Howell, D.S.; Manicourt, D.H. Tensile Properties of Human Knee Joint Cartilage: I. Influence of Ionic Conditions, Weight Bearing, and Fibrillation on the Tensile Modulus. J. Orthop. Res. 1986, 4, 379–392. [Google Scholar] [CrossRef] [PubMed]
- Lai, W.M.; Hou, J.S.; Mow, V.C. A Triphasic Theory for the Swelling and Deformation Behaviors of Articular Cartilage. J. Biomech. Eng. 1991, 113, 245–258. [Google Scholar] [CrossRef] [PubMed]
- Huyghe, J.M.; Janssen, J.D. Quadriphasic Mechanics of Swelling Incompressible Porous Media. Int. J. Eng. Sci. 1997, 35, 793–802. [Google Scholar] [CrossRef]
- Moher, D.; Liberati, A.; Tetzlaff, J.; Altman, D.G.; PRISMA Group. Preferred Reporting Items for Systematic Reviews and Meta-Analyses: The PRISMA Statement. PLoS Med. 2009, 6, e1000097. [Google Scholar] [CrossRef]
- Rezaei, J.; Wang, J.; Tavasszy, L. Linking Supplier Development to Supplier Segmentation Using Best Worst Method. Expert Syst. Appl. 2015, 42, 9152–9164. [Google Scholar] [CrossRef]
- Salimi, N. Quality Assessment of Scientific Outputs Using the BWM. Scientometrics 2017, 112, 195–213. [Google Scholar] [CrossRef] [PubMed]
- Kasaeian, A.; Roemer, F.W.; Ghotbi, E.; Ibad, H.A.; He, J.; Wan, M.; Zbijewski, W.B.; Guermazi, A.; Demehri, S. Subchondral Bone in Knee Osteoarthritis: Bystander or Treatment Target? Skeletal. Radiol. 2023, 52, 2069–2083. [Google Scholar] [CrossRef]
- Hamid, K.; LeDuc, R. Quality of Outcomes Research in Total Ankle Arthroplasty. Foot Ankle Clin. 2024, 29, 1–9. [Google Scholar] [CrossRef]
- Mow, V.C.; Gibbs, M.C.; Lai, W.M.; Zhu, W.B.; Athanasiou, K.A. Biphasic Indentation of Articular Cartilage–II. A Numerical Algorithm and an Experimental Study. J. Biomech. 1989, 22, 853–861. [Google Scholar] [CrossRef] [PubMed]
- Mak, A.F.; Lai, W.M.; Mow, V.C. Biphasic Indentation of Articular Cartilage–I. Theoretical Analysis. J. Biomech. 1987, 20, 703–714. [Google Scholar] [CrossRef]
- Korhonen, R.K.; Laasanen, M.S.; Töyräs, J.; Lappalainen, R.; Helminen, H.J.; Jurvelin, J.S. Fibril Reinforced Poroelastic Model Predicts Specifically Mechanical Behavior of Normal, Proteoglycan Depleted and Collagen Degraded Articular Cartilage. J. Biomech. 2003, 36, 1373–1379. [Google Scholar] [CrossRef] [PubMed]
- Li, L.P.; Soulhat, J.; Buschmann, M.D.; Shirazi-Adl, A. Nonlinear Analysis of Cartilage in Unconfined Ramp Compression Using a Fibril Reinforced Poroelastic Model. Clin. Biomech. 1999, 14, 673–682. [Google Scholar] [CrossRef] [PubMed]
- Soulhat, J.; Buschmann, M.D.; Shirazi-Adl, A. A Fibril-Network-Reinforced Biphasic Model of Cartilage in Unconfined Compression. J. Biomech. Eng. 1999, 121, 340–347. [Google Scholar] [CrossRef] [PubMed]
- Holmes, M.H.; Lai, W.M.; Mow, V.C. Singular Perturbation Analysis of the Nonlinear, Flow-Dependent Compressive Stress Relaxation Behavior of Articular Cartilage. J. Biomech. Eng. 1985, 107, 206–218. [Google Scholar] [CrossRef]
- Belluzzi, E.; Todros, S.; Pozzuoli, A.; Ruggieri, P.; Carniel, E.L.; Berardo, A. Human Cartilage Biomechanics: Experimental and Theoretical Approaches towards the Identification of Mechanical Properties in Healthy and Osteoarthritic Conditions. Processes 2023, 11, 1014. [Google Scholar] [CrossRef]
- Ebrahimi, M.; Ojanen, S.; Mohammadi, A.; Finnilä, M.A.; Joukainen, A.; Kröger, H.; Saarakkala, S.; Korhonen, R.K.; Tanska, P. Elastic, Viscoelastic and Fibril-Reinforced Poroelastic Material Properties of Healthy and Osteoarthritic Human Tibial Cartilage. Ann. Biomed. Eng. 2019, 47, 953–966. [Google Scholar] [CrossRef]
- Berni, M.; Erani, P.; Lopomo, N.F.; Baleani, M. Optimization of In Situ Indentation Protocol to Map the Mechanical Properties of Articular Cartilage. Materials 2022, 15, 6425. [Google Scholar] [CrossRef]
- Ebrahimi, M.; Turunen, M.J.; Finnilä, M.A.; Joukainen, A.; Kröger, H.; Saarakkala, S.; Korhonen, R.K.; Tanska, P. Structure-Function Relationships of Healthy and Osteoarthritic Human Tibial Cartilage: Experimental and Numerical Investigation. Ann. Biomed. Eng. 2020, 48, 2887–2900. [Google Scholar] [CrossRef]
- Sim, S.; Chevrier, A.; Garon, M.; Quenneville, E.; Lavigne, P.; Yaroshinsky, A.; Hoemann, C.D.; Buschmann, M.D. Electromechanical Probe and Automated Indentation Maps Are Sensitive Techniques in Assessing Early Degenerated Human Articular Cartilage. J. Orthop. Res. 2017, 35, 858–867. [Google Scholar] [CrossRef] [PubMed]
- Temple, M.M.; Bae, W.C.; Chen, M.Q.; Lotz, M.; Amiel, D.; Coutts, R.D.; Sah, R.L. Age- and Site-Associated Biomechanical Weakening of Human Articular Cartilage of the Femoral Condyle. Osteoarthr. Cartil. 2007, 15, 1042–1052. [Google Scholar] [CrossRef] [PubMed]
- Afara, I.O.; Hauta-Kasari, M.; Jurvelin, J.S.; Oloyede, A.; Töyräs, J. Optical Absorption Spectra of Human Articular Cartilage Correlate with Biomechanical Properties, Histological Score and Biochemical Composition. Physiol. Meas. 2015, 36, 1913–1928. [Google Scholar] [CrossRef] [PubMed]
- Rautiainen, J.; Nissi, M.J.; Salo, E.-N.; Tiitu, V.; Finnilä, M.A.J.; Aho, O.-M.; Saarakkala, S.; Lehenkari, P.; Ellermann, J.; Nieminen, M.T. Multiparametric MRI Assessment of Human Articular Cartilage Degeneration: Correlation with Quantitative Histology and Mechanical Properties. Magn. Reason. Med. 2015, 74, 249–259. [Google Scholar] [CrossRef] [PubMed]
- Liukkonen, J.; Hirvasniemi, J.; Joukainen, A.; Penttilä, P.; Virén, T.; Saarakkala, S.; Kröger, H.; Jurvelin, J.S.; Töyräs, J. Arthroscopic Ultrasound Technique for Simultaneous Quantitative Assessment of Articular Cartilage and Subchondral Bone: An in Vitro and in Vivo Feasibility Study. Ultrasound Med. Biol. 2013, 39, 1460–1468. [Google Scholar] [CrossRef] [PubMed]
- Sim, S.; Hadjab, I.; Garon, M.; Quenneville, E.; Lavigne, P.; Buschmann, M.D. Development of an Electromechanical Grade to Assess Human Knee Articular Cartilage Quality. Ann. Biomed. Eng. 2017, 45, 2410–2421. [Google Scholar] [CrossRef] [PubMed]
- Jeffrey, J.E.; Aspden, R.M. The Biophysical Effects of a Single Impact Load on Human and Bovine Articular Cartilage. Proc. Inst. Mech. Eng. H 2006, 220, 677–686. [Google Scholar] [CrossRef]
- Nebelung, S.; Post, M.; Raith, S.; Fischer, H.; Knobe, M.; Braun, B.; Prescher, A.; Tingart, M.; Thüring, J.; Bruners, P.; et al. Functional in Situ Assessment of Human Articular Cartilage Using MRI: A Whole-Knee Joint Loading Device. Biomech. Model. Mechanobiol. 2017, 16, 1971–1986. [Google Scholar] [CrossRef]
- Nebelung, S.; Sondern, B.; Jahr, H.; Tingart, M.; Knobe, M.; Thüring, J.; Kuhl, C.; Truhn, D. Non-Invasive T1ρ Mapping of the Human Cartilage Response to Loading and Unloading. Osteoarthr. Cartil. 2018, 26, 236–244. [Google Scholar] [CrossRef]
- Said, O.; Schock, J.; Abrar, D.B.; Schad, P.; Kuhl, C.; Nolte, T.; Knobe, M.; Prescher, A.; Truhn, D.; Nebelung, S. In-Situ Cartilage Functionality Assessment Based on Advanced MRI Techniques and Precise Compartmental Knee Joint Loading through Varus and Valgus Stress. Diagnostics 2021, 11, 1476. [Google Scholar] [CrossRef]
- Burgin, L.V.; Edelsten, L.; Aspden, R.M. The Mechanical and Material Properties of Elderly Human Articular Cartilage Subject to Impact and Slow Loading. Med. Eng. Phys. 2014, 36, 226–232. [Google Scholar] [CrossRef] [PubMed][Green Version]
- Wong, B.L.; Sah, R.L. Mechanical Asymmetry during Articulation of Tibial and Femoral Cartilages: Local and Overall Compressive and Shear Deformation and Properties. J. Biomech. 2010, 43, 1689–1695. [Google Scholar] [CrossRef] [PubMed]
- Deneweth, J.M.; Newman, K.E.; Sylvia, S.M.; McLean, S.G.; Arruda, E.M. Heterogeneity of Tibial Plateau Cartilage in Response to a Physiological Compressive Strain Rate. J. Orthop. Res. 2013, 31, 370–375. [Google Scholar] [CrossRef] [PubMed]
- Kurkijärvi, J.E.; Nissi, M.J.; Kiviranta, I.; Jurvelin, J.S.; Nieminen, M.T. Delayed Gadolinium-Enhanced MRI of Cartilage (dGEMRIC) and T2 Characteristics of Human Knee Articular Cartilage: Topographical Variation and Relationships to Mechanical Properties. Magn. Reason. Med. 2004, 52, 41–46. [Google Scholar] [CrossRef]
- Griebel, A.J.; Trippel, S.B.; Neu, C.P. Noninvasive dualMRI-Based Strains Vary by Depth and Region in Human Osteoarthritic Articular Cartilage. Osteoarthr. Cartil. 2013, 21, 394–400. [Google Scholar] [CrossRef]
- Chokhandre, S.; Erdemir, A. A Comprehensive Testing Protocol for Macro-Scale Mechanical Characterization of Knee Articular Cartilage with Documented Experimental Repeatability. J. Mech. Behav. Biomed. Mater. 2020, 112, 104025. [Google Scholar] [CrossRef] [PubMed]
- Hatcher, C.C.; Collins, A.T.; Kim, S.Y.; Michel, L.C.; Mostertz, W.C.; Ziemian, S.N.; Spritzer, C.E.; Guilak, F.; DeFrate, L.E.; McNulty, A.L. Relationship between T1rho Magnetic Resonance Imaging, Synovial Fluid Biomarkers, and the Biochemical and Biomechanical Properties of Cartilage. J. Biomech. 2017, 55, 18–26. [Google Scholar] [CrossRef] [PubMed]
- Heckelman, L.N.; Smith, W.A.R.; Riofrio, A.D.; Vinson, E.N.; Collins, A.T.; Gwynn, O.R.; Utturkar, G.M.; Goode, A.P.; Spritzer, C.E.; DeFrate, L.E. Quantifying the Biochemical State of Knee Cartilage in Response to Running Using T1rho Magnetic Resonance Imaging. Sci. Rep. 2020, 10, 1870. [Google Scholar] [CrossRef]
- Keenan, K.E.; Kourtis, L.C.; Besier, T.F.; Lindsey, D.P.; Gold, G.E.; Delp, S.L.; Beaupre, G.S. New Resource for the Computation of Cartilage Biphasic Material Properties with the Interpolant Response Surface Method. Methods Biomech. Biomed. Eng. 2009, 12, 415–422. [Google Scholar] [CrossRef][Green Version]
- Mäkelä, J.T.A.; Huttu, M.R.J.; Korhonen, R.K. Structure-Function Relationships in Osteoarthritic Human Hip Joint Articular Cartilage. Osteoarthr. Cartil. 2012, 20, 1268–1277. [Google Scholar] [CrossRef]
- Sim, S.; Chevrier, A.; Garon, M.; Quenneville, E.; Yaroshinsky, A.; Hoemann, C.D.; Buschmann, M.D. Non-Destructive Electromechanical Assessment (Arthro-BST) of Human Articular Cartilage Correlates with Histological Scores and Biomechanical Properties. Osteoarthr. Cartil. 2014, 22, 1926–1935. [Google Scholar] [CrossRef] [PubMed]
- Robinson, D.L.; Kersh, M.E.; Walsh, N.C.; Ackland, D.C.; de Steiger, R.N.; Pandy, M.G. Mechanical Properties of Normal and Osteoarthritic Human Articular Cartilage. J. Mech. Behav. Biomed. Mater. 2016, 61, 96–109. [Google Scholar] [CrossRef] [PubMed]
- Henak, C.R.; Kapron, A.L.; Anderson, A.E.; Ellis, B.J.; Maas, S.A.; Weiss, J.A. Specimen-Specific Predictions of Contact Stress under Physiological Loading in the Human Hip: Validation and Sensitivity Studies. Biomech. Model. Mechanobiol. 2014, 13, 387–400. [Google Scholar] [CrossRef] [PubMed]
- Khajehsaeid, H.; Abdollahpour, Z. Progressive Deformation-Induced Degradation of Knee Articular Cartilage and Osteoarthritis. J. Biomech. 2020, 111, 109995. [Google Scholar] [CrossRef] [PubMed]
- Pavan, T.Z.; Madsen, E.L.; Frank, G.R.; Adilton O. Carneiro, A.; Hall, T.J. Nonlinear Elastic Behavior of Phantom Materials for Elastography. Phys. Med. Biol. 2010, 55, 2679–2692. [Google Scholar] [CrossRef] [PubMed]
- Dwivedi, K.K.; Lakhani, P.; Kumar, S.; Kumar, N. A Hyperelastic Model to Capture the Mechanical Behaviour and Histological Aspects of the Soft Tissues. J. Mech. Behav. Biomed. Mater. 2022, 126, 105013. [Google Scholar] [CrossRef] [PubMed]
- Destrade, M.; Ní Annaidh, A.; Coman, C.D. Bending Instabilities of Soft Biological Tissues. Int. J. Solids Struct. 2009, 46, 4322–4330. [Google Scholar] [CrossRef]
- Thambyah, A.; Nather, A.; Goh, J. Mechanical Properties of Articular Cartilage Covered by the Meniscus. Osteoarthr. Cartil. 2006, 14, 580–588. [Google Scholar] [CrossRef] [PubMed]
- Barker, M.K.; Seedhom, B.B. The Relationship of the Compressive Modulus of Articular Cartilage with Its Deformation Response to Cyclic Loading: Does Cartilage Optimize Its Modulus so as to Minimize the Strains Arising in It Due to the Prevalent Loading Regime? Rheumatology 2001, 40, 274–284. [Google Scholar] [CrossRef]
- Richard, F.; Villars, M.; Thibaud, S. Viscoelastic Modeling and Quantitative Experimental Characterization of Normal and Osteoarthritic Human Articular Cartilage Using Indentation. J. Mech. Behav. Biomed. Mater. 2013, 24, 41–52. [Google Scholar] [CrossRef]
- Temple, D.K.; Cederlund, A.A.; Lawless, B.M.; Aspden, R.M.; Espino, D.M. Viscoelastic Properties of Human and Bovine Articular Cartilage: A Comparison of Frequency-Dependent Trends. BMC Musculoskelet. Disord. 2016, 17, 419. [Google Scholar] [CrossRef]
- Milz, S.; Putz, R. Quantitative Morphology of the Subchondral Plate of the Tibial Plateau. J. Anat. 1994, 185 Pt 1, 103–110. [Google Scholar]
- Brown, T.D.; Vrahas, M.S. The Apparent Elastic Modulus of the Juxtarticular Subchondral Bone of the Femoral Head. J. Orthop. Res. 1984, 2, 32–38. [Google Scholar] [CrossRef] [PubMed]
- Choi, K.; Kuhn, J.L.; Ciarelli, M.J.; Goldstein, S.A. The Elastic Moduli of Human Subchondral, Trabecular, and Cortical Bone Tissue and the Size-Dependency of Cortical Bone Modulus. J. Biomech. 1990, 23, 1103–1113. [Google Scholar] [CrossRef] [PubMed]
- Li, B.; Aspden, R.M. Mechanical and Material Properties of the Subchondral Bone Plate from the Femoral Head of Patients with Osteoarthritis or Osteoporosis. Ann. Rheum. Dis. 1997, 56, 247–254. [Google Scholar] [CrossRef] [PubMed]
- Gardner-Morse, M.G.; Tacy, N.J.; Beynnon, B.D.; Roemhildt, M.L. In Situ Microindentation for Determining Local Subchondral Bone Compressive Modulus. J. Biomech. Eng. 2010, 132, 094502. [Google Scholar] [CrossRef] [PubMed]
- Oliver, W.C.; Pharr, G.M. An Improved Technique for Determining Hardness and Elastic Modulus Using Load and Displacement Sensing Indentation Experiments. J. Mater. Res. 1992, 7, 1564–1583. [Google Scholar] [CrossRef]
- Ferguson, V.L.; Bushby, A.J.; Boyde, A. Nanomechanical Properties and Mineral Concentration in Articular Calcified Cartilage and Subchondral Bone. J. Anat. 2003, 203, 191–202. [Google Scholar] [CrossRef]
- Renault, J.-B.; Carmona, M.; Tzioupis, C.; Ollivier, M.; Argenson, J.-N.; Parratte, S.; Chabrand, P. Tibial Subchondral Trabecular Bone Micromechanical and Microarchitectural Properties Are Affected by Alignment and Osteoarthritis Stage. Sci. Rep. 2020, 10, 3975. [Google Scholar] [CrossRef]
- Li, G.; Yin, J.; Gao, J.; Cheng, T.S.; Pavlos, N.J.; Zhang, C.; Zheng, M.H. Subchondral Bone in Osteoarthritis: Insight into Risk Factors and Microstructural Changes. Arthritis Res. Ther. 2013, 15, 223. [Google Scholar] [CrossRef]
- Burr, D.B.; Gallant, M.A. Bone Remodelling in Osteoarthritis. Nat. Rev. Rheumatol. 2012, 8, 665–673. [Google Scholar] [CrossRef] [PubMed]
- Gibson, L.J. The Mechanical Behaviour of Cancellous Bone. J. Biomech. 1985, 18, 317–328. [Google Scholar] [CrossRef] [PubMed]
- Augat, P.; Link, T.; Lang, T.F.; Lin, J.C.; Majumdar, S.; Genant, H.K. Anisotropy of the Elastic Modulus of Trabecular Bone Specimens from Different Anatomical Locations. Med. Eng. Phys. 1998, 20, 124–131. [Google Scholar] [CrossRef] [PubMed]
- Harrigan, T.P.; Mann, R.W. Characterization of Microstructural Anisotropy in Orthotropic Materials Using a Second Rank Tensor. J. Mater. Sci. 1984, 19, 761–767. [Google Scholar] [CrossRef]
- Cowin, S.C. The Relationship between the Elasticity Tensor and the Fabric Tensor. Mech. Mater. 1985, 4, 137–147. [Google Scholar] [CrossRef]
- Odgaard, A.; Jensen, E.B.; Gundersen, H.J. Estimation of Structural Anisotropy Based on Volume Orientation. A New Concept. J. Microsc. 1990, 157, 149–162. [Google Scholar] [CrossRef] [PubMed]
- Cruz-Orive, L.M.; Karlsson, L.M.; Larsen, S.E.; Wainschtein, F. Characterizing Anisotropy: A New Concept. Micron Microsc. Acta 1992, 23, 75–76. [Google Scholar] [CrossRef]
- Zysset, P.K.; Curnier, A. An Alternative Model for Anisotropic Elasticity Based on Fabric Tensors. Mech. Mater. 1995, 21, 243–250. [Google Scholar] [CrossRef]
- Ashman, R.B.; Rho, J.Y.; Turner, C.H. Anatomical Variation of Orthotropic Elastic Moduli of the Proximal Human Tibia. J. Biomech. 1989, 22, 895–900. [Google Scholar] [CrossRef]
- Turner, C.H.; Cowin, S.C.; Rho, J.Y.; Ashman, R.B.; Rice, J.C. The Fabric Dependence of the Orthotropic Elastic Constants of Cancellous Bone. J. Biomech. 1990, 23, 549–561. [Google Scholar] [CrossRef]
- Zysset, P.K.; Goulet, R.W.; Hollister, S.J. A Global Relationship between Trabecular Bone Morphology and Homogenized Elastic Properties. J. Biomech. Eng. 1998, 120, 640–646. [Google Scholar] [CrossRef] [PubMed]
- Odgaard, A.; Kabel, J.; van Rietbergen, B.; Dalstra, M.; Huiskes, R. Fabric and Elastic Principal Directions of Cancellous Bone Are Closely Related. J. Biomech. 1997, 30, 487–495. [Google Scholar] [CrossRef] [PubMed]
- Birnbaum, K.; Sindelar, R.; Gaertner, J.R.; Wirtz, D.C. Material Properties of Trabecular Bone Structures. Surg. Radiol. Anat. 2001, 23, 399–407. [Google Scholar] [CrossRef] [PubMed]
- Pattijn, V.; Van Cleynenbreugel, T.; Vander Sloten, J.; Van Audekercke, R.; Van der Perre, G.; Wevers, M. Structural and Radiological Parameters for the Nondestructive Characterization of Trabecular Bone. Ann. Biomed. Eng. 2001, 29, 1064–1073. [Google Scholar] [CrossRef] [PubMed]
- Morgan, E.F.; Bayraktar, H.H.; Keaveny, T.M. Trabecular Bone Modulus-Density Relationships Depend on Anatomic Site. J. Biomech. 2003, 36, 897–904. [Google Scholar] [CrossRef] [PubMed]
- Ohman, C.; Baleani, M.; Perilli, E.; Dall’Ara, E.; Tassani, S.; Baruffaldi, F.; Viceconti, M. Mechanical Testing of Cancellous Bone from the Femoral Head: Experimental Errors Due to off-Axis Measurements. J. Biomech. 2007, 40, 2426–2433. [Google Scholar] [CrossRef] [PubMed]
- Lancianese, S.L.; Kwok, E.; Beck, C.A.; Lerner, A.L. Predicting Regional Variations in Trabecular Bone Mechanical Properties within the Human Proximal Tibia Using MR Imaging. Bone 2008, 43, 1039–1046. [Google Scholar] [CrossRef] [PubMed]
- Schwiedrzik, J.J.; Kaudela, K.-H.; Burner, U.; Zysset, P.K. Fabric-Mechanical Property Relationships of Trabecular Bone Allografts Are Altered by Supercritical CO2 Treatment and Gamma Sterilization. Bone 2011, 48, 1370–1377. [Google Scholar] [CrossRef]
- Karim, L.; Vashishth, D. Role of Trabecular Microarchitecture in the Formation, Accumulation, and Morphology of Microdamage in Human Cancellous Bone. J. Orthop. Res. 2011, 29, 1739–1744. [Google Scholar] [CrossRef]
- Karim, L.; Vashishth, D. Heterogeneous Glycation of Cancellous Bone and Its Association with Bone Quality and Fragility. PLoS ONE 2012, 7, e35047. [Google Scholar] [CrossRef]
- Rodrigues, A.M.; Caetano-Lopes, J.; Vale, A.C.; Aleixo, I.; Pena, A.S.; Faustino, A.; Sepriano, A.; Polido-Pereira, J.; Vieira-Sousa, E.; Lucas, R.; et al. Smoking Is a Predictor of Worse Trabecular Mechanical Performance in Hip Fragility Fracture Patients. J. Bone Miner. Metab. 2012, 30, 692–699. [Google Scholar] [CrossRef]
- Zhou, B.; Liu, X.S.; Wang, J.; Lu, X.L.; Fields, A.J.; Guo, X.E. Dependence of Mechanical Properties of Trabecular Bone on Plate-Rod Microstructure Determined by Individual Trabecula Segmentation (ITS). J. Biomech. 2014, 47, 702–708. [Google Scholar] [CrossRef] [PubMed][Green Version]
- Chen, C.; Zhang, X.; Guo, J.; Jin, D.; Letuchy, E.M.; Burns, T.L.; Levy, S.M.; Hoffman, E.A.; Saha, P.K. Quantitative Imaging of Peripheral Trabecular Bone Microarchitecture Using MDCT. Med. Phys. 2018, 45, 236–249. [Google Scholar] [CrossRef] [PubMed]
- Yadav, R.N.; Sihota, P.; Uniyal, P.; Neradi, D.; Bose, J.C.; Dhiman, V.; Karn, S.; Sharma, S.; Aggarwal, S.; Goni, V.G.; et al. Prediction of Mechanical Properties of Trabecular Bone in Patients with Type 2 Diabetes Using Damage Based Finite Element Method. J. Biomech. 2021, 123, 110495. [Google Scholar] [CrossRef] [PubMed]
- Novitskaya, E.; Zin, C.; Chang, N.; Cory, E.; Chen, P.; D’Lima, D.; Sah, R.L.; McKittrick, J. Creep of Trabecular Bone from the Human Proximal Tibia. Mater. Sci. Eng. C Mater. Biol. Appl. 2014, 40, 219–227. [Google Scholar] [CrossRef] [PubMed]
- Maquer, G.; Musy, S.N.; Wandel, J.; Gross, T.; Zysset, P.K. Bone Volume Fraction and Fabric Anisotropy Are Better Determinants of Trabecular Bone Stiffness than Other Morphological Variables. J. Bone Miner. Res. 2015, 30, 1000–1008. [Google Scholar] [CrossRef] [PubMed]
- Ciarelli, M.J.; Goldstein, S.A.; Kuhn, J.L.; Cody, D.D.; Brown, M.B. Evaluation of Orthogonal Mechanical Properties and Density of Human Trabecular Bone from the Major Metaphyseal Regions with Materials Testing and Computed Tomography. J. Orthop. Res. 1991, 9, 674–682. [Google Scholar] [CrossRef]
- Morgan, E.F.; Unnikrisnan, G.U.; Hussein, A.I. Bone Mechanical Properties in Healthy and Diseased States. Annu. Rev. Biomed. Eng. 2018, 20, 119–143. [Google Scholar] [CrossRef] [PubMed]
- Singer, B.R.; McLauchlan, G.J.; Robinson, C.M.; Christie, J. Epidemiology of Fractures in 15,000 Adults: The Influence of Age and Gender. J. Bone Jt. Surg. 1998, 80, 243–248. [Google Scholar] [CrossRef]
- Dall’Ara, E.; Ohman, C.; Baleani, M.; Viceconti, M. The Effect of Tissue Condition and Applied Load on Vickers Hardness of Human Trabecular Bone. J. Biomech. 2007, 40, 3267–3270. [Google Scholar] [CrossRef]
- Starup-Linde, J.; Vestergaard, P. Biochemical Bone Turnover Markers in Diabetes Mellitus—A Systematic Review. Bone 2016, 82, 69–78. [Google Scholar] [CrossRef] [PubMed]
- Picke, A.-K.; Campbell, G.; Napoli, N.; Hofbauer, L.C.; Rauner, M. Update on the Impact of Type 2 Diabetes Mellitus on Bone Metabolism and Material Properties. Endocr. Connect. 2019, 8, R55–R70. [Google Scholar] [CrossRef]
- Holstein, J.H.; Herrmann, M.; Splett, C.; Herrmann, W.; Garcia, P.; Histing, T.; Klein, M.; Kurz, K.; Siebel, T.; Pohlemann, T.; et al. Hyperhomocysteinemia Is Not Associated with Reduced Bone Quality in Humans with Hip Osteoarthritis. Clin. Chem. Lab. Med. 2010, 48, 821–827. [Google Scholar] [CrossRef] [PubMed]
- Steines, D.; Liew, S.-W.; Arnaud, C.; Vargas-Voracek, R.; Nazarian, A.; Müller, R.; Snyder, B.; Hess, P.; Lang, P. Radiographic Trabecular 2D and 3D Parameters of Proximal Femoral Bone Cores Correlate with Each Other and with Yield Stress. Osteoporos. Int. 2009, 20, 1929–1938. [Google Scholar] [CrossRef] [PubMed]
- Cyganik, Ł.; Binkowski, M.; Kokot, G.; Cyganik, P.; Rusin, T.; Bolechała, F.; Nowak, R.; Wróbel, Z.; John, A. Microscale’s Relationship between Young’s Modulus and Tissue Density. Prediction of Displacements. Comput. Methods Biomech. Biomed. Eng. 2017, 20, 1658–1668. [Google Scholar] [CrossRef] [PubMed]
- Marinozzi, F.; Bini, F.; Marinozzi, A. Evidence of Entropic Elasticity of Human Bone Trabeculae at Low Strains. J. Biomech. 2011, 44, 988–991. [Google Scholar] [CrossRef] [PubMed]
- Pedersen, D.R.; Goetz, J.E.; Kurriger, G.L.; Martin, J.A. Comparative Digital Cartilage Histology for Human and Common Osteoarthritis Models. Orthop. Res. Rev. 2013, 2013, 13–20. [Google Scholar] [CrossRef] [PubMed]
- Changoor, A.; Tran-Khanh, N.; Méthot, S.; Garon, M.; Hurtig, M.B.; Shive, M.S.; Buschmann, M.D. A Polarized Light Microscopy Method for Accurate and Reliable Grading of Collagen Organization in Cartilage Repair. Osteoarthr. Cartil. 2011, 19, 126–135. [Google Scholar] [CrossRef] [PubMed]
- Honkanen, M.K.M.; Mohammadi, A.; Te Moller, N.C.R.; Ebrahimi, M.; Xu, W.; Plomp, S.; Pouran, B.; Lehto, V.-P.; Brommer, H.; van Weeren, P.R.; et al. Dual-Contrast Micro-CT Enables Cartilage Lesion Detection and Tissue Condition Evaluation Ex Vivo. Equine Vet. J. 2023, 55, 315–324. [Google Scholar] [CrossRef]
- Nam, S.Y.; Ricles, L.M.; Suggs, L.J.; Emelianov, S.Y. Imaging Strategies for Tissue Engineering Applications. Tissue Eng. Part B Rev. 2015, 21, 88–102. [Google Scholar] [CrossRef]
- Matzat, S.J.; van Tiel, J.; Gold, G.E.; Oei, E.H.G. Quantitative MRI Techniques of Cartilage Composition. Quant. Imaging Med. Surg. 2013, 3, 162–174. [Google Scholar] [CrossRef]
- Grondin, M.M.; Liu, F.; Vignos, M.F.; Samsonov, A.; Li, W.-J.; Kijowski, R.; Henak, C.R. Bi-Component T2 Mapping Correlates with Articular Cartilage Material Properties. J. Biomech. 2021, 116, 110215. [Google Scholar] [CrossRef] [PubMed]
- Truhn, D.; Brill, N.; Braun, B.; Merhof, D.; Kuhl, C.; Knobe, M.; Thüring, J.; Nebelung, S. A Multi-Purpose Force-Controlled Loading Device for Cartilage and Meniscus Functionality Assessment Using Advanced MRI Techniques. J. Mech. Behav. Biomed. Mater. 2020, 101, 103428. [Google Scholar] [CrossRef] [PubMed]
- Mahmoodian, R.; Leasure, J.; Philip, P.; Pleshko, N.; Capaldi, F.; Siegler, S. Changes in Mechanics and Composition of Human Talar Cartilage Anlagen during Fetal Development. Osteoarthr. Cartil. 2011, 19, 1199–1209. [Google Scholar] [CrossRef] [PubMed]
- Unal, M.; Akkus, O.; Sun, J.; Cai, L.; Erol, U.L.; Sabri, L.; Neu, C.P. Raman Spectroscopy-Based Water Content Is a Negative Predictor of Articular Human Cartilage Mechanical Function. Osteoarthr. Cartil. 2019, 27, 304–313. [Google Scholar] [CrossRef] [PubMed]
- Ma, S.; Boughton, O.; Karunaratne, A.; Jin, A.; Cobb, J.; Hansen, U.; Abel, R. Synchrotron Imaging Assessment of Bone Quality. Clin. Rev. Bone Miner. Metab. 2016, 14, 150–160. [Google Scholar] [CrossRef] [PubMed]
- Schulte, F.A.; Christen, P.; Badilatti, S.D.; Parkinson, I.; Khosla, S.; Goldhahn, J.; Müller, R. Virtual Supersampling as Post-Processing Step Preserves the Trabecular Bone Morphometry in Human Peripheral Quantitative Computed Tomography Scans. PLoS ONE 2019, 14, e0212280. [Google Scholar] [CrossRef] [PubMed]
- Mys, K.; Stockmans, F.; Gueorguiev, B.; Wyers, C.E.; van den Bergh, J.P.W.; van Lenthe, G.H.; Varga, P. Adaptive Local Thresholding Can Enhance the Accuracy of HR-pQCT-Based Trabecular Bone Morphology Assessment. Bone 2022, 154, 116225. [Google Scholar] [CrossRef]
- Larrue, A.; Rattner, A.; Peter, Z.-A.; Olivier, C.; Laroche, N.; Vico, L.; Peyrin, F. Synchrotron Radiation Micro-CT at the Micrometer Scale for the Analysis of the Three-Dimensional Morphology of Microcracks in Human Trabecular Bone. PLoS ONE 2011, 6, e21297. [Google Scholar] [CrossRef]
- Lowitz, T.; Museyko, O.; Bousson, V.; Chappard, C.; Laouisset, L.; Laredo, J.-D.; Engelke, K. Advanced Knee Structure Analysis (AKSA): A Comparison of Bone Mineral Density and Trabecular Texture Measurements Using Computed Tomography and High-Resolution Peripheral Quantitative Computed Tomography of Human Knee Cadavers. Arthritis Res. Ther. 2017, 19, 1. [Google Scholar] [CrossRef]
- Amini, M.; Nazemi, S.M.; Lanovaz, J.L.; Kontulainen, S.; Masri, B.A.; Wilson, D.R.; Szyszkowski, W.; Johnston, J.D. Individual and Combined Effects of OA-Related Subchondral Bone Alterations on Proximal Tibial Surface Stiffness: A Parametric Finite Element Modeling Study. Med. Eng. Phys. 2015, 37, 783–791. [Google Scholar] [CrossRef] [PubMed]
- Patel, V.; Issever, A.S.; Burghardt, A.; Laib, A.; Ries, M.; Majumdar, S. MicroCT Evaluation of Normal and Osteoarthritic Bone Structure in Human Knee Specimens. J. Orthop. Res. 2003, 21, 6–13. [Google Scholar] [CrossRef] [PubMed]
- Clark, J.N.; Tavana, S.; Clark, B.; Briggs, T.; Jeffers, J.R.T.; Hansen, U. High Resolution Three-Dimensional Strain Measurements in Human Articular Cartilage. J. Mech. Behav. Biomed. Mater. 2021, 124, 104806. [Google Scholar] [CrossRef] [PubMed]
- Väänänen, S.P.; Amin Yavari, S.; Weinans, H.; Zadpoor, A.A.; Jurvelin, J.S.; Isaksson, H. Repeatability of Digital Image Correlation for Measurement of Surface Strains in Composite Long Bones. J. Biomech. 2013, 46, 1928–1932. [Google Scholar] [CrossRef] [PubMed]
- Gillard, F.; Boardman, R.; Mavrogordato, M.; Hollis, D.; Sinclair, I.; Pierron, F.; Browne, M. The Application of Digital Volume Correlation (DVC) to Study the Microstructural Behaviour of Trabecular Bone during Compression. J. Mech. Behav. Biomed. Mater. 2014, 29, 480–499. [Google Scholar] [CrossRef] [PubMed]
- Dall’Ara, E.; Tozzi, G. Digital Volume Correlation for the Characterization of Musculoskeletal Tissues: Current Challenges and Future Developments. Front. Bioeng. Biotechnol. 2022, 10, 1010056. [Google Scholar] [CrossRef]
- Yan, L.; Cinar, A.; Ma, S.; Abel, R.; Hansen, U.; Marrow, T.J. A Method for Fracture Toughness Measurement in Trabecular Bone Using Computed Tomography, Image Correlation and Finite Element Methods. J. Mech. Behav. Biomed. Mater. 2020, 109, 103838. [Google Scholar] [CrossRef]
- Madi, K.; Staines, K.A.; Bay, B.K.; Javaheri, B.; Geng, H.; Bodey, A.J.; Cartmell, S.; Pitsillides, A.A.; Lee, P.D. In Situ Characterization of Nanoscale Strains in Loaded Whole Joints via Synchrotron X-ray Tomography. Nat. Biomed. Eng. 2020, 4, 343–354. [Google Scholar] [CrossRef]
- Tavana, S.; N. Clark, J.; Newell, N.; Calder, J.D.; Hansen, U. In Vivo Deformation and Strain Measurements in Human Bone Using Digital Volume Correlation (DVC) and 3T Clinical MRI. Materials 2020, 13, 5354. [Google Scholar] [CrossRef]
- Dall’Ara, E.; Peña-Fernández, M.; Palanca, M.; Giorgi, M.; Cristofolini, L.; Tozzi, G. Precision of Digital Volume Correlation Approaches for Strain Analysis in Bone Imaged with Micro-Computed Tomography at Different Dimensional Levels. Front. Mater. 2017, 4, 31. [Google Scholar] [CrossRef]
- Clark, J.N.; Garbout, A.; Ferreira, S.A.; Javaheri, B.; Pitsillides, A.A.; Rankin, S.M.; Jeffers, J.R.T.; Hansen, U. Propagation Phase-Contrast Micro-Computed Tomography Allows Laboratory-Based Three-Dimensional Imaging of Articular Cartilage down to the Cellular Level. Osteoarthr. Cartil. 2020, 28, 102–111. [Google Scholar] [CrossRef] [PubMed]
- Davis, S.; Karali, A.; Zekonyte, J.; Roldo, M.; Blunn, G. Development of a Method to Investigate Strain Distribution across the Cartilage-Bone Interface in Guinea Pig Model of Spontaneous Osteoarthritis Using Lab-Based Contrast Enhanced X-ray-Computed Tomography and Digital Volume Correlation. J. Mech. Behav. Biomed. Mater. 2023, 144, 105999. [Google Scholar] [CrossRef] [PubMed]
- Horng, A.; Stroebel, J.; Geith, T.; Milz, S.; Pacureanu, A.; Yang, Y.; Cloetens, P.; Lovric, G.; Mittone, A.; Bravin, A.; et al. Multiscale X-Ray Phase Contrast Imaging of Human Cartilage for Investigating Osteoarthritis Formation. J. Biomed. Sci. 2021, 28, 42. [Google Scholar] [CrossRef] [PubMed]
- Fowkes, M.M.; Das Neves Borges, P.; Cacho-Nerin, F.; Brennan, P.E.; Vincent, T.L.; Lim, N.H. Imaging Articular Cartilage in Osteoarthritis Using Targeted Peptide Radiocontrast Agents. PLoS ONE 2022, 17, e0268223. [Google Scholar] [CrossRef] [PubMed]
- Page, M.J.; McKenzie, J.E.; Bossuyt, P.M.; Boutron, I.; Hoffmann, T.C.; Mulrow, C.D.; Shamseer, L.; Tetzlaff, J.M.; Akl, E.A.; Brennan, S.E.; et al. The PRISMA 2020 statement: An updated guideline for reporting systematic reviews. BMJ 2021, 372, n71. [Google Scholar] [CrossRef]
- Hunter, D.J.; March, L.; Chew, M. Osteoarthritis in 2020 and beyond: A Lancet Commission. Lancet 2020, 396, 1711–1712. [Google Scholar] [CrossRef] [PubMed]
- Long, H.; Liu, Q.; Yin, H.; Wang, K.; Diao, N.; Zhang, Y.; Lin, J.; Guo, A. Prevalence Trends of Site-Specific Osteoarthritis From 1990 to 2019: Findings from the Global Burden of Disease Study 2019. Arthritis Rheumatol. 2022, 74, 1172–1183. [Google Scholar] [CrossRef] [PubMed]
- Wu, D.; Wong, P.; Guo, C.; Tam, L.-S.; Gu, J. Pattern and Trend of Five Major Musculoskeletal Disorders in China from 1990 to 2017: Findings from the Global Burden of Disease Study 2017. BMC Med. 2021, 19, 34. [Google Scholar] [CrossRef] [PubMed]
- Jin, Z.; Wang, D.; Zhang, H.; Liang, J.; Feng, X.; Zhao, J.; Sun, L. Incidence Trend of Five Common Musculoskeletal Disorders from 1990 to 2017 at the Global, Regional and National Level: Results from the Global Burden of Disease Study 2017. Ann. Rheum. Dis. 2020, 79, 1014–1022. [Google Scholar] [CrossRef]
- Rezaei, J.; Nispeling, T.; Sarkis, J.; Tavasszy, L. A Supplier Selection Life Cycle Approach Integrating Traditional and Environmental Criteria Using the Best Worst Method. J. Clean. Prod. 2016, 135, 577–588. [Google Scholar] [CrossRef]


| Insight | Description |
|---|---|
| Reference | Title and publication year |
| Joint | Anatomical site/s—i.e., hip, knee, or ankle—from which tissue samples were excised |
| Tissue | Type/s of tissue/s—i.e., AC, SB, TB—evaluated |
| Type of study | Modelling, i.e., a study proposing a new constitutive model or updating an existing one, moreover providing an experimental application |
| Methodological, i.e., a study proposing a new experimental approach, or evaluating how the tissues’ response varies depending on the testing parameters | |
| Investigative, i.e., a study evaluating the mechanical parameter/s of tissue/s by investigating distribution across the sample geometry, or a dependence on joint/s or on donor/s | |
| Comparative, i.e., a study investigating how a pathological disease, or a specific treatment, modifies the mechanical response of tissue/s compared to control/healthy condition | |
| Layers | Whether a study focused on single tissues or evaluated the mechanical behaviour of the whole osteochondral unit. The latter option means that the mechanical behaviour of multiple layers was investigated and modelled simultaneously |
| Mechanical test | Type of experimental approach applied to investigate tissue behaviour, e.g., compression, indentation, tensile, and shear test |
| Dimensional scale | Scale—i.e., millimetric, mm; micrometric, um; and/or nanometric, nm—at which the mechanical behaviour of tissue/s was evaluated |
| Constitutive model/s | Mathematical model/s used to compute the mechanical parameters of tissue/s; moreover, type and numerosity of such parameters were also retrieved |
| Mechanical properties | Values of the mechanical parameters, strictly dependent on the constitutive model used to fit the experimental data, e.g., Young’s modulus (elastic), creep (viscous), shear storage modulus (dynamic), dissipated energy (plastic behaviour). Moreover, the numerosity of the computed parameters was also noted. |
| Data processing | Highlights presence and reliability of statistical data analysis. Meaning of the analysis depends on the type of study, as follows: goodness of fit for modelling studies; accuracy and precision of a method for methodological studies; and benchmarking and power analysis for comparative and investigative studies |
| Reference | Type of Study | Pathology | Joint | Anatomical Position | Experimental Technique (Mode) | Dimensional Scale | Model | Apparent Elastic Modulus (GPa) | Tissue Elastic Modulus (GPa) | Tissue Hardness (GPa) | Condition |
|---|---|---|---|---|---|---|---|---|---|---|---|
| Ferguson et al. [129] | Co | OA | H | Femoral Head | Indentation | µm | EP | - | 16.2–24.0 | - | No reported cartilage damage |
| Ferguson et al. [129] | Co | OA | H | Femoral Head | Indentation | µm | EP | - | 15.7–21.1 | 0.5–0.9 * | Severe cartilage damage |
| Peters et al. [16] | Co | OA; Aging | K | Femoral Condyle; Tibial Plateau | Indentation | µm | LE | - | 12.56 ± 0.50 * | 0.01–1.27 | ICRS grade 0 |
| Peters et al. [16] | Co | OA; Aging | K | Femoral Condyle; Tibial Plateau | Indentation | µm | LE | - | 13.68 ± 0.60 * | 0.01–1.27 | ICRS grade 1 |
| Peters et al. [16] | Co | OA; Aging | K | Femoral Condyle; Tibial Plateau | Indentation | µm | LE | - | 14.05 ± 0.70 * | 0.01–1.27 | ICRS grade 2 |
| Peters et al. [16] | Co | OA; Aging | K | Femoral Condyle; Tibial Plateau | Indentation | µm | LE | - | 13.60 ± 1.00 * | 0.01–1.27 | ICRS grade 3 |
| Peters et al. [16] | Co | OA; Aging | K | Femoral Condyle; Tibial Plateau | Indentation | µm | LE | - | 17.20 ± 2.00 * | 0.01–1.27 | ICRS grade 4 |
| Renault et al. [130] | In | OA | K | Tibial Plateau | Indentation | µm | LE | - | 6.0–13.0 * | - | Light/severe cartilage damage |
Disclaimer/Publisher’s Note: The statements, opinions and data contained in all publications are solely those of the individual author(s) and contributor(s) and not of MDPI and/or the editor(s). MDPI and/or the editor(s) disclaim responsibility for any injury to people or property resulting from any ideas, methods, instructions or products referred to in the content. |
© 2024 by the authors. Licensee MDPI, Basel, Switzerland. This article is an open access article distributed under the terms and conditions of the Creative Commons Attribution (CC BY) license (https://creativecommons.org/licenses/by/4.0/).
Share and Cite
Berni, M.; Marchiori, G.; Baleani, M.; Giavaresi, G.; Lopomo, N.F. Biomechanics of the Human Osteochondral Unit: A Systematic Review. Materials 2024, 17, 1698. https://doi.org/10.3390/ma17071698
Berni M, Marchiori G, Baleani M, Giavaresi G, Lopomo NF. Biomechanics of the Human Osteochondral Unit: A Systematic Review. Materials. 2024; 17(7):1698. https://doi.org/10.3390/ma17071698
Chicago/Turabian StyleBerni, Matteo, Gregorio Marchiori, Massimiliano Baleani, Gianluca Giavaresi, and Nicola Francesco Lopomo. 2024. "Biomechanics of the Human Osteochondral Unit: A Systematic Review" Materials 17, no. 7: 1698. https://doi.org/10.3390/ma17071698
APA StyleBerni, M., Marchiori, G., Baleani, M., Giavaresi, G., & Lopomo, N. F. (2024). Biomechanics of the Human Osteochondral Unit: A Systematic Review. Materials, 17(7), 1698. https://doi.org/10.3390/ma17071698