

Synthesis and Transport Properties of ZnSnP2-yAsy Chalcopyrite Solid Solutions

Department of Chemistry and Waterloo Institute for Nanotechnology, University of Waterloo, Waterloo, ON N2L 3G1, Canada
*
Author to whom correspondence should be addressed.
Materials 2024, 17(8), 1712; https://doi.org/10.3390/ma17081712
Submission received: 1 March 2024
/
Revised: 2 April 2024
/
Accepted: 7 April 2024
/
Published: 9 April 2024
(This article belongs to the Special Issue Thermoelectric Materials for Sustainable Applications)
Abstract
:This work focuses on the synthesis and properties of quaternary ZnSnP2-yAsy chalcopyrite solid solutions. Full miscibility of the solid solution is achieved using ball milling followed by hot press sintering. The measured electrical conductivity increases substantially with As substitution from 0.03 S cm−1 for ZnSnP2 to 10.3 S cm−1 for ZnSnAs2 at 715 K. Band gaps calculated from the activation energies show a steady decrease with increasing As concentration from 1.4 eV for ZnSnP2 to 0.7 eV for ZnSnAs2. The Seebeck coefficient decreases significantly with As substitution from nearly 1000 μV K−1 for ZnSnP2 to −100 μV K−1 for ZnSnAs2 at 650 K. Thermal conductivity is decreased for the solid solutions due to alloy phonon scattering, compared to the end members with y = 0 and y = 2, with the y = 0.5 and y = 1.0 samples exhibiting the lowest values of 1.4 W m−1 K−1 at 825 K. Figure of merit values are increased for the undoped solid solutions at lower temperatures when compared to the end members due to the decreased thermal conductivity, with the y = 0.5 sample reaching zT = 1.6 × 10⁻³ and y = 1 reaching 2.1 × 10⁻³ at 700 K. The largest values of the figure of merit zT for the undoped series was found for y = 2 with zT = 2.8 × 10⁻³ at 700 K due to the increasing n-type Seebeck coefficient. Boltztrap calculations reveal that p-doping could yield zT values above unity at 800 K in case of ZnSnAs2, comparable with ZnSnP2.
1. Introduction
Chalcopyrites ABX2 adopt an ordered supercell of the zincblende type, with a doubled c axis because of the ordering of the cations A and B. Typical representatives include charge-balanced pnictides A+2B+4(Pn−3)2 and chalcogenides A+1B+3(Q−2)2. The 2022 NIST Inorganic Crystal Structure Database lists 17 pnictides (A = Mg, Zn, and Cd; B = Si, Ge, and Sn; Pn = P, As, and Sb) and 26 chalcogenides (A = Li, Cu, and Ag; B = Fe, B, Al, Ga, In, and Tl; Q = S, Se, and Te) adopting the chalcopyrite type. For several decades, chalcopyrites have been studied for a number of different applications [1], including ZnGeP2 [2,3,4], AgGaSe2 [5] and others [6] as nonlinear optical materials, photovoltaics [7], LEDs [8] and thermoelectric materials [9,10].
Thermoelectric (TE) materials are capable of converting the abundant otherwise lost waste heat into useful electricity, which may contribute to more sustainable energy generation [11,12,13,14]. Additionally, today’s researchers focus also on investigations into powering the countless sensors in the Internet of Things [15,16,17], and utilizing body heat for various sensors [18,19,20,21], both with TE materials. TE materials are classified by their figure of merit, zT, with classical materials having peak values around unity. Recent progress in, for example, nanostructuring and utilizing the phonon glass electron crystal (PGEC) approach [22] to lower thermal conductivity, led to significantly higher values, even exceeding zTmax = 2 at high temperatures in selected examples such as PbTe with nanodomains [23] or with SrTe nanoadditions [24], nanostructured Cu2Se [25] and Cu2Se/CuInSe2 nanocomposites [26], and p-doped SnSe [27,28,29].
For the most part, phosphides and arsenides are neither among the best performing thermoelectrics nor among the heavily investigated ones, mostly because they typically comprise higher thermal conductivity than the more traditional antimonides and tellurides. Notable exceptions exist however [30,31,32], with figure of merit values of the order of 1 for both p- and n-doped phosphides [33]. Several Zn-based chalcopyrite phosphides and arsenides (ZnBPn2 with B = Si, Ge, and Sn; Pn = P and As) were predicted to have high thermopower [34]. We recently experimentally demonstrated that despite the high symmetry crystal structures and relatively light constituent elements, the solid solutions ZnGe1-xSnxP2 can achieve reasonably low thermal conductivity, and ultimately high figure of merit values when properly doped [35]. Here, we report on the solid solutions ZnSnP2-yAsy, focusing on Sn instead of Ge because of its lower price, higher abundancy, and (partially) substituting As for P because of its higher weight despite its higher toxicity, as higher weight typically occurs with lower lattice thermal conductivity [13].
2. Materials and Methods
All reactions began from the elements (Zn powder (99.9% Alfa Aesar, Tewksbury, MA, USA, −100 mesh), Sn powder (99.998% Alfa Aesar, −100 mesh), Ge pieces (99.999% STREM Chemicals, Newburyport, MA, USA), P powder (99% Alfa Aesar, −100 mesh), and As powder (99.98% Alfa Aesar, −100 mesh), which were loaded into zirconia lined ball mill jars with ~10 g of 1 mm zirconia balls in an argon filled glove box. The jars were milled at 600 rpm for 5 min increments with 1 min rest times, with the direction reversed after each rest time, using the Fritsch Pulverisette 7, (acquired from Laval Lab, Laval, QC, Canada). Three milling steps were employed, all as described above; after the first milling step of 5 h, the jars were opened in the argon glovebox and agglomerated materials were mechanically reincorporated before the two final 2 h milling steps. After those steps, the reacted materials were ground by hand to yield a uniform micro-crystalline sample. Finally, high-pressure sintering was performed as a final reaction step in graphite dies of a diameter of 12.7 mm under a pressure of 56 MPa using an Oxy-Gon Industries (Epsom, NH, USA) hot press; the temperature was ramped up over two hours to at 850 K and held there for 6 h, followed by a pressure-free cooldown.
Powder X-ray diffraction (PXRD) was performed on the ground samples as well as polished pellets at room temperature using the Inel (Artenay, France) powder X-ray diffractometer, which utilizes a position sensitive detector and Cu Kα1 radiation. Rietveld refinements were performed using the GSAS-II (v. 5761) analysis software [36].
An FEI (Hillsboro, OR, USA) Quanta FEG ESEM microscope was used for the energy-dispersive analysis of X-ray (EDAX) measurements with an acceleration voltage of 20 kV. Five-point measurements were taken for each sample and then averaged, and area scans and elemental mapping were performed on a 150 μm × 150 μm area.
Thermal diffusivity was measured on the pressed pellets under argon using the TA Instruments (Hillsboro, OR, USA) DLF-1200 system. The Seebeck coefficient was measured by the direct method, and electrical conductivity measured by a standard 4-point method, both with the ULVAC RIKO ZEM-3 apparatus under helium on rectangular pellets of 8 × 2 × 2 mm, cut from the original round pellet after the thermal diffusivity measurements. Estimated measurement errors are 3% for the Seebeck coefficient, 5% for the electrical conductivity [37], and 5% for the thermal conductivity measurements [38], resulting in 10% for the figure of merit. The error bars were included in the corresponding figures.
Electronic structure calculations were carried out using the WIEN2k_21.1 package that employs the full potential linearized augmented plane wave (LAPW) method [39,40,41]. Here, we used the generalized gradient approximation (GGA) from Perdew, Burke and Ernzerhof (PBE) [42]. We used a grid of 1000 k points evenly distributed throughout the first Brillouin zone, which resulted in 99 symmetry independent k points for ZnSnAs2. As convergence criterion, we used 10−4 Ry for the maximum energy change. In addition, we employed the BoltzTraP2 (v22.3.1) package [43] that uses the Boltzmann transport equations to calculate the thermoelectric properties. Although assuming a constant relaxation time results in an additional uncertainty [44,45], this often leads to good agreement between theory and experiment [46].
3. Results and Discussion
3.1. Chemical and Structural Characterization
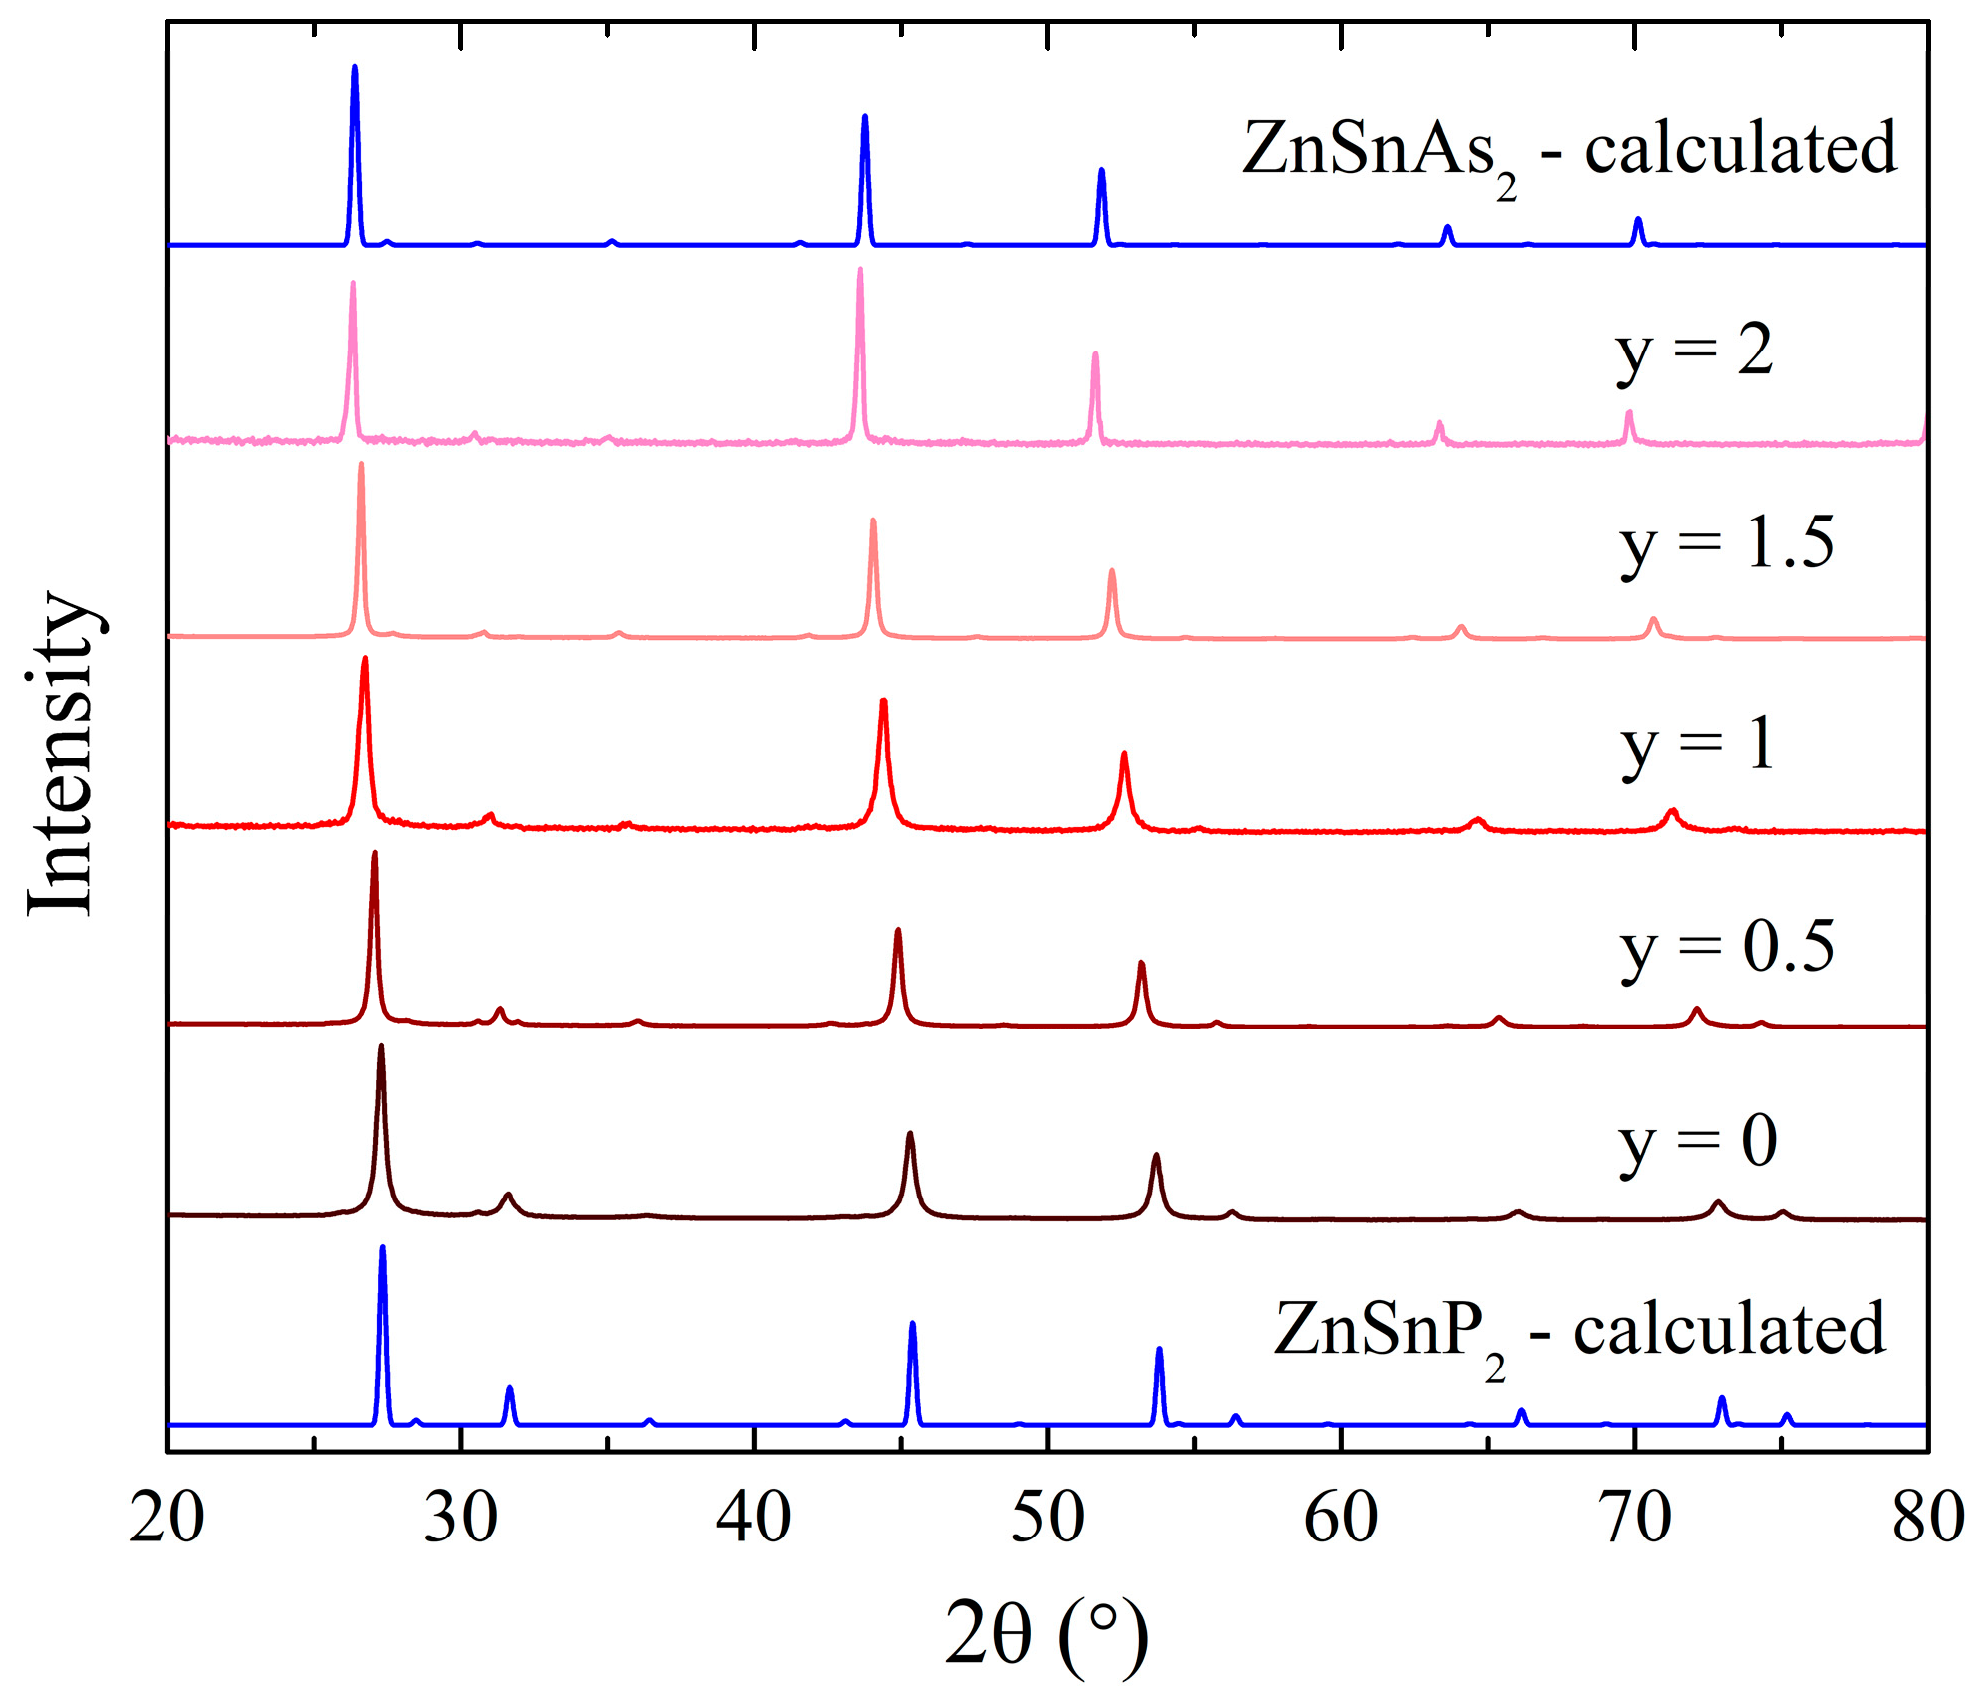
After thermal diffusivity measurements were performed, the samples were cut into bars for transport measurements, and PXRD was performed on the leftover pellet pieces hand ground into powders. Long time (>12 h) PXRD measurements for ZnSnP2-yAsy were performed for y = 0, 0.5, 1, 1.5, and 2 (Figure 1). The patterns are very consistent and do not exhibit any signs of any side products.
A shift of the characteristic peaks to lower angles occurs with increasing As concentration due to the unit cell expansion, caused by the larger size of the As atoms, compared to the P atoms. The expansion of unit cell parameters is illustrated in Figure 2a,b, and summarized in Table 1, namely a relatively steady increase with increasing As concentration from y = 0 to y = 1.5, followed by a larger increase when moving from y = 1.5 to y = 2. The tetragonality of the system, defined as c/(2a), slowly increases from 0.998 at y = 0 to 1.000 at y = 2 (Figure 2c).
The chemical compositions of the series were evaluated by refining the occupancy parameters during Rietveld refinements as well energy dispersive X-ray spectroscopy (EDAX) analysis. The y values (As content) of the solid solutions were refined to 0.59(1), 1.06(3), and 1.66(1) for the solid solutions with nominal y values of 0.5, 1.0, and 1.5. EDAX results for the solid solutions and end members can be found in Table 2. The concentrations determined from EDAX measurements match well for the solid solutions with expected atomic percent values showing differences of less than 8%, while the end member ZnSnAs2 displayed significantly lower than expected Zn and As (higher Sn) concentration. EDAX atomic mapping for these materials can be found in the Supplementary Information (Figure S1).
3.2. Experimental Physical Properties
Electrical conductivity versus temperature measurements were carried out for all members of the series (Figure 3). We verified the stability of the samples under the measurement conditions by measuring a few additional datapoints during cooldown. These datapoints (open circles in Figure 3) match the corresponding points obtained during heating to approximately 800 K very nicely, confirming the samples’ stabilities. The electrical conductivity of the P-rich members was too low to be measured at room temperature, but became measurable around 450 K or above, depending on y. As expected for semiconductors, the electrical conductivity increases with temperature for all members. An overall increase in conductivity with increasing As concentration is evident, in line with the expected decreasing band gap and higher degree of covalency (which increases carrier mobility), both caused by the lower electronegativity of As, compared to P. The conductivity for ZnSnP2 rises from σ = 0.01 S cm−1 at 650 K to 0.1 S cm−1 at 800 K, and for ZnSnAs2 from σ = 0.03 S cm−1 at 300 K to 7.0 S cm−1 at 650 K.
For comparison, ZnSnAs2 crystals grown by chemical vapor transport displayed a σ value of only 1.4 × 10⁻⁴ S cm−1 at 300 K, much lower than observed in this work, likely due to the low level of impurities typically found in perfect single crystals [47]. On the other hand, single crystals synthesized by the Bridgman method displayed σ = 24 S cm−1 at 295 K [48]. ZnSnAs2 bulk samples studied under various heat treatments had σ values ranging from 0.1 S cm−1 to 1200 S cm−1 at 300 K, with most values around 400 S cm−1 [49]. Heat treatments of the quenched samples tended to decrease conductivity, indicating healing of possible defects in these samples, which then resulted in lower electrical conductivity. Chalcopyrite CuInSe2 single crystals exhibited σ values ranging from 0.15 S cm−1 at 300 K to 0.46 S cm−1 at 575 K [50], likely low because of their low amounts of intrinsic defects. Studies of vacancy doped p-type Cu0.99InSe2.05—which adopts the same structure type and has the same number of electrons—displayed σ values ranging from 1.5 S cm−1 at 325 K to 6.0 S cm−1 at 760 K with degenerate semiconducting behavior [51].
An Arrhenius plot of ln(σ) versus T−1 is shown in Figure 4, where a linear trend is expected for intrinsic semiconductors and curved trends for extrinsic semiconductors. The series members displayed mostly intrinsic semiconducting behavior, except for ZnSnAs2 with its extrinsic behavior indicative of a significant amount of defects. Band gaps of the series members are calculated from the slope (in the high temperature linear region) using the Arrhenius expression for the activation energy. A clear trend of decreasing band gaps with As concentration is observed as postulated above (inset of Figure 4). The previously determined band gaps of Eg = 1.4 eV for ZnSnP2 and 0.7 eV for ZnSnAs2 are comparable to the literature values of 1.68 eV for ZnSnP2 [52] and 0.59 eV for ZnSnAs2 [48].
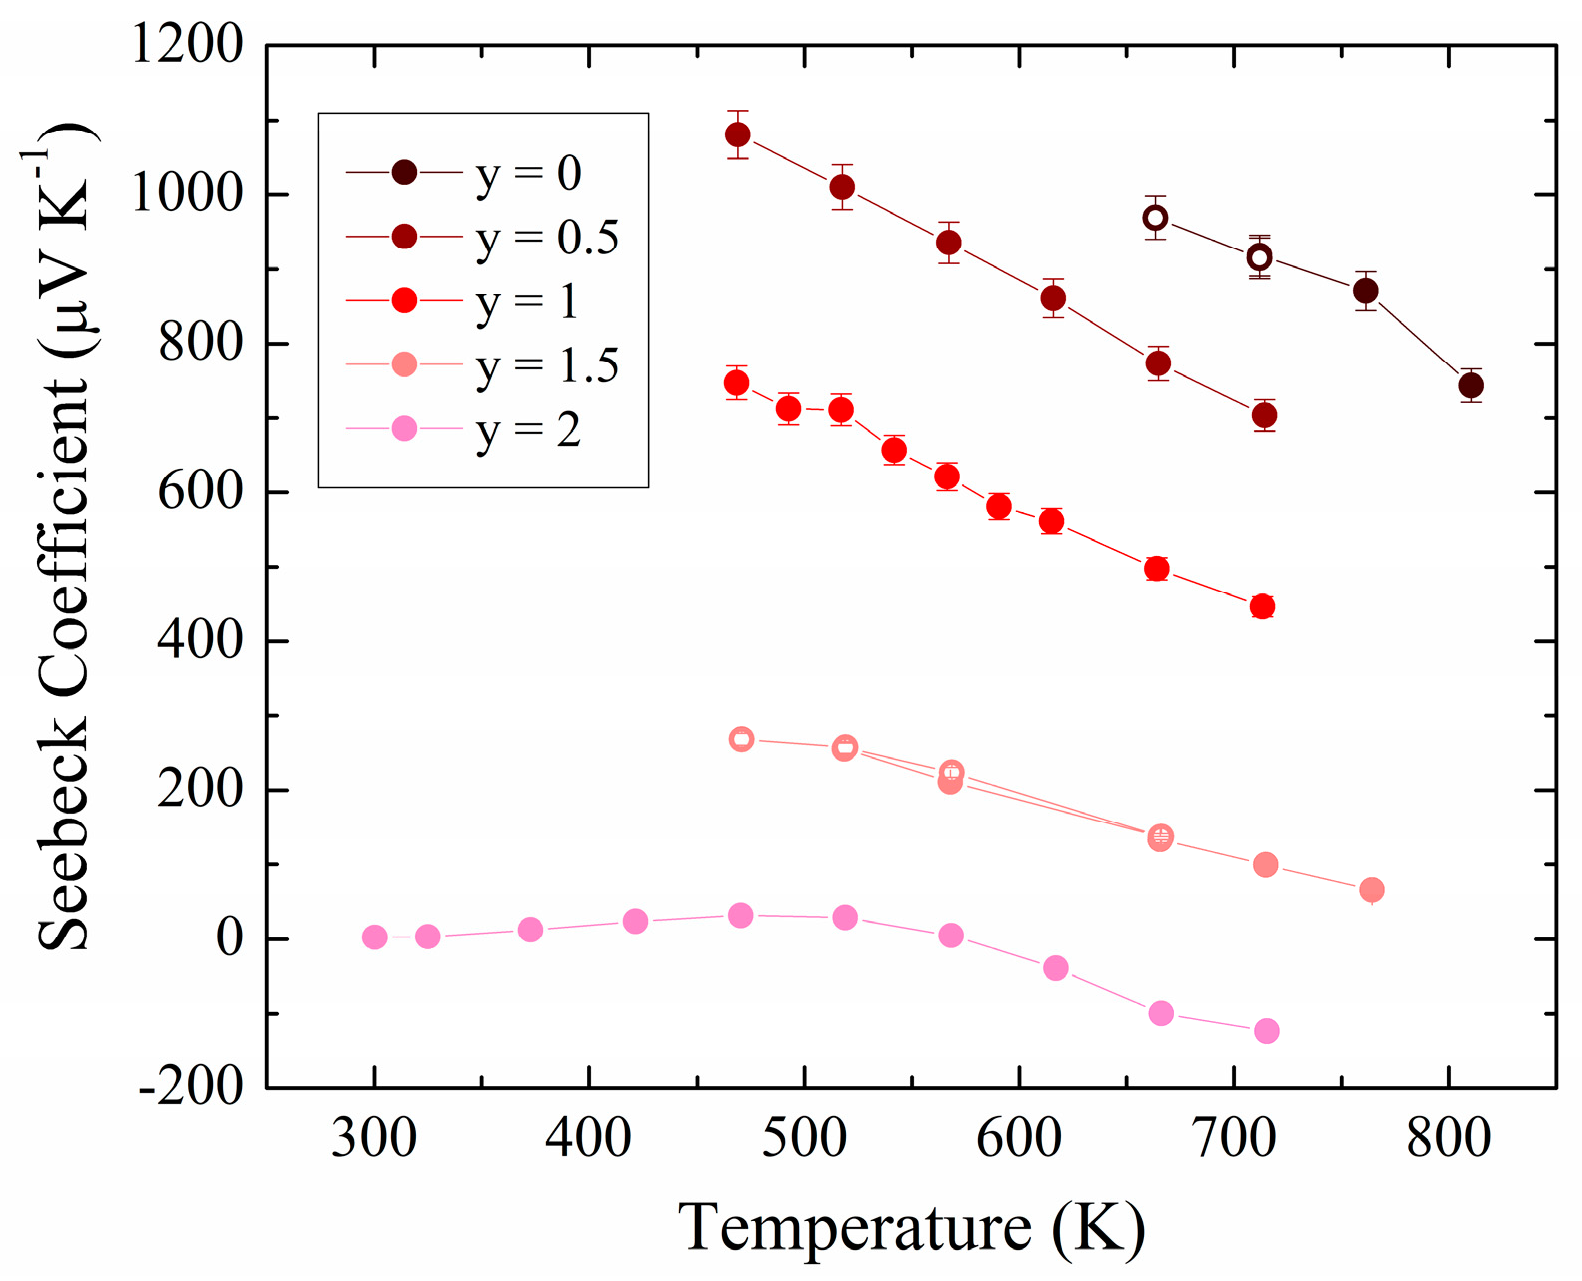
The Seebeck coefficient data measured for the full series are displayed in Figure 5. The values decrease with increasing As concentration, for example at the highest temperatures from S = 744 μV K−1 for y = 0 down to −125 μV K−1 for y = 2, in line with the opposing trend in the electrical conductivity. The temperature dependence for the materials from y = 0 to y = 1.5, decreasing steadily with increasing temperature, is typical of p-type intrinsic behavior. A turnover of the slope in Seebeck versus temperature is indicative of bipolar conduction, which is seen at 475 K for the y = 2 end member, which ultimately results in a p-type to n-type transition.
Previous studies of bulk ZnSnAs2 showed degenerate p-type semiconducting behavior, with Seebeck coefficient values ranging from S = 41 μV K−1 at 300 K to 60 μV K−1 at 440 K similar to the results found in this work for the same temperature range. Various heat treatments and synthesis methods produced room temperature S values ranging from 26 μV K−1 (slowly cooled sample) to 224 μV K−1 (after annealing at 883 K) [49]. Single crystals displayed larger overall S values with degenerate semiconducting behavior, ranging from 310 μV K−1 at 300 K to 400 μV K−1 at 600 K [48]. The analogous I–III–VI chalcopyrite CuInSe2 single crystals grown by vapor deposition displayed S values ranging from 542 μV K−1 at 300 K down to 300 μV K−1 at 400 K, and then increasing again to 600 μV K−1 at 625 K [50]. Vacancy doped p-type Cu0.99InSe2.05 had S values of 300 μV K−1 at 300 K, which increased to 625 μV K−1 at 620 K to finally decrease to 500 μV K−1 at 775 K [51]. A similar p-type to n-type transition was observed in one study of CuInSe2, with 100 μV K−1 at 300 K increasing slightly to 200 μV K−1 at 390 K and then decreasing rapidly to −200 μV K−1 at 560 K [53].
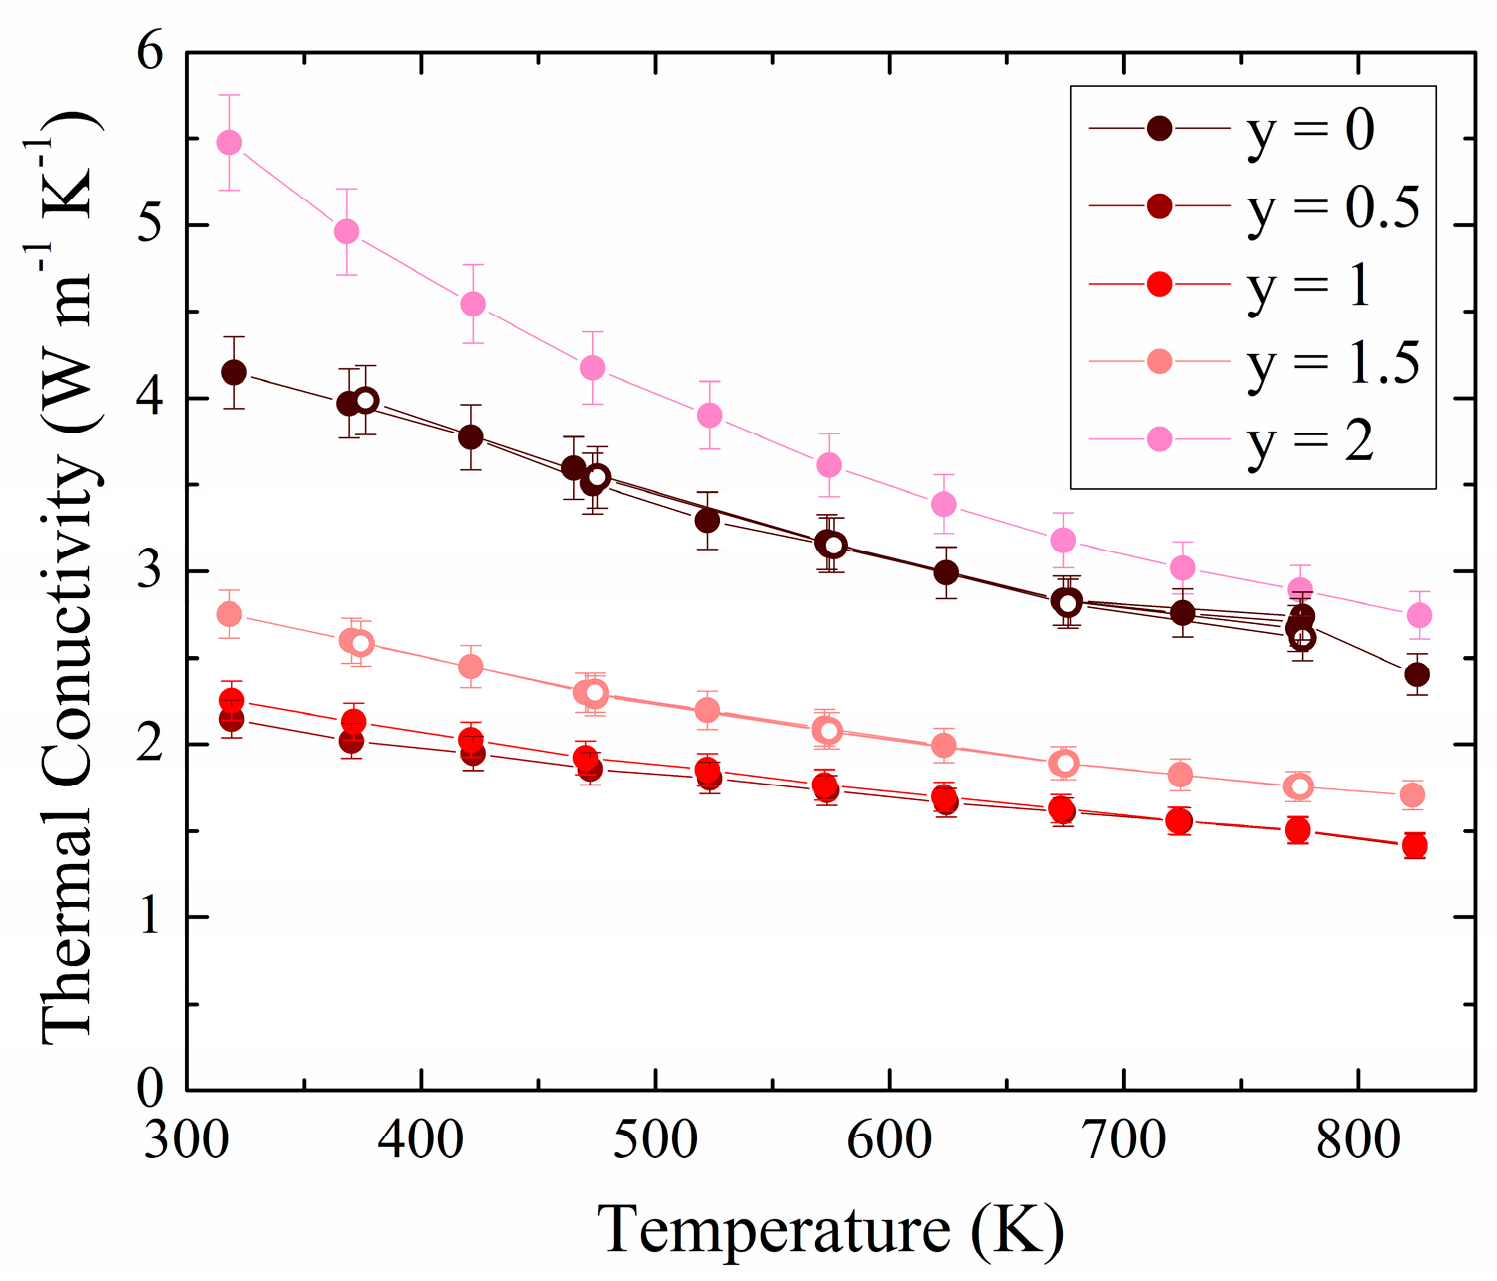
The thermal conductivity data are shown in Figure 6, revealing a typical decrease with temperature due to increased phonon frequencies. Here as well, the data collected after the first heating cycle during the cooldown (open circles) match the data during heating, showing stability of the materials under the measurement conditions. The end members exhibit the largest values with κ = 4.2 W m−1 K−1 and 5.6 W m−1 K−1 at 300 K to 2.4 W m−1 K−1 and 2.7 W m−1 K−1 at 825 K for y = 0 and y = 2, respectively. The lowest values are observed in y = 0.5 and y = 1 with κ = 2.2 W m−1 K−1 and 2.3 W m−1 K−1 at 300 K, respectively, which have equal values of 1.4 W m−1 K−1 at 825 K. Slightly larger than the other solid solutions, the material with y = 1.5 displays κ values between 2.8 W m−1 K−1 at 300 K and 1.7 W m−1 K−1 at 825 K. Increased phonon scattering due to mass fluctuation effects and disorders thus reduces the thermal conductivity by more than a factor of two at room temperature for the solid solutions compared to the end members.
Considering the low electrical conductivity values, the electronic contribution to the measured total thermal conductivity remains always below 0.01 W m−1 K−1 based on the Wiedemann-Franz law. Therefore, the measured thermal conductivity is basically directly equal to the lattice thermal conductivity. Gasson et al. measured between κ = 4.3 W m−1 K−1 (sintered sample) and 14.1 W m−1 K−1 (slowly cooled sample) for ZnSnAs2 [49], demonstrating again how the properties, e.g., charge carrier concentration and thus electronic thermal conductivity, depend on the heat treatment.
The calculated thermoelectric figure of merit is obtained from combining Seebeck coefficient, electrical and thermal conductivity, as well as temperature via zT = TσS2 κ−1. As the thermal data were obtained for a larger temperature range, the zT values are limited to the temperature ranges of the electrical measurements. The largest and smallest zT values are observed in the y = 2 end member with zT = 1.4 × 10⁻⁹ at 300 K to 0.003 at 700 K and hypothetically zero at the p-n transition temperature (Figure 7). At high temperatures, the relatively large electrical conductivity, increasing negative Seebeck coefficient, and decreasing thermal conductivity contribute to improving thermoelectric performance. Gasson et al. determined zT of slowly cooled ZnSnAs2 to be 0.004 at 300 K, with a carrier concentration of 5.7 × 1020 cm−1 [49]. The maximum zT values for all solid solution members (i.e., containing both P and As) occur at 700 K with 2.0 × 10⁻³ for y = 1, 1.6 × 10⁻³ for y = 0.5, and 4.3 × 10⁻⁴ for y = 1.5. The ZnSnP2-yAsy solid solutions outperform the y = 0 end member.
3.3. Calculated Physical Properties
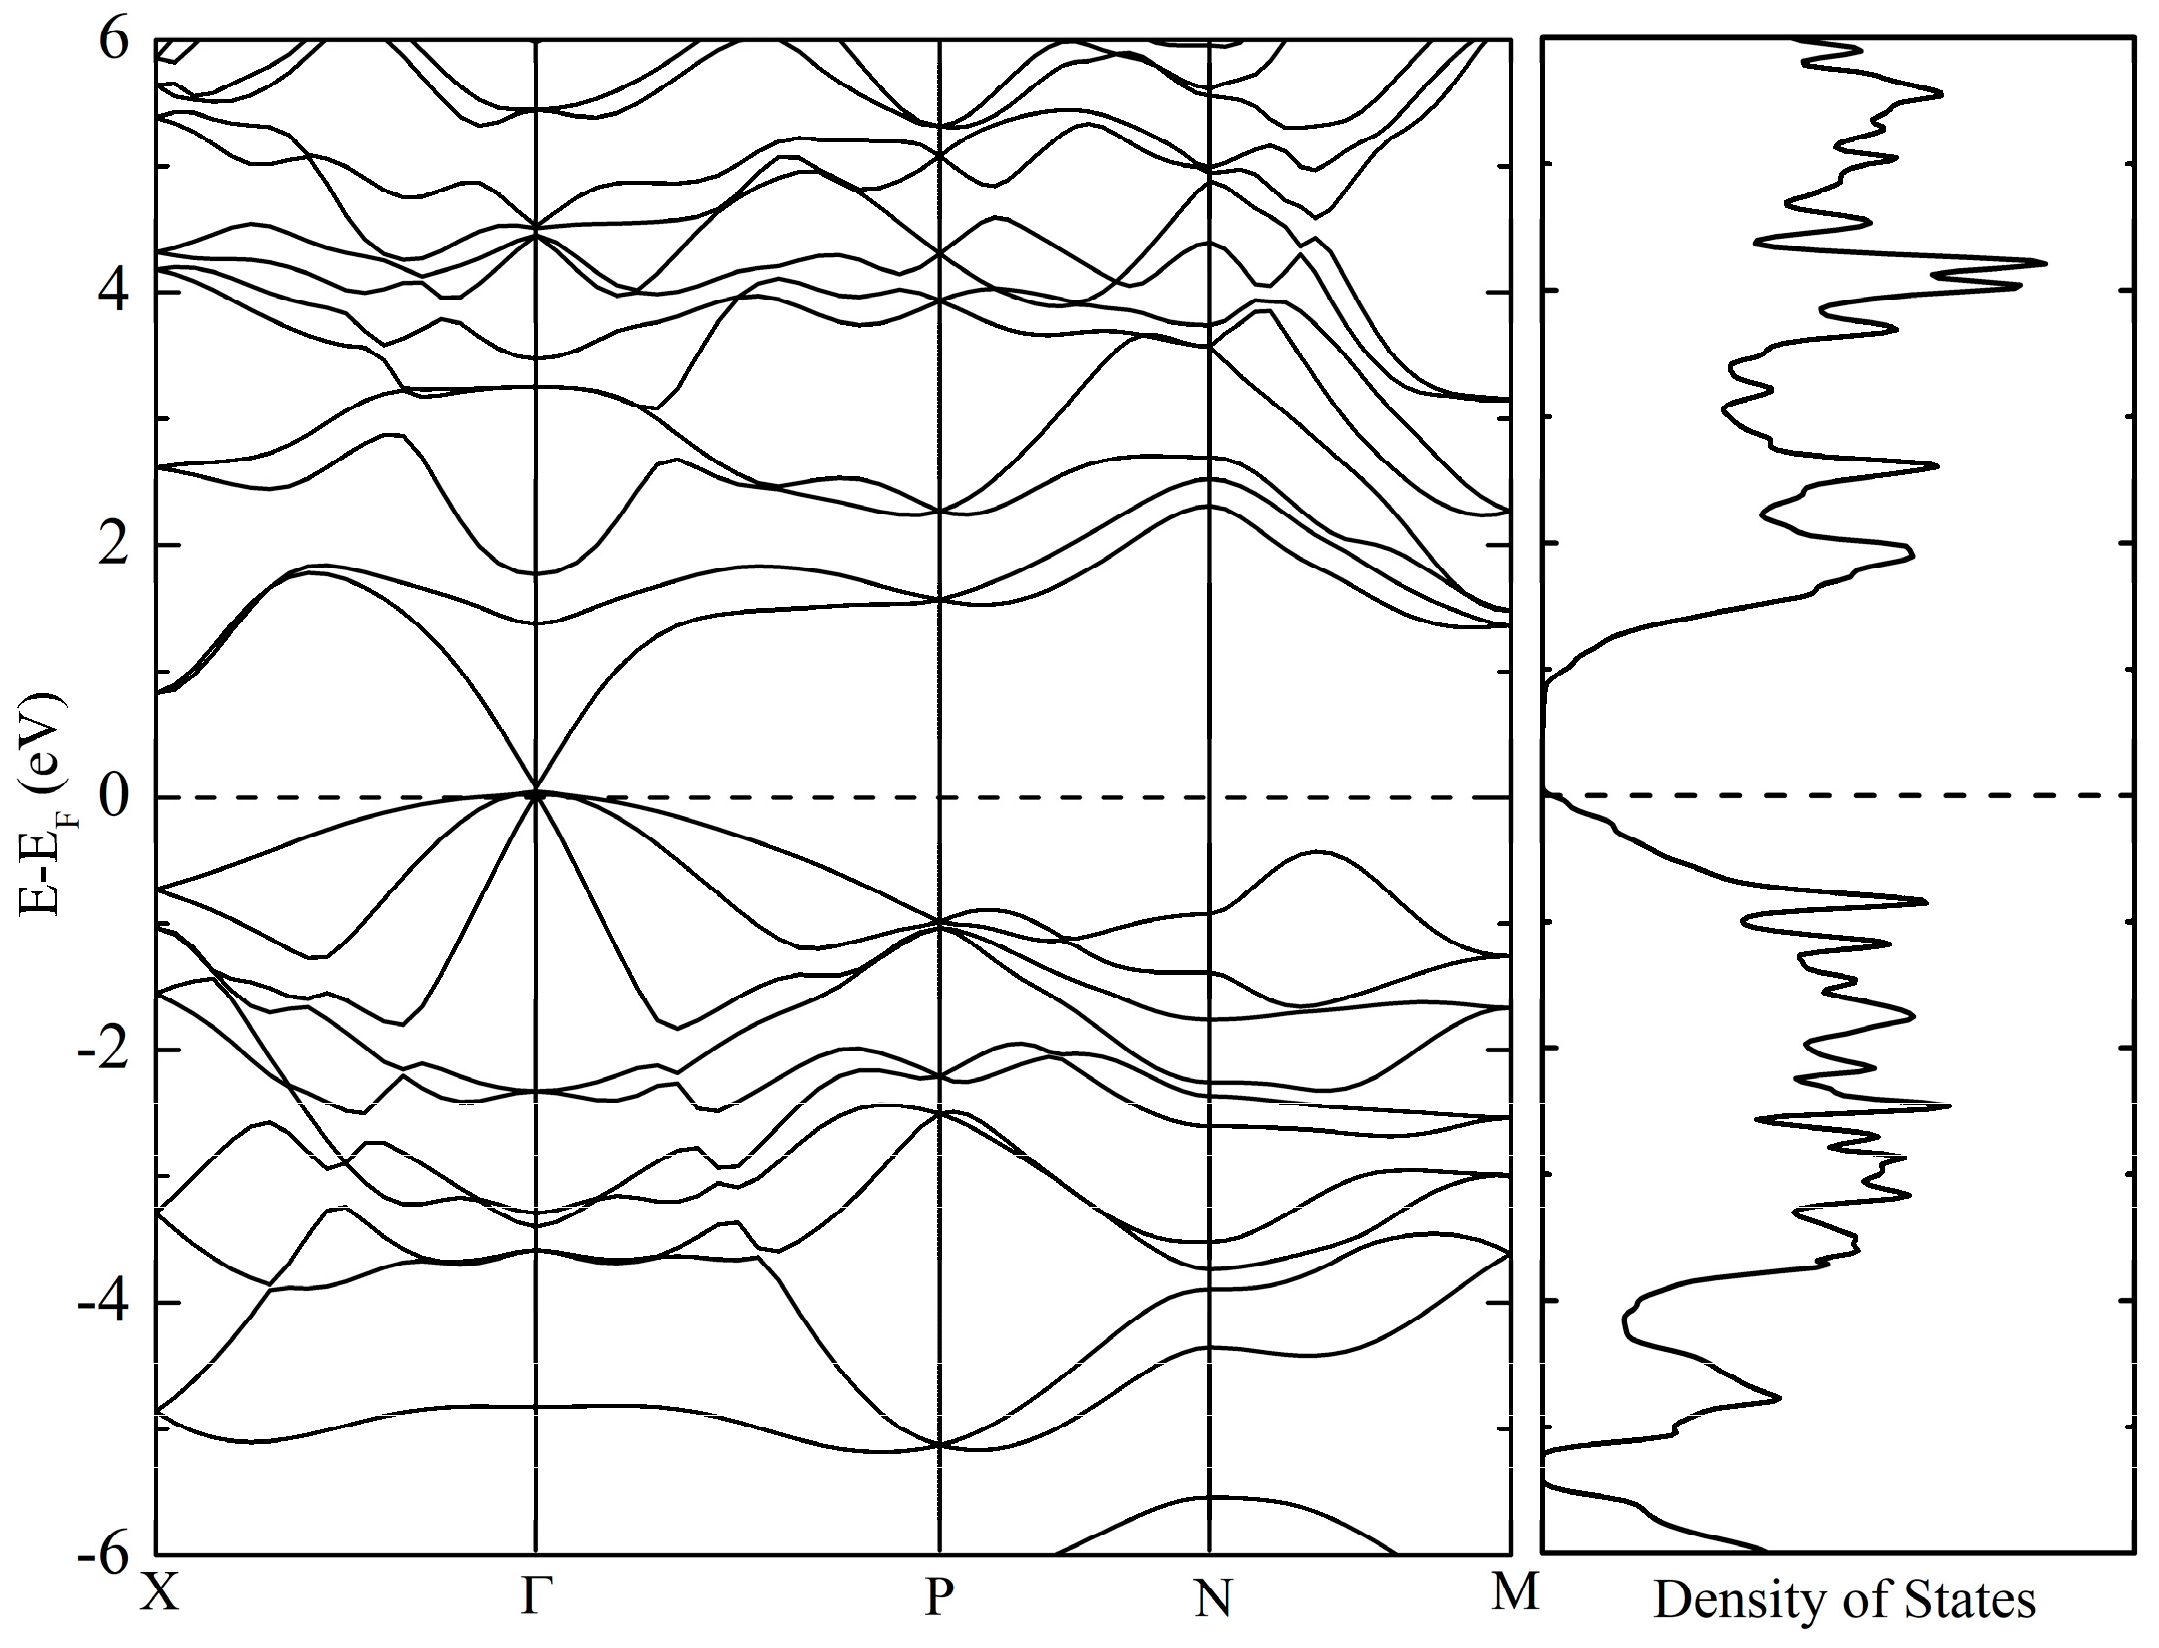
The band structure and density of states of ZnSnAs2 are shown in Figure 8, as the corresponding results for ZnSnP2 were published before [35]. A small direct band gap exists at the Γ point, with several bands converging at the top of the valence band, in line with the high degree of tetragonality. There are strong resemblances to the calculated band structure of ZnSnP2 [35], with the smaller band gap being the most noticeable difference.
Using BoltzTraP2, the Seebeck coefficient S, the electrical conductivity σ, the power factor σS2, and the electronic contribution to the thermal conductivity κ0 were calculated (relative to the relaxation time τ) for temperatures up to 800 K, as displayed in Figure 9. Depending on the carrier concentration (relative energies), high Seebeck values around +500 μV K−1 and −400 μV K−1 may be achievable at 400 K, and power factor values of S2σ τ−1 = 6 × 10¹¹ W m−1 K−2 s−1 for both p- and n-type at 800 K. For comparison, the corresponding peak values were 13 × 1011 W m−1 K−2 s−1 for ZnGeP2 and 11 × 1011 W m−1 K−2 s−1 for ZnSnP2 (both at 900 K).
To obtain estimated figure of merit values for ZnSnAs2, we used a standard relaxation time of τ = 10 fs, as typical for these materials [54], and the experimentally obtained lattice thermal conductivity values κlat (Equation (1)):
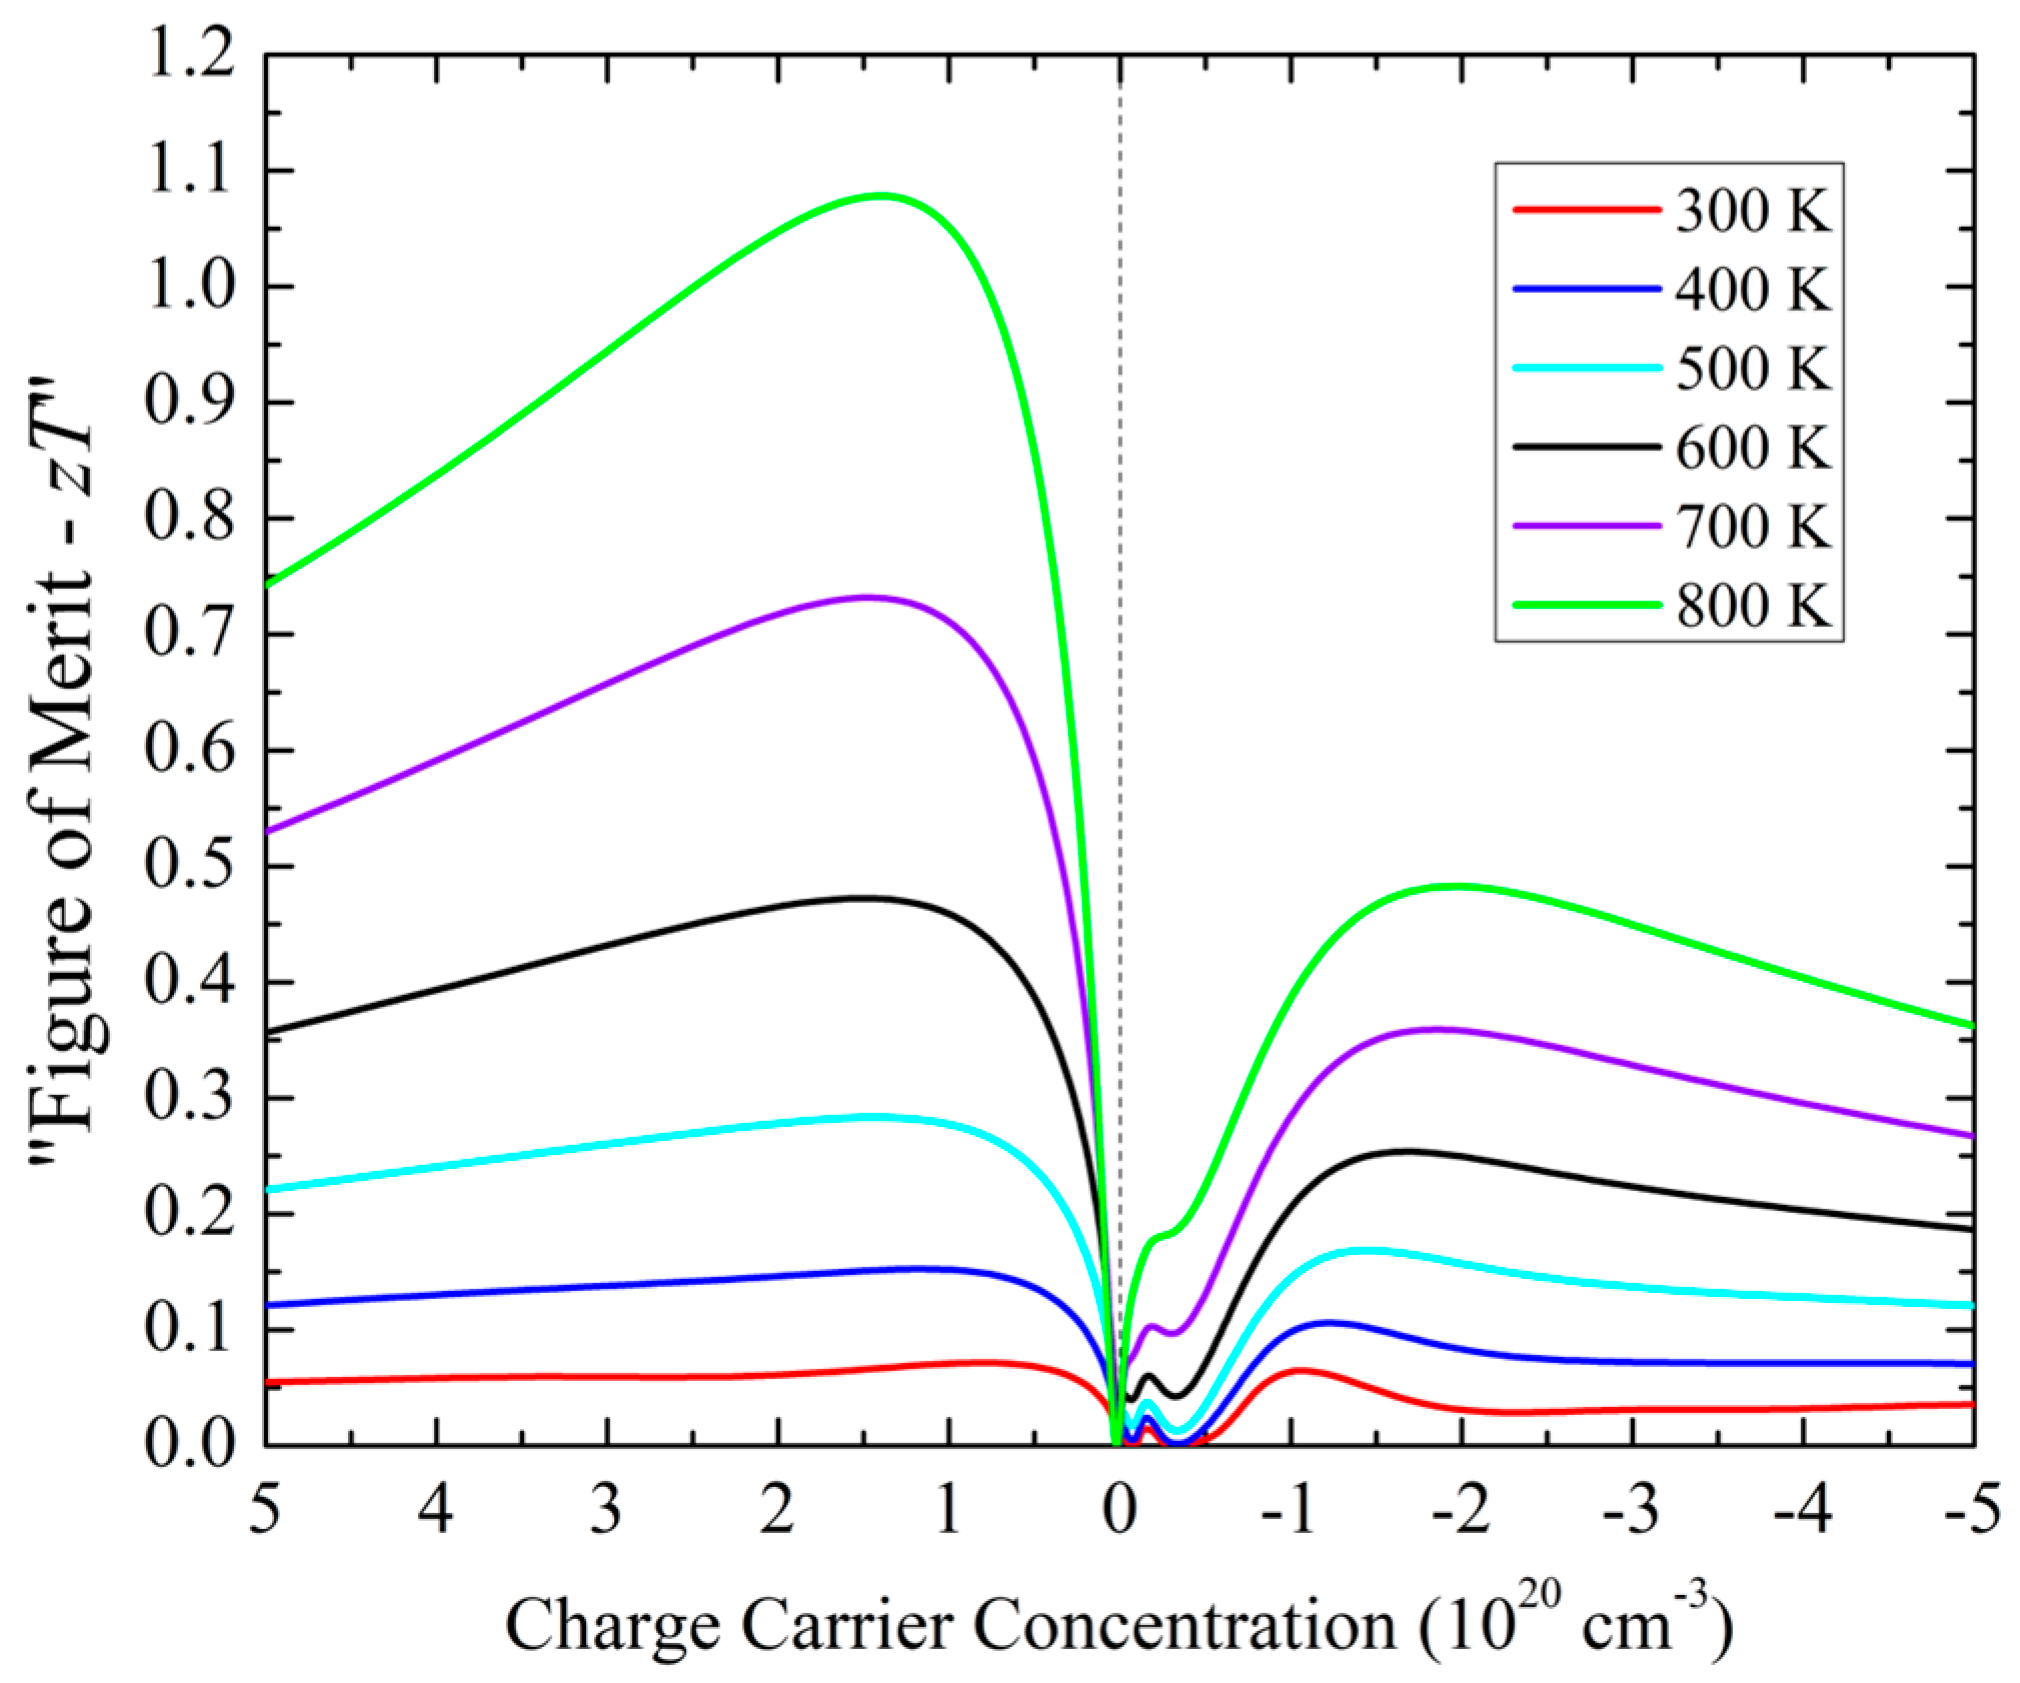
As shown in Figure 10, the zT values increase steadily from room temperature up to 800 K, reaching values slightly above unity (zT = 1.07, at 1.4 × 10²⁰ carriers per cm3, or 0.006 carriers per formula unit) for p-type and 0.48 for n-type doped ZnSnAs2 at 1.4 × 10²⁰ carriers per cm3. The maximum for the p-type compares well with ZnSnP2, where a zTmax = 1.0 was obtained at 800 K.
While the work from Gasson et al. implies that a large range of different charge carrier concentrations of between 0.2 × 1020 cm−1 and 33 × 1020 cm−1 can be obtained for ZnSnAs2 [49], a systematic doping study has not yet been performed on ZnSnAs2. p-type doping could be systematically achieved by partial replacements of Zn with Cu or Sn with In, with formulae of Cu0.006Zn0.994SnAs2 and ZnIn0.006Sn0.994As2, respectively, corresponding to a hole carrier concentration of the order of 1020 cm−3.
4. Conclusions
We successfully synthesized and characterized the solid solution series ZnSnP2-yAsy via a mechanochemical route. Full miscibility exists, and the increasing As concentration causes a smaller band gap and higher electrical conductivity. The lowest thermal conductivity values were measured for the solutions with y = 0.5 and y = 1.0.
The undoped as-prepared samples all exhibit poor thermoelectric performance (low figure of merit). Our calculations showed that proper p-type doping of ZnSnAs2 should lead to outstanding performance with figure of merit values exceeding zT = 1, while n-doping would be less successful with peak zT values of the order of 0.5. As previously demonstrated [35], the other end member, ZnSnP2, should be able to achieve comparable performance when p-doped, and better performance when n-doped.
Supplementary Materials
The following supporting information can be downloaded at: https://www.mdpi.com/article/10.3390/ma17081712/s1, Figure S1: EDAX atomic mapping.
Author Contributions
D.R.: conceptualization, data curation, formal analysis, investigation, visualization, writing—original draft; L.T.M.: data curation, formal analysis; H.K.: conceptualization, funding acquisition, supervision, writing—review & editing. All authors have read and agreed to the published version of the manuscript.
Funding
This research was funded by the Natural Sciences and Engineering Research Council of Canada (NSERC) in the form of a Discovery Grant (RGPIN-2020-04145).
Data Availability Statement
Data are contained within the article and Supplementary Materials.
Conflicts of Interest
The authors declare no conflict of interest.
References
- Thomas, S.R.; Chen, C.W.; Date, M.; Wang, Y.C.; Tsai, H.W.; Wang, Z.M.; Chueh, Y.L. Recent Developments in the Synthesis of Nanostructured Chalcopyrite Materials and Their Applications: A Review. RSC Adv. 2016, 6, 60643–60656. [Google Scholar] [CrossRef]
- Boyd, G.D.; Buehler, E.; Storz, F.G. Linear and Nonlinear Optical Properties of ZnGeP2 and CdSe. Appl. Phys. Lett. 1971, 18, 301–304. [Google Scholar] [CrossRef]
- Schunemann, P.G.; Schepler, K.L.; Budni, P.A. Nonlinear Frequency Conversion Performance of AgGaSe2, ZnGeP2, and CdGeAs2. MRS Bull. 1998, 23, 45–49. [Google Scholar] [CrossRef]
- Yang, S.; Lin, C.; Chen, K.; Fan, H.; Chen, J.; Fang, S.; Ye, N.; Luo, M. Trade-Off for Better Balanced Nonlinear Optical Performance with Disordered Si in ZnGeP2. Chem. Mater. 2022, 34, 11007–11013. [Google Scholar] [CrossRef]
- Kildal, H.; Mikkelsen, J.C. The Nonlinear Optical Coefficient, Phasematching, and Optical Damage in the Chalcopyrite AgGaSe2. Opt. Commun. 1973, 9, 315–318. [Google Scholar] [CrossRef]
- Kumar, V.; Tripathy, S.K.; Jha, V. Second Order Nonlinear Optical Properties of A IB IIIC 2VI Chalcopyrite Semiconductors. Appl. Phys. Lett. 2012, 101, 192105. [Google Scholar] [CrossRef]
- Yoneda, R.; Beppu, K.; Wada, T. CuInSe2 and Related I–III–VI2 Chalcopyrite Compounds for Photovoltaic Application. Jpn. J. Appl. Phys. 2021, 60, 080101. [Google Scholar] [CrossRef]
- Wagner, S. Preparation and Properties of Green-light-emitting CdS–CuGaS2 Heterodiodes. J. Appl. Phys. 1974, 45, 246–251. [Google Scholar] [CrossRef]
- Carr, W.D.; Morelli, D.T. Influence of Doping and Solid Solution Formation on the Thermoelectric Properties of Chalcopyrite Semiconductors. J. Alloys Compd. 2015, 630, 277–281. [Google Scholar] [CrossRef]
- Mukherjee, M.; Yumnam, G.; Singh, A.K. High Thermoelectric Figure of Merit via Tunable Valley Convergence Coupled Low Thermal Conductivity in AIIBIVC2V Chalcopyrites. J. Phys. Chem. C 2018, 122, 29150–29157. [Google Scholar] [CrossRef]
- Bell, L.E. Cooling, Heating, Generating Power, and Recovering Waste Heat with Thermoelectric Systems. Science 2008, 321, 1457–1461. [Google Scholar] [CrossRef] [PubMed]
- Snyder, G.J.; Toberer, E.S. Complex Thermoelectric Materials. Nat. Mater. 2008, 7, 105–114. [Google Scholar] [CrossRef] [PubMed]
- Kleinke, H. New Bulk Materials for Thermoelectric Power Generation: Clathrates and Complex Antimonides. Chem. Mater. 2010, 22, 604–611. [Google Scholar] [CrossRef]
- Shi, Y.; Sturm, C.; Kleinke, H. Chalcogenides as Thermoelectric Materials. J. Solid State Chem. 2019, 270, 273–279. [Google Scholar] [CrossRef]
- Zaia, E.W.; Gordon, M.P.; Yuan, P.; Urban, J.J. Progress and Perspective: Soft Thermoelectric Materials for Wearable and Internet-of-Things Applications. Adv. Electron. Mater. 2019, 5, 1800823. [Google Scholar] [CrossRef]
- Park, H.; Lee, D.; Park, G.; Park, S.; Khan, S.; Kim, J.; Kim, W. Energy Harvesting Using Thermoelectricity for IoT (Internet of Things) and E-Skin Sensors. J. Phys. Energy 2019, 1, 42001. [Google Scholar] [CrossRef]
- Freer, R.; Powell, A.V. Realising the Potential of Thermoelectric Technology: A Roadmap. J. Mater. Chem. C 2020, 8, 441–463. [Google Scholar] [CrossRef]
- Yang, Y.; Wei, X.-J.; Liu, J. Suitability of Thermoelectric Power Generator for Implantable Medical Devices. J. Phys. D Appl. Phys. 2007, 40, 5790–5800. [Google Scholar] [CrossRef]
- Leonov, V.; Vullers, R.J.M. Wearable Electronics Self-Powered by Using Human Body Heat: The State of the Art and the Perspective. J. Renew. Sustain. Energy 2009, 1, 062701. [Google Scholar] [CrossRef]
- Francioso, L.; De Pascali, C.; Farella, I.; Martucci, C.; Cretì, P.; Siciliano, P.; Perrone, A. Flexible Thermoelectric Generator for Ambient Assisted Living Wearable Biometric Sensors. J. Power Sources 2011, 196, 3239–3243. [Google Scholar] [CrossRef]
- Tian, R.; Liu, Y.; Koumoto, K.; Chen, J. Body Heat Powers Future Electronic Skins. Joule 2019, 3, 1399–1403. [Google Scholar] [CrossRef]
- Slack, G.A. New Materials and Performance Limits for Thermoelectric Cooling. In CRC Handbook of Thermoelectrics; Rowe, D.M., Ed.; CRC Press: Boca Raton, FL, USA, 1995; pp. 407–440. [Google Scholar]
- Hsu, K.F.; Loo, S.; Guo, F.; Chen, W.; Dyck, J.S.; Uher, C.; Hogan, T.; Polychroniadis, E.K.; Kanatzidis, M.G. Cubic AgPbmSbTe2+m: Bulk Thermoelectric Materials with High Figure of Merit. Science 2004, 303, 818–821. [Google Scholar] [CrossRef] [PubMed]
- Biswas, K.; He, J.; Blum, I.D.; Wu, C.-I.; Hogan, T.P.; Seidman, D.N.; Dravid, V.P.; Kanatzidis, M.G. High-Performance Bulk Thermoelectrics with All-Scale Hierarchical Architecture. Nature 2012, 489, 414–418. [Google Scholar] [CrossRef]
- Gahtori, B.; Bathula, S.; Tyagi, K.; Jayasimhadri, M.; Srivastava, A.K.; Singh, S.; Budhani, R.C.; Dhar, A. Giant Enhancement in Thermoelectric Performance of Copper Selenide by Incorporation of Different Nanoscale Dimensional Defect Features. Nano Energy 2015, 13, 36–46. [Google Scholar] [CrossRef]
- Olvera, A.A.; Moroz, N.A.; Sahoo, P.; Ren, P.; Bailey, T.P.; Page, A.A.; Uher, C.; Poudeu, P.F.P. Partial Indium Solubility Induces Chemical Stability and Colossal Thermoelectric Figure of Merit in Cu2Se. Energy Environ. Sci. 2017, 10, 1668–1676. [Google Scholar] [CrossRef]
- Wei, W.; Chang, C.; Yang, T.; Liu, J.; Tang, H.; Zhang, J.; Li, Y.; Xu, F.; Zhang, Z.; Li, J.F.; et al. Achieving High Thermoelectric Figure of Merit in Polycrystalline SnSe via Introducing Sn Vacancies. J. Am. Chem. Soc. 2018, 140, 499–505. [Google Scholar] [CrossRef]
- Chandra, S.; Biswas, K. Realization of High Thermoelectric Figure of Merit in Solution Synthesized 2D SnSe Nanoplates via Ge Alloying. J. Am. Chem. Soc. 2019, 141, 6141–6145. [Google Scholar] [CrossRef] [PubMed]
- Zhou, C.; Lee, Y.K.; Yu, Y.; Byun, S.; Luo, Z.Z.; Lee, H.; Ge, B.; Lee, Y.L.; Chen, X.; Lee, J.Y.; et al. Polycrystalline SnSe with a Thermoelectric Figure of Merit Greater than the Single Crystal. Nat. Mater. 2021, 20, 1378–1384. [Google Scholar] [CrossRef]
- Nuss, J.; Wedig, U.; Xie, W.; Yordanov, P.; Bruin, J.; Hübner, R.; Weidenkaff, A.; Takagi, H. Phosphide–Tetrahedrite Ag6Ge10P12: Thermoelectric Performance of a Long-Forgotten Silver-Cluster Compound. Chem. Mater. 2017, 29, 6956–6965. [Google Scholar] [CrossRef]
- Suwardi, A.; Hu, L.; Wang, X.; Tan, X.Y.; Repaka, D.V.M.; Wong, L.-M.; Ni, X.; Liew, W.H.; Lim, S.H.; Yan, Q.; et al. Origin of High Thermoelectric Performance in Earth-Abundant Phosphide–Tetrahedrite. ACS Appl. Mater. Interfaces 2020, 12, 9150–9157. [Google Scholar] [CrossRef]
- Mark, J.; Mori, T. Thermoelectric Performance Enhancement of the Cost-Effective Phosphide ZnCu2P8. ACS Appl. Energy Mater. 2021, 4, 4861–4866. [Google Scholar] [CrossRef]
- Quinn, R.J.; Bos, J.W.G. Recent Progress in Phosphide Materials for Thermoelectric Conversion. J. Mater. Chem. A 2023, 11, 8453–8469. [Google Scholar] [CrossRef]
- Sreeparvathy, P.C.; Kanchana, V.; Vaitheeswaran, G. Thermoelectric Properties of Zinc Based Pnictide Semiconductors. J. Appl. Phys. 2016, 119, 85701. [Google Scholar] [CrossRef]
- Ramirez, D.; Menezes, L.T.; Kleinke, H. Thermoelectric Properties of the Chalcopyrite Solid Solutions ZnGe1−XSnxP2. ACS Appl. Electron. Mater. 2024, in press. [Google Scholar] [CrossRef]
- Larson, A.C.; von Dreele, R.B. GSAS—General Structure Analysis System; Los Alamos National Laboratory: Los Alamos, NM, USA, 2000. [Google Scholar]
- Wang, H.; Porter, W.D.; Böttner, H.; König, J.; Chen, L.; Bai, S.; Tritt, T.M.; Mayolet, A.; Senawiratne, J.; Smith, C.; et al. Transport Properties of Bulk Thermoelectrics—An International Round-Robin Study, Part I: Seebeck Coefficient and Electrical Resistivity. J. Electron. Mater. 2013, 42, 654–664. [Google Scholar] [CrossRef]
- Wang, H.; Porter, W.D.; Böttner, H.; König, J.; Chen, L.; Bai, S.; Tritt, T.M.; Mayolett, A.; Senawiratne, J.; Smith, C.; et al. Transport Properties of Bulk Thermoelectrics: An International Round-Robin Study, Part II: Thermal Diffusivity, Specific Heat, and Thermal Conductivity. J. Electron. Mater. 2013, 42, 1073–1084. [Google Scholar] [CrossRef]
- Blaha, P.; Schwarz, K.; Madsen, G.K.H.; Kvasnicka, D.; Luitz, J. WIEN2k, An Augmented Plane Wave + Local Orbitals Program for Calculating Crystal Properties; Schwarz, K., Ed.; Technische Universität Wien: Vienna, Austria, 2001; ISBN 3-9501031-1-2. [Google Scholar]
- Schwarz, K. DFT Calculations of Solids with LAPW and WIEN2k. J. Solid State Chem. 2003, 176, 319–328. [Google Scholar] [CrossRef]
- Blaha, P.; Schwarz, K.; Tran, F.; Laskowski, R.; Madsen, G.K.H.; Marks, L.D. WIEN2k: An APW+lo Program for Calculating the Properties of Solids. J. Chem. Phys. 2020, 152, 074101. [Google Scholar] [CrossRef] [PubMed]
- Perdew, J.P.; Burke, K.; Ernzerhof, M. Generalized Gradient Approximation Made Simple. Phys. Rev. Lett. 1996, 77, 3865–3868. [Google Scholar] [CrossRef]
- Madsen, G.K.H.; Carrete, J.; Verstraete, M.J. BoltzTraP2, a Program for Interpolating Band Structures and Calculating Semi-Classical Transport Coefficients. Comput. Phys. Commun. 2018, 231, 140–145. [Google Scholar] [CrossRef]
- Bilc, D.I.; Hautier, G.; Waroquiers, D.; Rignanese, G.M.; Ghosez, P. Low-Dimensional Transport and Large Thermoelectric Power Factors in Bulk Semiconductors by Band Engineering of Highly Directional Electronic States. Phys. Rev. Lett. 2015, 114, 136601. [Google Scholar] [CrossRef]
- Amsler, M.; Ward, L.; Hegde, V.I.; Goesten, M.G.; Yi, X.; Wolverton, C. Ternary Mixed-Anion Semiconductors with Tunable Band Gaps from Machine-Learning and Crystal Structure Prediction. Phys. Rev. Mater. 2019, 3, 035404. [Google Scholar] [CrossRef]
- Yousuf, S.; Gupta, D.C. Thermoelectric Response of ZrNiSn and ZrNiPb Half-Heuslers: Applicability of Semi-Classical Boltzmann Transport Theory. Results Phys. 2019, 12, 1382–1386. [Google Scholar] [CrossRef]
- Manimaran, M.; Kalkura, S.N.; Ramasamy, P. Crystallization of ZnSnAs2 by Physical Vapour Transport. J. Mater. Sci. Lett. 1995, 14, 1366–1368. [Google Scholar] [CrossRef]
- Masumoto, K.; Isomura, S. The Preparation and Semiconducting Properties of Single Crystals of ZnSnAs2 Compound B. J. Phys. Chem. Solids 1965, 26, 163–171. [Google Scholar] [CrossRef]
- Gasson, D.B.; Holmes, P.J.; Jennings, I.C.; Marathe, B.R.; Parrott, J.E. The Properties of ZnSnAs2 and CdSnAs2. J. Phys. Chem. Solids 1962, 23, 1291–1302. [Google Scholar] [CrossRef]
- Shaban, H.T.; Mobarak, M.; Nassary, M.M. Characterization of CuInSe2 Single Crystal. Phys. B Condens. Matter 2007, 389, 351–354. [Google Scholar] [CrossRef]
- Wang, K.; Qin, P.; Ge, Z.H.; Feng, J. Highly Enhanced Thermoelectric Properties of P-Type CuInSe2 Alloys by the Vacancy Doping. Scr. Mater. 2018, 149, 88–92. [Google Scholar] [CrossRef]
- St-Jean, P.; Seryogin, G.A.; Francoeur, S. Band Gap of Sphalerite and Chalcopyrite Phases of Epitaxial ZnSnP2. Appl. Phys. Lett. 2010, 96, 231913. [Google Scholar] [CrossRef]
- Yao, J.; Takas, N.J.; Schliefert, M.L.; Paprocki, D.S.; Blanchard, P.E.R.; Gou, H.; Mar, A.; Exstrom, C.L.; Darveau, S.A.; Poudeu, P.F.P.; et al. Thermoelectric Properties of P-Type CuInSe2 Chalcopyrites Enhanced by Introduction of Manganese. Phys. Rev. B—Condens. Matter Mater. Phys. 2011, 84, 075203. [Google Scholar] [CrossRef]
- Dewasurendra, V.; Schunemann, P.G.; Bristow, A.D.; Zawilski, K.T.; Piyathilaka, H.P.; Sooriyagoda, R.; Johnson, M.B. Terahertz Generation by Optical Rectification in Chalcopyrite Crystals ZnGeP2, CdGeP2 and CdSiP2. Opt. Express 2019, 27, 16958–16965. [Google Scholar] [CrossRef]
Figure 1.
PXRD patterns of ZnSnP2-yAsy series (y = 0, 0.5, 1, 1.5, 2) with calculated patterns for comparison (ZnSnP2: ICSD 22179; ZnSnAs2: ICSD 611439).
Figure 1.
PXRD patterns of ZnSnP2-yAsy series (y = 0, 0.5, 1, 1.5, 2) with calculated patterns for comparison (ZnSnP2: ICSD 22179; ZnSnAs2: ICSD 611439).

Figure 2.
Rietveld refinement results for ZnSnP2-yAsy. (a) unit cell parameters; (b) volume; (c) tetragonality.
Figure 2.
Rietveld refinement results for ZnSnP2-yAsy. (a) unit cell parameters; (b) volume; (c) tetragonality.
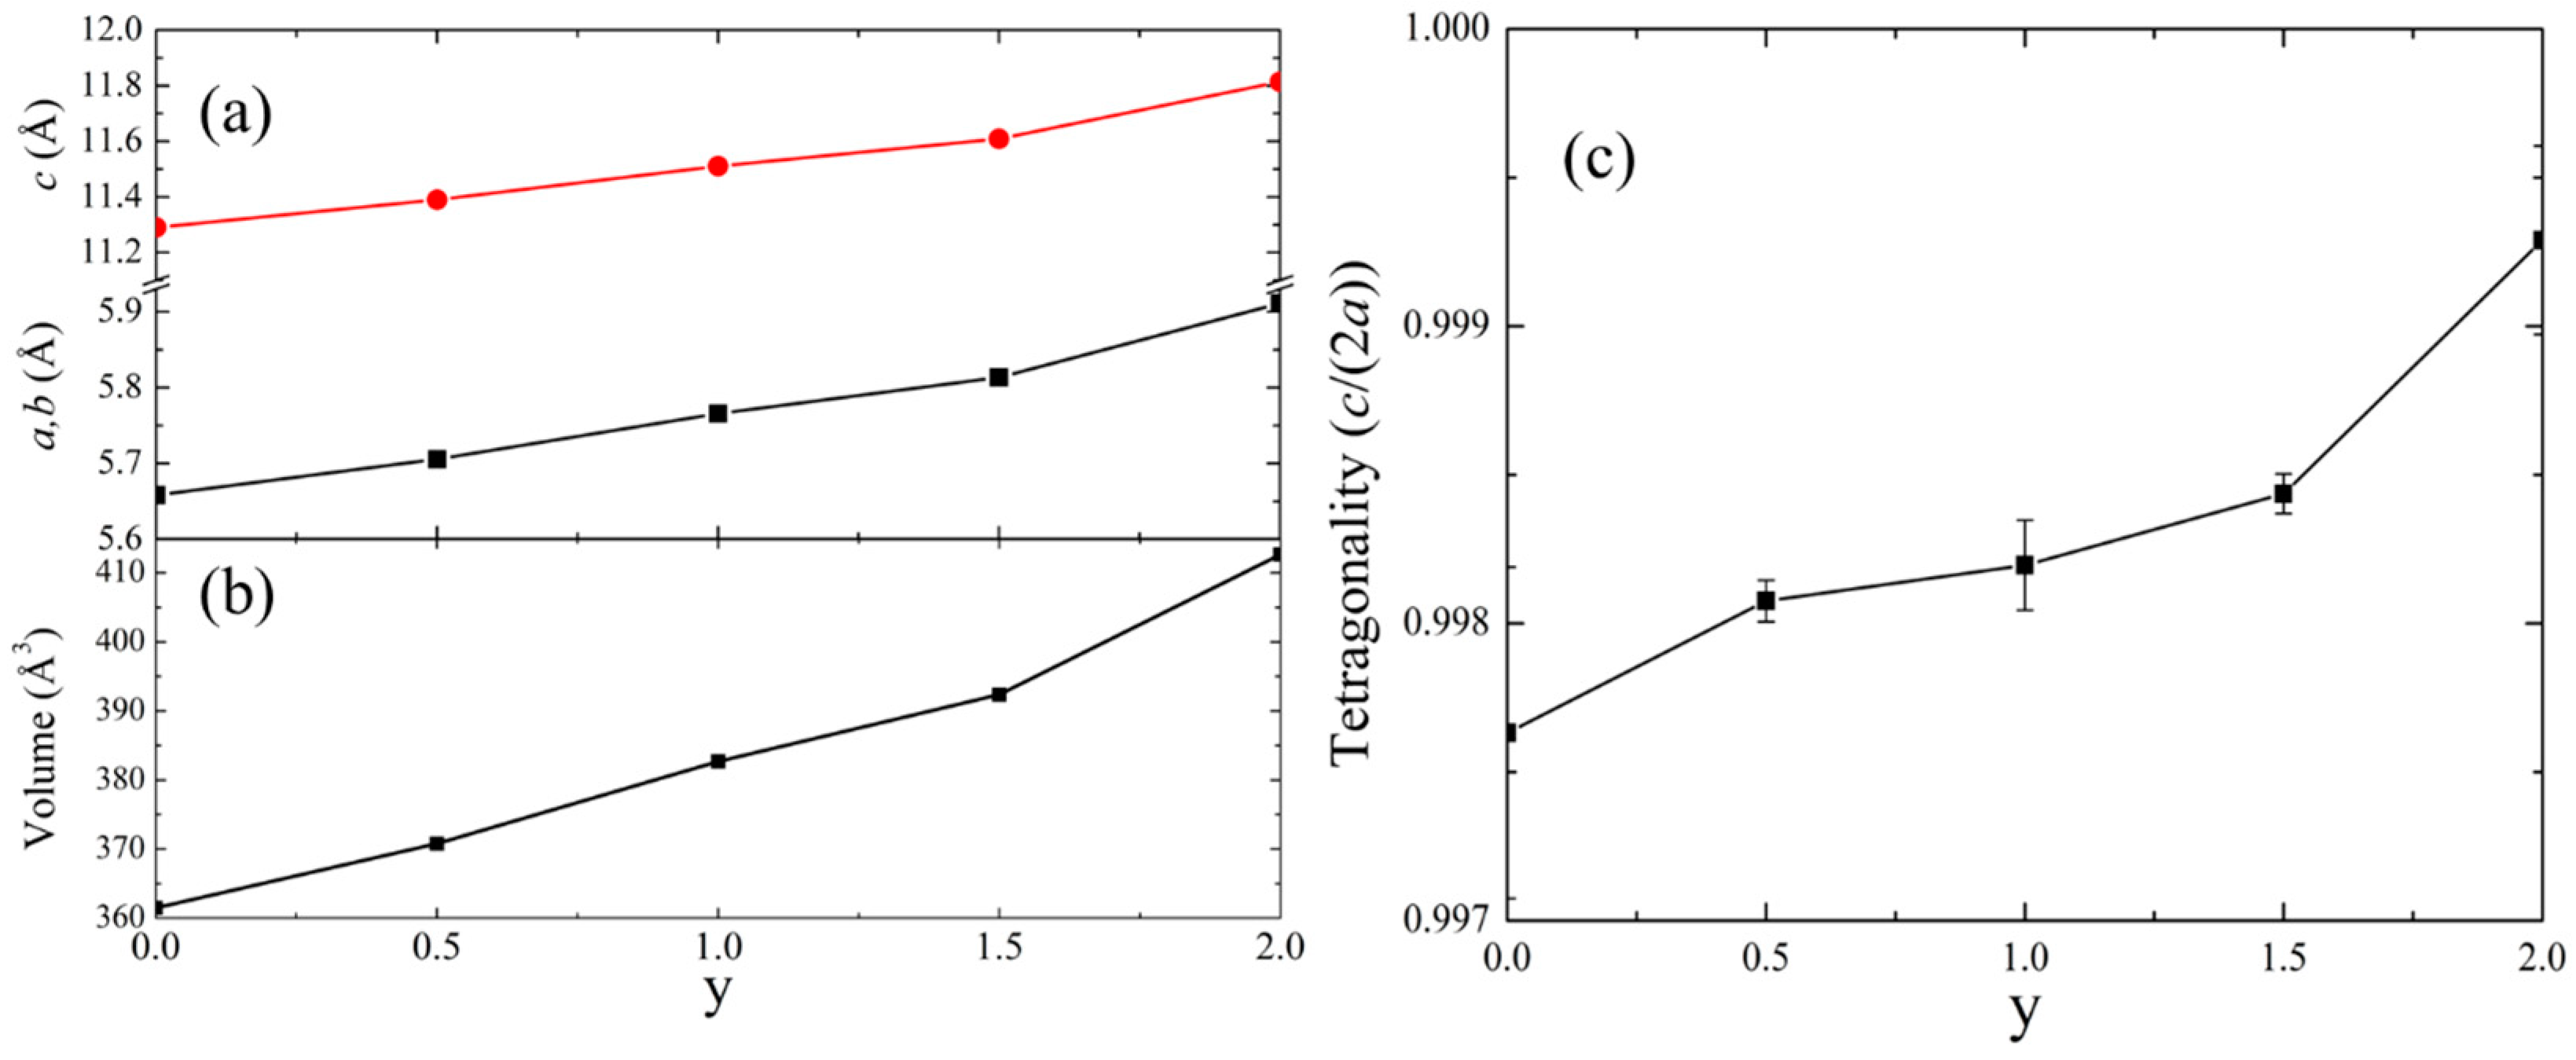
Figure 3.
Electrical conductivity for ZnSnP2-yAsy. Open circles: data collected during cooldown.
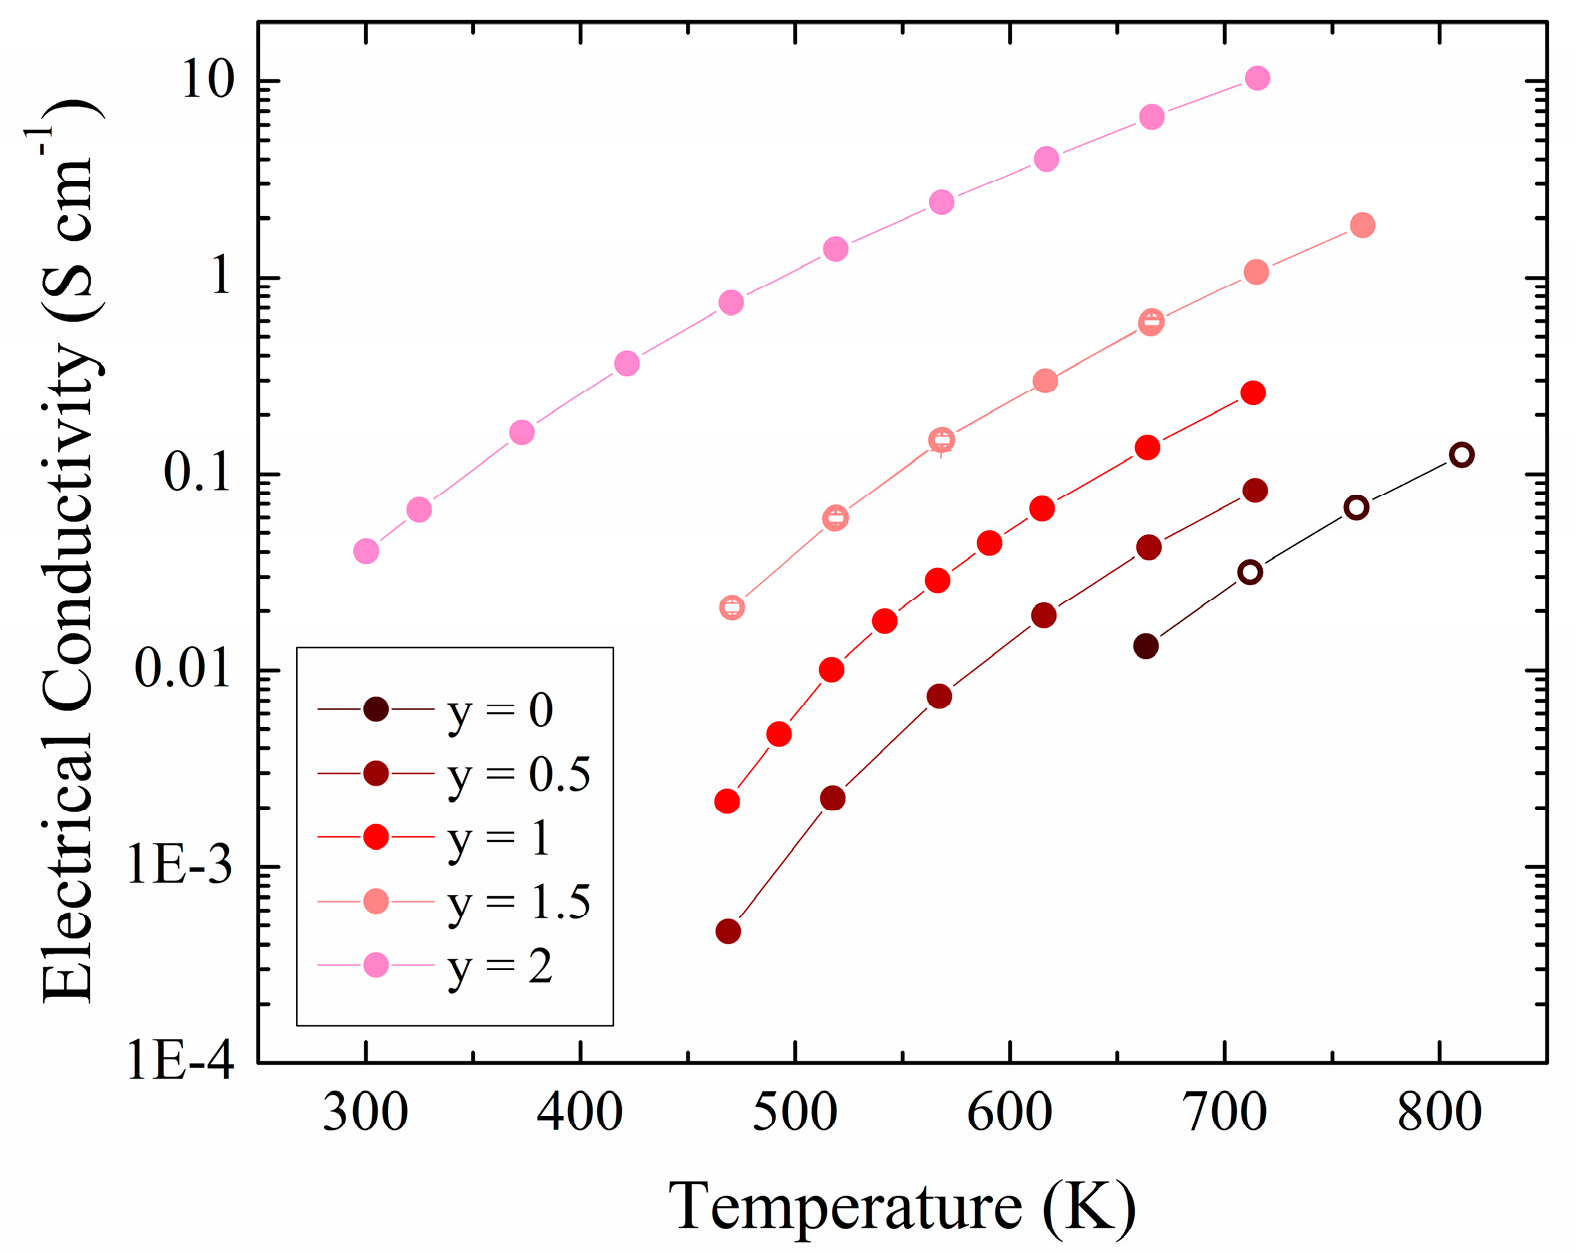
Figure 4.
Arrhenius plots of the electrical conductivity for ZnSnP2-yAsy.
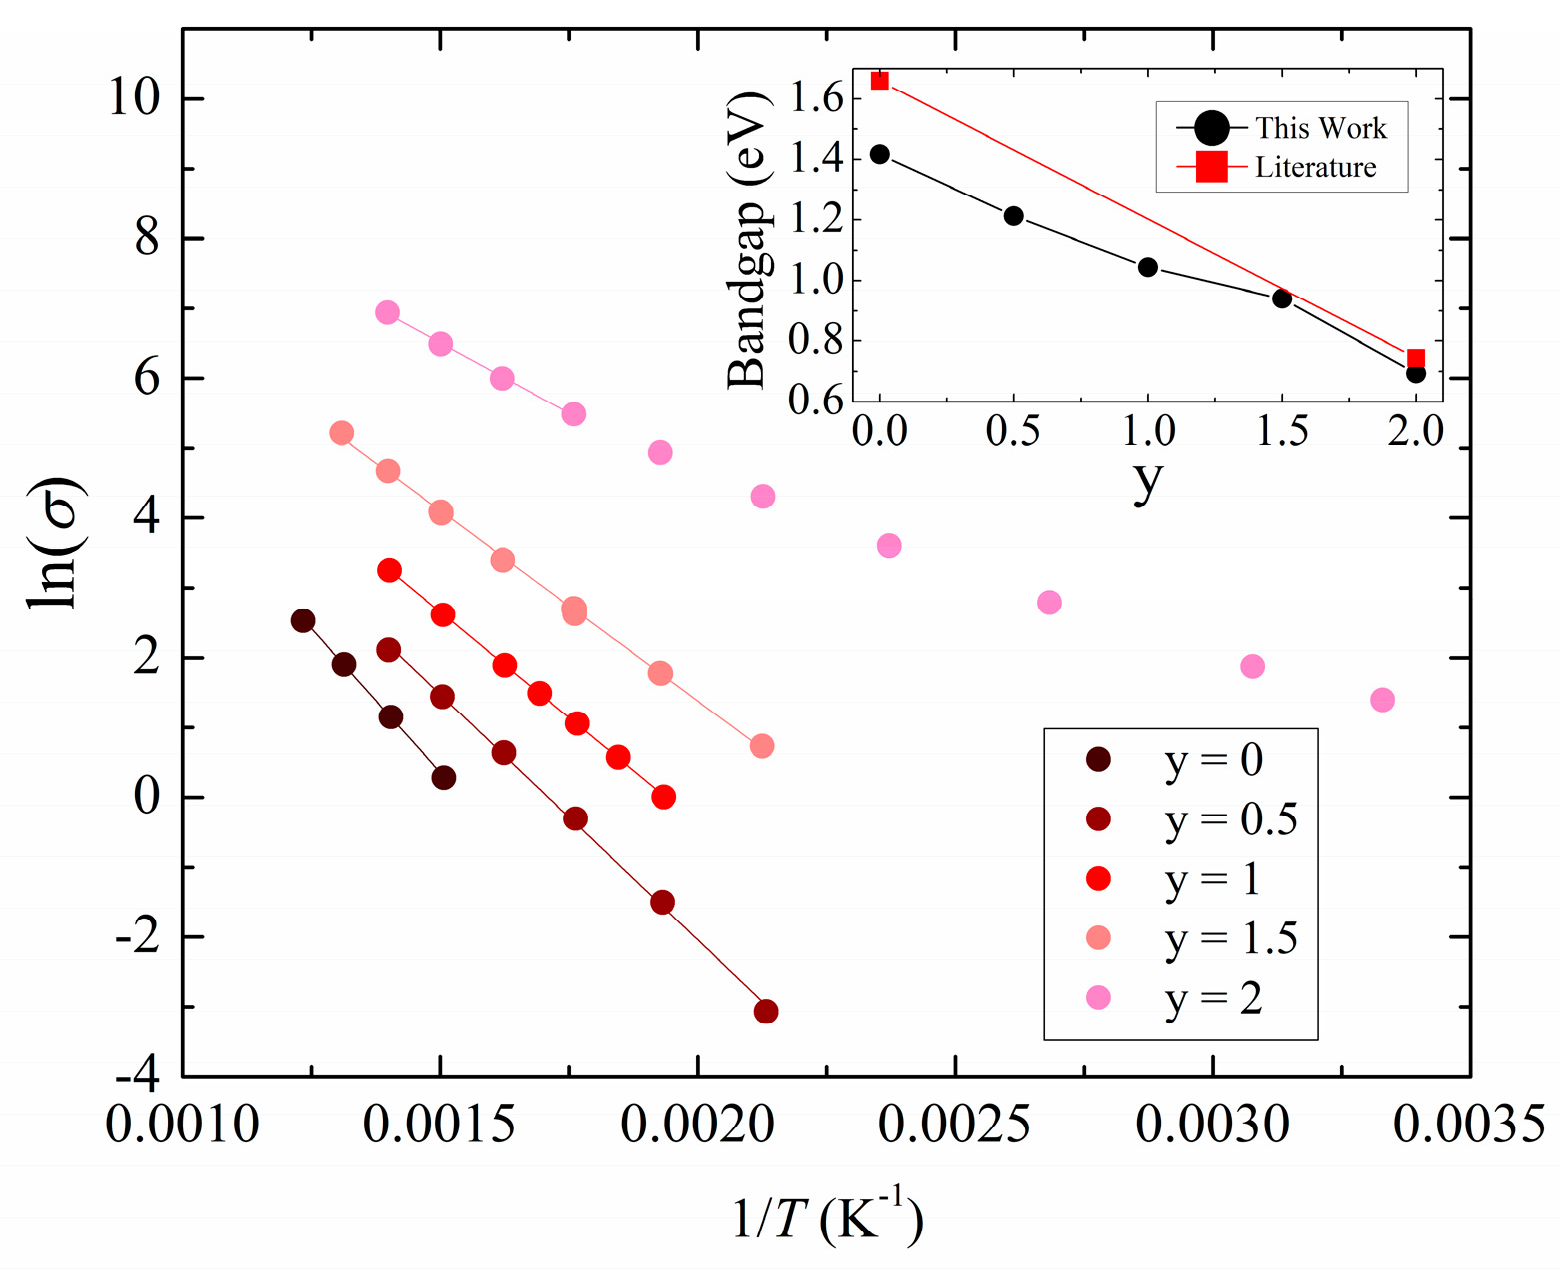
Figure 5.
Seebeck coefficient for ZnSnP2-yAsy. Open circles: data collected during cooldown.

Figure 6.
Thermal conductivity for ZnSnP2-yAsy. Open circles: data collected during cooldown.

Figure 7.
Thermoelectric figure of merit for ZnSnP2-yAsy.
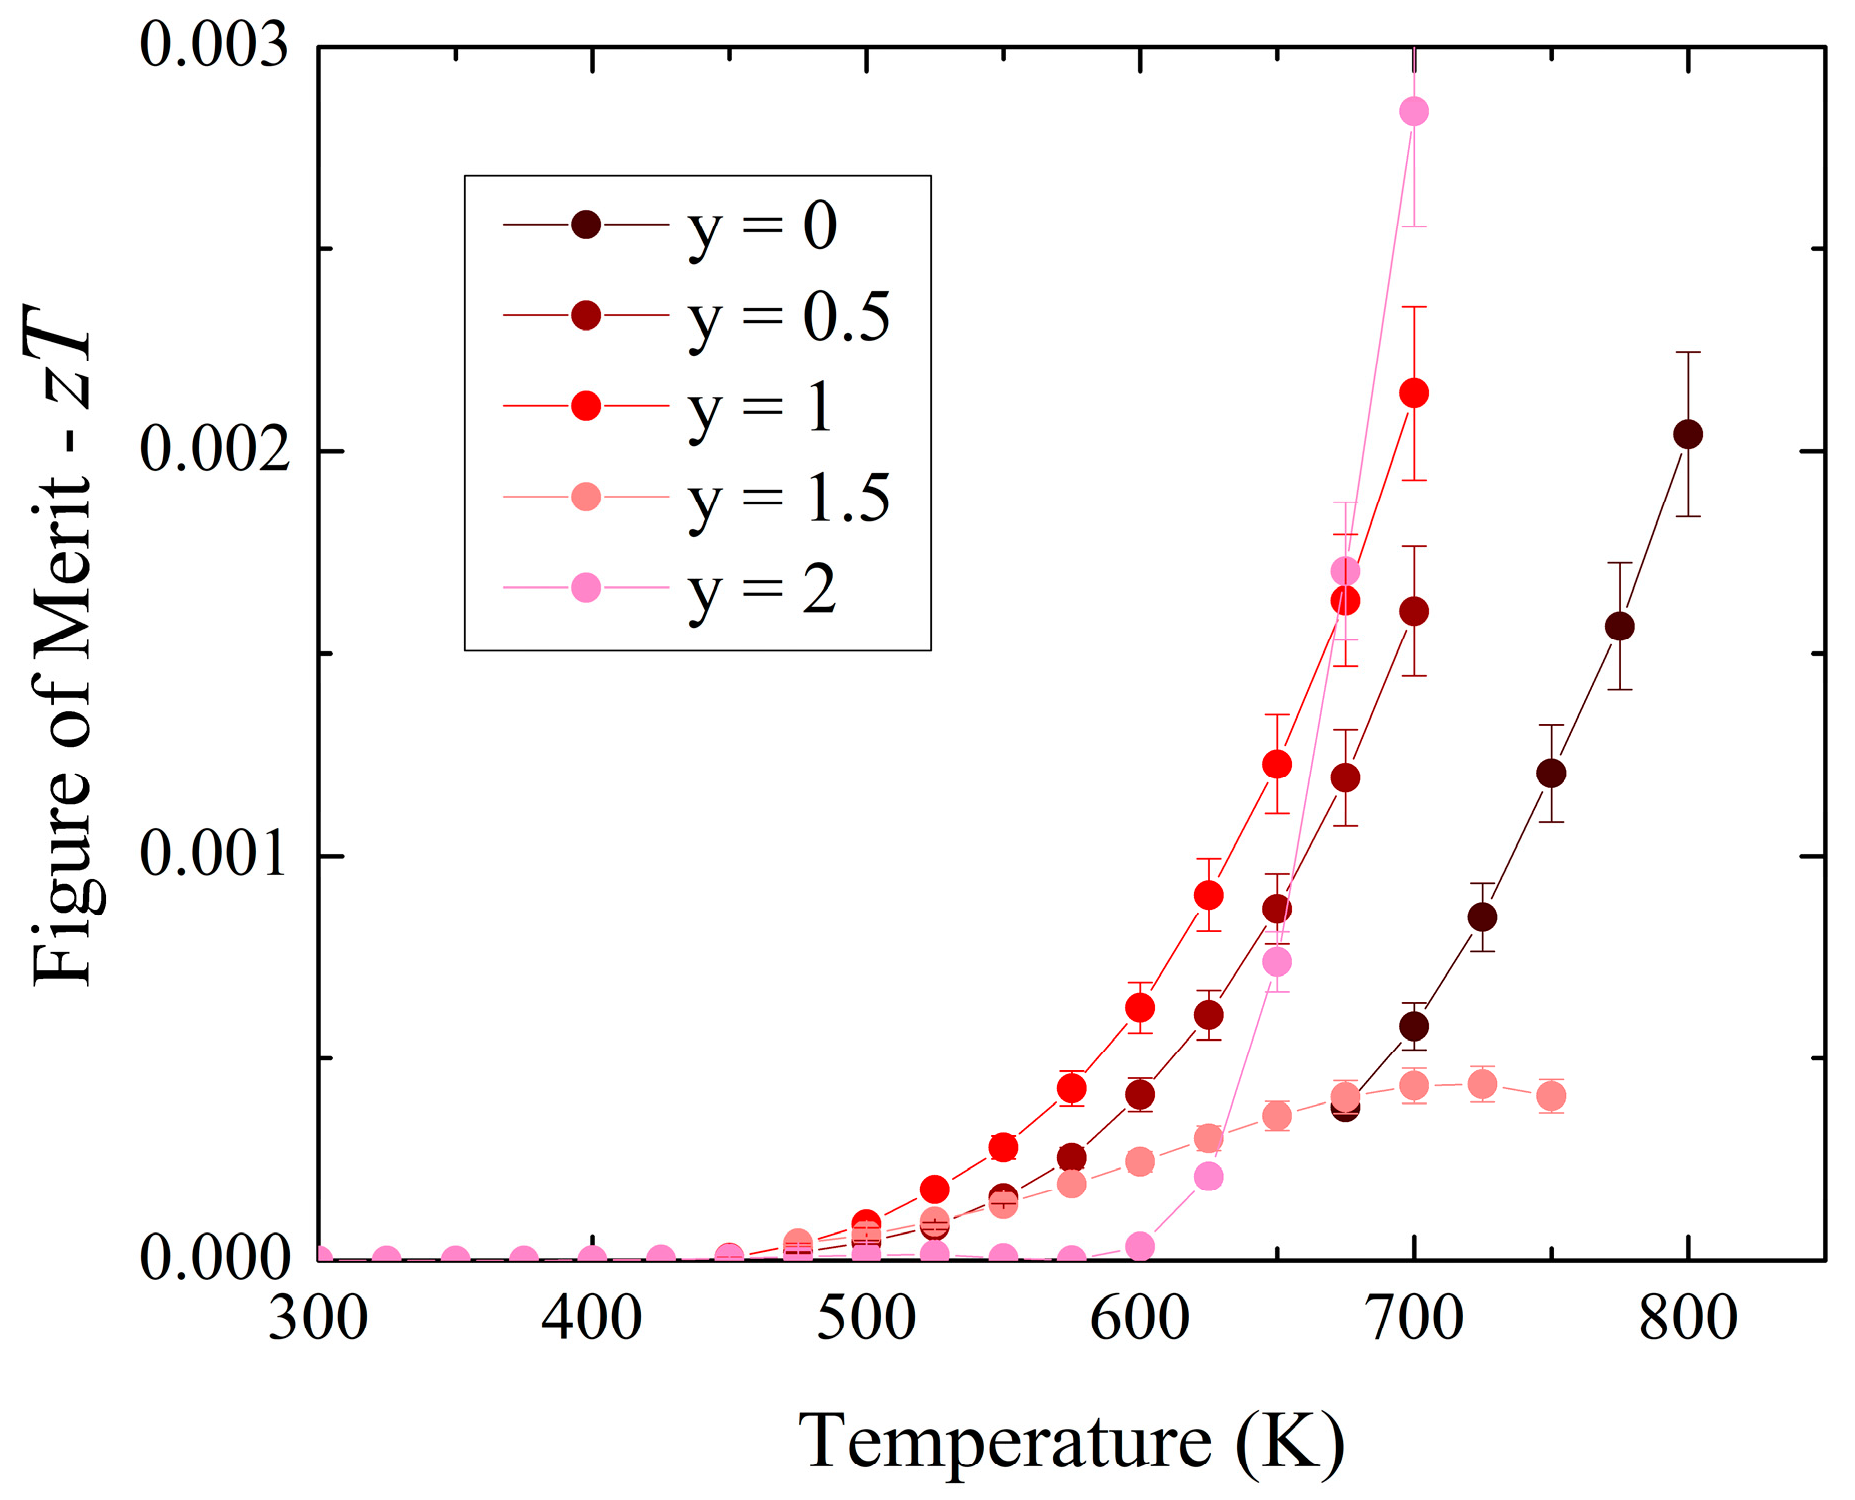
Figure 8.
Band structure (left) and figure of merit (right) for ZnSnAs2.

Figure 9.
BolzTraP2 calculation results for ZnSnAs2: (a) Seebeck coefficient S; (b) electrical conductivity σ, (c) power factor σS2, and (d) electronic thermal conductivity κ0.
Figure 9.
BolzTraP2 calculation results for ZnSnAs2: (a) Seebeck coefficient S; (b) electrical conductivity σ, (c) power factor σS2, and (d) electronic thermal conductivity κ0.
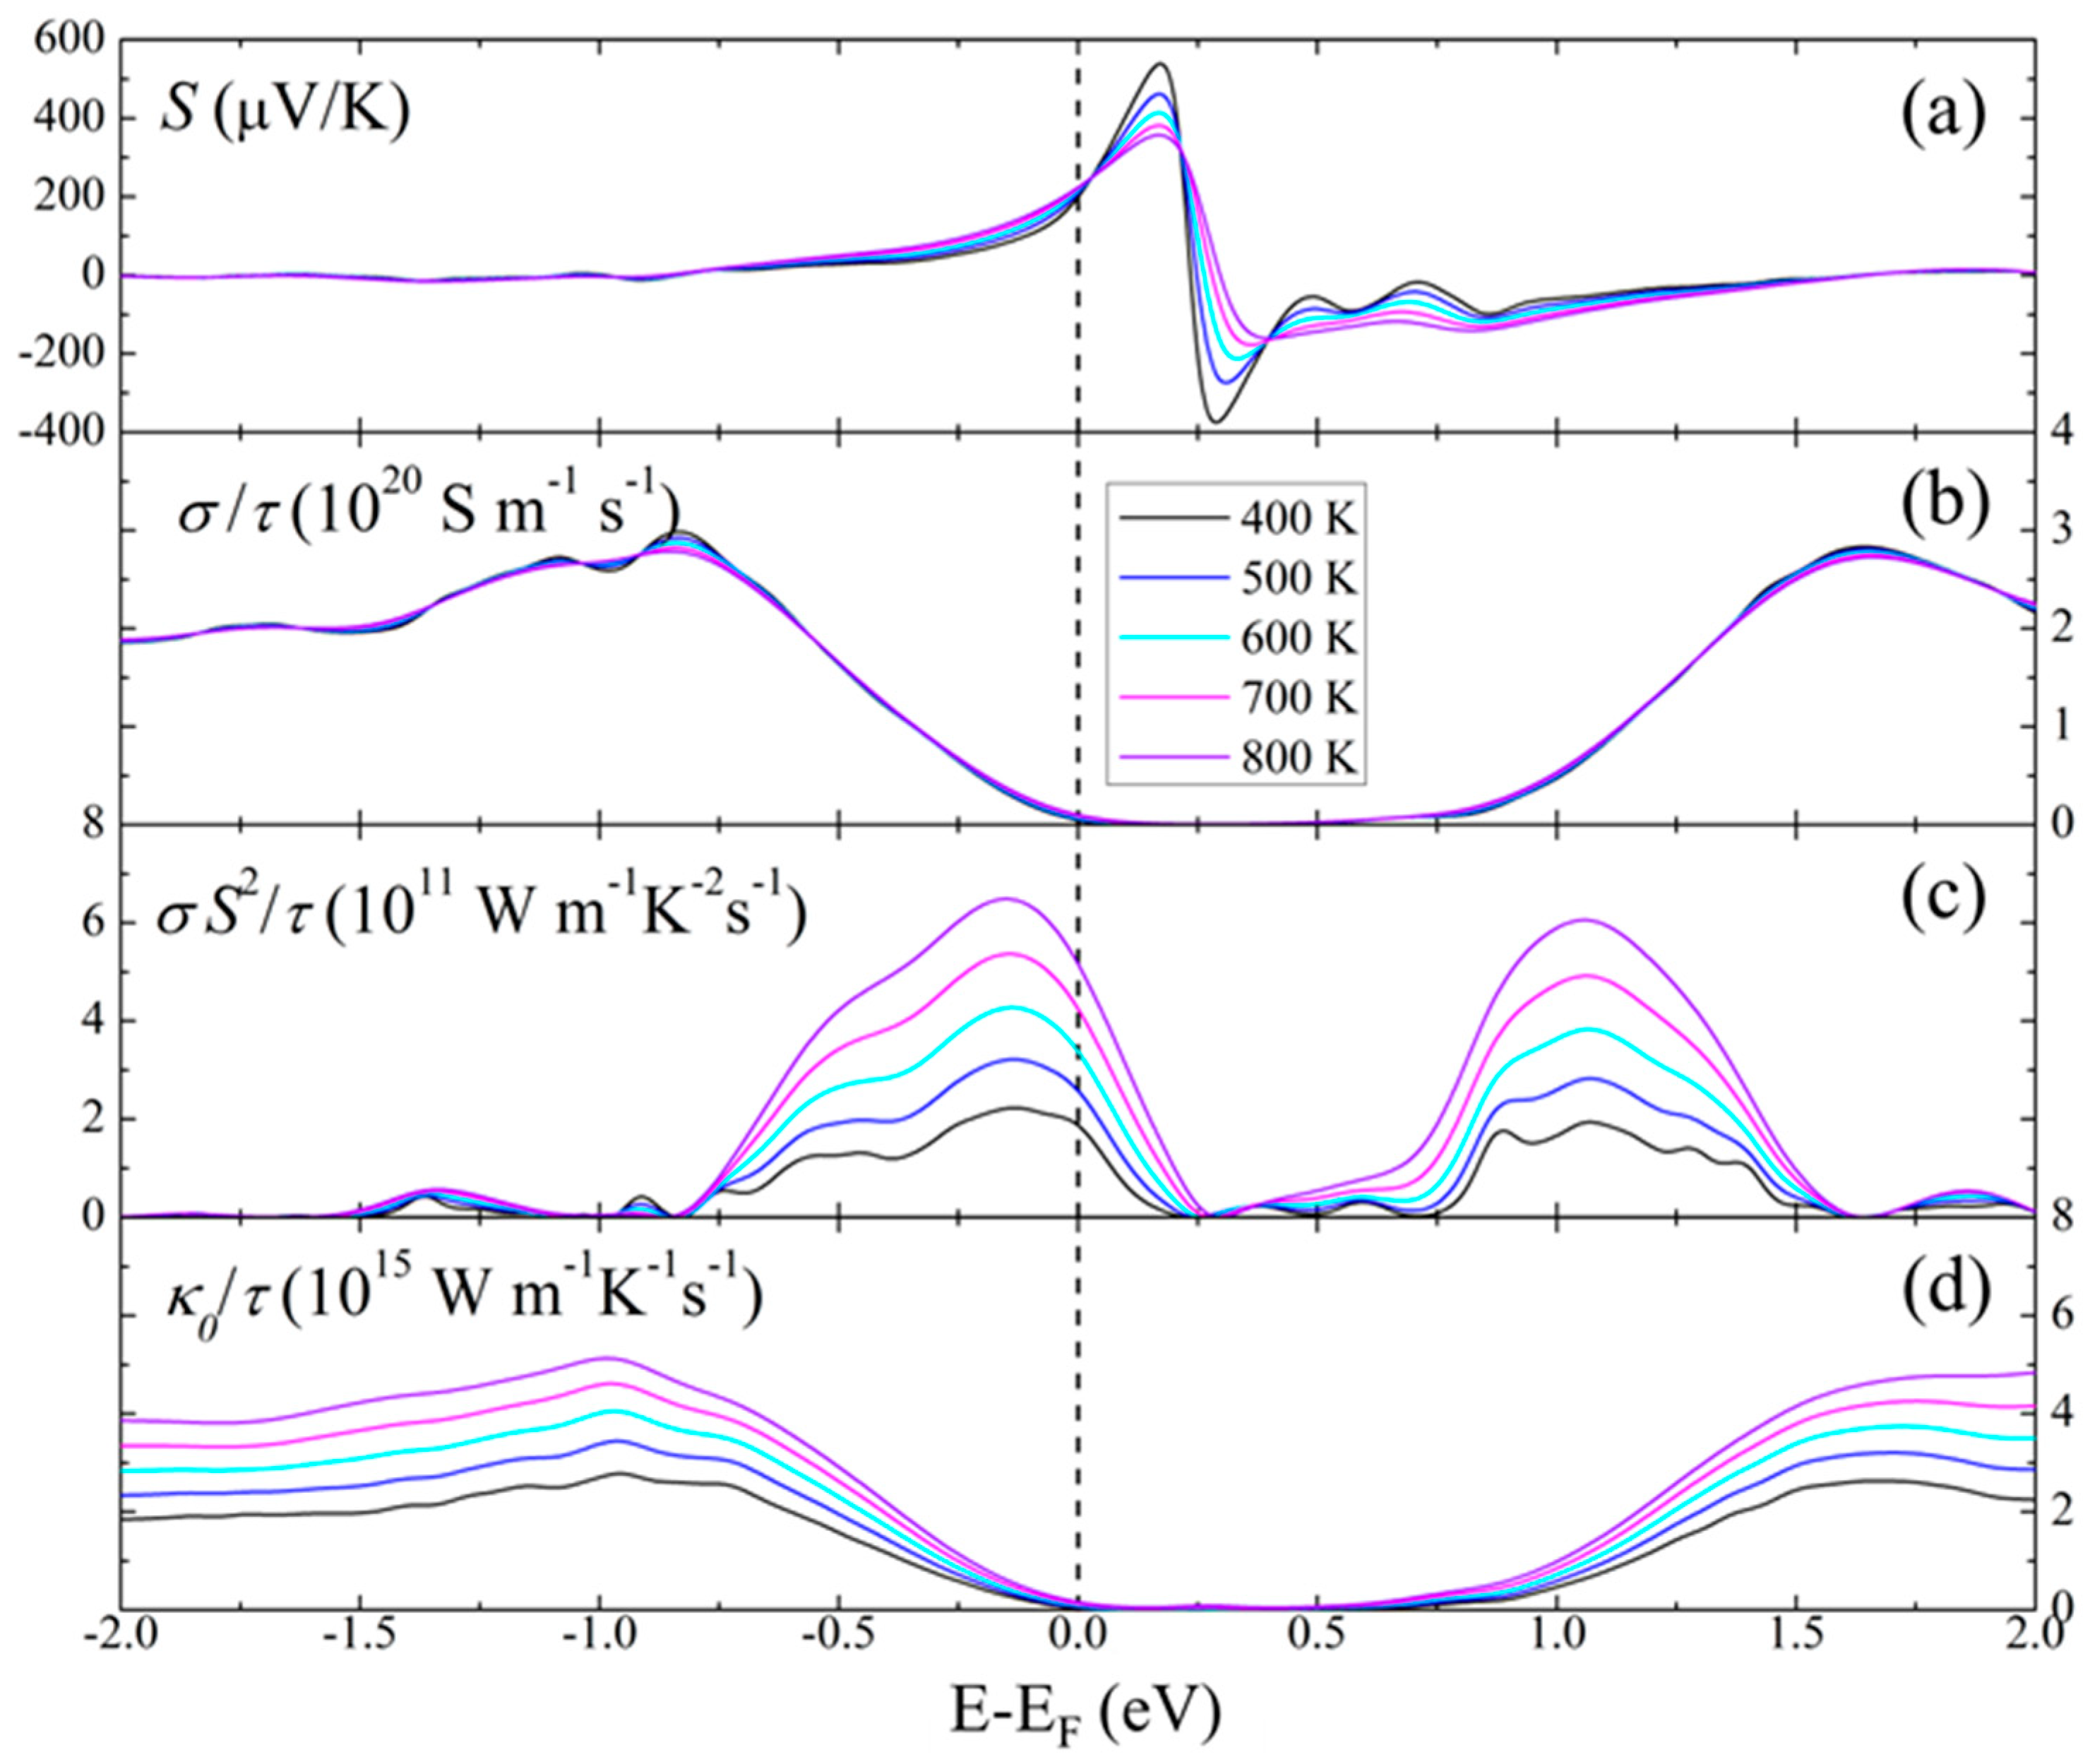
Figure 10.
Estimated figure of merit for ZnSnAs2.


Table 1.
Rietveld refinement results for ZnSnP2-yAsy.
| y | a, b (Å) | c (Å) | V (Å3) | c/(2a) |
|---|---|---|---|---|
| 0.0 | 5.6584(14) | 11.290(4) | 361.48(30) | 0.9976(5) |
| 0.5 | 5.7057(2) | 11.3895(5) | 370.79(1) | 0.9981(1) |
| 1.0 | 5.7659(4) | 11.511(1) | 382.69(3) | 0.9982(2) |
| 1.5 | 5.8133(2) | 11.6085(5) | 392.31(1) | 0.9984(1) |
| 2.0 | 5.9112(8) | 11.814(2) | 412.81(5) | 0.9993(3) |
Table 2.
EDAX analysis results in atomic-% obtained using five-point measurements for ZnSnP2-yAsy.
| Element | y = 0.5 | y = 1.0 | y = 1.5 | y = 2.0 |
|---|---|---|---|---|
| Zn | 24.8 | 23.9 | 24.8 | 21.9 |
| Sn | 25.8 | 24.8 | 25.6 | 32.1 |
| P | 37.5 | 27.1 | 12.7 | - |
| As | 11.9 | 24.2 | 36.9 | 45.9 |
Disclaimer/Publisher’s Note: The statements, opinions and data contained in all publications are solely those of the individual author(s) and contributor(s) and not of MDPI and/or the editor(s). MDPI and/or the editor(s) disclaim responsibility for any injury to people or property resulting from any ideas, methods, instructions or products referred to in the content. |
© 2024 by the authors. Licensee MDPI, Basel, Switzerland. This article is an open access article distributed under the terms and conditions of the Creative Commons Attribution (CC BY) license (https://creativecommons.org/licenses/by/4.0/).
Share and Cite
MDPI and ACS Style
Ramirez, D.; Menezes, L.T.; Kleinke, H. Synthesis and Transport Properties of ZnSnP2-yAsy Chalcopyrite Solid Solutions. Materials 2024, 17, 1712. https://doi.org/10.3390/ma17081712
AMA Style
Ramirez D, Menezes LT, Kleinke H. Synthesis and Transport Properties of ZnSnP2-yAsy Chalcopyrite Solid Solutions. Materials. 2024; 17(8):1712. https://doi.org/10.3390/ma17081712
Chicago/Turabian StyleRamirez, Daniel, Luke T. Menezes, and Holger Kleinke. 2024. "Synthesis and Transport Properties of ZnSnP2-yAsy Chalcopyrite Solid Solutions" Materials 17, no. 8: 1712. https://doi.org/10.3390/ma17081712
Note that from the first issue of 2016, this journal uses article numbers instead of page numbers. See further details here.