
An Experimental and Numerical Study on the Mechanical Properties and Damage Evolution of Cemented Tailings Backfill Under Uniaxial Compression

 ,
, Highlights
- The macroscopic and microscopic deformation and strength characteristics of Cemented tailings backfill (CTB) under uniaxial compression were systematically studied by laboratory tests and numerical simulations.
- A precise damage constitutive model of CTB accounting for the initial compaction stage was proposed, validated, parameterized and applied.
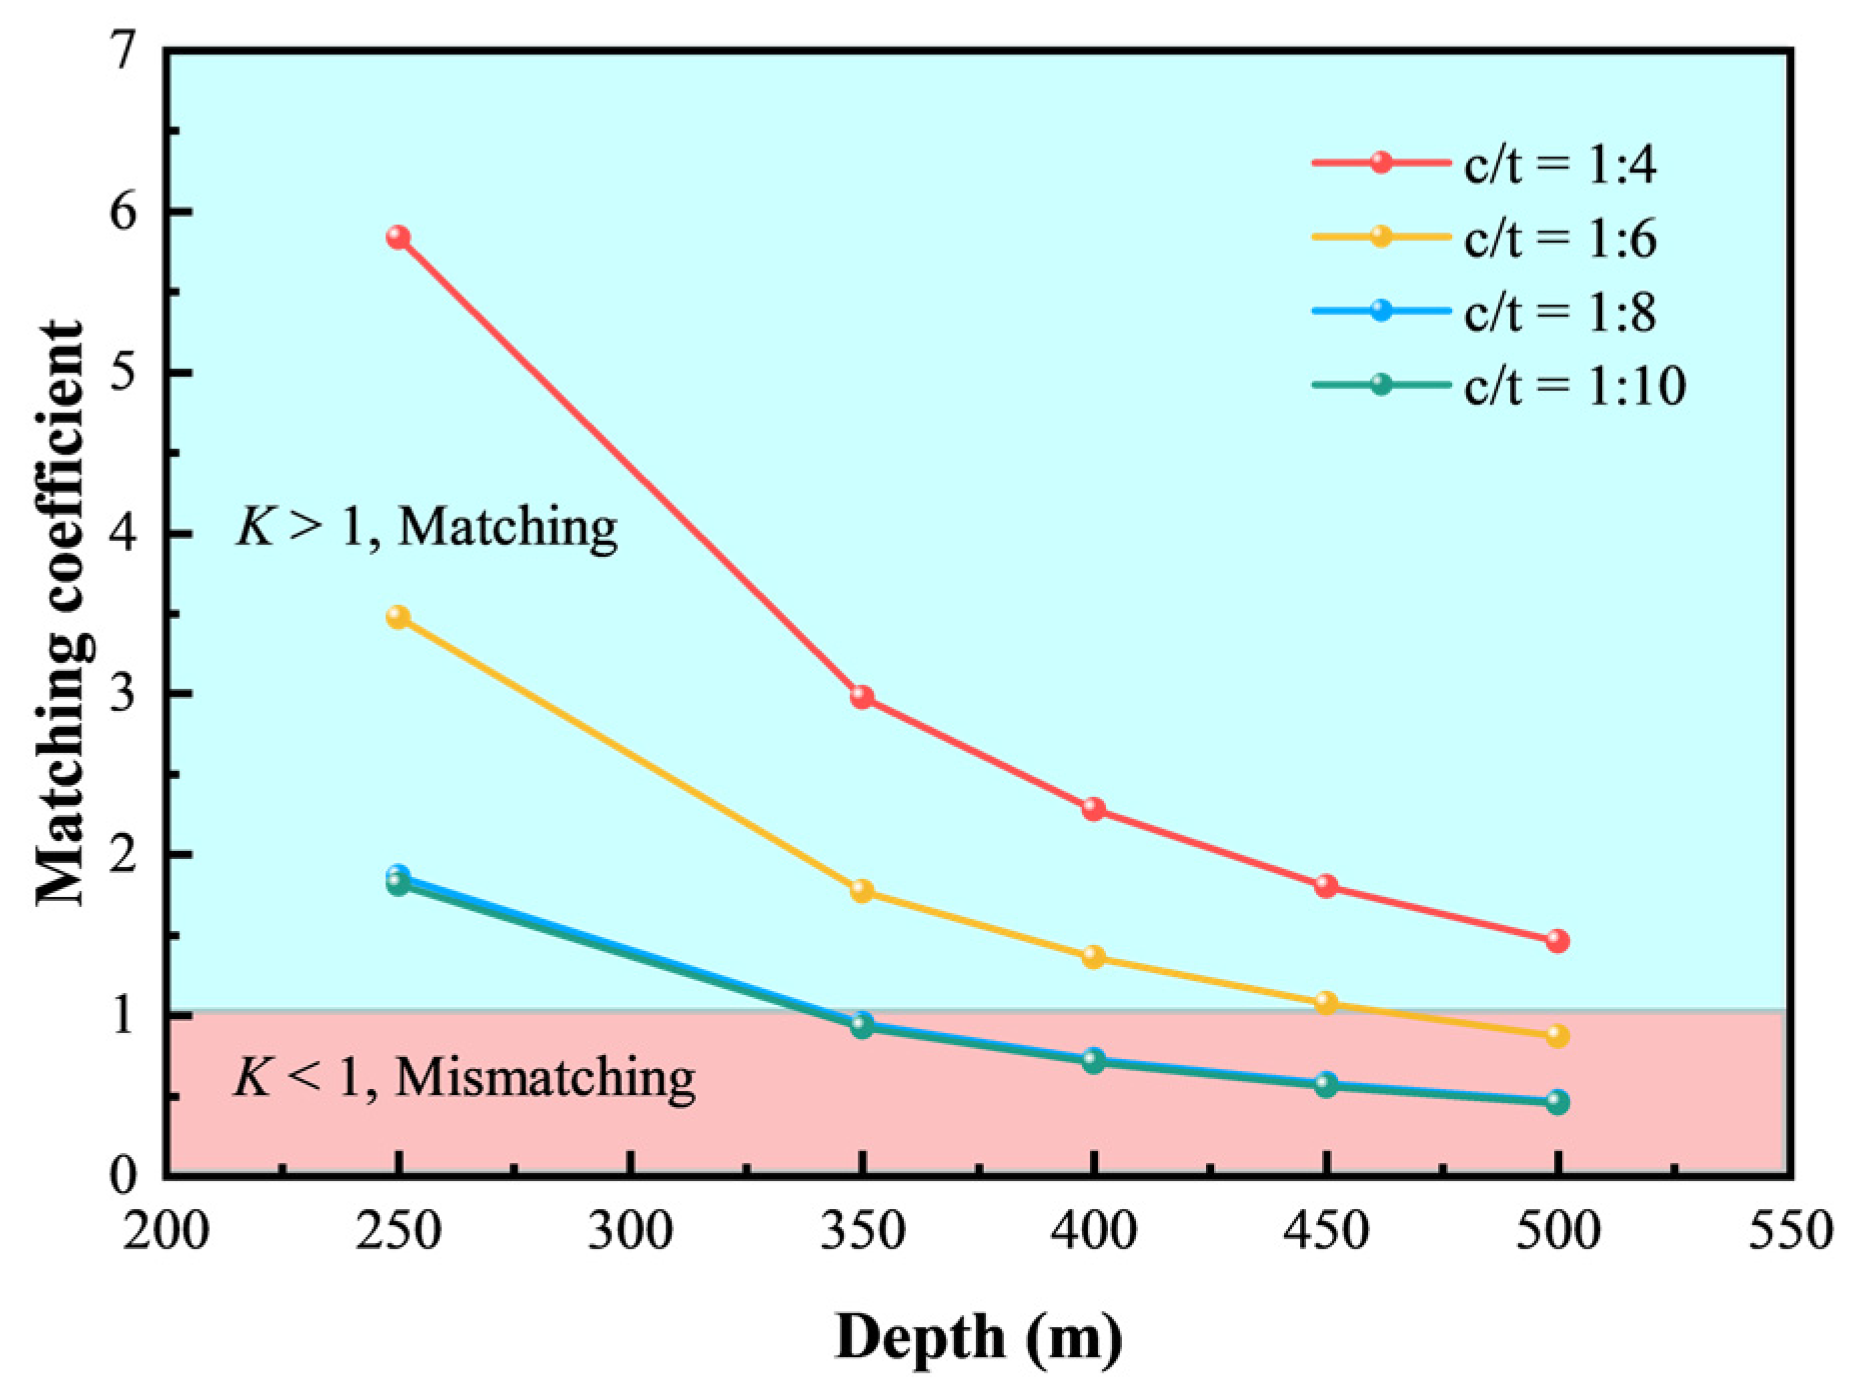
- The matching coefficients evaluated for the 5# ore body of Chaihulanzi Gold Mine, provided economically and safely optimal values of 1:6 c/t ratio for all current mining levels and 1:10 c/t ratio for mining depths under 300.
Abstract
1. Introduction
2. Materials and Methods
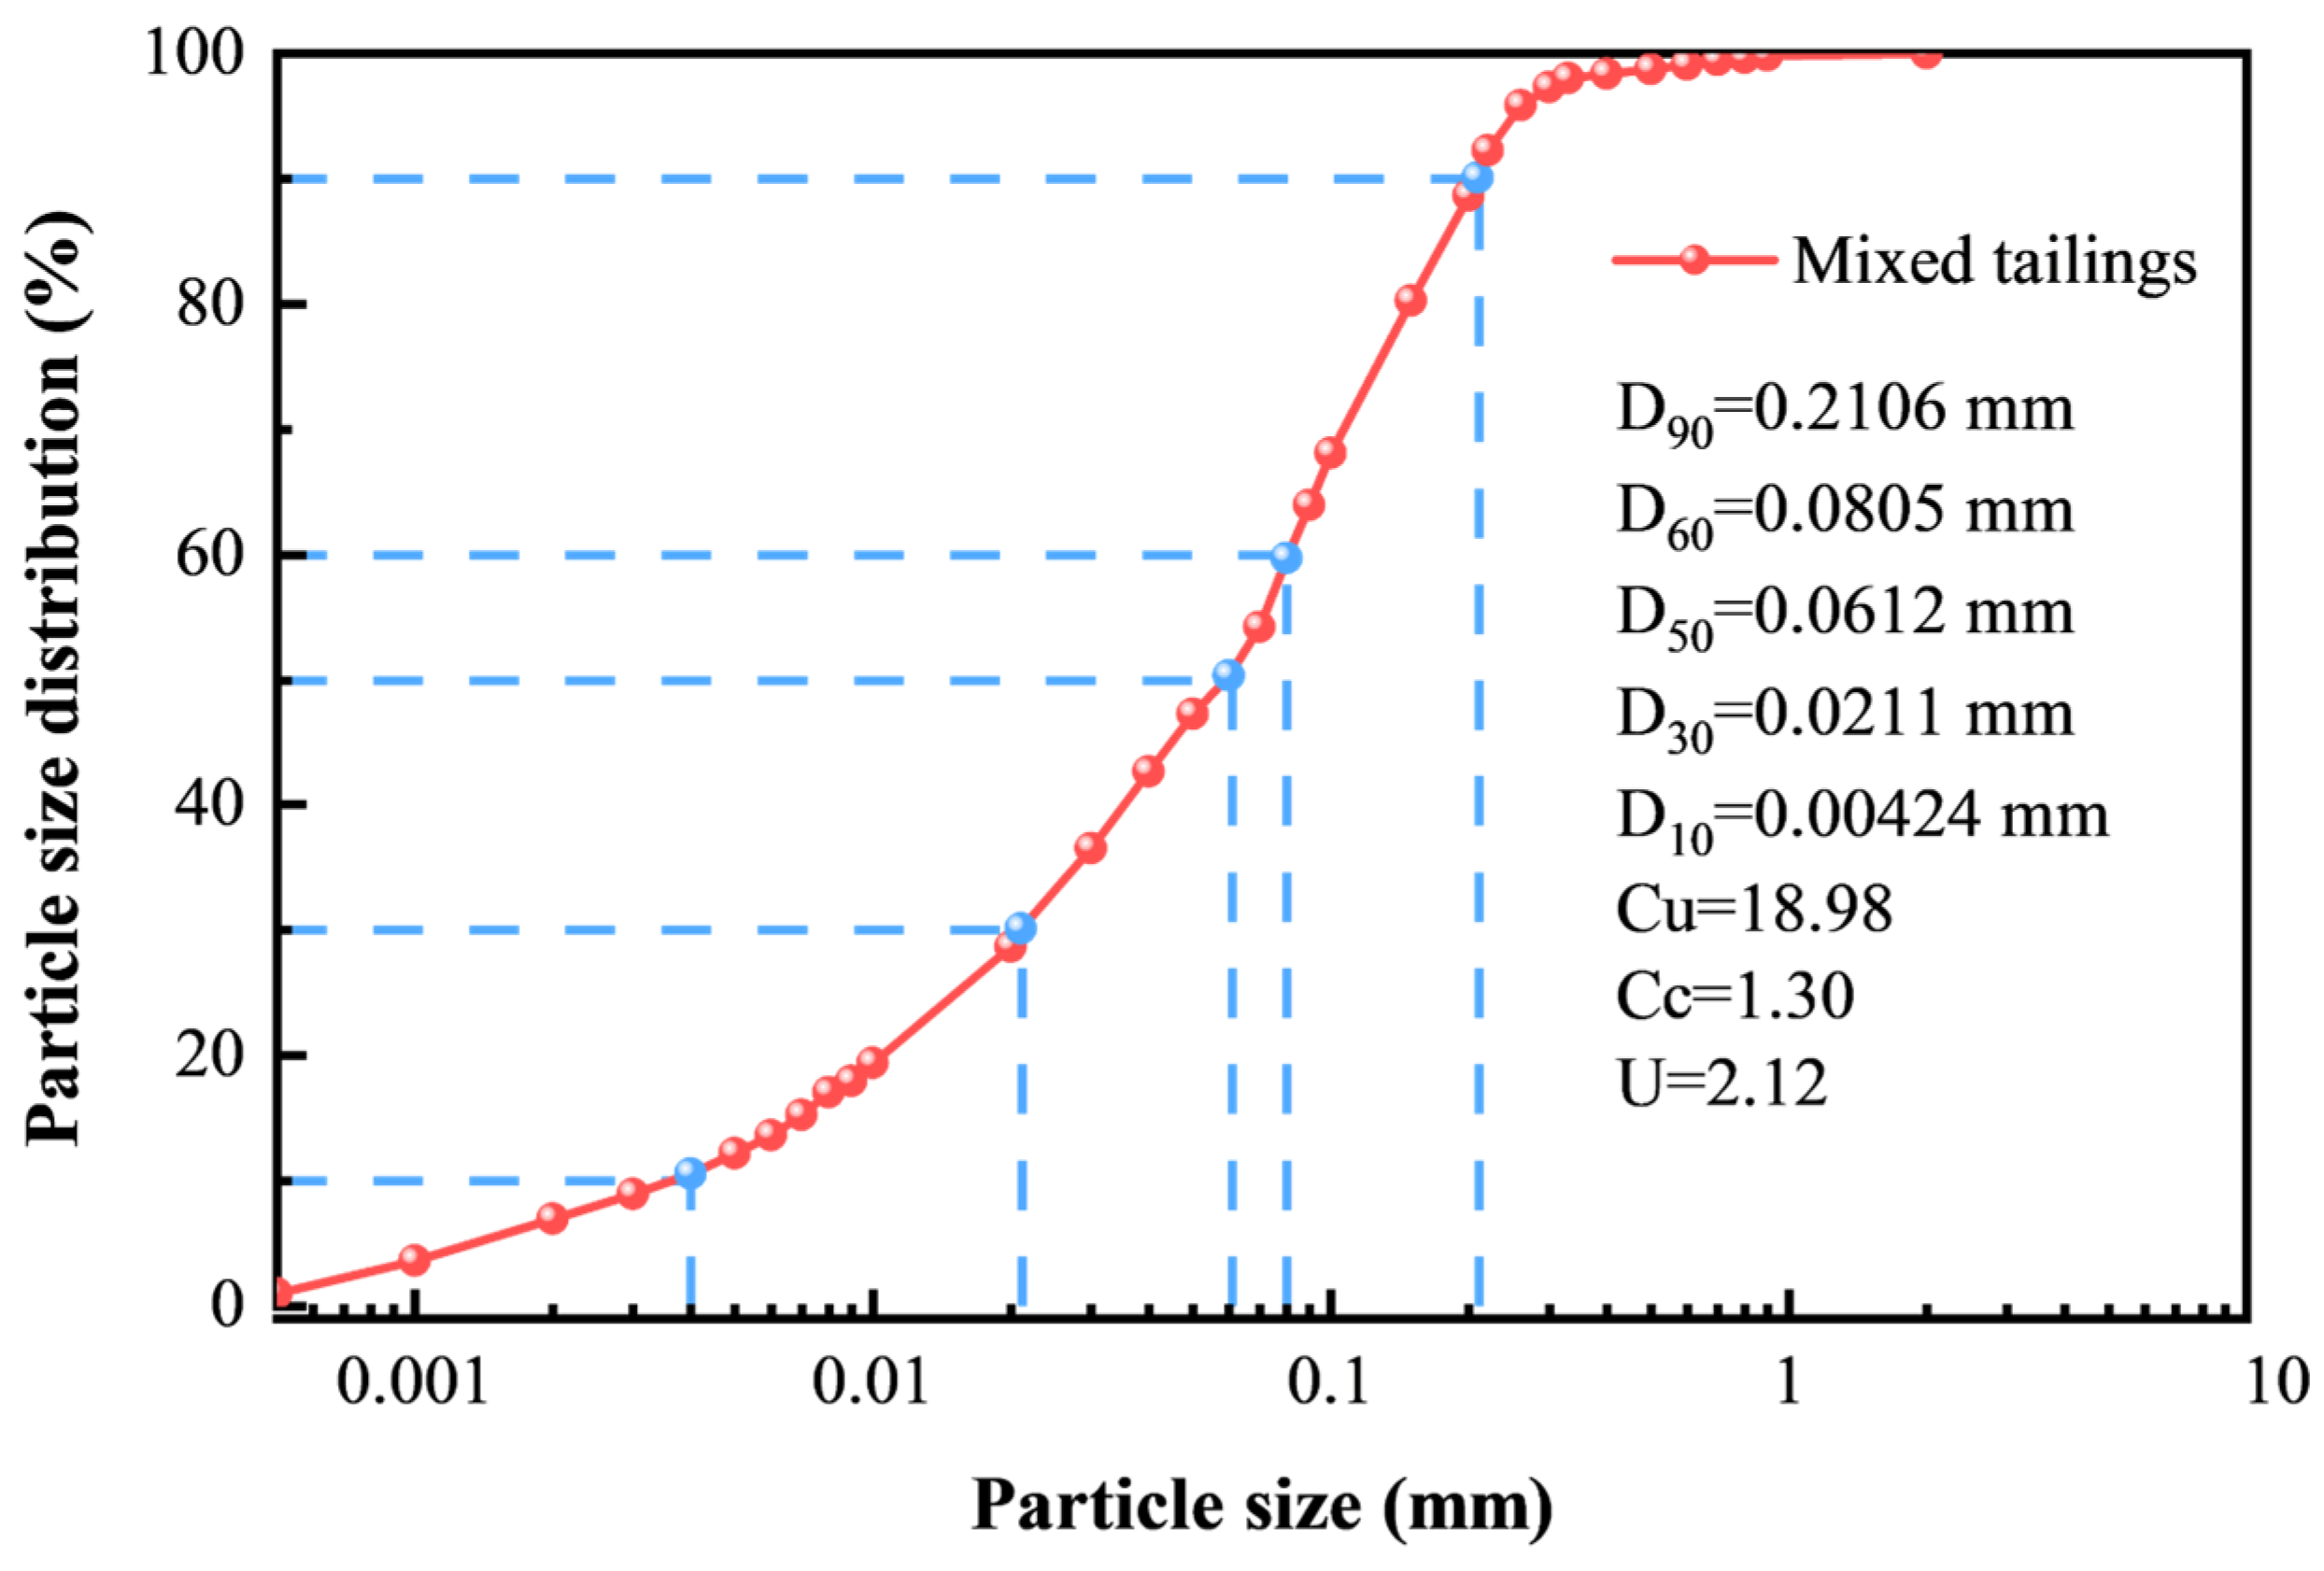
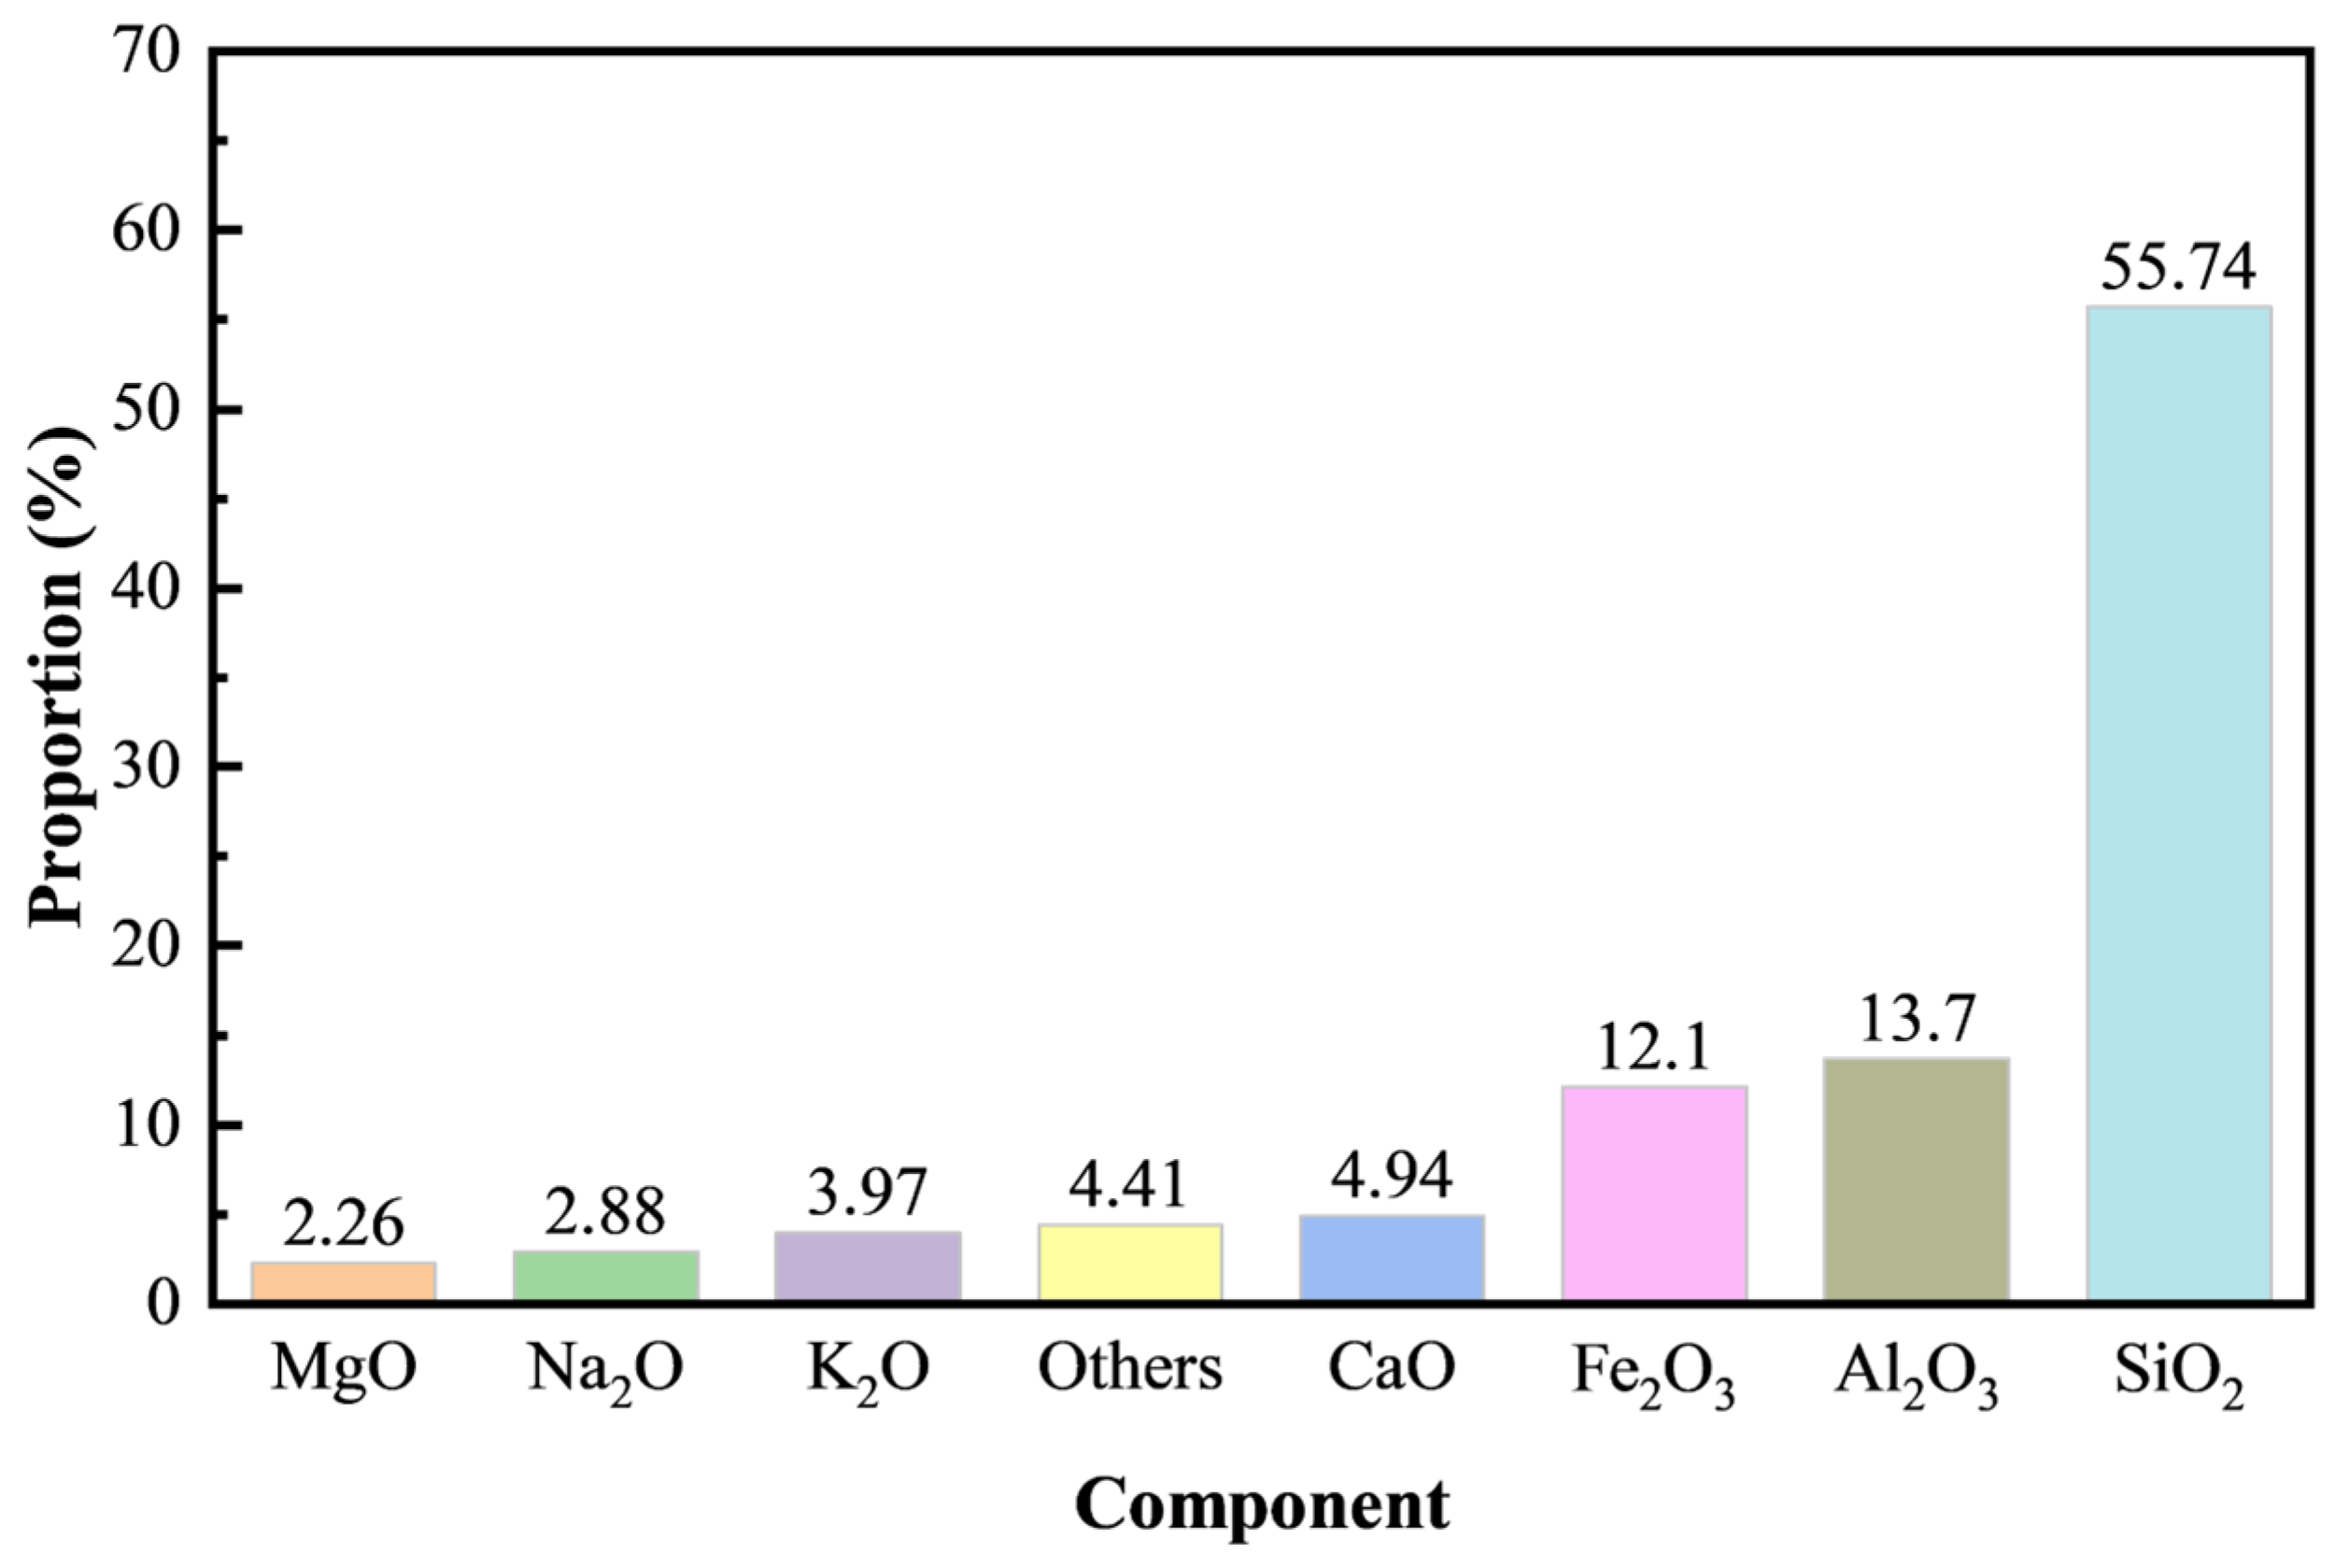
2.1. Materials
2.2. Experimental Scheme and Sample Preparation
- (1)
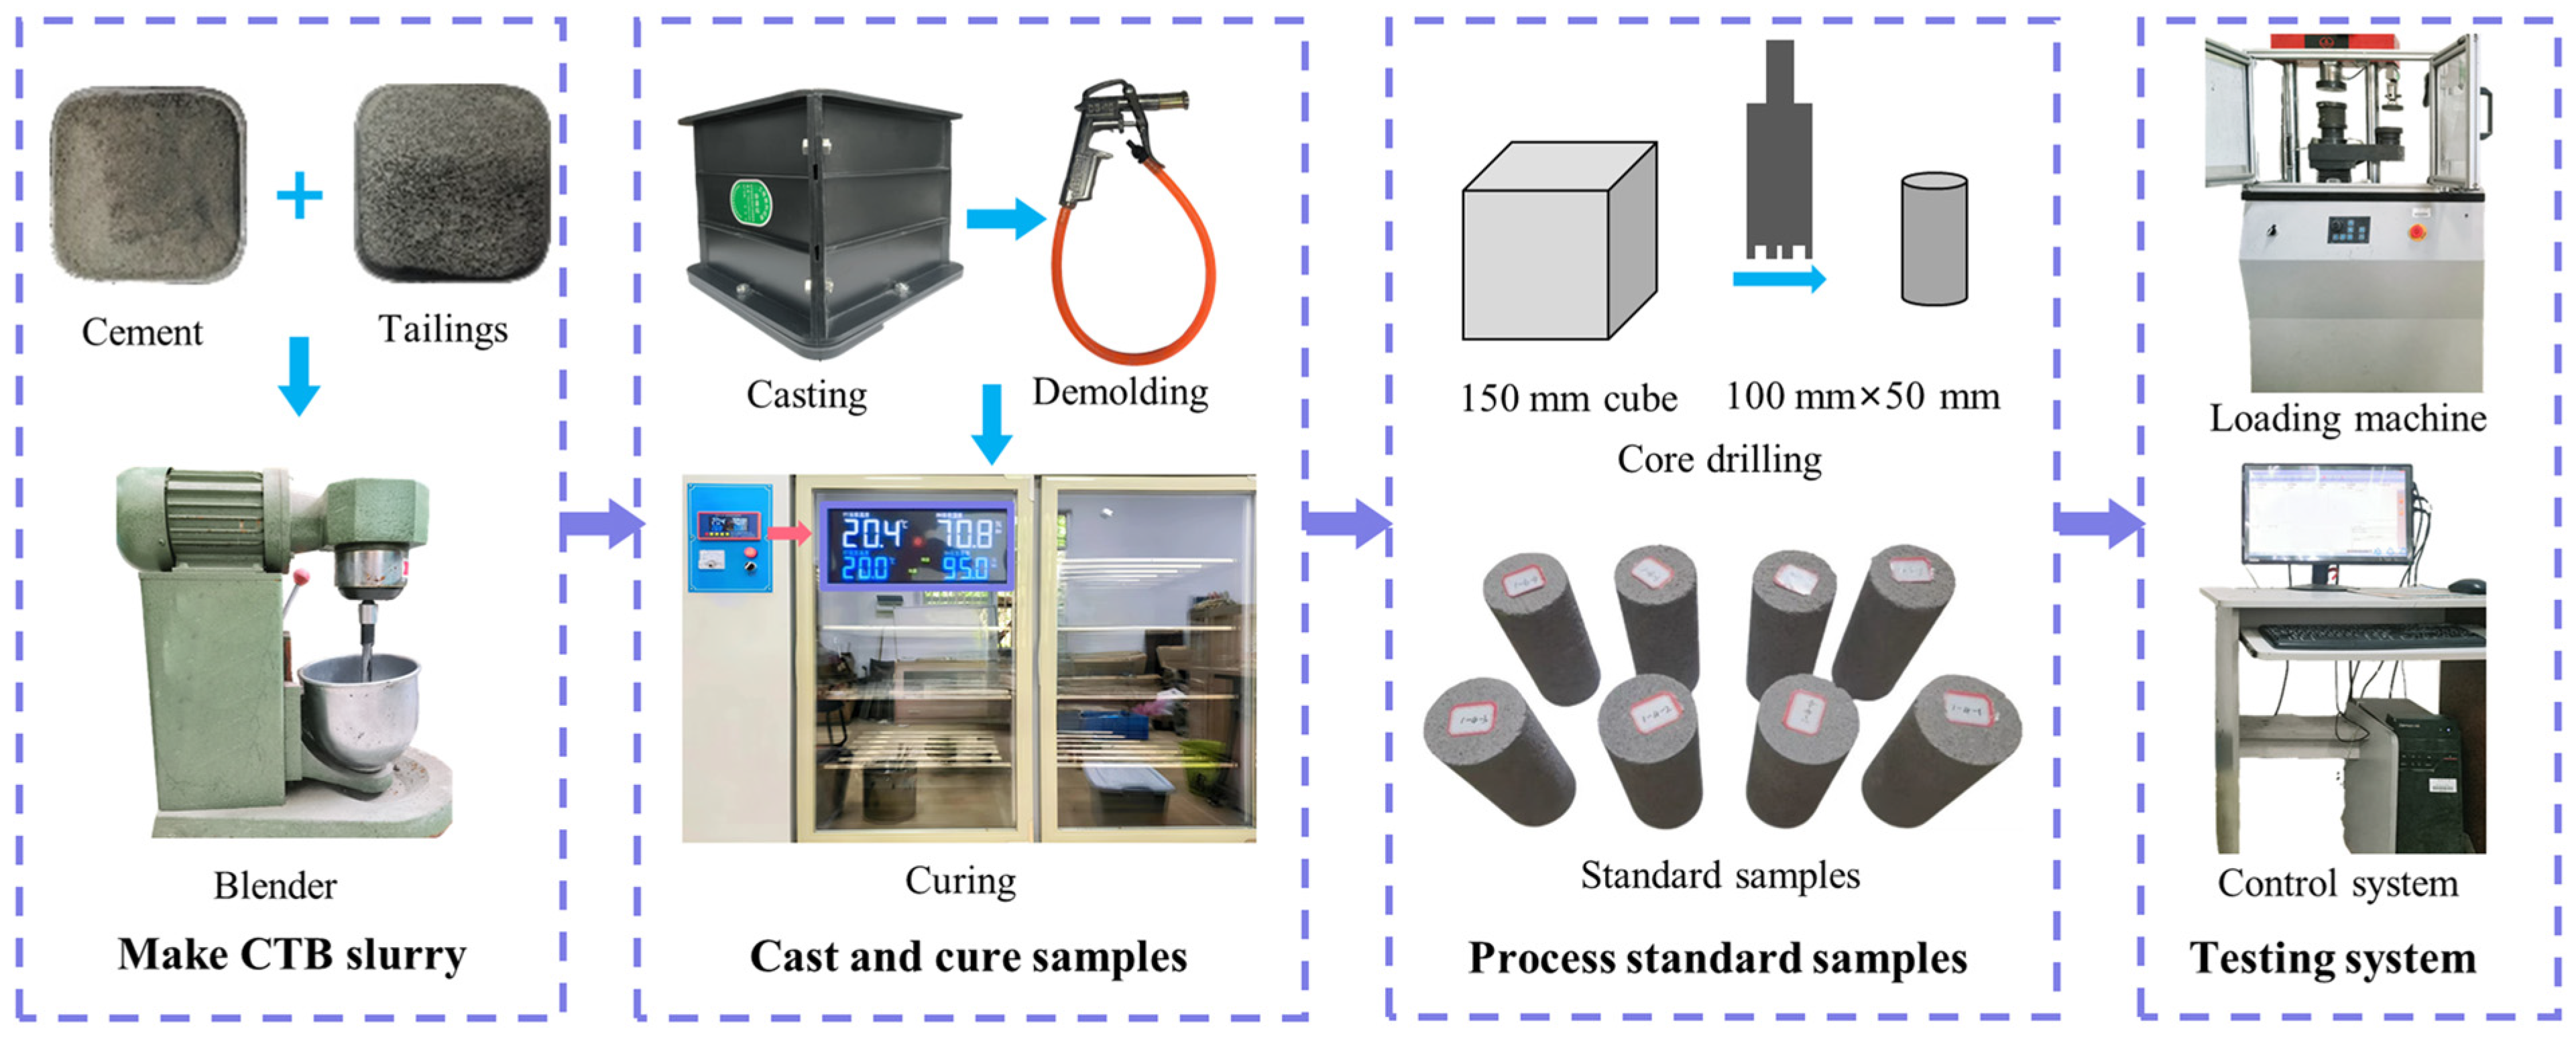
- Make CTB slurry: The tailings were placed in an oven for drying to remove the moisture. The tailings and cement were weighed in sequence following the designed maximum ratios aforementioned and mixed evenly in a blender. To ensure that the slurry was uniformly mixed, the mixture was stirred for at least 3 min after quantified water was added.
- (2)
- Cast and cure samples: Before pouring, Vaseline is applied to the molds to facilitate demolding. The slurry was poured into 150 mm × 150 mm × 150 mm cubic molds and vibrated for 2 min on a shake table to smooth out bubbles. After 24 h, the cubes were demolded with demolding gun and kept in a curing box for 28 d with a constant temperature of 20 ± 2 °C and humidity of 95 ± 5%.
- (3)
- Process standard samples: The cubes were sampled with a core drilling machine and the cylindrical samples were polished to standard dimensions of 50 mm in diameter and 100 mm in height.
2.3. The Testing System and Methods
2.4. Numerical Simulation
3. Results and Discussion
3.1. Macroscopic Mechanical Properties
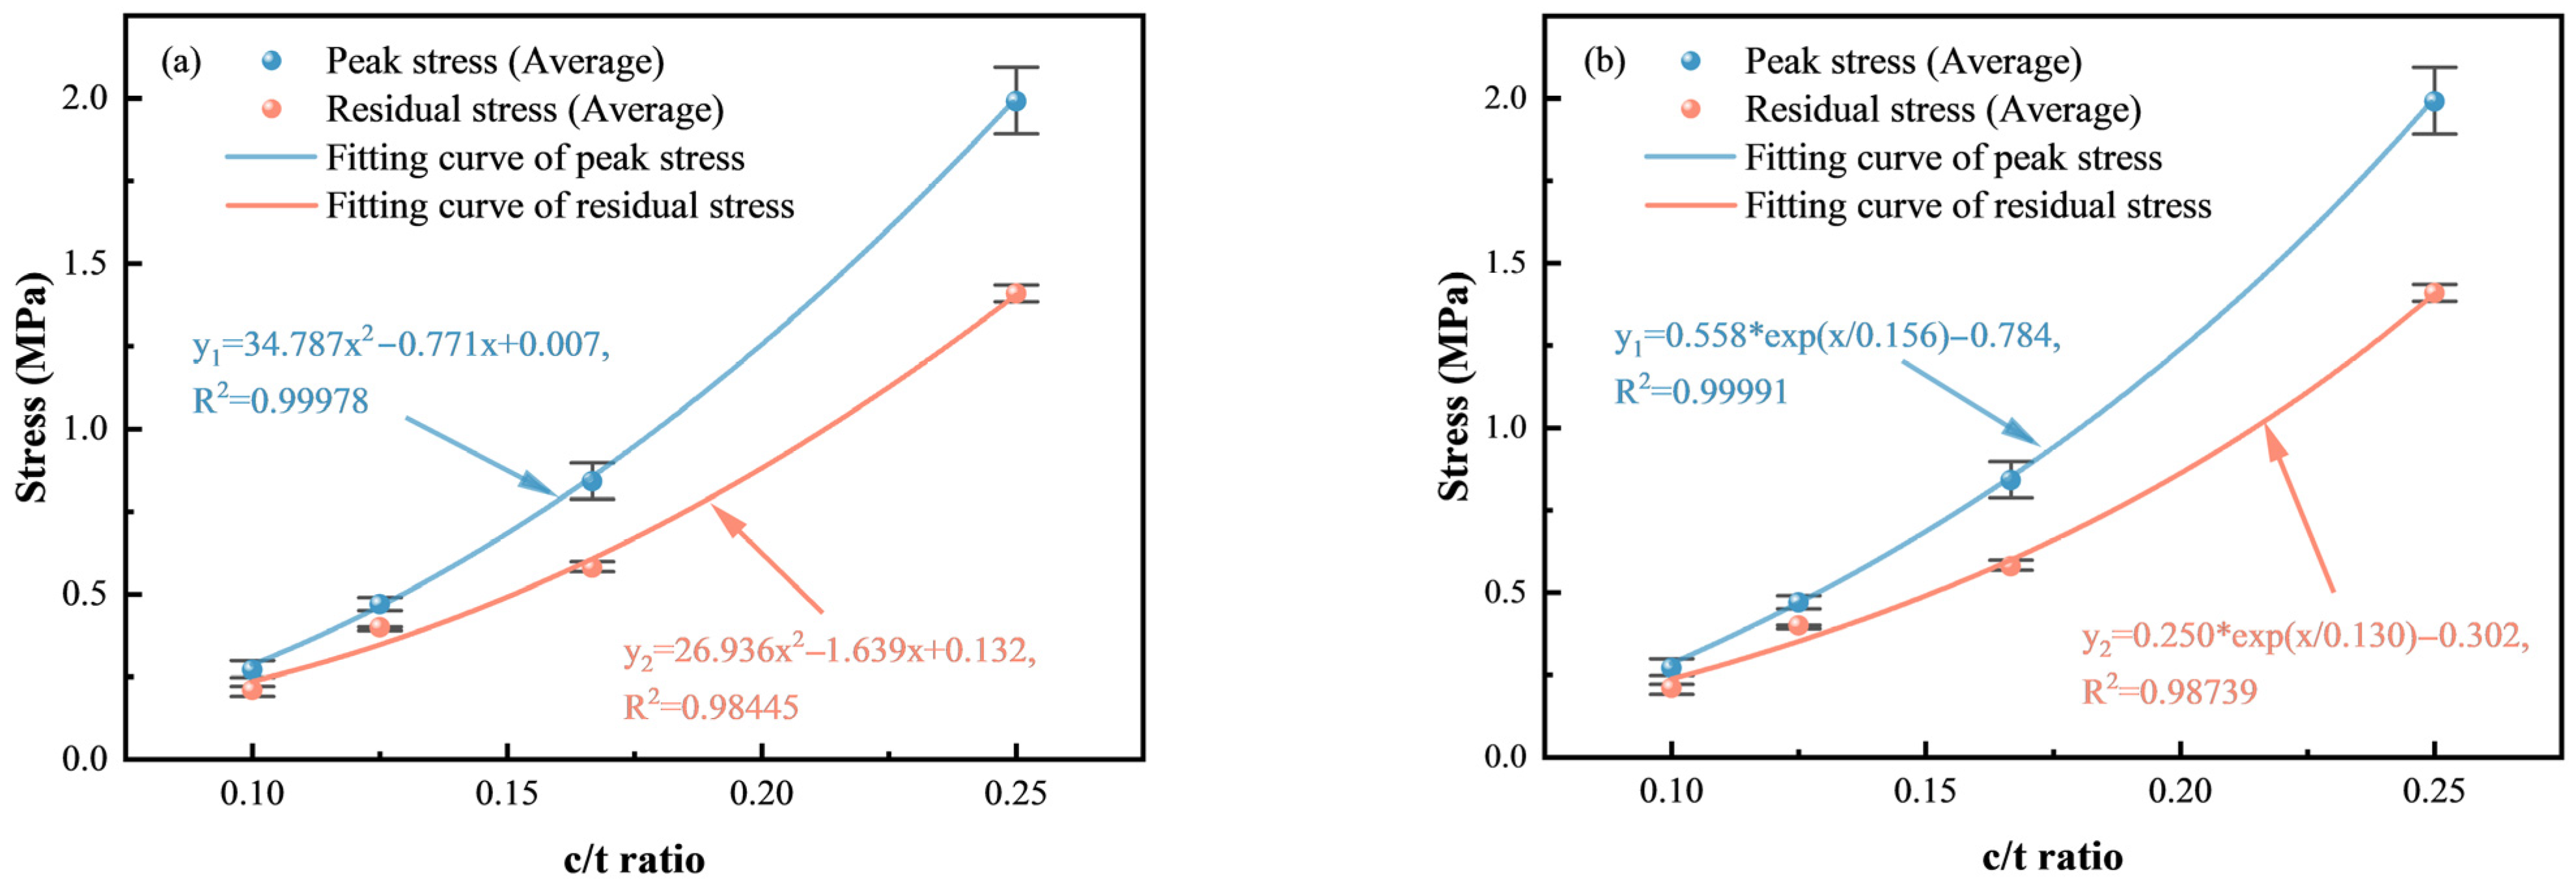
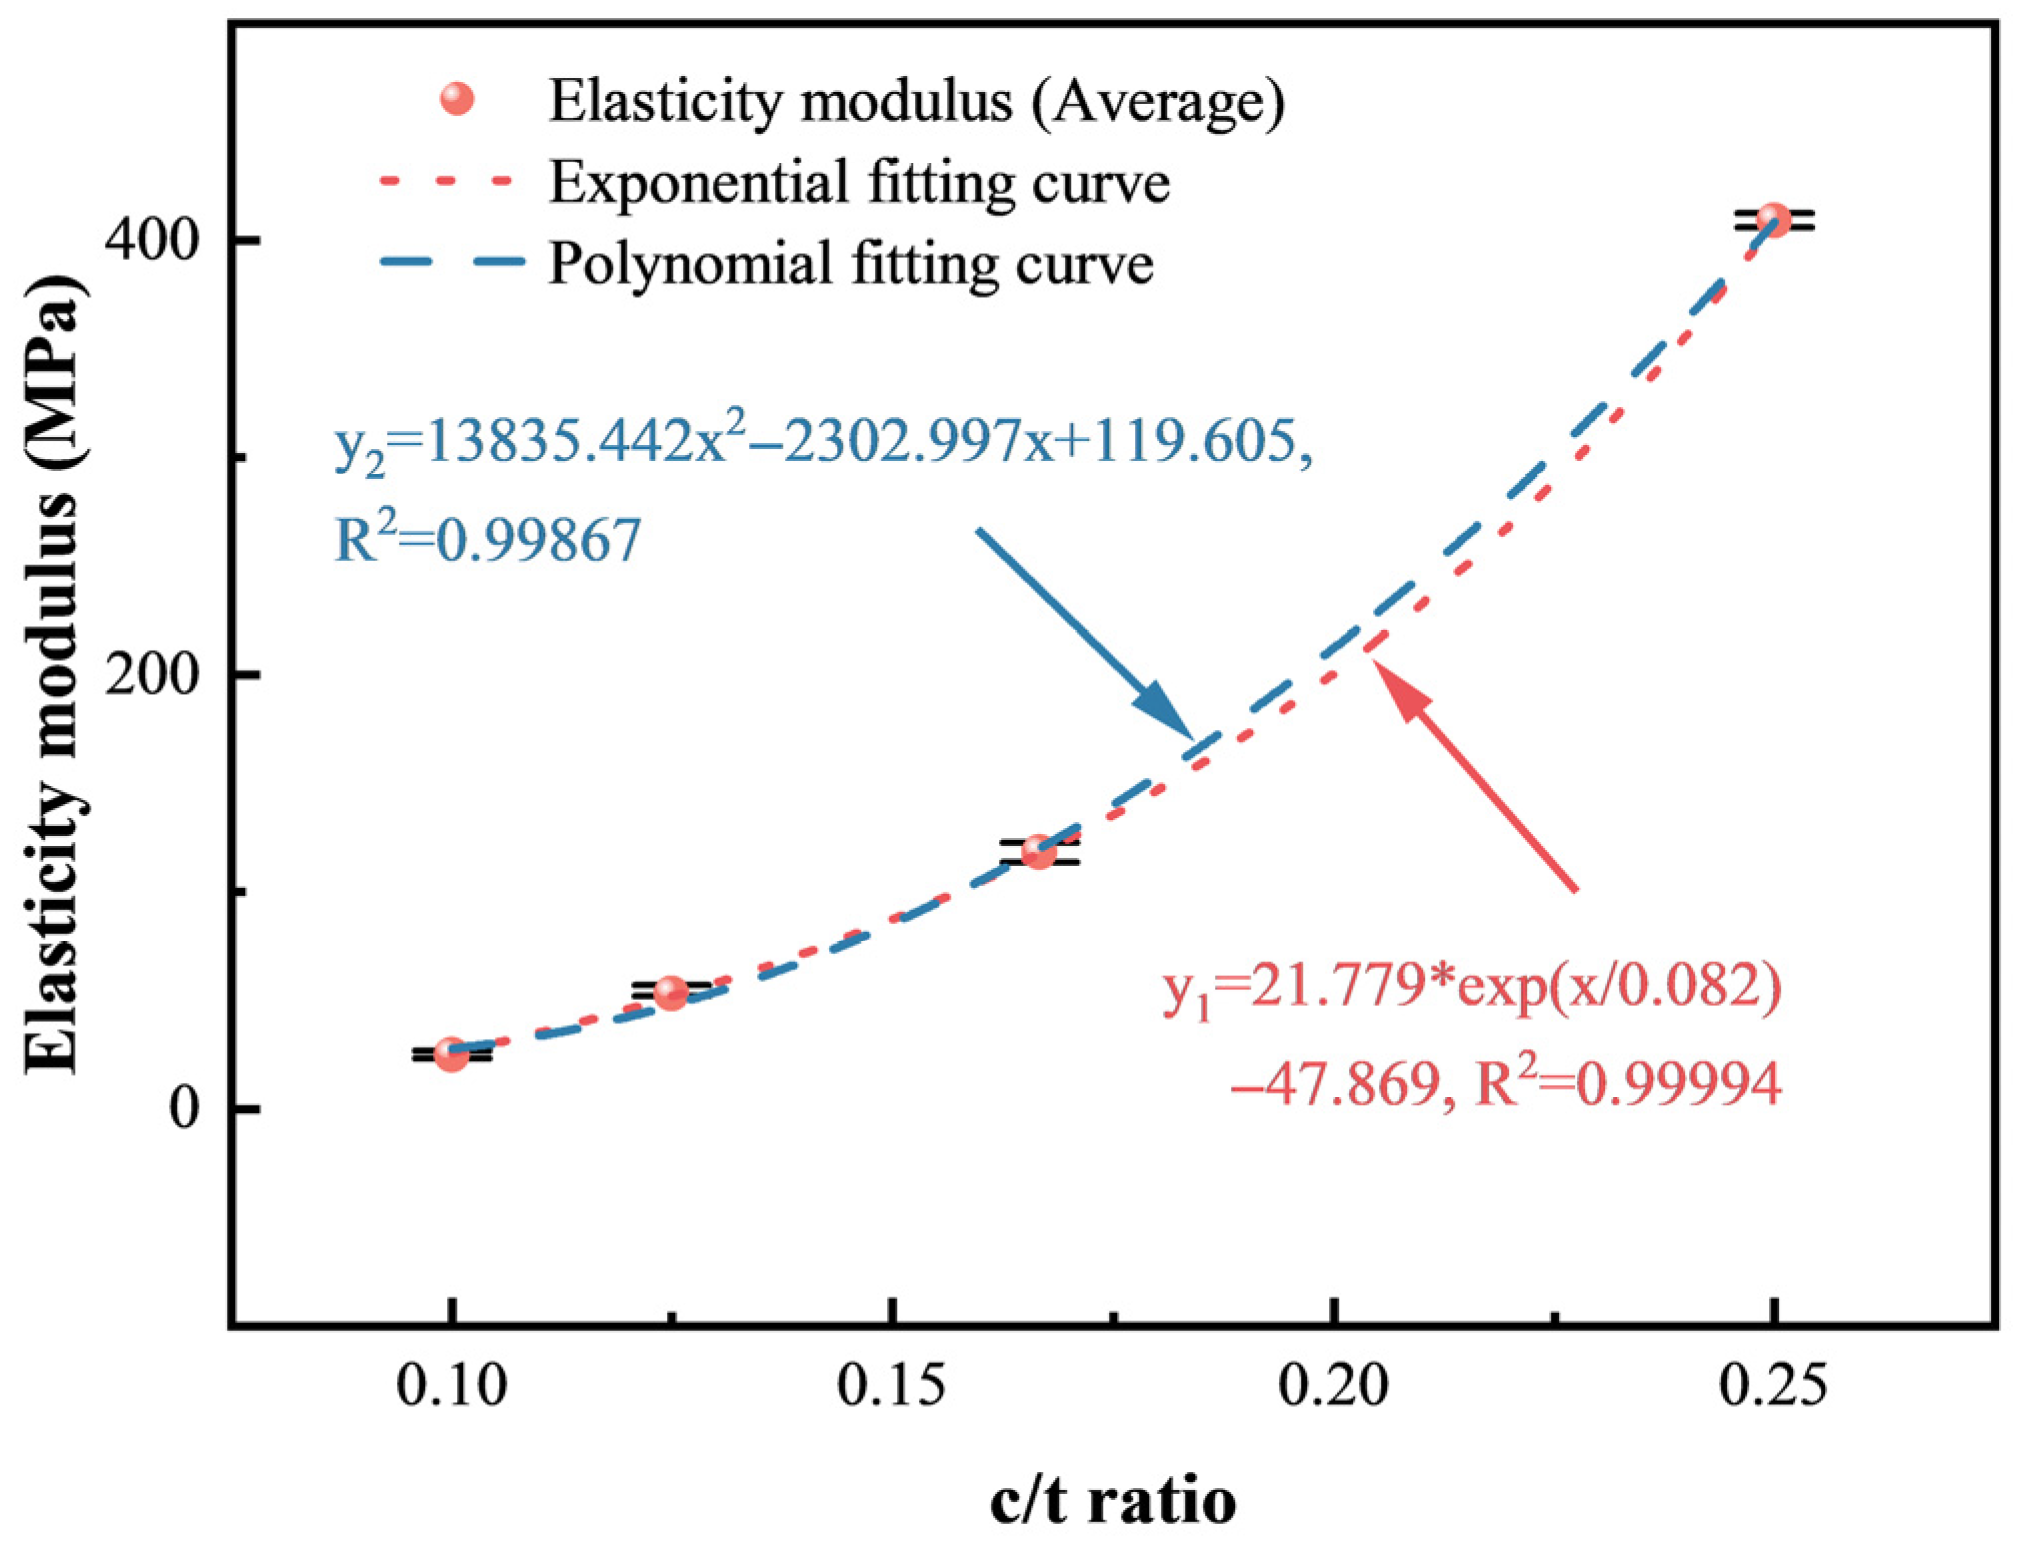
3.1.1. Analysis of Strength Characteristics
3.1.2. Analysis of Deformation Characteristics
3.2. Stress–Strain Curves
3.2.1. Experiment Results
3.2.2. Meso-Parameters Calibration and Simulation Results
3.3. Macroscopic Failure Modes and Distribution Characteristics of Microcracks
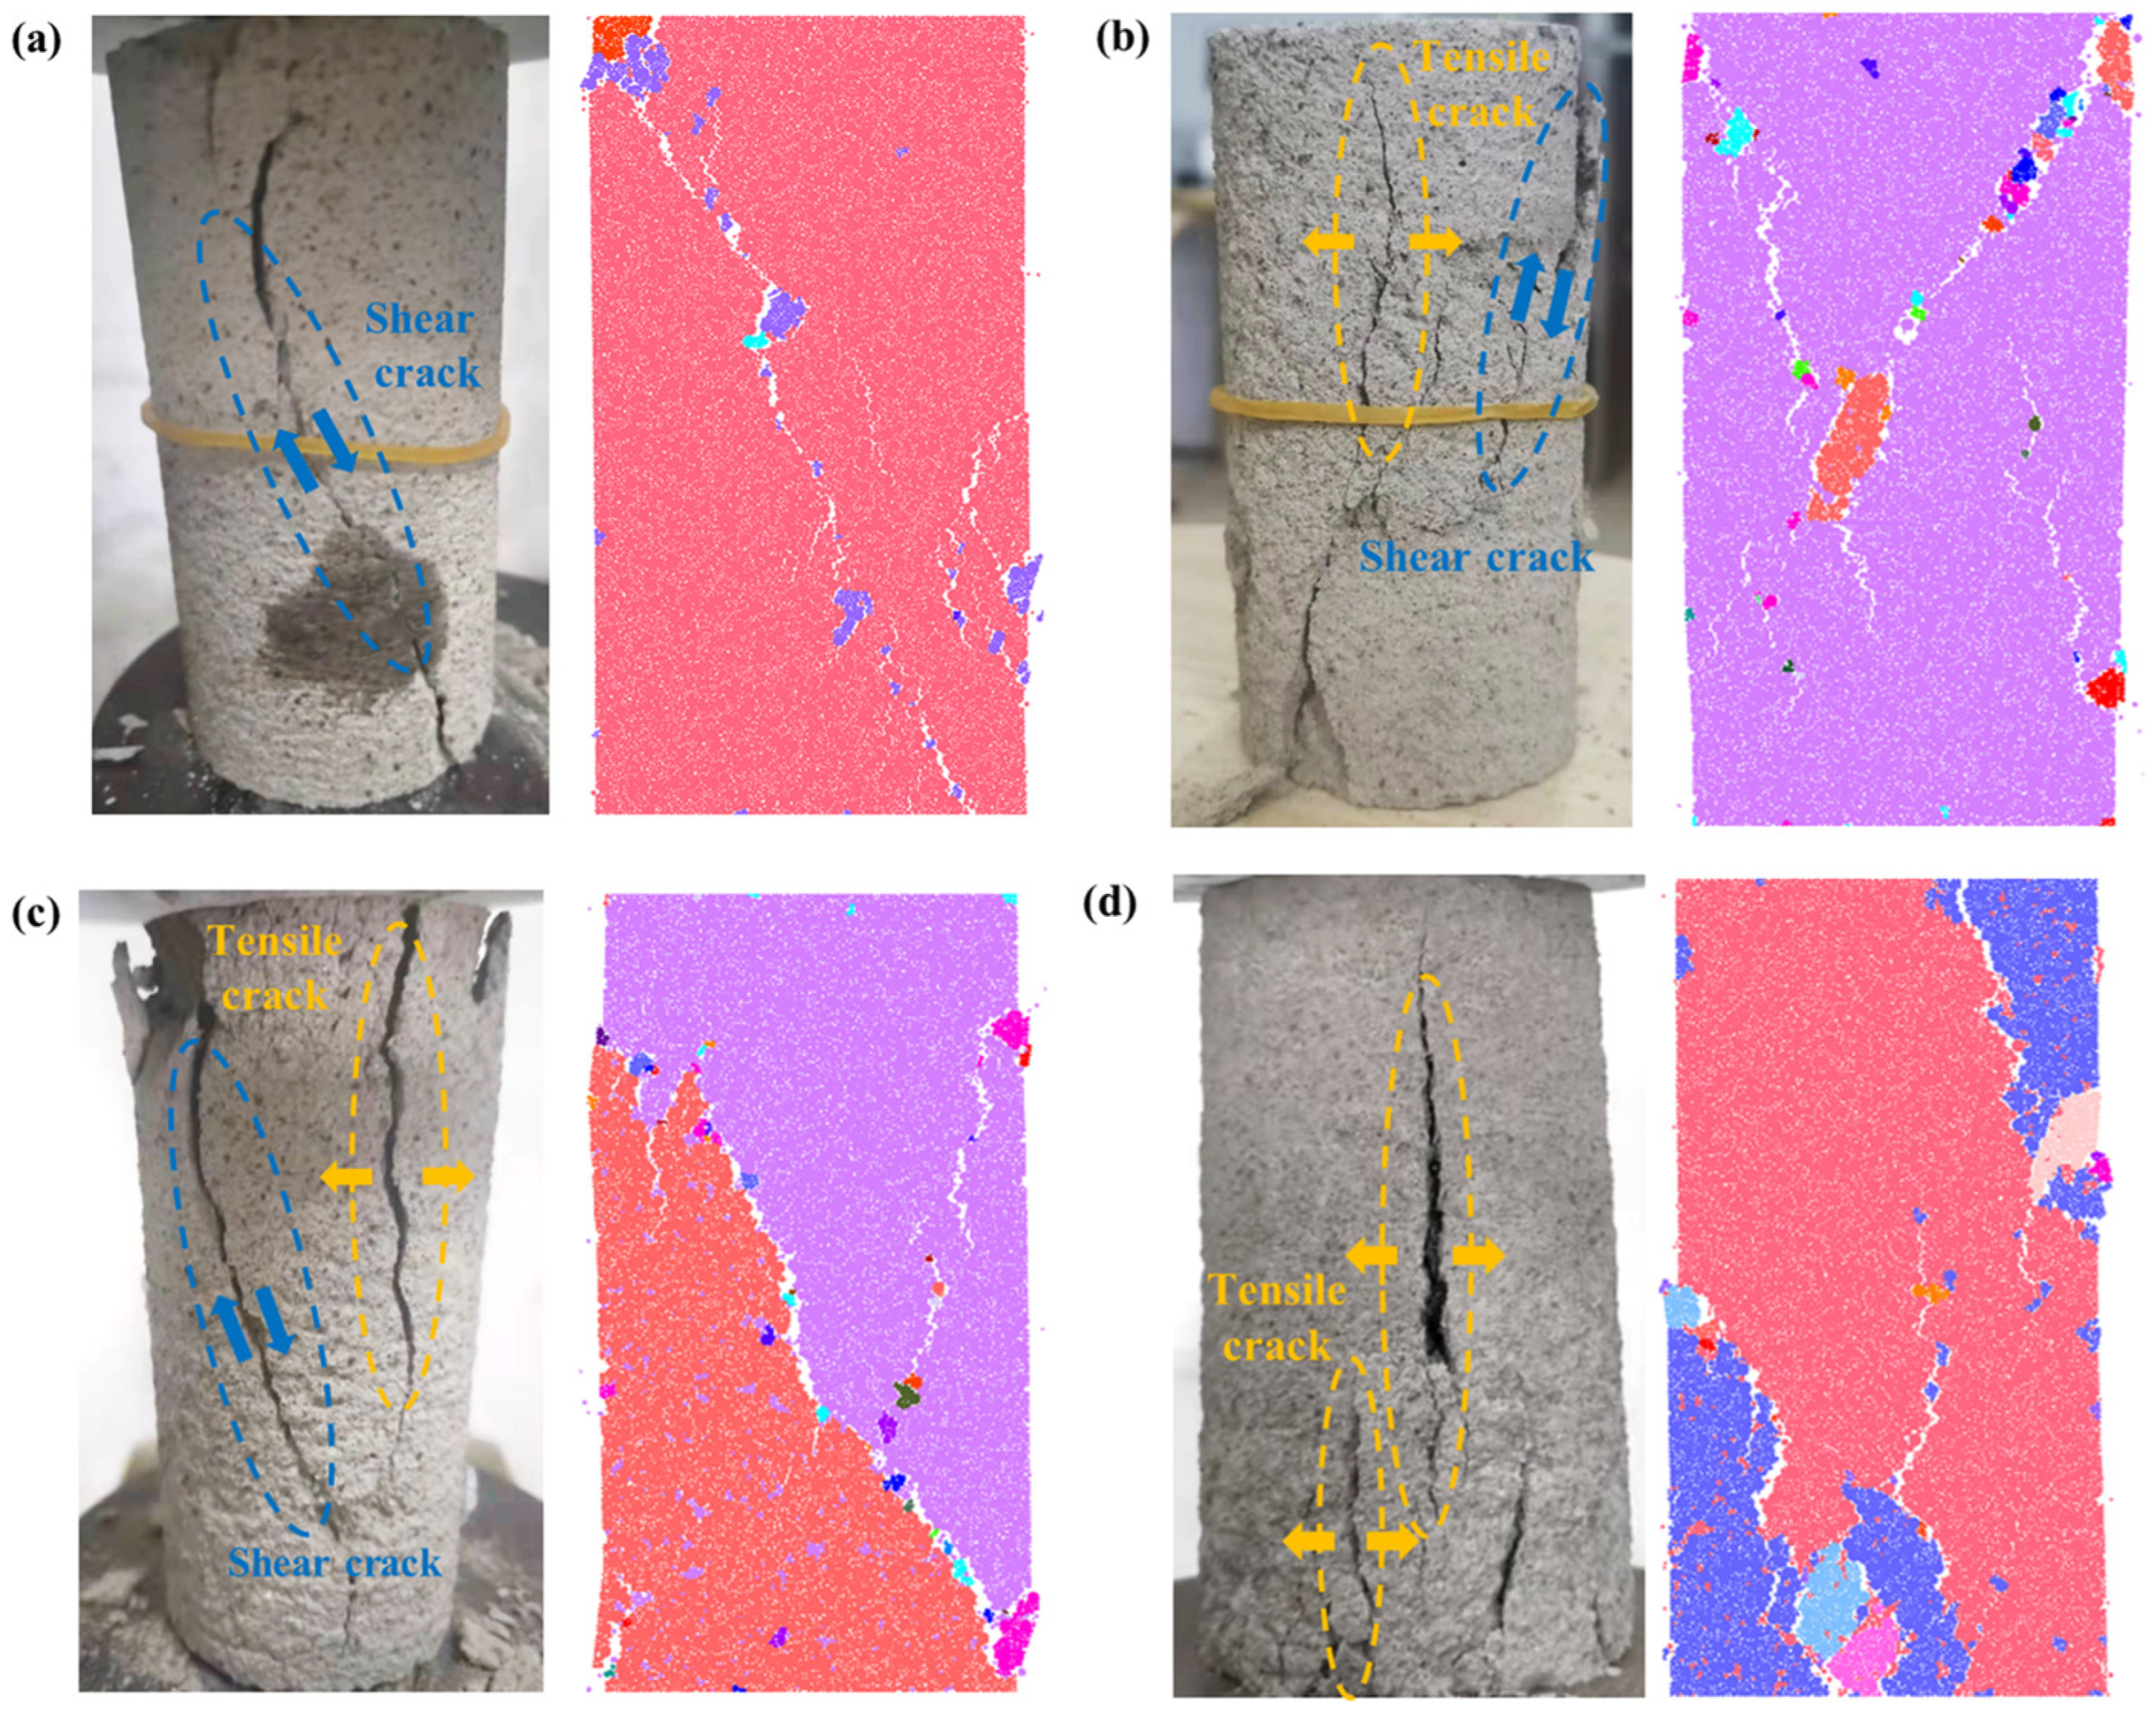
3.3.1. Macroscopic Failure Modes
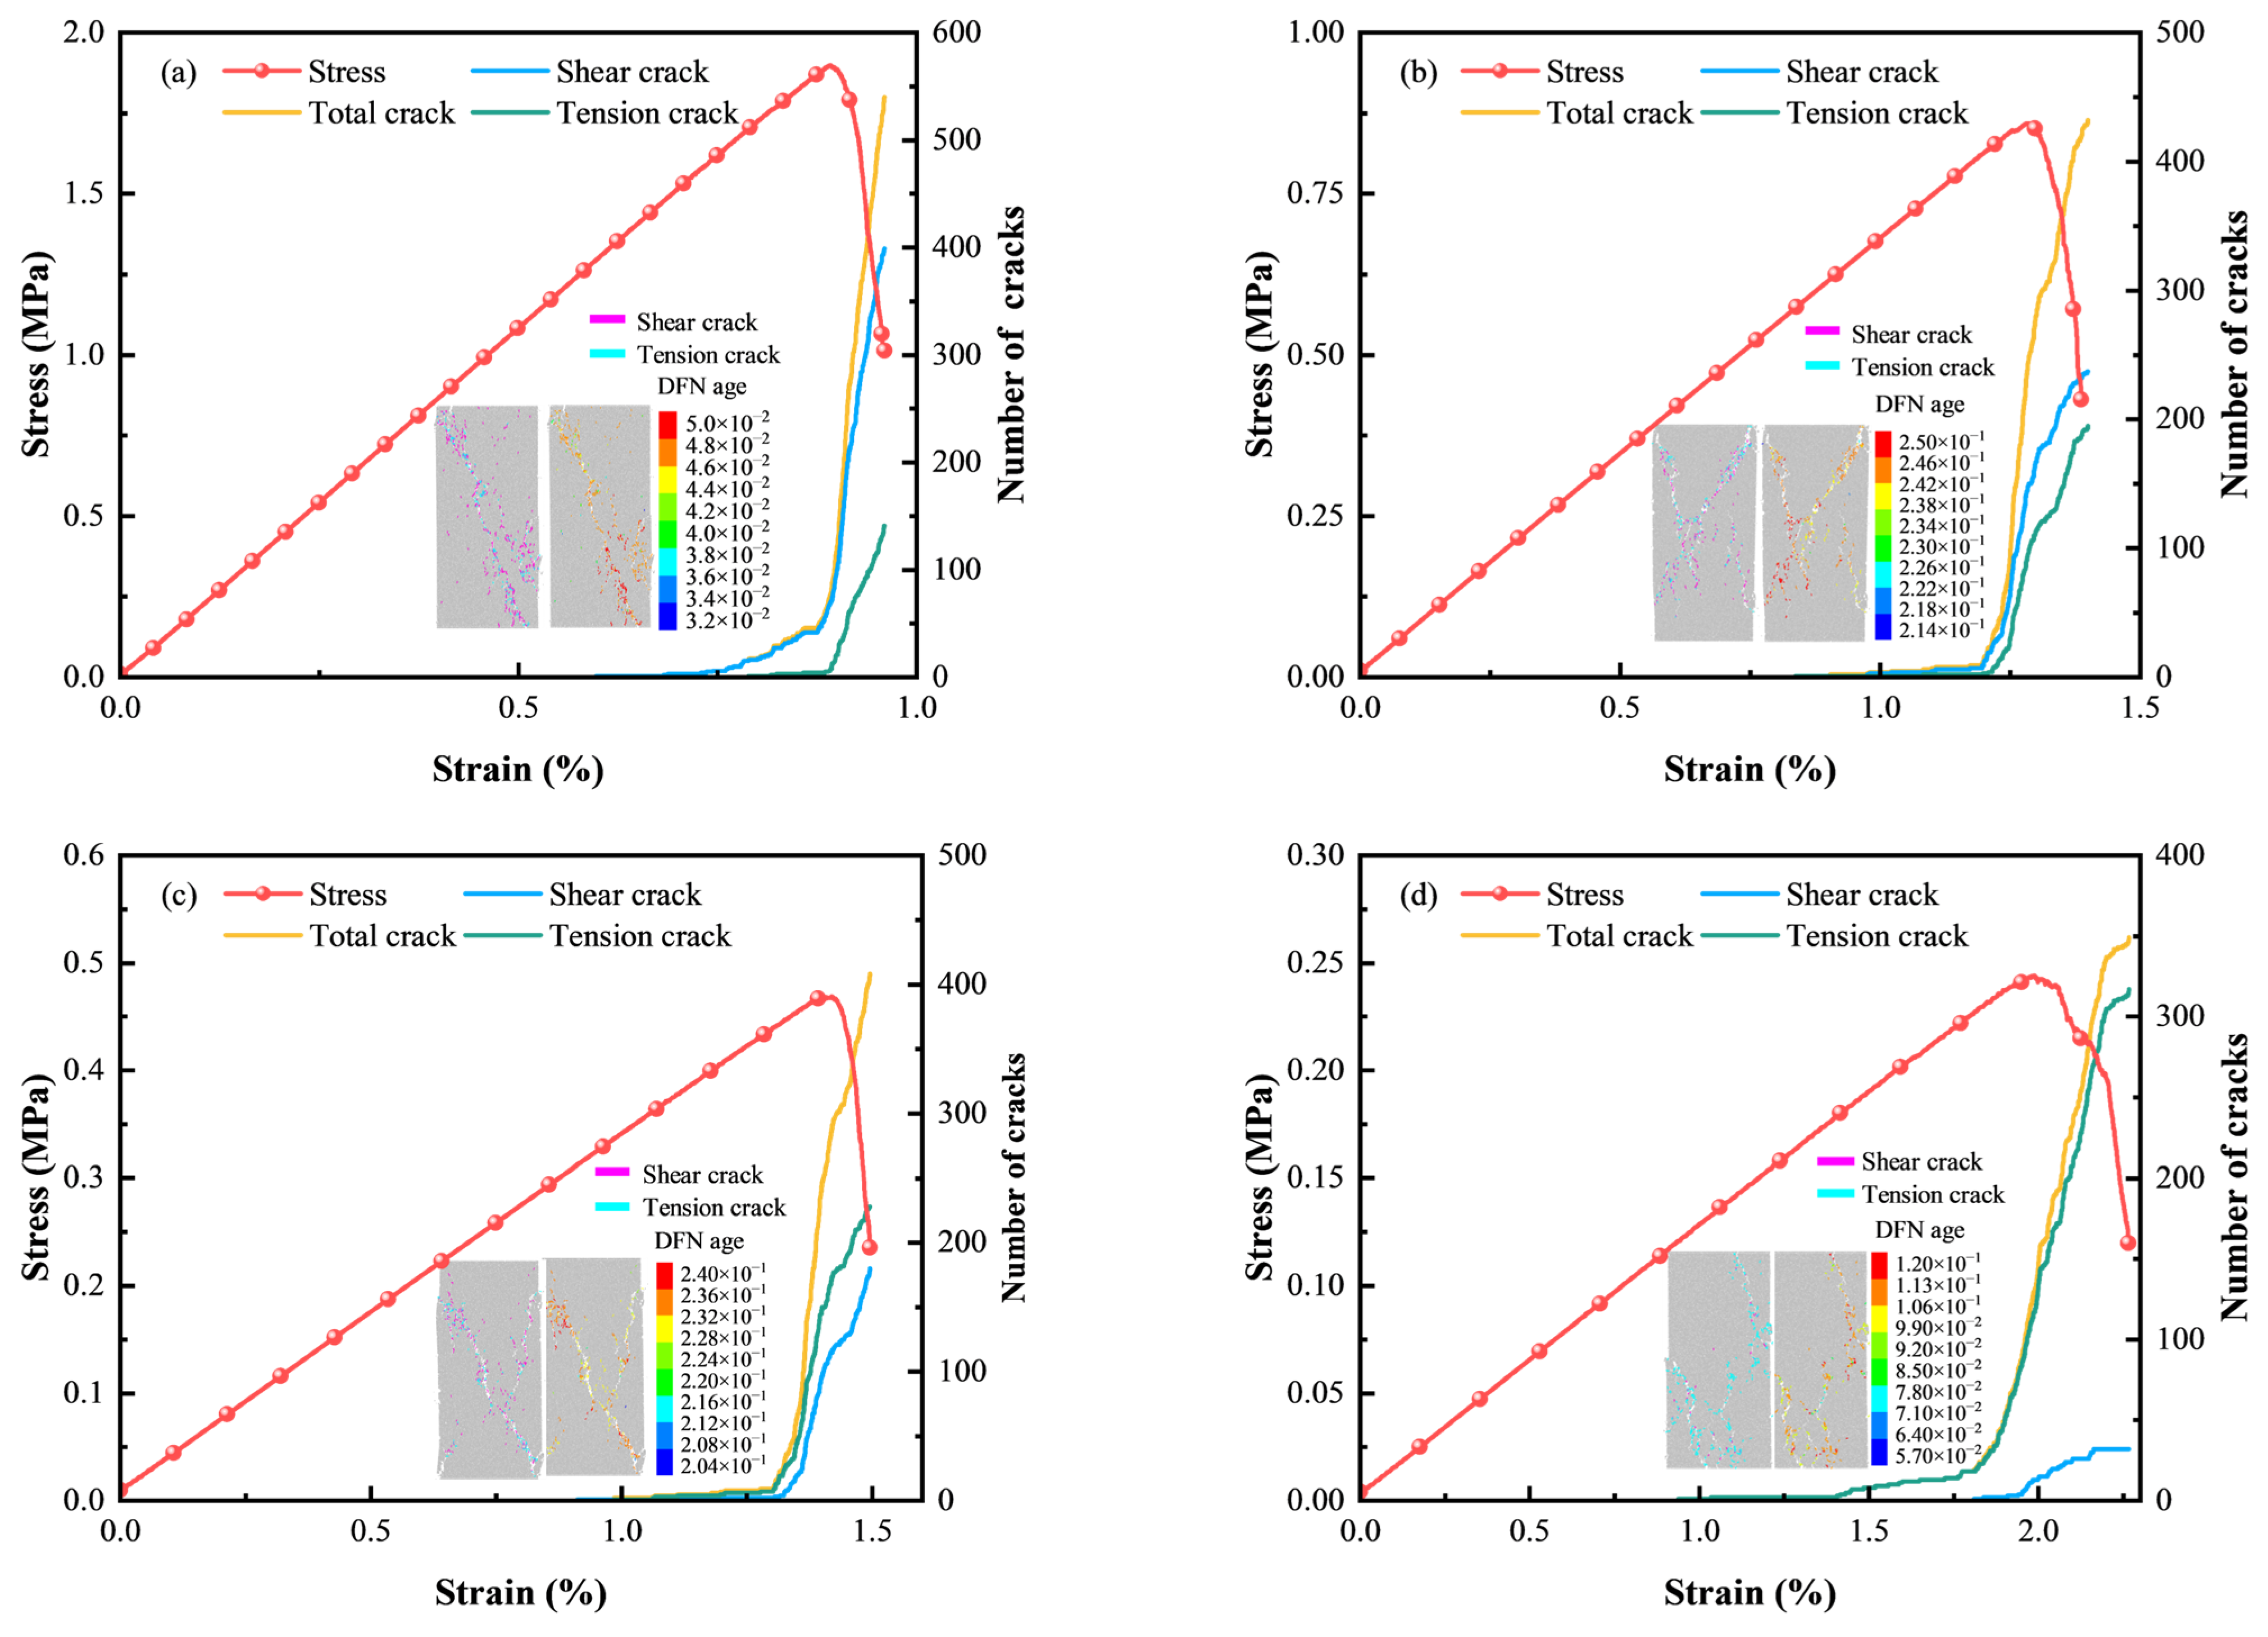
3.3.2. Distribution and Evolution Characteristics of Microcracks
3.4. Energy Evolution Patterns
3.5. Analysis of Axial Crack Evolution
4. Construction of the Damage Constitutive Model of CTB Samples
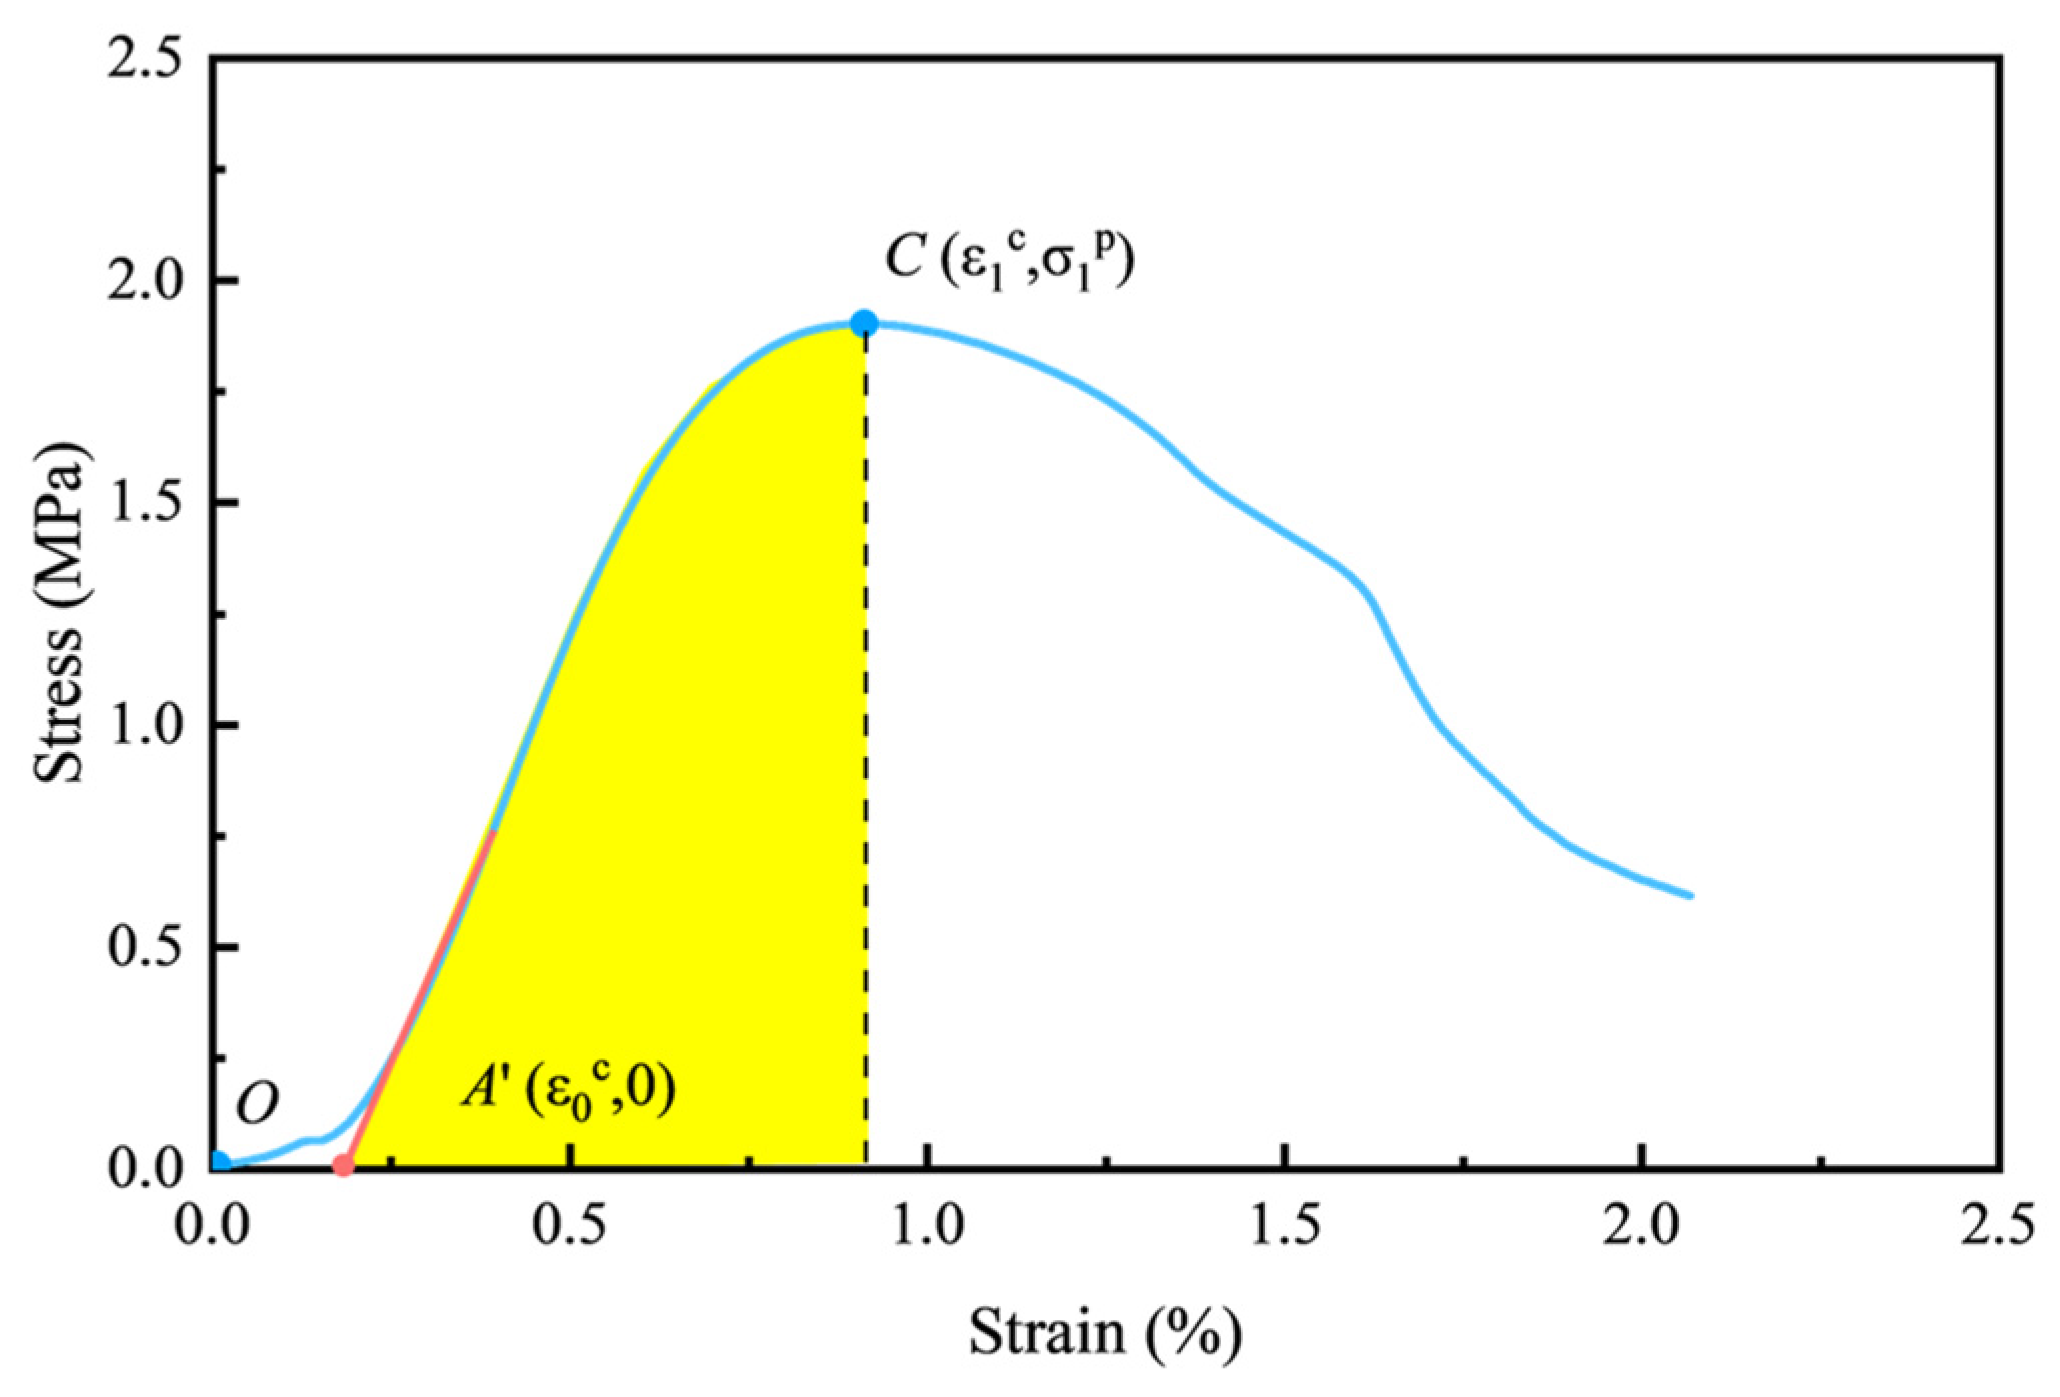
4.1. Construction of the Damage Constitutive Model Considering the Initial Compaction Stage
4.2. Determination of the Constitutive Model Parameters of CTB
- (1)
- Determination of a and b
- (2)
- Determination of m, n and
- (3)
- The parameterized constitutive model for CTB
4.3. Validation of the Proposed Damage Constitutive Model of CTB
- (1)
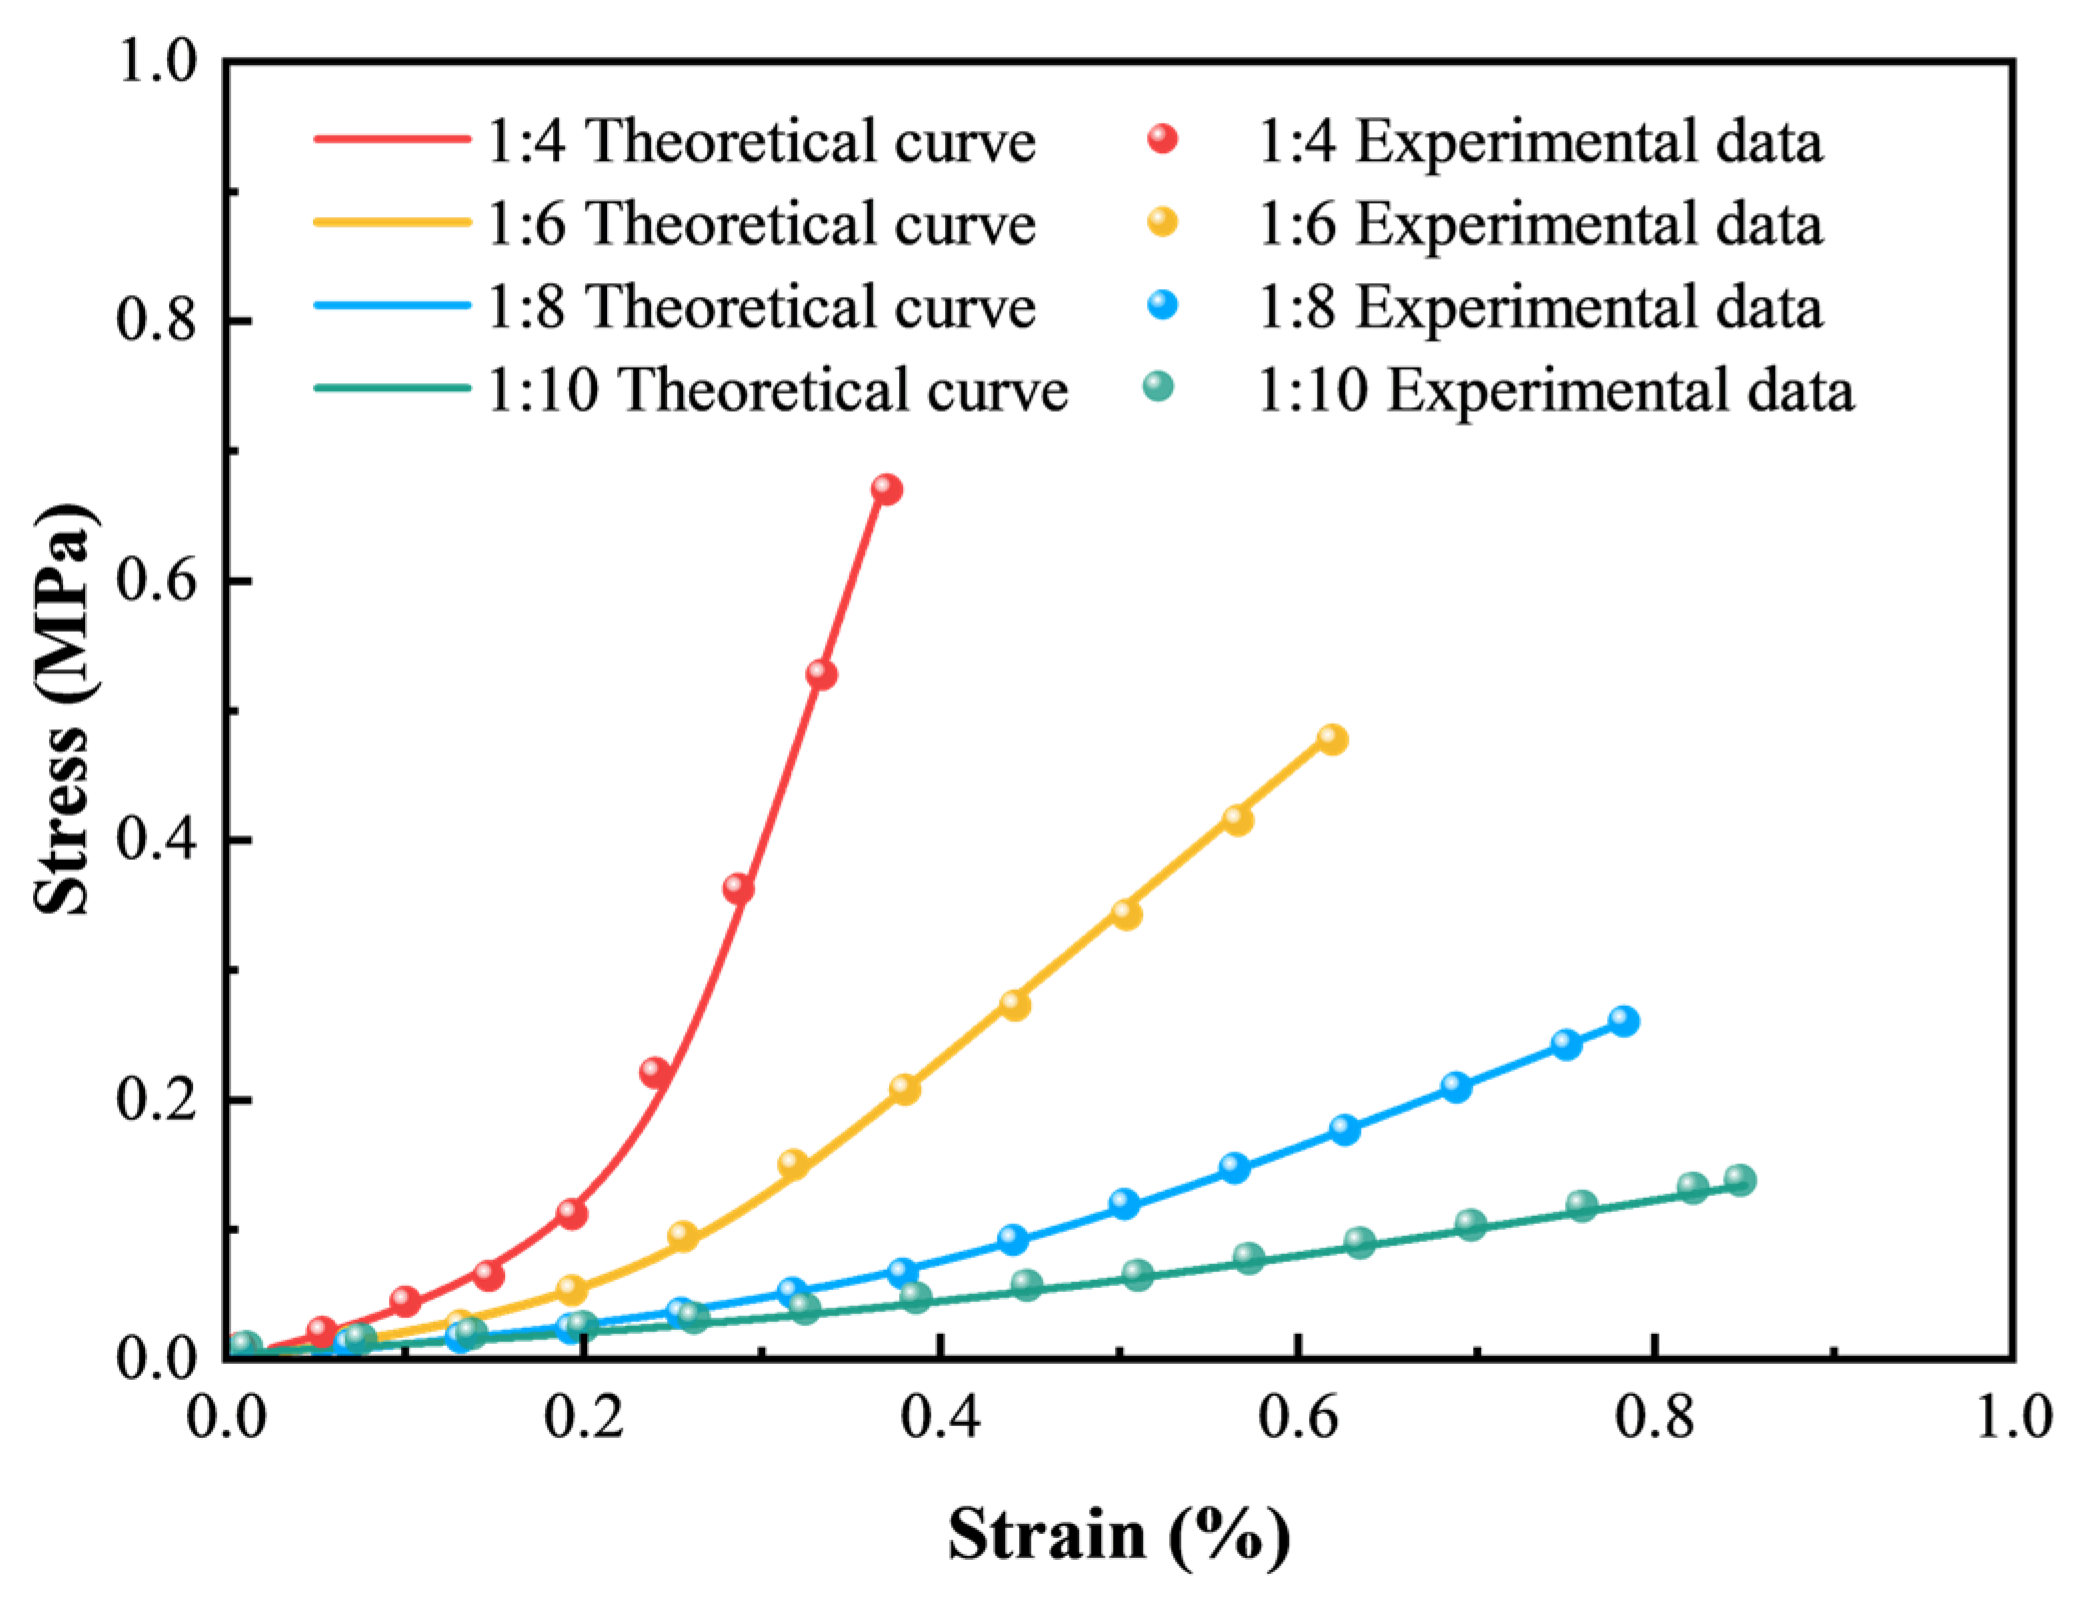
- Validation of the damage constitutive model in the initial compaction stage
- (2)
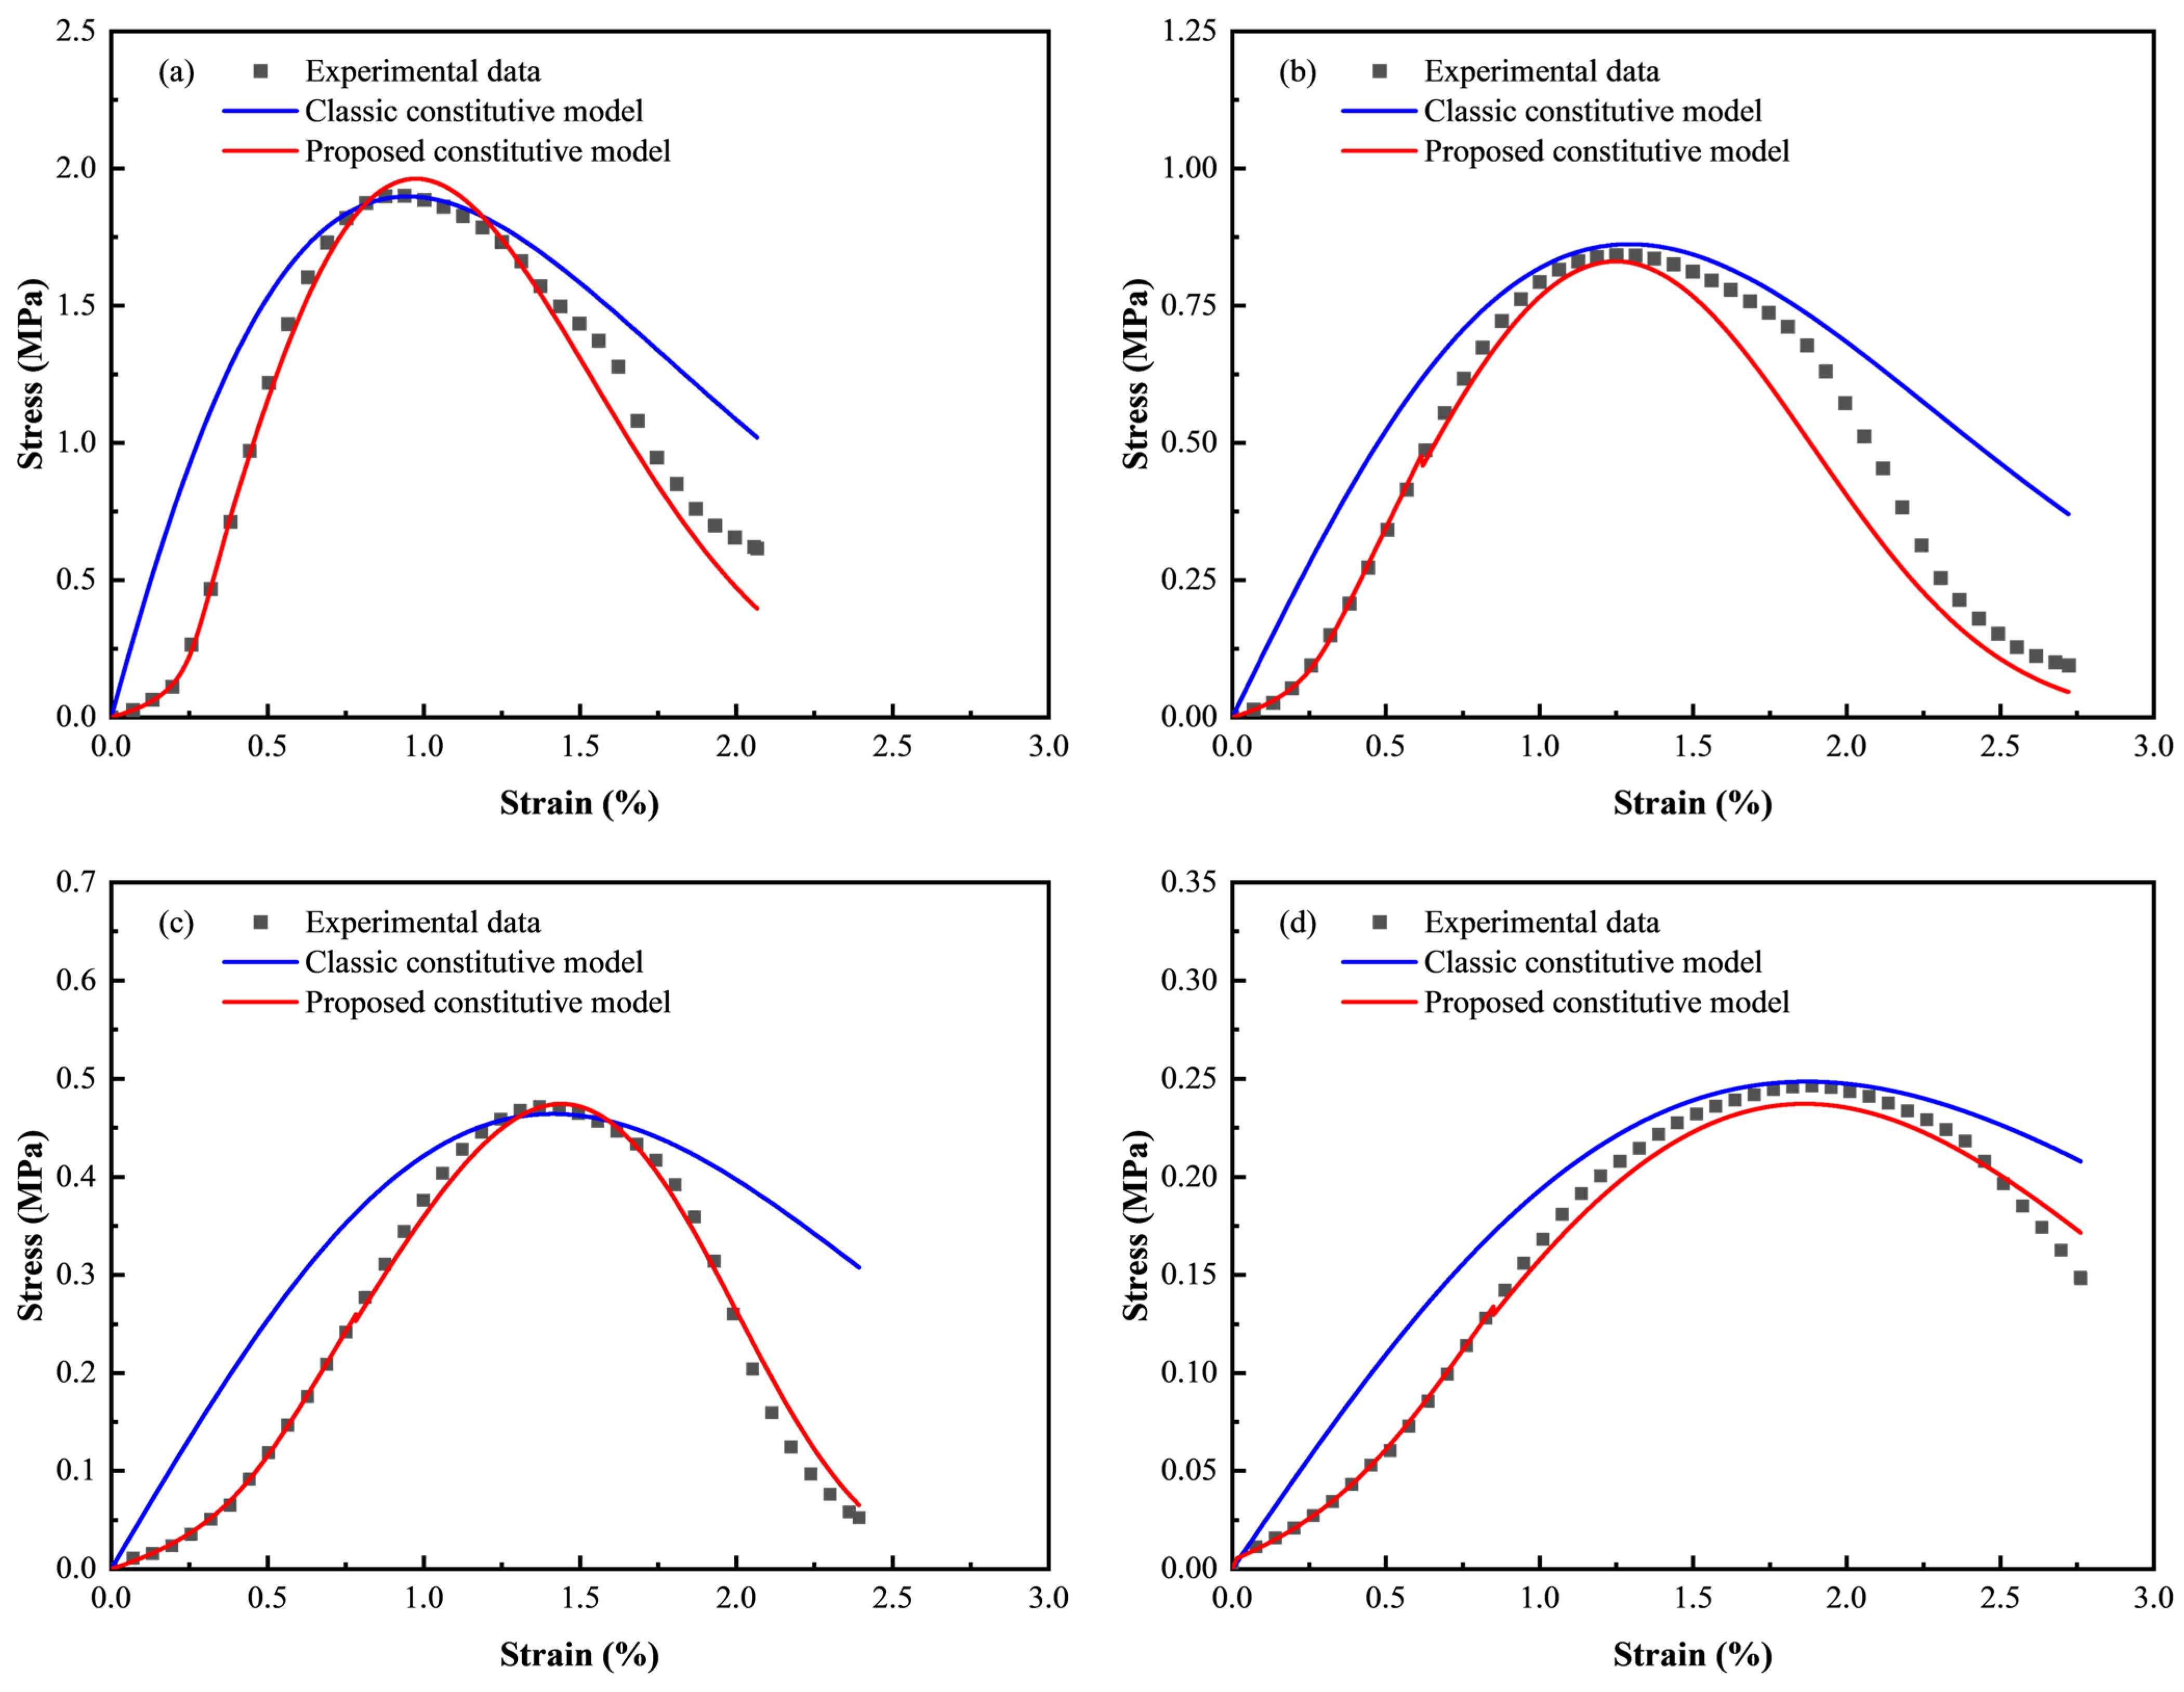
- Validation of the complete damage constitutive model
4.4. Energy Matching of CTB with Surrounding Rocks
4.4.1. Energy Dispassion Characteristics of Surrounding Rock Excavation
4.4.2. Deformation Energy Absorbed by CTB
4.4.3. Engineering Background
5. Conclusions
- (1)
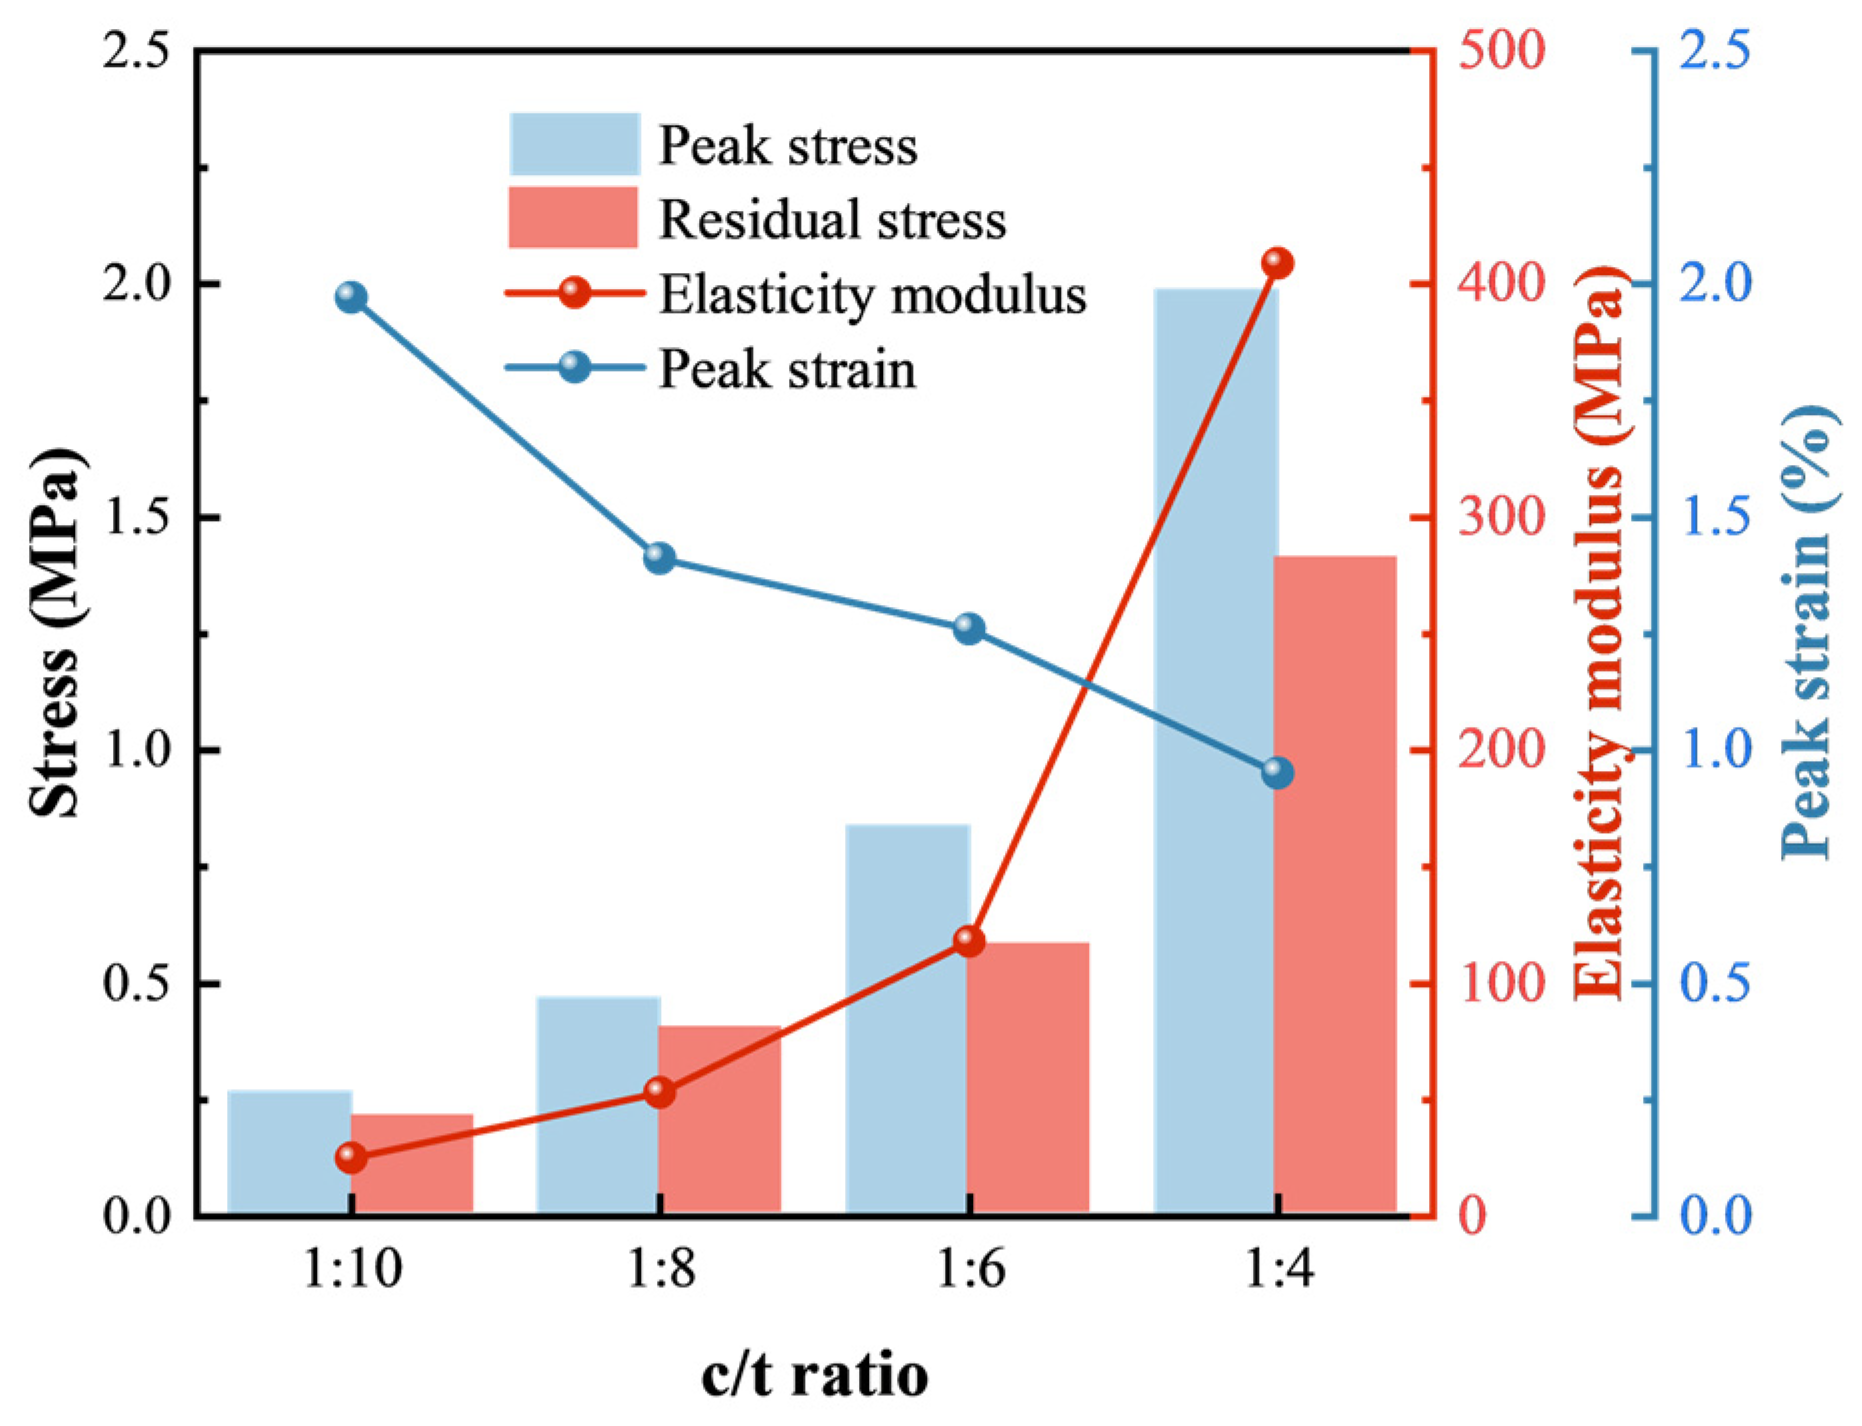
- The effects of c/t ratio on the mechanical properties of CTB follow exponential functions, exhibiting higher R2 values compared to polynomial functions. The peak stress, the residual stress, and the elasticity modulus of CTB decrease, while the peak strain increases with the decreasing c/t ratio.
- (2)
- Macroscopically, CTB with different c/t ratios presents diverse failure modes. As the c/t ratio increases, the failure mode transforms from line-shaped tensile failure to combined tension–shear failure and diagonal shear failure. Microscopically, the total microcrack number and shear microcrack number increase consequently, whereas the tension microcrack number decreases with increasing c/t ratios.
- (3)
- The energy evolution of CTB with different c/t ratios follows similar trends, progressing through the stages of initial compaction, elastic, plastic, and failure. The elastic strain energy increases slowly at first, then dramatically, and finally decreases gradually with axial strain increasing, and the dissipated energy increases in a “gentle–rapid–steady–slow” pattern.
- (4)
- A precise damage constitutive model that considers the initial compaction stage and axial crack strain evolution was developed. The theoretical curves match well with experimental data, accurately reflecting the mechanical parameters and damage characteristics of CTB with varying c/t ratios.
- (5)
- The matching coefficient K, representing the ratio of the peak deformation energy absorbed by CTB to energy dispassion of surrounding rock excavation, was calculated to assess the reasonable matching in the 5# ore body of Chaihulanzi Gold Mine. Economically and safely, a 1:10 c/t ratio is optimal to mining depths under 300 m, while a 1:6 c/t ratio is adequate for all current mining levels.
Author Contributions
Funding
Institutional Review Board Statement
Informed Consent Statement
Data Availability Statement
Conflicts of Interest
Nomenclature
| CPB | Cemented paste backfill | PBM | Parallel bond contact model |
| c/t | Cement to tailings | SEM | Scanning electron microscope |
| CTB | Cemented tailings backfill | UCS | Uniaxial compressive strength |
| DFN | Discrete fracture network | XRF | X-ray fluorescence |
| PFC | Particle Flow Code | ||
| a, b [-] | Fitting parameters in Equation (15) | [-] | Axial strain at initial microcrack closure point |
| D [-] | Damage variable | [-] | Axial crack strain at initial microcrack closure point |
| E [Pa] | Elasticity modulus of CTB | [-] | Axial strain of CTB |
| [Pa] | Elasticity modulus of rock mass | [-] | Axial crack strain of CTB |
| H [m] | Burial depth of rock mass | [-] | Strain of CTB of the intact portion without microdefects |
| K [-] | Matching coefficient | [-] | Peak strain of CTB |
| m, n [-] | Distribution parameters of the Weibull distribution in Equation (10) | [-] | Axial strain of rock mass |
| [-] | Meso-element strength distribution function | [N/m3] | Unit weight of rock mass |
| [J] | Total energy | [Pa] | Axial stress of CTB |
| [J] | Elastic strain energy | [Pa] | Axial stress of rock mass |
| [J] | Dissipated energy | [Pa] | Residual stress of CTB |
| [J] | Peak strain energy of CTB | [Pa] | Peak strength of CTB |
| [J] | Peak strain energy of rock mass | [Pa] | Vertical geostress |
| x [-] | c/t ratio |
References
- Jones, H.; Boger, D.V. Sustainability and Waste Management in the Resource Industries. Ind. Eng. Chem. Res. 2012, 51, 10057–10065. [Google Scholar] [CrossRef]
- Ranjith, P.G.; Zhao, J.; Ju, M.H.; De Silva, R.V.S.; Rathnaweera, T.D.; Bandara, A.K.M.S. Opportunities and Challenges in Deep Mining: A Brief Review. Engineering 2017, 3, 546–551. [Google Scholar] [CrossRef]
- Saedi, A.; Jamshidi-Zanjani, A.; Darban, A.K. A Review of Additives Used in the Cemented Paste Tailings: Environmental Aspects and Application. J. Environ. Manag. 2021, 289, 112501. [Google Scholar] [CrossRef] [PubMed]
- Pan, Z.; Zhou, K.P.; Wang, Y.M.; Lin, Y.; Saleem, F. Comparative Analysis of Strength and Deformation Behavior of Cemented Tailings Backfill under Curing Temperature Effect. Materials 2022, 15, 3491. [Google Scholar] [CrossRef]
- Yin, S.H.; Shao, Y.J.; Wu, A.X.; Wang, H.J.; Liu, X.H.; Wang, Y. A Systematic Review of Paste Technology in Metal Mines for Cleaner Production in China. J. Clean. Prod. 2020, 247, 119590. [Google Scholar] [CrossRef]
- Fourie, A. Preventing Catastrophic Failures and Mitigating Environmental Impacts of Tailings Storage Facilities. Prog. Earth Planet. Sci. 2009, 1, 1067–1071. [Google Scholar] [CrossRef]
- Wang, G.J.; Sun, Q.; Qi, C.X.; Liu, L.; Tan, Y.; Su, L.J. Mechanical Properties and Microscopic Characterization of Cemented Paste Backfill with Electrolytic Manganese Residue Matrix Binder. J. Mater. Res. Technol. 2023, 23, 2075–2088. [Google Scholar] [CrossRef]
- Xiong, S.; Liu, Z.X.; Min, C.D.; Shi, Y.; Zhang, S.X.; Liu, W.J. Compressive Strength Prediction of Cemented Backfill Containing Phosphate Tailings Using Extreme Gradient Boosting Optimized by Whale Optimization Algorithm. Materials 2023, 16, 308. [Google Scholar] [CrossRef]
- Small, C.C.; Cho, S.; Hashisho, Z.; Ulrich, A.C. Emissions from Oil Sands Tailings Ponds: Review of Tailings Pond Parameters and Emission Estimates. J. Petrol. Sci. Eng. 2015, 127, 490–501. [Google Scholar] [CrossRef]
- Dong, H.Z.; Aziz, N.A.; Shafri, H.Z.M.; Bin Ahmad, K.A. Computational Fluid Dynamics Study on Cemented Paste Backfill Slurry: Review. Constr. Build. Mater. 2023, 369, 130558. [Google Scholar] [CrossRef]
- He, M.C.; Xie, H.P.; Peng, S.P.; Jiang, Y.D. Study on Rock Mechanics in Deep Mining Engineering. Chin. J. Rock Mech. Eng. 2005, 24, 2803–2813. [Google Scholar]
- Cai, M.F.; Li, P.; Tan, W.H.; Ren, F.H. Key Engineering Technologies to Achieve Green, Intelligent, and Sustainable Development of Deep Metal Mines in China. Engineering 2021, 7, 1513–1517. [Google Scholar] [CrossRef]
- Li, P.; Cai, M.F. Challenges and New Insights for Exploitation of Deep Underground Metal Mineral Resources. Trans. Nonferr. Metal. Soc. 2021, 31, 3478–3505. [Google Scholar] [CrossRef]
- Behera, S.K.; Mishra, D.P.; Singh, P.; Mishra, K.; Mandal, S.K.; Ghosh, C.N.; Kumar, R.; Mandal, P.K. Utilization of Mill Tailings, Fly Ash and Slag as Mine Paste Backfill Material: Review and Future Perspective. Constr. Build. Mater. 2021, 309, 125120. [Google Scholar] [CrossRef]
- Li, G.W.; Deng, G.Z.; Ma, J.G. Numerical Modelling of the Response of Cemented Paste Backfill under the Blasting of an Adjacent Ore Stope. Constr. Build. Mater. 2022, 343, 128051. [Google Scholar] [CrossRef]
- Qi, C.C.; Fourie, A.; Chen, Q.S. Neural Network and Particle Swarm Optimization for Predicting the Unconfined Compressive Strength of Cemented Paste Backfill. Constr. Build. Mater. 2018, 159, 473–478. [Google Scholar] [CrossRef]
- Fang, K.; Fall, M. Effects of Curing Temperature on Shear Behaviour of Cemented Paste Backfill-Rock Interface. Int. J. Rock. Mech. Min. 2018, 112, 184–192. [Google Scholar] [CrossRef]
- Fall, M.; Célestin, J.C.; Pokharel, M.; Touré, M. A Contribution to Understanding the Effects of Curing Temperature on the Mechanical Properties of Mine Cemented Tailings Backfill. Eng. Geol. 2010, 114, 397–413. [Google Scholar] [CrossRef]
- Yi, X.W.; Ma, G.W.; Fourie, A. Centrifuge Model Studies on the Stability of Fibre-Reinforced Cemented Paste Backfill Stopes. Geotext. Geomembr. 2018, 46, 396–401. [Google Scholar] [CrossRef]
- Qi, C.C.; Fourie, A. Cemented Paste Backfill for Mineral Tailings Management: Review and Future Perspectives. Miner. Eng. 2019, 144, 106025. [Google Scholar] [CrossRef]
- Xiang, J.C.; Qiu, J.P.; Yuan, L.; Wu, J.W.; Ma, Z.Y. Characterization and Role Analysis of Bacteria Types in Self-Healing Behaviour of Cemented Paste Backfill. J. Build. Eng. 2023, 75, 106964. [Google Scholar] [CrossRef]
- Zhu, C.; Yang, P.; Liu, L.; Pu, Y.Y.; Qi, C.C.; Chen, Q.S.; Chen, J. Effect of Ice Addition on the Properties and Microstructure of Cemented Paste Backfill at Early-Age. J. Build. Eng. 2023, 71, 106439. [Google Scholar] [CrossRef]
- Mangane, M.B.C.; Argane, R.; Trauchessec, R.; Lecomte, A.; Benzaazoua, M. Influence of Superplasticizers on Mechanical Properties and Workability of Cemented Paste Backfill. Miner. Eng. 2018, 116, 3–14. [Google Scholar] [CrossRef]
- Nasir, O.; Fall, M. Coupling Binder Hydration, Temperature and Compressive Strength Development of Underground Cemented Paste Backfill at Early Ages. Tunn. Undergr. Space Technol. 2010, 25, 9–20. [Google Scholar] [CrossRef]
- Ghirian, A.; Fall, M. Coupled Thermo-Hydro-Mechanical-Chemical Behaviour of Cemented Paste Backfill in Column Experiments. Part I: Physical, Hydraulic and Thermal Processes and Characteristics. Eng. Geol. 2013, 164, 195–207. [Google Scholar] [CrossRef]
- Ghirian, A.; Fall, M. Coupled Thermo-Hydro-Mechanical-Chemical Behaviour of Cemented Paste Backfill in Column Experiments. Eng. Geol. 2014, 170, 11–23. [Google Scholar] [CrossRef]
- Yin, S.H.; Shao, Y.J.; Wu, A.X.; Wang, Y.M.; Gao, Z.Y. Texture Features Analysis on Micro-Structure of Paste Backfill Based on Image Analysis Technology. J. Cent. South Univ. 2018, 25, 2360–2372. [Google Scholar] [CrossRef]
- Zhao, Y.; Zhao, G.Y.; Xu, L.; Zhou, J.; Huang, X.L. Mechanical Property Evolution Model of Cemented Tailings-Rock Backfill Considering Strengthening and Weakening Effects. Constr. Build. Mater. 2023, 377, 131081. [Google Scholar] [CrossRef]
- Yin, S.H.; Hou, Y.Q.; Chen, X.; Zhang, M.Z.; Du, H.H.; Gao, C. Mechanical Behavior, Failure Pattern and Damage Evolution of Fiber-Reinforced Cemented Sulfur Tailings Backfill under Uniaxial Loading. Constr. Build. Mater. 2022, 332, 127248. [Google Scholar] [CrossRef]
- Gan, D.Q.; Lu, Y.Z.; Sun, H.K.; Liu, Z.Y.; Zhang, Y.J. Mechanical Response and Damage Constitutive Model of Early-Age Cemented Paste Backfill after Cyclic Loading. J. Build. Eng. 2024, 86, 108822. [Google Scholar] [CrossRef]
- Carpinteri, A.; Accornero, F. Multiple Snap-Back Instabilities in Progressive Microcracking Coalescence. Eng. Fract. Mech. 2018, 187, 272–281. [Google Scholar] [CrossRef]
- Cui, W.; Liu, M.-M.; Song, H.-F.; Guan, W.; Yan, H.-M. Influence of Initial Defects on Deformation and Failure of Concrete under Uniaxial Compression. Eng. Fract. Mech. 2020, 234, 107106. [Google Scholar] [CrossRef]
- Zhao, K.; Liu, Z.C.; Zeng, P.; Gong, C.; Li, Y.D. Fracture Process Analysis and Acoustic Emission Response of Cemented Tailings Backfill with Different Sizes under Uniaxial Compression. Materials 2022, 15, 8038. [Google Scholar] [CrossRef] [PubMed]
- Zhao, K.; Zhou, Y.; Huang, Q.Z.; Yin, S.H.; Yan, Y.J.; Wu, J.; Shen, L.Y.; Zeng, X.K.; Liu, W.R. Early Properties and Modeling of Cemented Superfine Tailings Backfill Containing Sodium Dodecyl Sulfate: Microstructure, Mechanics, and Acoustics. Mech. Mater. 2023, 179, 104567. [Google Scholar] [CrossRef]
- Zhao, X.K.; Dong, Q.; Chen, X.Q.; Fan, Q.S.; Li, R.Q. Influence of Mesoscale Heterogeneous and Initial Defects on the Fracture of Cement-Treated Base Materials. Constr. Build. Mater. 2021, 272, 121669. [Google Scholar] [CrossRef]
- Liu, W.Z.; Chen, J.T.; Guo, Z.P.; Yang, H.Z.; Xie, W.W.; Zhang, Y.D. Mechanical Properties and Damage Evolution of Cemented Coal Gangue-Fly Ash Backfill under Uniaxial Compression: Effects of Different Curing Temperatures. Constr. Build. Mater. 2021, 305, 124820. [Google Scholar] [CrossRef]
- GB 175-2007; General Administration of Quality Supervision, Inspection and Quarantine of the People’s Republic of China. China National Standards: Beijing, China, 2007.
- Ma, S.Z.; Liu, K.W.; Guo, T.F.; Yang, J.C.; Li, X.D.; Yan, Z.X. Experimental and Numerical Investigation on the Mechanical Characteristics and Failure Mechanism of Cracked Coal & Rock-Like Combined Sample under Uniaxial Compression. Theor. Appl. Fract. Mech. 2022, 122, 103583. [Google Scholar] [CrossRef]
- Zhang, N.; Hedayat, A.; Figueroa, L.; Steirer, K.X.; Li, L.X.; Sosa, H.G.B. Physical, Mechanical, Cracking, and Damage Properties of Mine Tailings-Based Geopolymer: Experimental and Numerical Investigations. J. Build. Eng. 2023, 75, 107075. [Google Scholar] [CrossRef]
- Liu, Q.S.; Liu, D.F.; Tian, Y.C.; Liu, X.Y. Numerical Simulation of Stress-Strain Behaviour of Cemented Paste Backfill in Triaxial Compression. Eng. Geol. 2017, 231, 165–175. [Google Scholar] [CrossRef]
- Mohammadinia, A.; Oskooei, P.R.; Arulrajah, A. Discrete Element Modeling of Cemented Recycled Concrete Aggregates under Unconfined and Loading Conditions. Transp. Geotech. 2021, 26, 100450. [Google Scholar] [CrossRef]
- Wang, X.L.; Li, Z.F.; Guo, J.P.; Lu, C.W.; Jiang, H.Q.; Mei, J.W. Experimental and Numerical Investigations on Damage Mechanical Behaviors of Surrounding Rock-Backfill Composite under Uniaxial Compression. Constr. Build. Mater. 2024, 417, 135210. [Google Scholar] [CrossRef]
- Feng, K.; Montoya, B.M.; Evans, T.M. Discrete Element Method Simulations of Bio-Cemented Sands. Comput. Geotech. 2017, 85, 139–150. [Google Scholar] [CrossRef]
- Fu, J.X.; Wang, J.; Song, W.D. Damage Constitutive Model and Strength Criterion of Cemented Paste Backfill Based on Layered Effect Considerations. J. Mater. Res. Technol. 2020, 9, 6073–6084. [Google Scholar] [CrossRef]
- Jiao, H.; Zhang, W.; Yang, Y.; Chen, X.; Yang, L.; Shen, H.; Rong, Y.; Zhang, H. Static Mechanical Characteristics and Meso-Damage Evolution Characteristics of Layered Backfill under the Condition of Inclined Interface. Constr. Build. Mater. 2023, 366, 130113. [Google Scholar] [CrossRef]
- Wang, H.Q.; Liu, Z.X.; Guo, T.F. Study on Mechanical Properties and Fracture Behaviours of Rock-Mortar Specimens with an Interface Crack under Radial Compression. Constr. Build. Mater. 2023, 406, 133399. [Google Scholar] [CrossRef]
- Gao, T.; Wu, A.X.; Wang, S.Y.; Ruan, Z.; Chen, C.; Sun, W. Compression Behavior and Microscopic Damage Mechanism of Waste Rock-Tailings Matrix Composites: Experiments and Models. Constr. Build. Mater. 2024, 425, 136076. [Google Scholar] [CrossRef]
- Qu, H.S.; Liu, L.; Suo, Y.L.; Zhu, M.B.; Wang, R.F.; Yang, P.; Xie, G.; Luo, Y.Y.; Liu, D.S. Failure Behavior and Fracture Evolution Mechanism of Layered Backfill Considering Dip Angles. Constr. Build. Mater. 2024, 416, 135041. [Google Scholar] [CrossRef]
- Xie, H.P.; Ju, Y.; Li, L.Y. Criteria for Strength and Structual Failure of Rocks Based on Energy Dissipation and Energy Release. Chin. J. Rock Mech. Eng. 2005, 24, 3003–3010. [Google Scholar]
- Zhang, A.; Xie, H.; Zhang, R.; Gao, M.; Xie, J.; Jia, Z.; Ren, L.; Zhang, Z. Mechanical Properties and Energy Characteristics of Coal at Different Depths under Cyclic Triaxial Loading and Unloading. Int. J. Rock. Mech. Min. 2023, 161, 105271. [Google Scholar] [CrossRef]
- Cai, M.; Kaiser, P.K.; Tasaka, Y.; Maejima, T.; Morioka, H.; Minami, M. Generalized Crack Initiation and Crack Damage Stress Thresholds of Brittle Rock Masses near Underground Excavations. Int. J. Rock. Mech. Min. 2004, 41, 833–847. [Google Scholar] [CrossRef]
- Chen, Y.; Guo, W.B.; Zuo, J.P.; Heng, S.; Dou, R. Effect of Triaxial Loading and Unloading on Crack Propagation and Damage Behaviors of Sandstone: An Experimental Study. Rock Mech. Rock Eng. 2021, 54, 6077–6090. [Google Scholar] [CrossRef]
- Peng, J.; Rong, G.; Cai, M.; Zhou, C.B. A Model for Characterizing Crack Closure Effect of Rocks. Eng. Geol. 2015, 189, 48–57. [Google Scholar] [CrossRef]
- Martin, C.D.; Chandler, N.A. The Progressive Fracture of Lac Du Bonnet Granite. Int. J. Rock. Mech. Min. Geomech. Abstr. 1994, 31, 643–659. [Google Scholar] [CrossRef]
- Lemaitre, J. How to Use Damage Mechanics. Nucl. Eng. Des. 1984, 80, 233–245. [Google Scholar] [CrossRef]
- Lemaitre, J. A Continuous Damage Mechanics Model for Ductile Fracture. J. Eng. Mater. Technol. 1985, 107, 83–89. [Google Scholar] [CrossRef]
- Wang, J.; Fu, J.X.; Song, W.D.; Zhang, Y.F.; Wang, Y. Mechanical Behavior, Acoustic Emission Properties and Damage Evolution of Cemented Paste Backfill Considering Structural Feature. Constr. Build. Mater. 2020, 261, 16. [Google Scholar] [CrossRef]
- Liu, Z.X.; Lan, M.; Xiao, S.Y.; Guo, H.Q. Damage Failure of Cemented Backfill and Its Reasonable Match with Rock Mass. Trans. Nonferrous Met. Soc. 2015, 25, 954–959. [Google Scholar] [CrossRef]


| R2 | Peak Stress (MPa) | Residual Stress (MPa) | Elasticity Modulus (GPa) | Peak Strain (%) | Mean (%) |
|---|---|---|---|---|---|
| Polynomial function fitting | 0.99978 | 0.98445 | 0.99867 | 0.93009 | 0.97825 |
| Exponential function fitting | 0.99991 | 0.98739 | 0.99994 | 0.96233 | 0.98739 |
| Parameters | 1:4 | 1:6 | 1:8 | 1:10 | |
|---|---|---|---|---|---|
| Tailings particles | Effective modulus (MPa) | 600 | |||
| Normal-to-shear stiffness ratio | 1.5 | ||||
| Density (kg/m3) | 2670 | ||||
| Radius (m) | 1–1.5 × 10⁻⁴ | ||||
| Initial void ratio | 0.3 | ||||
| Cement particles | Effective modulus (MPa) | 220 | 84 | 50 | 20 |
| Normal-to-shear stiffness ratio | 1.5 | 1.5 | 1.4 | 1.4 | |
| Radius (m) | 1 × 10⁻⁴ | ||||
| Density (kg/m3) | 2500 | ||||
| Total number of particles | 22,575 | 20,586 | 19,392 | 18,596 | |
| Parallel bond contact | Bond effective modulus (MPa) | 328 | 100 | 30 | 20 |
| Bond normal-to-shear stiffness ratio | 1.5 | 1.5 | 1.4 | 1.4 | |
| Cohesion (MPa) | 4.26 | 2.45 | 1.71 | 1.02 | |
| Tensile strength (MPa) | 8.52 | 3.93 | 2.06 | 0.82 | |
| Friction angle (°) | 50 | 50 | 50 | 50 | |
| Friction coefficient | 0.5 | 0.47 | 0.43 | 0.40 | |
| c/t | a | b | Constitutive Model | R2 |
|---|---|---|---|---|
| 1:4 | 0.0021 | 0.0709 | 0.98929 | |
| 1:6 | 0.0020 | 0.0399 | 0.98225 | |
| 1:8 | 0.0030 | 0.0390 | 0.98277 | |
| 1:10 | 0.0027 | 0.0270 | 0.98883 |
| c/t | m | n | /% | Constitutive Model |
|---|---|---|---|---|
| 1:4 | 2.056 | 0.011 | 0.20 | |
| 1:6 | 2.756 | 0.015 | 0.21 | |
| 1:8 | 3.966 | 0.016 | 0.30 | |
| 1:10 | 2.266 | 0.023 | 0.27 |
Disclaimer/Publisher’s Note: The statements, opinions and data contained in all publications are solely those of the individual author(s) and contributor(s) and not of MDPI and/or the editor(s). MDPI and/or the editor(s) disclaim responsibility for any injury to people or property resulting from any ideas, methods, instructions or products referred to in the content. |
© 2025 by the authors. Licensee MDPI, Basel, Switzerland. This article is an open access article distributed under the terms and conditions of the Creative Commons Attribution (CC BY) license (https://creativecommons.org/licenses/by/4.0/).
Share and Cite
Yuan, C.; Wang, H.; Liu, Z.; Zhang, S.; Yan, M.; Liang, X.; Liu, Z.; Liu, W. An Experimental and Numerical Study on the Mechanical Properties and Damage Evolution of Cemented Tailings Backfill Under Uniaxial Compression. Materials 2025, 18, 856. https://doi.org/10.3390/ma18040856
Yuan C, Wang H, Liu Z, Zhang S, Yan M, Liang X, Liu Z, Liu W. An Experimental and Numerical Study on the Mechanical Properties and Damage Evolution of Cemented Tailings Backfill Under Uniaxial Compression. Materials. 2025; 18(4):856. https://doi.org/10.3390/ma18040856
Chicago/Turabian StyleYuan, Congxiang, Houqiang Wang, Zhixiang Liu, Shuangxia Zhang, Mengyang Yan, Xiaodie Liang, Zhiwei Liu, and Weijun Liu. 2025. "An Experimental and Numerical Study on the Mechanical Properties and Damage Evolution of Cemented Tailings Backfill Under Uniaxial Compression" Materials 18, no. 4: 856. https://doi.org/10.3390/ma18040856
APA StyleYuan, C., Wang, H., Liu, Z., Zhang, S., Yan, M., Liang, X., Liu, Z., & Liu, W. (2025). An Experimental and Numerical Study on the Mechanical Properties and Damage Evolution of Cemented Tailings Backfill Under Uniaxial Compression. Materials, 18(4), 856. https://doi.org/10.3390/ma18040856