Abstract
The detection of composite miRNA functional module (CMFM) is of tremendous significance and helps in understanding the organization, regulation and execution of cell processes in cancer, but how to identify functional CMFMs is still a computational challenge. In this paper we propose a novel module detection method called MBCFM (detecting Composite Function Modules based on Maximal Biclique enumeration), specifically designed to bicluster miRNAs and target messenger RNAs (mRNAs) on the basis of multiple biological interaction information and topical network features. In this method, we employ algorithm MICA to enumerate all maximal bicliques and further extract R-pairs from the miRNA-mRNA regulatory network. Compared with two existing methods, Mirsynergy and SNMNMF on ovarian cancer dataset, the proposed method of MBCFM is not only able to extract cohesiveness-preserved CMFMs but also has high efficiency in running time. More importantly, MBCFM can be applied to detect other cancer-associated miRNA functional modules.
1. Introduction
MicroRNAs (miRNAs) play crucial regulatory roles that cause mRNA degradation or translational repression [1], which are involved in the initiation and progression of cancer [2,3]. Composite miRNA functional module (CMFM) comprises miRNAs and mRNAs in a module that is believed to participate cooperatively in specific biological processes [4,5]. To date, several functional modules have been computationally extracted from the regulation networks [6,7]. However, most of these studies mainly performed on a single network, and few considered the cooperation between different types of networks such as the transcriptional regulation networks, protein-protein interaction networks and metabolic networks.
In recent years, scholars have put forward many related computer methods to identify CMFM on the basis of multiple-types network [8,9]. For example, SNMNMF (Sparse Network-regularized Multiple Non-negative Matrix Factorization) proposed by Zhang et al. [10] described a factorized matrix framework to identify composite miRNA functional modules by integrating miRNA and gene expression profiles, the protein-protein interactions (PPIs) and transcription factor binding sites. Another method called Mirsynergy, which was proposed by Li et al. [11], detected miRNA regulatory modules based on synergistic scores between two miRNAs. The method also took m/miRNA expression profiles, target site information and PPIs into consideration during the process of module identification. However, these two methods either require to presuppose the number of modules or generate many small-scale modules.
In this work, we propose a novel model called MBCFM that integrates mRNA/miRNA expression profiles, mRNA interaction information as well as network topology characteristics. We apply MBCFM to ovarian (OV) cancer dataset. Comparing with two existing prominent methods, Mirsynergy and SNMNMF, we find that CMFM plays an important role in cooperation between regulation and implementation of protein function and our model is more computationally efficient. Moreover, the miRNAs and mRNAs involving CMFMs detected by MBCFM are strongly implicated in cancer.
2. Notations and Definitions
In order to easily describe model algorithm, we give some definitions as follows:
Definition 1.
R-pair.
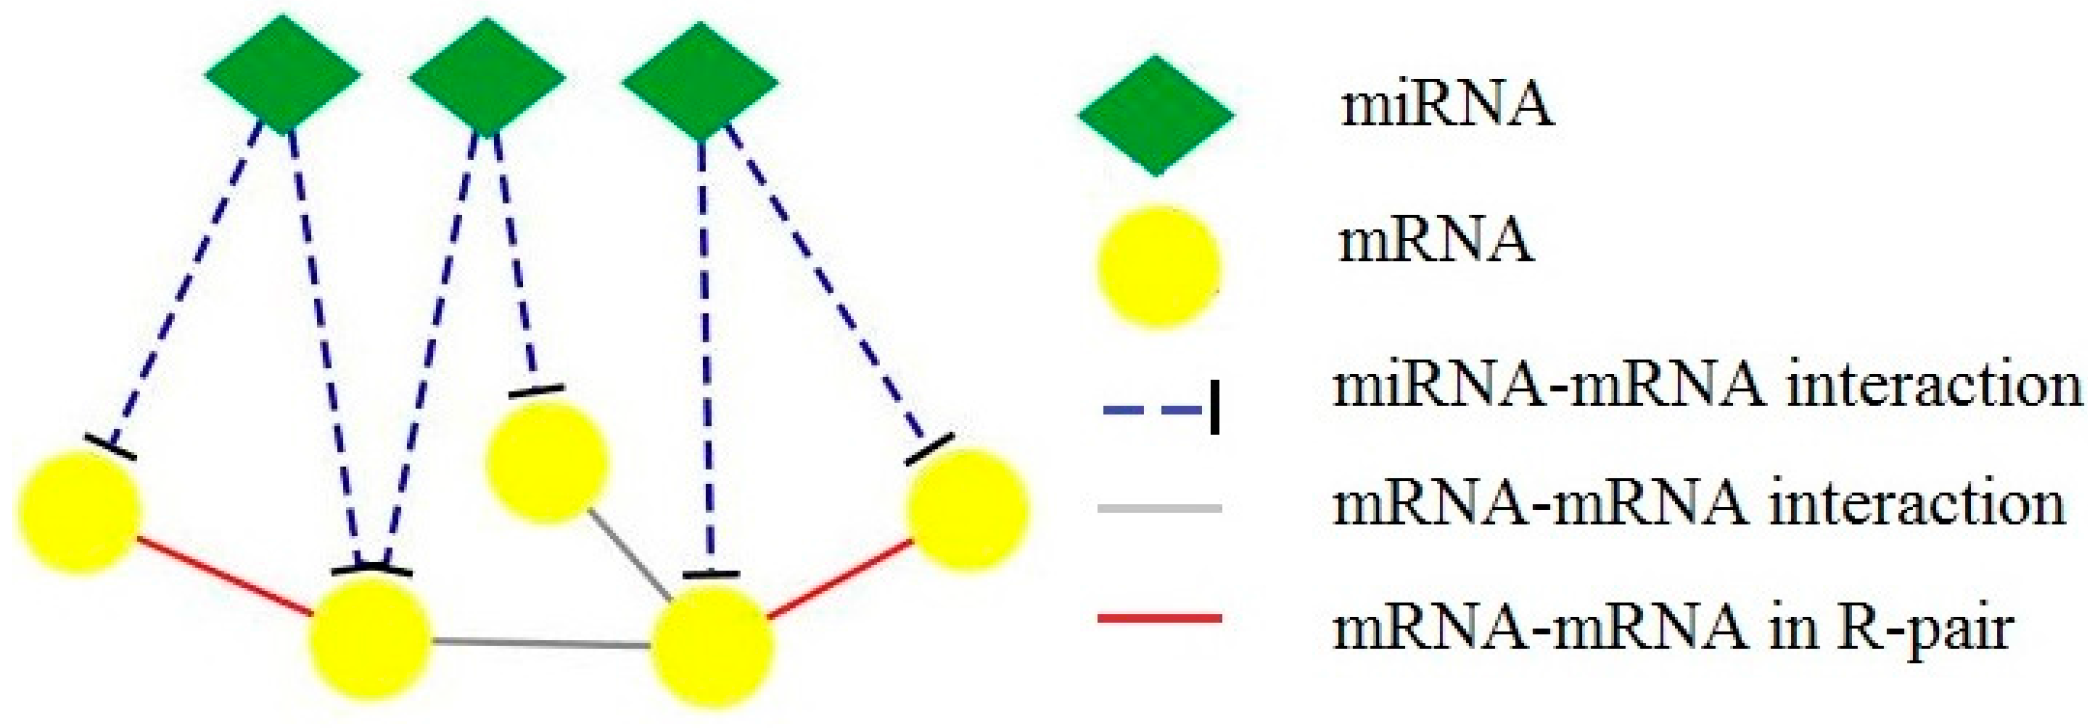
Drawing on the idea of C-pair proposed by Wu [12], we define R-pair in our situation. If a pair of mRNAs are regulated by the same miRNA, there is a co-regulation relationship between the mRNA pair, i.e., CR (co-regulation interactions). Given two mRNAs, if they are regulated by the same miRNA and they also have interactions with each other, then we define this triangle structure as R-pair structure shown in Figure 1. We believe that the mRNAs in R-pair structure have more functional consistency than the mRNAs that are not. In fact, there are several studies showing that miRNA tends to target highly connected mRNAs or proteins in PPI networks, and that the R-pair structure plays important roles in cell function [9,10,11,13]. So, the R-pair structure can be regarded as the core of a CMFM. By identifying R-pairs in the composite network, we can easily detect meaningful biological modules.

Figure 1.
PPI, CR and R-pair. If two mRNAs are regulated by the same miRNA and there are also interactions between them, they form an R-pair.
Definition 2.
miRNA-mRNA regulatory module density. To filter out the regulatory modules with low density values, we propose a density function shown in Equation (1).
Here, N and M represent the number of miRNAs and mRNAs in the module C respectively. denotes the number of miRNA-mRNA edges in the module C. Obviously, the larger is the value, the stronger are the miRNA-mRNA regulation relationships.
Definition 3.
mRNA-mRNA interaction density. To judge the density of mRNA-mRNA interaction in composite miRNA functional modules, we apply Equation (2) to compute density of these modules.
Here, M represents the number of mRNAs in module C. denotes the number of mRNA-mRNA edges in the module C. The larger is the value, the better is the consistency of mRNAs.
Definition 4.
miRNA-mRNA expression correlation. To judge the expression correlation of miRNA-mRNA in a composite miRNA functional module, we design a correlation function shown in Equation (3).
Here, N and M represent the number of miRNA and mRNAs in module C respectively. denotes the expression correlation value of miRNA-mRNA by employing Pearson correlation coefficient. Because miRNAs repress the expression of mRNAs in a module, the more negative is , the stronger is the expression of miRNA-mRNA.
3. Methods
3.1. LASSO
Least Absolute Shrinkage and Selection Operator (LASSO) is a regression analysis method that was first introduced by Tibshirani [14] in 1996. It minimizes the sum of squared errors, with a bound on the sum of the absolute values of the coefficients. The loss function of LASSO can be described as Equation (4).
Here, X is the standardized variable, Y is the response vector, is the coefficient vector, is penalty parameter.
Due to high prediction accuracy and interpretability of the model based on LASSO, LASSO is often used to predict regression coefficients between miRNAs and mRNAs [15]. Let be a sample, and be expression profiles of mRNA or miRNA in sample t, we can change the form of LASSO regularized linear regression as Equation (5) shows.
Here, is the bias, is the number of target sites in mRNA i for miRNA k, is the fitted linear coefficient and is constrained to Equation (6).
Only when , miRNA k can regulate mRNA i. By this method, we can build a more trusted miRNA-mRNA regulatory network.
3.2. Maximal Biclique Enumeration
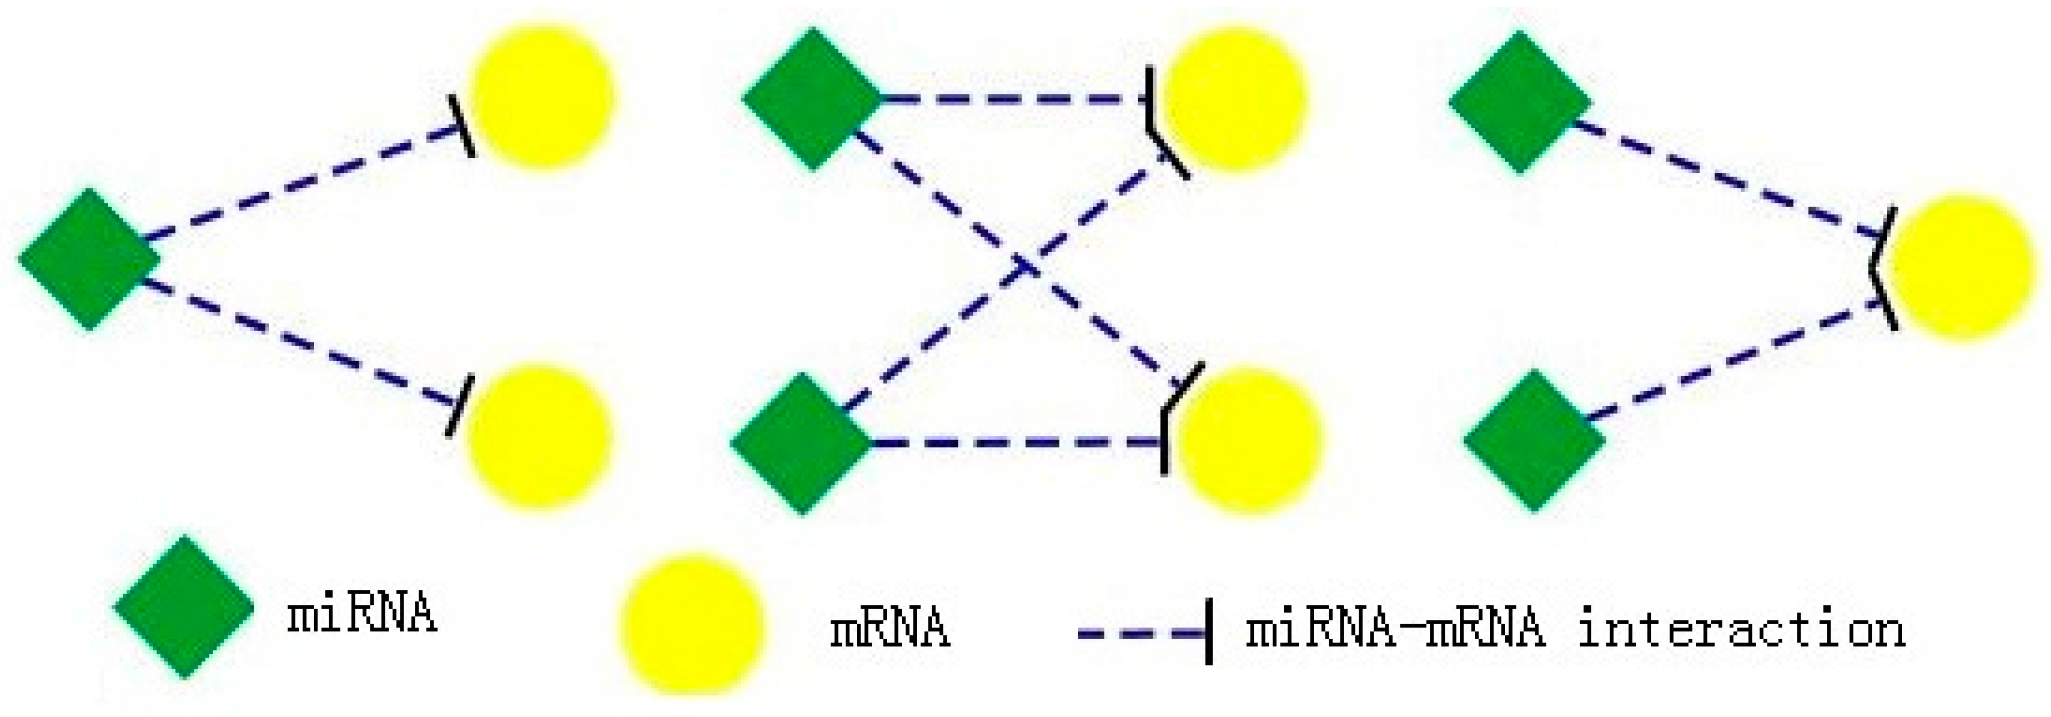
MBCFM first enumerates all maximal bicliques in miRNA-mRNA regulatory network. Because a maximal biclique is a complete sub-bigraph, it is thus the densest community structure which can represent the closest relationship between miRNAs and mRNAs in miRNA-mRNA regulatory network. There are three kinds of maximal miRNA-mRNA biclique, as described in Figure 2. Every miRNA has one or more links with one or more mRNA, but there is no link between miRNAs or between mRNAs. Here we apply maximal biclique enumeration algorithm (MICA) from Alexe et al. [16] to get all maximal bicliques in miRNA-mRNA regulatory network. The values of maximal bicliques are all 1.

Figure 2.
Three types of maximal miRNA-mRNA bicliques. In the miRNA regulation network, there are many types of maximal miRNA-mRNA bicliques. Their values are all 1.
3.3. MBCFM
To effectively carry out the CMFM identification from multiple types of genomic data, we propose a new method called MBCFM (detecting Composite Function Modules based on Maximal Biclique enumeration) to implement the solution. We first employ LASSO regression model to reconstruct miRNA-mRNA interaction network by integrating mRNA/miRNA expression profiles and target sit information. Next, we identify CMFMs based on the enumerated maximal bicliques. We here treat each maximal biclique as a CMFM core. The details are described as Algorithm 1.
| Algorithm 1 Identifying CMFM Cores |
| Input: target site information matrix C, miRNA express profile matrix X, mRNA express profile matrix Z Output: CMFM core set TDATA 1. # reconstruct miRNA-mRNA interaction matrix 2. W = lasso(C, X, Z) 3. # use maximal biclique enumeration to get cores 4. TDATA = mica(W) 5. # return CMFM core set 6. return {TDATA} |
Finally, we build up CMFMs by expanding these CMFM cores. The expanding progress contains three main stages:
- i
- We first add mRNA-mRNA interactions into the CMFM cores and get rid of the cores whose mRNAs have no mRNA-mRNA interaction;
- ii
- We add neighbor mRNAs as well as corresponding interactions into the CMFM cores to maximize miRNA-mRNA regulatory module density values and mRNA-mRNA interaction density values of these modules;
- iii
- Under the condition that the regulation density value of a CMFM is not lower than the threshold value (0.5 by default), miRNAs are added into the module to further expand it.
The details are described as Algorithm 2.
| Algorithm 2 Expanding Cores to CMFMs |
| Input: miRNA-mRNA interaction matrix W, CMFM core set TDATA, MRNA-mRNA matrix PPIN, density threshold Output: MC # the set of CMFM module
|
4. Experiments and Results
4.1. Materials
In order to evaluate the performance of MBCFM and fairly compare it with the other two existing methods of Mirsynergy and SNMNMF in miRNA regulatory modules detection, we apply these three methods to the ovarian cancer dataset processed by Zhang et al. [10]. The miRNA and mRNA expression profiles for 385 samples were downloaded from TCGA data portal (http://cancergenome.nih.gov/), each measuring 559 miRNAs and 12456 mRNAs, respectively. The sequence based predicted miRNA-mRNA target site information was collected from MicroCosm (http://www.ebi.ac.uk/enrightsrv/microcosm/htdocs/targets/v5/). The PPI data were downloaded from BioGrid (Stark et al., 2011). To facilitate our biological analysis in the next sections, we downloaded the disease-related miRNA set from HDMM [17], and the disease-related gene set from SemFunSim [18] and DisGeNET (http://www.disgenet.org/).
4.2. Comparison of Overall Performance
In order to compare overall performance among the three methods, we test MBCFM, Mirsynergy and SNMNMF on the ovarian cancer dataset, respectively. In accordance with the MBCFM algorithm steps, we firstly detected 13,050 maximal bicliques by using maximal biclique enumeration algorithm. We next computed the density of each biclique and got rid of the bicliques whose I-density value equaled to zero, and 273 R-pair miRNA-mRNA clusters were retained. We then expanded the modules by adding neighbor mRNAs into the R-pair miRNA-mRNA clusters. Here, we set R-density threshold θ = 0.5, we furthermore added related miRNAs to the modules to prevent the omission of regulatory miRNAs. After removing the miRNA clusters with the number of miRNAs or mRNAs are less than two, 94 composite miRNA regulatory modules were finally identified by MBCFM, which have 5.42 miRNAs and 40.3 mRNAs per module on average (see Table 1). For Mirsynergy and SNMNMF, they identified 84 and 49 modules respectively, and the respective averaged number of miRNAs (mRNAs) per module is 4.17 (9.92) and 4.04 (81.88). The maximum number of miRNAs in a single module detected by MBCFM is 18. In contrast, the largest number of miRNA in Mirsynergy is 12, and in SNMNMF is 9.

Table 1.
Performance summary of MBCFM, Mirsynergy and SNMNMF.
We further evaluated the density of the connection in the identified modules. The averaged density values of MBCFM, Mirsynergy and SNMNMF are 0.312, 0.063, and 0.004, respectively. Notably, the modules identified by MBCFM are more densely connected as compared to other two methods (p < 1.744 × 10⁻¹⁰, one-sided Wilcoxon signed rank test). In contrast to Mirsynergy and SNMNMF, the relatively dense modules identified by MBCFM are in better agreement with the cooperative regulation.
Besides, MBCFM proved to be much more computationally efficient than Mirsynergy and SNMNMF in running time. Tested on the same data ovarian cancer dataset and same platform Windows 7 system with 4GB RAM, it took MBCFM less than one hour, while it took Mirsynergy more than one hour and SNMNMF more than 24 hours to finish the computation.
4.3. Structural Significance and Functional Coherence of CMFMs
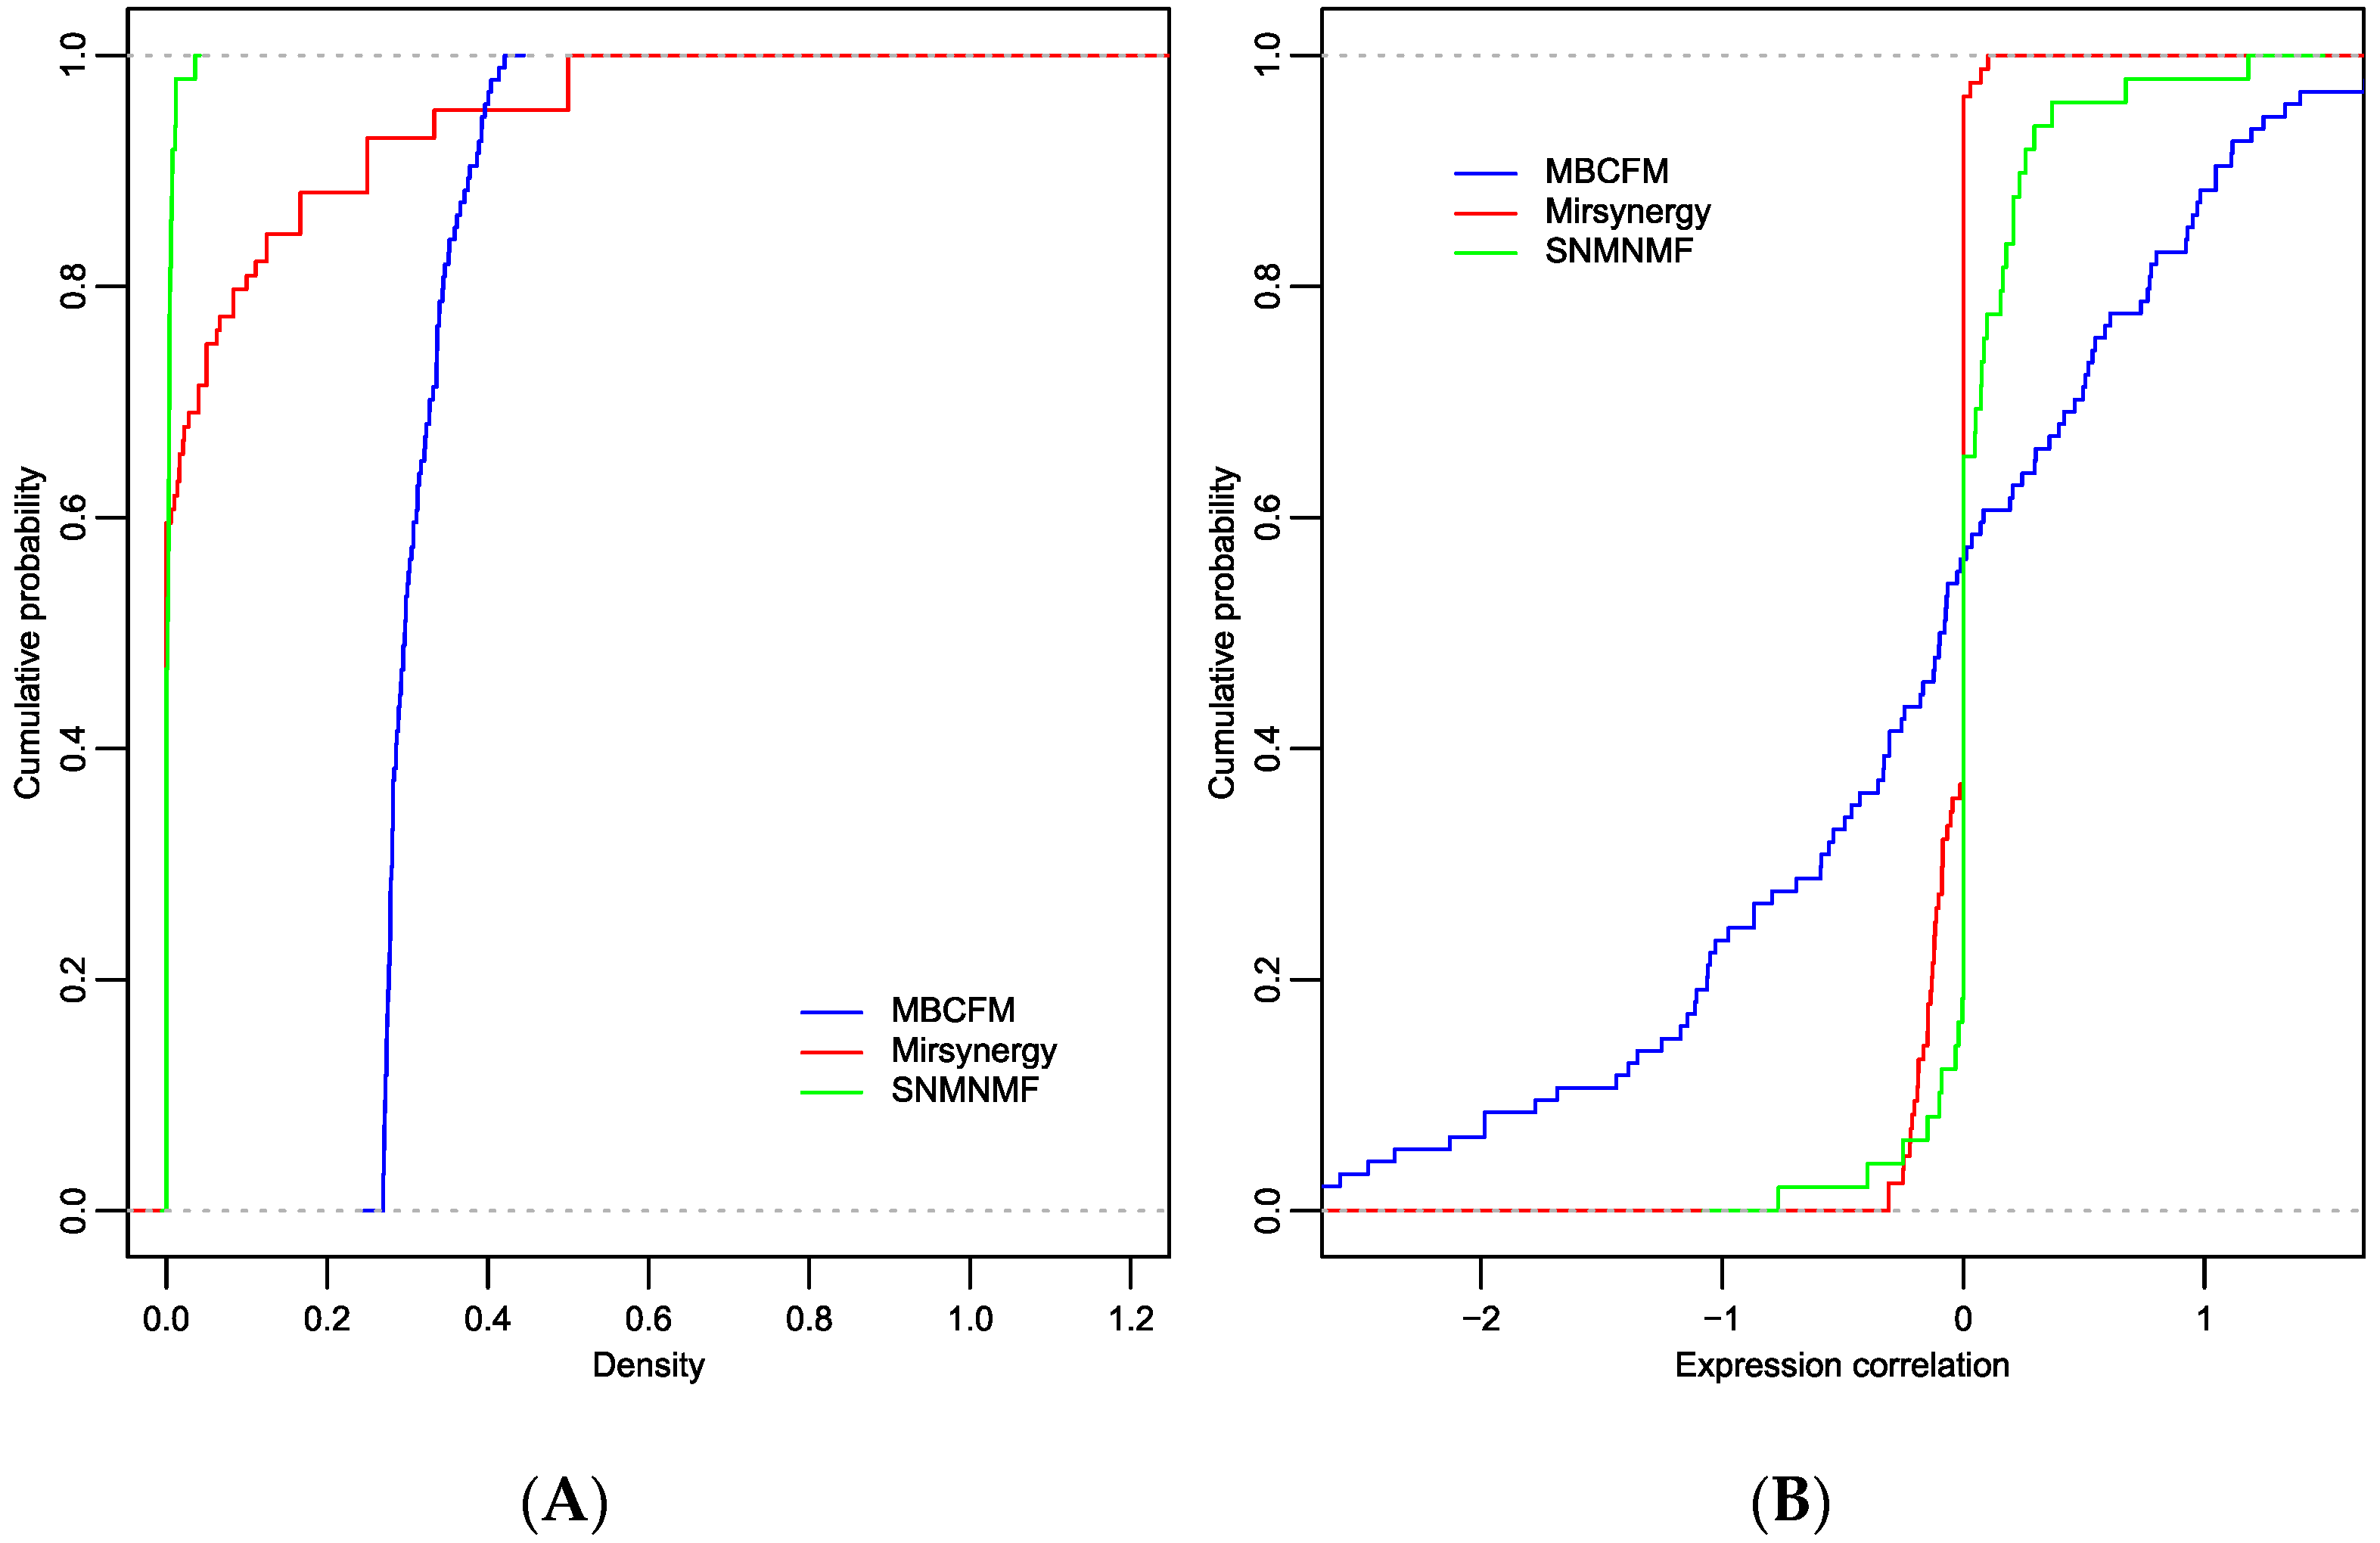
CMFMs are the units that represent consistency between CRs and PPIs in the integrated network. We herein carry on comparative analysis on density for each module to exhibit the connection between miRNAs and mRNAs. As illustrated in Figure 3A, the densities of modules from MBCFM are clearly larger than SNMNMF and Mirsynergy, which indicates that modules identified by MBCFM are significantly more densely connected than SNMNMF and Mirsynergy. It is also observed that the densities in modules from SNMNMF and Mirsynergy are generally small, which implies that many of the mRNAs in these modules are not regulated by miRNAs, which is not in agreement with the standpoint of miRNA cooperative regulation. In addition to evaluating the density values of modules, we also computed the averaged anti-correlation between miRNAs and mRNAs in the identified modules. As shown in Table 1, Mirsynergy and MBCFM exhibit negative average anti-correlations while SNMNMF shows a positive average anti-correlation. In detail, as illustrated in Figure 3B, MBCFM can collect lots of negative anti-correlation modules in which the correlation values are less than −1, while the other two methods can only collect a few modules whose correlation values are between 0 and −1. Due to the sparsity of connections in Mirsynergy and MBCFM modules, the miMEC values almost equal to zero in those two method modules, which further explains why the miRNAs and mRNAs in SNMNMF-modules and Mirsynergy-modules are not cooperatively regulated. All of the above results demonstrate that the modules identified by MBCFM are in agreement with the cooperative regulation between miRNAs and mRNAs.

Figure 3.
The cumulative distribution function (CDF) for the density and miMEC of modules identified by MBCFM, Mirsynergy and SNMNMF on ovarian dataset. (A) There are plenty of zero-density modules identified by Mirsynergy and SNMNMF; (B) MBCFM can collect lots of negative anti-correlation modules in which the correlation values are less than −1, while other two methods only can collect a few of modules whose correlation values are between 0 and −1.
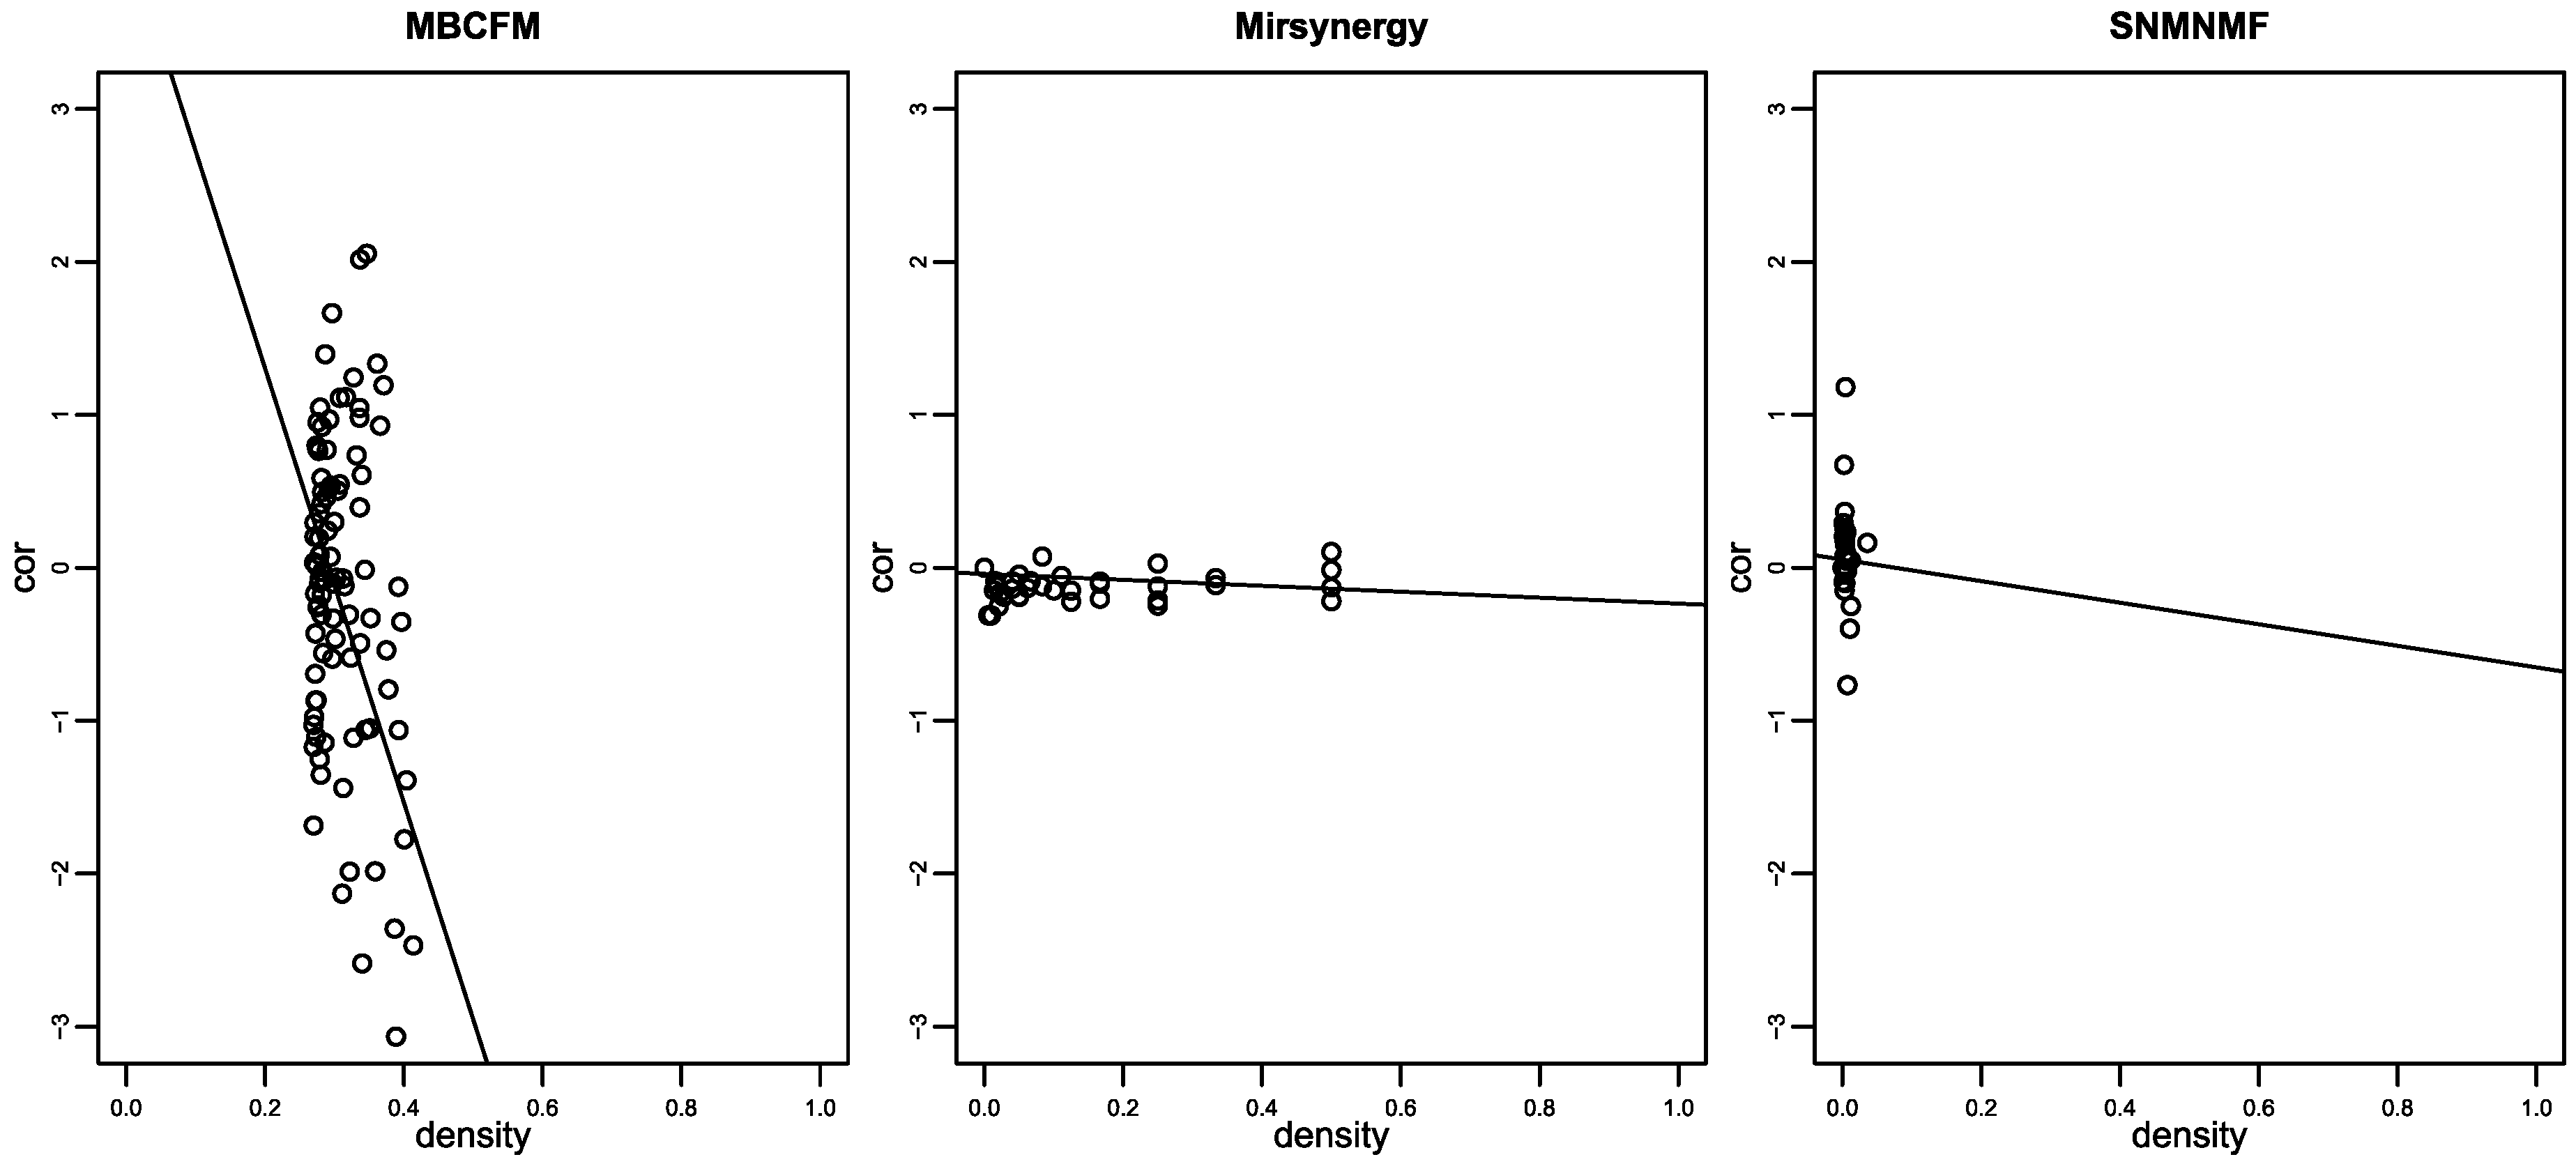
As illustrated in Figure 4, the distribution of MBCFM-modules between density and anti-correlation also outperforms than Mirsynergy and SNMNMF. The observations confirm that the densities from MBCFM modules are denser than Mirsynergy and SNMNMF, and corresponding anti-correlations are also more negative than theirs. Therefore, the modules identified by our method show stronger regulation between miRNAs and mRNAs than Mirsynergy and SNMNMF.

Figure 4.
The distributions between density and anti-correlation for modules detected by MBCFM, Mirsynergy and SNMNMF. Large number of anti-correlation values of the modules detected by Mirsynergy are close to zero. Lots of density values of the modules detected by SNMNMF are also close to zero.
4.4. Association between Structural Consistency and Functional Hierarchy of CMFMs
The structural consistency of CMFM is associated with their functional annotation hierarchy. To evaluate function enrichment of the identified CMFMs, we employ GOstats [19] to calculate their enrichment in GO-BP terms. In order to visually display the level of functional enrichment, we implement GO enrichment score (GOES) to measure GO-BP enrichment degree for each module. The GOES is defined as , here represents the number of GO-BP terms the mRNAs enriched and represents p-valve in the th GO-BP term.
The modules detected by SNMNMF have, on average, small density values, which indicates that the mRNAs in the modules of SNMNMF are sparsely connected with the miRNAs. In addition, miMEC reflects the regulatory strength between miRNAs and mRNAs. Since miRNAs are known to suppress mRNAs, the negativity of miMEC is a reasonable indicator for evaluating the quality of CMFMs [10,11,20]. However, the average miMEC value of SNMNMF module is positive, which further indicates that there is an amount of false positive in CR and PPI interactions in the modules. Therefore, there is not much necessity to compare MBCFM with SNMNMF in functional analysis. Thus, we here implemented functional analysis comparison between MBCFM and Mirsynergy. Accordingly, we adopt a functional enrichment comparative analysis just for the mRNAs lists involved in these modules identified by MBCFM and Mirsynergy.
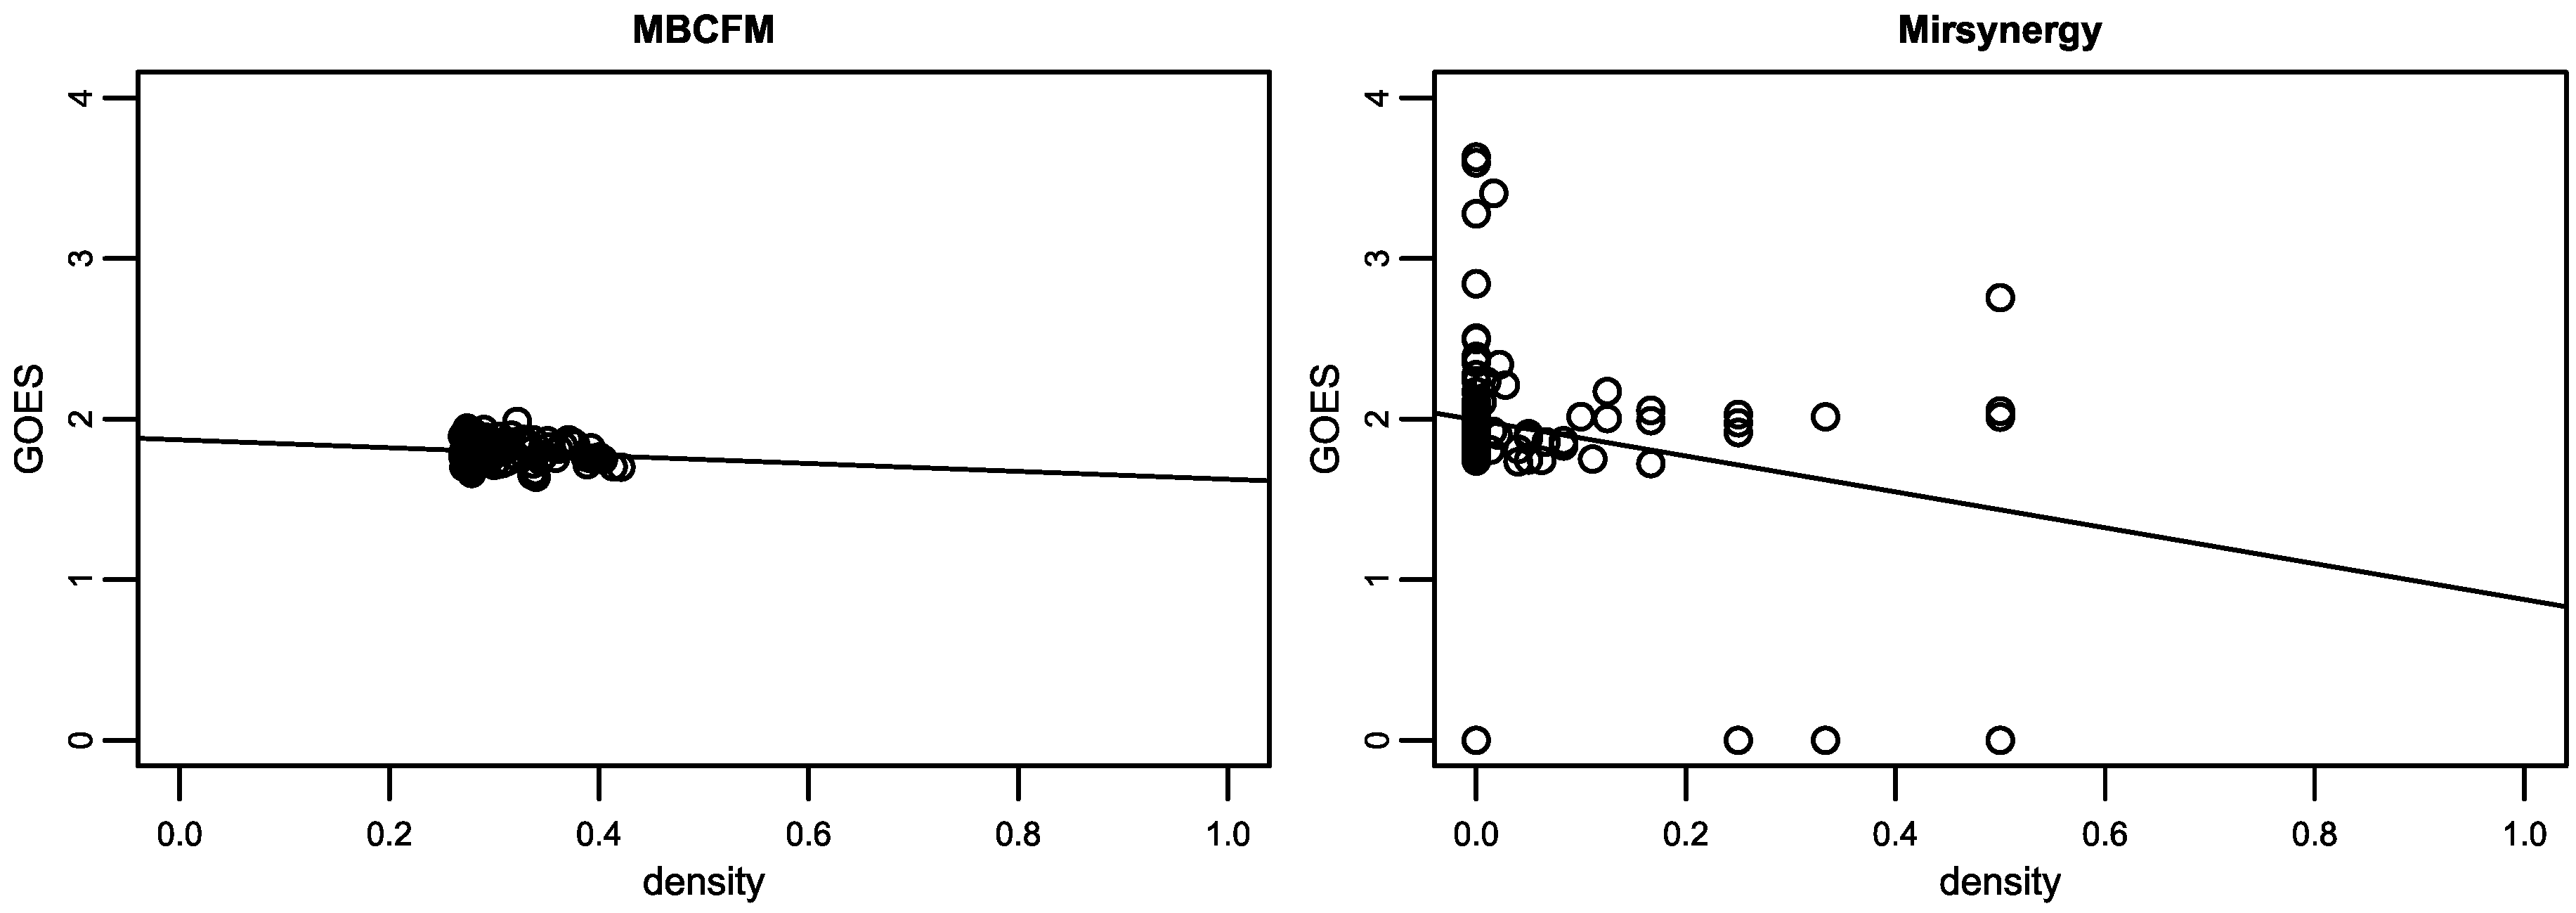
The average number of mRNA identified by MBCFM is 5.42, and 4.76 in Mirsynergy. Seventy-eight of the 84 modules (just 93%) from Mirsynergy are enriched in GO-BP terms. It is less than the ratio of MBCFM 89/94 (just 95%). As illustrated in Figure 5, our modules with the function enrichment scores intensively distribute between 0.2 and 0.5 of the density value, whereas in Mirsynergy its module distribution is messy and there are lots of dense modules with zero GOES. These CMFMs identified by Mirsynergy are not meaningful for function analysis.

Figure 5.
The functional consistency analysis of OV CMFMs. Though lots of modules detected by Mirsynergy have some GO-BP terms, their density values are zero. It shows that these mRNAs are loosely clustered into some modules, and not able to form an effective biological relationship with miRNAs.
We further employed David website (https://david.ncifcrf.gov/) to calculate their enrichment in Kyoto Encyclopedia of Genes and Genomes (KEGG) pathways. Seven modules from MBCFM are enriched in KEGG pathways. Our method is three modules more than Mirsynergy. In conclusion, the observations are in agreement with the viewpoint that our modules are more functionally enriched than Mirsynergy.
4.5. Kaplan-Meier Survival Analysis
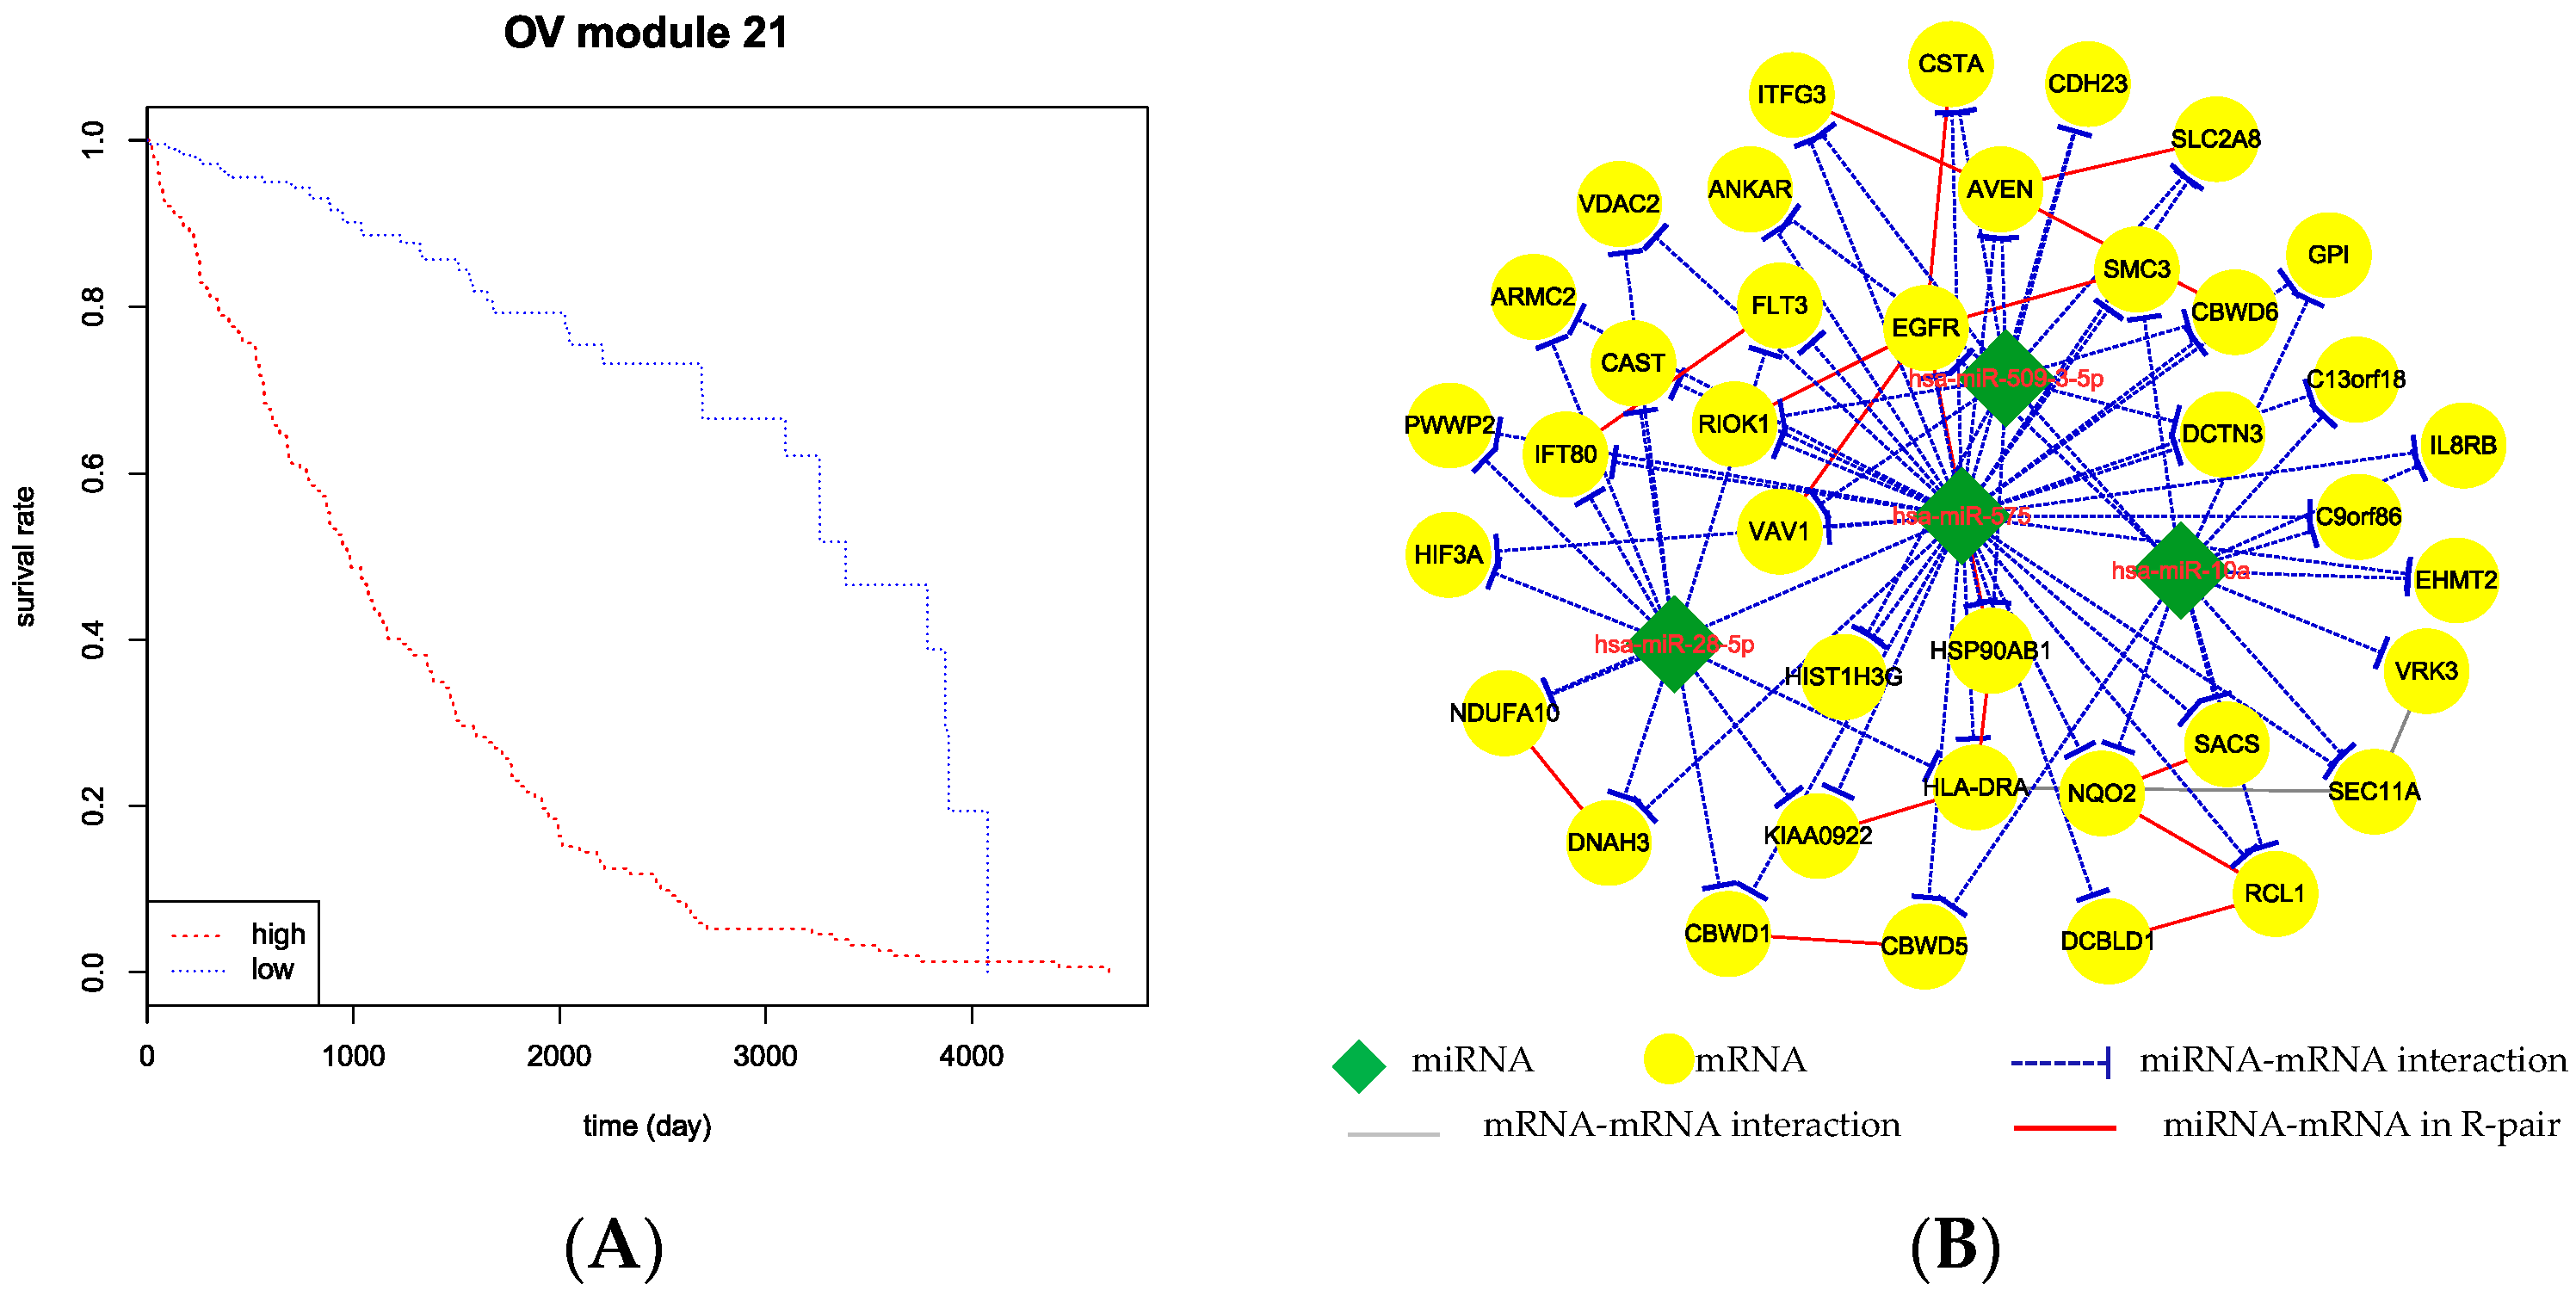
Based on the clinical data from The Cancer Genome Atlas (TCGA), we exhibit the association level of patient survival time with the detected CMFMs by the averaged miRNA expression levels. After retaining the samples recorded in the expression data, we obtained 376 samples for OV. For each module, we divided the samples into two groups based on their averaged miRNA expression levels which are higher or lower than the sample means. We then tested this hypothesis by Kaplan-Meier method using R package survival to compare the survival characteristics (log-rank test p < 0.001) of the two groups. As a result, we found seven CMFMs with significant separation of two curves in the OV dataset. Figure 6 illustrates the Kaplan–Meier survival curves for CMFM 21 in ovarian cancer. For CMFM 21, the log-rank test gives p = 0.00023 and the median survival duration of the Low-group and High-group are 1054.2 days and 1345.7 days, respectively (Figure 6A).The patients in the Low-group faced greater risks.

Figure 6.
Kaplan-Meier survival analysis using CMFM 21 in ovarian cancer. (A) Patients with miRNA expression higher and lower than the sample average within each CMFM were divided into “High” (red dot) and “Low” (blue dot) groups, respectively. Survival rate as a function of time (days) between initial diagnosis and death were then plotted for the two groups; (B) The corresponding network for Module 21. Green nodes represent miRNAs. Yellow nodes represent mRNA. The blue dashed lines, gray solid lines, red solid lines represent miRNA-mRNA regulatory interactions, mRNA-mRNA interactions and mRNA-mRNA interactions in R-pair structure.
CMFM 21 detected by MBCFM from OV dataset contains 4 miRNAs and 38 mRNAs. In the module, it is clear that hsa-miR-575 and EGFR are the key nodes. The miRNA hsa-miR-575 regulates all mRNAs in the module and mRNA EGFR has interactions with the other five mRNAs. Wang et al. [21] demonstrated that hsa-miR-575 is a onco-miRNA. Yang et al. [22] described that hsa-miR-3142 regulate cell growth and viability of thyroid cancer cells in part by repressing expression of USF2, RCL1 and SACS. Yang et al. [23] studied the important role of EGFR in lung cancer disease. In conclusion, the CMFMs identified by our method are closely related to cancer.
5. Conclusions
In this paper, we proposed MBCFM to detect ovarian cancer related function modules from miRNA regulation network and mRNA-mRNA interaction network. We applied MBCFM to ovarian data and finally found 94 CMFMs. According to the biological analysis, we found that the genes from 89 CMFMs all significantly enriched in GO-BP terms. Importantly, many miRNAs and mRNA from MBCFM-modules were validated as the main driver of ovarian cancer. By comparing our method to SNMNMF and Mirsynergy, we found that the modules from MBCFM exhibit more biological function, and also our algorithm presents more computational efficiency than the other two. In brief, with large amount of mRNA/miRNA expression data becoming available, we believe that MBCFM can be extended to other complex diseases for detection of disease associated-modules.
Supplementary Materials
Supplementary File 1Acknowledgments
The research is funded by the “twelfth five-year” Education Science Plan Project of Hunan province of China (Grant No. XJK014AXX002), the scientific research project of Education Department of Hunan Province of China (Grant No. 15C0696).
Author Contributions
Yi Yang and Chu Pan conceived and designed the experiments; Yi Yang performed the experiments; Yi Yang and Chu Pan analyzed the data; Chu Pan contributed reagents/materials/analysis tools; Yi Yang wrote the paper.
Conflicts of Interest
The authors declare no conflict of interest.
References
- Bartel, D.P. Micrornas: Target recognition and regulatory functions. Cell 2009, 136, 215–233. [Google Scholar] [CrossRef] [PubMed]
- Lu, J.; Getz, G.; Miska, E.A. Microrna expression profiles classify human cancers. Nature 2005, 435, 834–838. [Google Scholar] [CrossRef] [PubMed]
- Volinia, S.; Calin, G.A.; Liu, C.G.; Ambs, S.; Cimmino, A.; Petrocca, F.; Visone, R.; Iorio, M.; Roldo, C.; Fanuela, M.; et al. A microrna expression signature of human solid tumors defines cancer gene targets. Proc. Natl. Acad. Sci. USA 2006, 103, 2257–2261. [Google Scholar] [CrossRef] [PubMed]
- Peng, X.; Li, Y.; Walters, K.A.; Rosenzweig, E.R.; Lederer, S.L.; Aicher, L.D.; Proll, S.; Katze, M.G. Computational identification of hepatitis C virus associated microRNA-mRNA regulatory modules in human livers. BMC Genom. 2009, 10, 373. [Google Scholar] [CrossRef] [PubMed]
- Jayaswal, V.; Lutherborrow, M.; Ma, D.D.; Yang, Y.H. Identification of microRNA-mRNA modules using microarray data. BMC Genom. 2011, 12, 138. [Google Scholar] [CrossRef] [PubMed]
- Hormozdiari, F.; Berenbrink, P.; Przulj, N.; Sahinalp, S.C. Not all scale-free networks are born equal: The role of the seed graph in PPI network evolution. PLoS Comput. Biol. 2007, 3, e118. [Google Scholar] [CrossRef] [PubMed]
- Yoon, S.; De Micheli, G. Prediction of regulatory modules comprising microRNAs and target genes. Bioinformatics 2005, 21 (Suppl. 2), ii93–ii100. [Google Scholar] [CrossRef] [PubMed]
- Joung, J.G.; Hwang, K.B.; Nam, J.W.; Kim, S.J.; Zhang, B.T. Discovery of microRNA-mRNA modules via population-based probabilistic learning. Bioinformatics 2007, 23, 1141–1147. [Google Scholar] [CrossRef] [PubMed]
- Joung, J.; Fei, Z. Identification of microRNA regulatory modules in Arabidopsis via a probabilistic graphical model. Bioinformatics 2009, 25, 387–393. [Google Scholar] [CrossRef] [PubMed]
- Zhang, S.; Li, Q.; Liu, J.; Zhou, X.J. A novel computational framework for simultaneous integration of multiple types of genomic data to identify microrna-gene regulatory modules. Bioinformatics 2011, 27, 401–409. [Google Scholar] [CrossRef] [PubMed]
- Li, Y.; Liang, C.; Wong, K.C.; Luo, J.; Zhang, Z. Mirsynergy: Detecting synergistic mirna regulatory modules by overlapping neighbourhood expansion. Bioinformatics 2014, 30, 2627–2635. [Google Scholar] [CrossRef] [PubMed]
- Wu, C.; Zhang, F.; Su, F.; Li, J.; Li, K.; Zhang, S.; Li, K.; Yan, Y. Composite functional module inference: Detecting cooperation between transcriptional regulation and protein interaction by mantel test. BMC Syst. Biol. 2010, 4, 1–11. [Google Scholar] [CrossRef] [PubMed]
- Yuan, X.; Liu, C.; Yang, P.; He, S.; Liao, Q.; Kang, S.; Zhao, Y. Clustered microRNAs’ coordination in regulating protein-protein interaction network. BMC Syst. Biol. 2009, 3, 65. [Google Scholar] [CrossRef] [PubMed]
- Tibshirani, R. Regression Shrinkage and Selection via the Lasso. J. R. Stat. Soc. Ser. B Methodol. 1996, 8, 267–288. [Google Scholar]
- Lu, Y.; Zhou, Y.; Qu, W.; Deng, M.; Zhang, C. A Lasso regression model for the construction of microRNA target regulatory networks. Bioinformatics 2011, 27, 2406–2413. [Google Scholar] [CrossRef] [PubMed]
- Alexe, G.; Alexe, S.; Crama, Y. Consensus algorithms for the generation of all maximal bicliques. Discret. Appl. Math. 2004, 145, 11–21. [Google Scholar] [CrossRef]
- Maagh, P.; Butz, T.; Plehn, G.; Christoph, A.; Meissner, A. Pulmonary vein isolation in 2012: Is it necessary to perform a time consuming electrophysical mapping or should we focus on rapid and safe therapies? A retrospective analysis of different ablation tools. Int. J. Med. Sci. 2013, 10, 24–33. [Google Scholar] [CrossRef] [PubMed]
- Le, H.; Bar-Joseph, Z. Integrating sequence, expression and interaction data to determine condition specific mirna regulation. Bioinformatics 2013, 29, i89–i97. [Google Scholar] [CrossRef] [PubMed]
- Falcon, S.; Gentleman, R. Using gostats to test gene lists for go term association. Bioinformatics 2007, 23, 257–258. [Google Scholar] [CrossRef] [PubMed]
- Jin, D.; Lee, H. A computational approach to identifying gene-microrna modules in cancer. PLoS Comput. Biol. 2015, 11, e1001014. [Google Scholar] [CrossRef] [PubMed]
- Wang, H.; Yan, C.; Shi, X.; Zheng, J.; Deng, L.; Yang, L.; Yu, F.; Yang, Y.; Shao, Y. MicroRNA-575 targets BLID to promote growth and invasion of non-small cell lung cancer cells. Fed. Eur. Biochem. Soc. 2015, 589, 805–811. [Google Scholar] [CrossRef] [PubMed]
- Agirre, X.; Jiménez-Velasco, A.; San José-Enériz, E.; Garate, L.; Bandrés, E.; Cordeu, L.; Aparicio, O.; Saez, B.; Navarro, G.; Vilas-Zornoza, A.; et al. Down-regulation of hsa-miR-10a in chronic myeloid leukemia CD34+ cells increases USF2-mediated cell growth. Mol. Cancer Res. 2008, 6, 1830–1840. [Google Scholar] [CrossRef] [PubMed]
- Yang, B.; Qin, A.; Zhang, K.; Ren, H.; Liu, S.; Liu, X.; Pan, X.; Yu, G. Circulating Tumor Cells Predict Prognosis Following Tyrosine Kinase Inhibitor Treatment in EGFR-mutant Non-Small-Cell Lung Cancer Patients. Oncol. Res. 2017, 25, 1601–1606. [Google Scholar] [CrossRef] [PubMed]
© 2017 by the authors. Licensee MDPI, Basel, Switzerland. This article is an open access article distributed under the terms and conditions of the Creative Commons Attribution (CC BY) license (http://creativecommons.org/licenses/by/4.0/).