Abstract
The mountain pine beetle, Dendroctonus ponderosae (Coleoptera: Scolytinae), is an economically important bark beetle species with a wide geographic range spanning from the southwestern United States into northern Canada. This beetle causes extensive tree mortality to 13 pine species. Mites (Acari) are common and abundant symbionts of mountain beetles that may influence their fitness through positive and negative interactions. We present a unique assessment of the mite associates of mountain pine beetles using measures of alpha and beta diversity. We sampled phoretic mites from five beetle populations: Arizona, Colorado, South Dakota, Utah (USA), and Alberta (Canada) that varied in host tree species, local climate, and beetle population level. We collected 4848 mites from 8 genera and 12 species. Fifty to seventy percent of beetles carried mites in flight with the highest mite loads occurring in middle and southern populations; decreasing in northern populations. Mite assemblages (i.e., both richness and composition) varied along a south to north latitudinal gradient and were driven by species turnover (i.e., species replacement). Differences in mite composition increased with distance between populations. We discuss climatic variation, environmental filtering, and host tree differences as factors that could affect differences in mite composition between beetle populations and discuss implications for functional shifts. Our results could represent a model for estimating diversity patterns of mite symbionts associated with other major insect pests in coniferous forest systems.
1. Introduction
Globally, forests face increased pressure from insect pests, such as bark beetles (Coleoptera: Scolytinae) [1,2,3]. Bark beetle impacts can be severe as they actively damage tree phloem tissue and vector phytopathogens, resulting in large events of tree mortality [4,5]. The mountain pine beetle, Dendroctonus ponderosae Hopkins, has been responsible for tree mortality across more than 30 million hectares of forest in western North America in the last decade [4,5]. Previously constrained by temperature, a warming climate has allowed the mountain pine beetle to expand its habitable range to higher elevations and its geographic distribution northward [6,7,8]. The mountain pine beetle colonizes 13 pine species of which it most commonly attacks lodgepole pine (Pinus contorta Doug.), white pine (Pinus strobiformis Englm.), limber pine (Pinus flexilis E. James), ponderosa pine (Pinus ponderosa Doug. ex C. Lawson) [9], and more recently, jack pine (Pinus banksiana Lamb.) [7,10].
Most of the mountain pine beetle’s life is spent within the phloem layer of its host tree where beetles tunnel, deposit blue-staining fungi, lay eggs, and complete development from larval to adult [11,12,13]. The microhabitats created by beetle activity are used by numerous organisms hereby referred to as ‘symbiota’ or ‘symbionts’ [14]. The beetle’s symbiota can also influence its fitness via ecological interactions (e.g., alimentary mutualists and fitness antagonists) [15,16]. For example, fungal symbiota associated with the mountain pine beetle can positively influence beetle reproductive success by providing nutritional resources [13,17,18] or negatively via parasitism and competition [19,20]. Mites (Acari) are important associates of bark beetles [16,21] and perform various direct and indirect functional roles in bark-beetle galleries such as vectoring fungi, predating each-other and beetle young, etc. [14,22,23]. They may specialize on a single beetle host, act as generalists, and form complexes of cryptic species with varying degrees of host specificity [24,25]. As in other closely related bark beetles, mite functions influence a beetle’s success both directly and indirectly [26,27,28,29]. Mites can indirectly affect tree death by facilitating the transmission of plant pathogens into a new tree [29,30]. For example, mites associated with the bark beetle, Scolytus multistriatus (Marsham), contribute to the transmission of the destructive vascular wilt disease agent, Ophiostoma novo-ulmi Brasier in Ulmus spp.; interestingly, this fungus can significantly reduce beetle fitness [31].
Mites associate with bark beetles and other forest insects via phoresy [32], i.e., by using the beetles as a means of passive transport between trees and under the bark within a tree. Very high loads of phoretic mites can impair host mobility and negatively affect the host or ‘carrier’ beetle [27,33]. In carrion beetles (Coleoptera: Silphidae) mites at abnormally large densities negatively affected their host beetle fitness [34]. Several factors are known to influence phoretic mite loads across beetle populations, including forest tree composition [16,35], temperature [36,37,38], geographic distance and dispersal (reviewed in [39]), and beetle abundance [29,40]. Since the mountain pine beetle shows varying preferences for certain pine species [12], with the abundance of preferred host trees, and local climate varying among forests [4,5,6], it is expected that mite assemblages differ across beetle populations, but this is rarely tested.
Disregarding mites in the study of bark beetles not only underestimates the total biodiversity associated with bark beetles, but also reduces our ability to interpret variation in beetle population dynamics [16,21,41]. Additionally, previous studies of mountain pine beetle mites have largely been restricted to single populations, lacking comparisons of different populations [5,21,42]; thereby limiting our understanding of how specific mite assemblages relate to their beetle host success or population stage.
Here we examine, describe, and analyze the phoretic mite assemblages associated with mountain pine beetles in five different beetle populations spread across a latitudinal gradient and varying in host tree species, local climate, and beetle population stage. We use measures of alpha and beta diversity to describe these compositional differences and discuss mechanisms that might be driving these differences; specifically host tree variability, climatic variability, beetle abundance, and mite functional group. We predict that increased latitudinal separation correlates with differences in mite assemblages, and that differences may be caused by climate and environmental factors. Our aim is to set the stage for future work that would examine broad scale patterns of mite assemblages associated with mountain pine beetles and other economically and ecologically important forest insect species.
2. Materials and Methods
2.1. Mite Collection
Between 2009 to 2017, 2225 mountain pine beetle specimens were collected in Arizona, Colorado, Utah, South Dakota (United States), and Alberta (Canada) during the beetle’s main emergence event, which usually occurs in the late summer months between July–August (Figure 1; Table 1). Beetles were captured using a combination of baited flight traps (Lindgren funnel traps; ref. [43]) and infested logs placed inside emergence chambers [44] (Table 1). Sampling size of beetles varied due to differences in funding and resources, and the sampling strategies of each author/collaborator. Host tree species, sampling years, and beetle population phase also varied with location (Table 1). This broad dataset, therefore, represents nearly all stages and climate types of mountain pine beetle populations across its North American distribution. Differences in sample size of beetles and associated mite loads were accounted for through the use of multi-variate non-parametric statistical analyses. Between 161 and 910 beetles from each population were examined for mites. Mites were removed from each beetle, identified by clearing and mounting on glass slides under a dissecting microscope, and stored using mite collection protocols and identification resources as described in Vissa, et al. [35] for Arizona and Utah populations, Mori, et al. [42] for Alberta, Reboletti [45] for South Dakota, and Mercado, et al. [21] for Colorado. These vary only subtly in mite storage (particularly location of specimen), and otherwise converge on the same collection, clearing and mounting protocols used for processing bark-beetle mites.
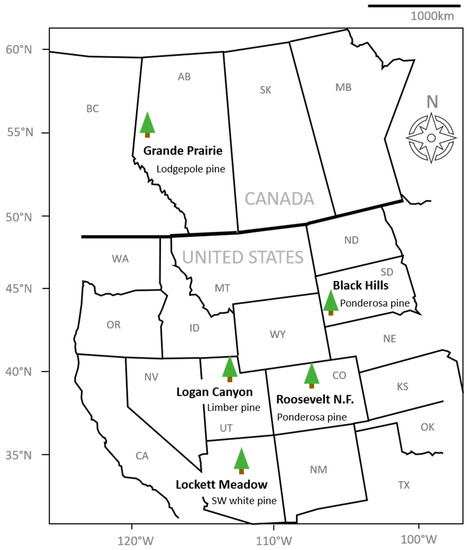
Figure 1.
Map of sampling locations for the five sampled beetle populations.

Table 1.
Mountain Pine Beetle (MPB) population, sampling, and site information. (#) refers to the “total number of” beetles and/or mites.
2.2. Assessing Climatic Conditions
To assess sampling year and population location factors, we compared sampling year average and 30-year annual averages of precipitation and temperature extracted from the PRISM (Parameter-elevation Regressions on Independent Slopes Model) Climate Group, Oregon State University database [46] using field coordinates listed in Table 1. The same data for Alberta, Canada was retrieved from the Canadian Climate Normals database (Environment and Climate Change Canada, 2019; ref. [47]).
Alberta, the northern-most population, had the lowest minimum and maximum temperatures overall; and had particularly low average minimums in the sampling year (Figure 2). South Dakota had the highest average maximum and average minimum temperatures overall. Extracted climate data showed low precipitation in both regions. Colorado’s climatic conditions were similar to that of South Dakota during the 2012 sampling year but experienced a marked increase in total precipitation during the 2013 sampling year. Utah experienced similar average maximums as those seen in Colorado, however, lower average minimum temperatures were observed. Arizona, the southern-most population, had higher maximum and minimum temperatures compared to Utah, although Arizona received less total precipitation compared to Utah (Figure 2).
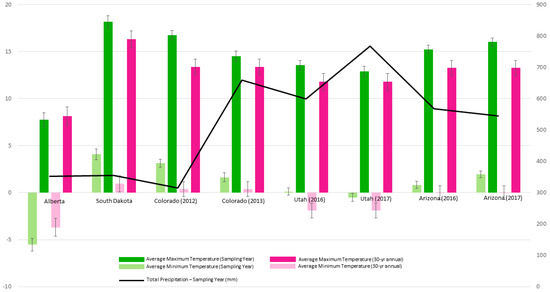
Figure 2.
Basic climate information for sampling locations and years compared to 30-year annual averages. Obtained from the PRISM Climate Group database [46], Oregon and the Canadian Climate Normals database [47].
2.3. Mite Data Analysis
Analyses were carried out in R. ver. 3.6.2 (R Core Team, 2019) using raw mite abundance data. Species accumulation curves for each population and the overall total sample pool were estimated using the specaccum function in the vegan package [48]. To test for differences in mite loads across populations, we used generalized linear models (GLM) using the glm function in the MASS package [49]. To test for pairwise differences in the assemblage of species across sampling locations based on the presence and absence of species and their abundances, a negative binomial GLM with pairwise comparisons using the manyglm function in the mvabund package [50] was used. The use of the negative binomial distribution was determined by model selection using the Akaike information criterion (AIC) [51] where Poisson, zero-inflated binomial and negative binomial distribution models were compared.
The multivariate species data were fit and analyzed with the mvabund package. The principle model fitting function, manyglm fits a GLM via resampling for each sampled species using species abundances. It allows for multiple species testing and uses a likelihood ratio test (LRT) and resampled p-values to detect significance where the null-hypothesis (H0) considers beetle population to have no effect on mite species composition. To account for correlation in testing 1000 resampling iterations were used in our analysis via ‘pit.trap’ resampling in testing [50].
Beta diversity metrics for each population were calculated with the betapart package [52]. This package uses multiple-site dissimilarity measures to assess the spatial patterns of beta diversity. It also accounts for compositional heterogeneity across sites, thereby accounting for multivariate structure of dissimilarity in species composition [53]. Beta diversity calculations were conducted using both the Sorenson and Jaccard dissimilarity indices with no differences in results observed between the two. The Sorenson dissimilarity is used in all visualizations where: βsor is the overall Sorenson dissimilarity index, βsne is dissimilarity explained by nestedness, and βsim is dissimilarity explained by turnover. βsor, βsne, and βsim are measured on a 0–1 scale where βsor = 0 indicates all species are shared and βsor = 1 indicates no species are shared. βsor may also be expressed as (βsne + βsim). Degrees of nestedness were visually represented in a cluster dendrogram made within the betapart package. Finally, indicator species associated with each sampling location were assessed with the indicspecies package [54]. The indicator species analysis [55] highlights the occurrence of species that determine the community assemblage or its diversity within the given sampling area.
3. Results
3.1. Mite Abundance, Taxa Found, and Species Richness
A total of 4848 mites were collected across all sampled mountain pine beetle populations (Table 1). Mites represented 8 genera and 12 species (Table 2). No species were endemic to any population, while two species (Tarsonemus endophloeus Lindquist and Proctolaelaps subcorticalis Lindquist) were found in all populations. Mites from over 100 beetles were sampled from each population with species accumulation curves beginning to approach or fully approaching asymptote in all populations (Figure 3). The number of mites per beetle varied significantly (GLM analysis; p < 0.01) in all but three comparisons across populations (Table 3). Mite loads were highest in middle to southern populations; and decreased in northern populations. Alberta, the northern-most population, had significantly lower mite loads than all other populations. Percentage of phoretic mites per beetle was lowest in beetle populations in Alberta, Canada. Arizona and Utah had the greatest percentage of beetles carrying mites, followed by South Dakota where half the beetles carried mites (Figure 4).
Table 2.
Average abundance per beetle (±standard error), functional and taxonomic information for mite species captured. Indicator species (p < 0.05) for each population are indicated with an asterisk (*). Species with average abundance <0.1 are considered rare species. Significant difference between abundances listed below across populations were confirmed (see generalized linear models (GLM) analysis; Table 3).
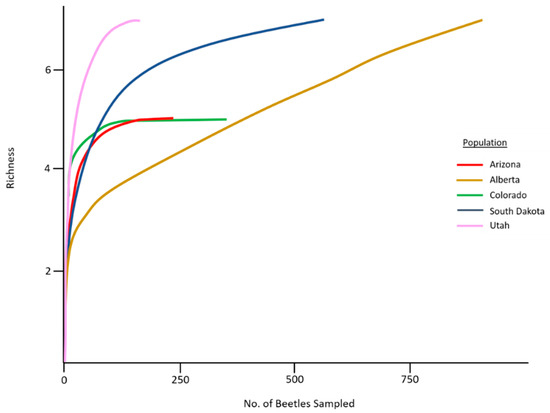
Figure 3.
Mite species accumulation curves for our five sampled mountain pine beetle populations.
Table 3.
GLM test statistics for total mite abundance per beetle across five sampled populations. Asterisk (*) shows significane at p ≤ 0.05.
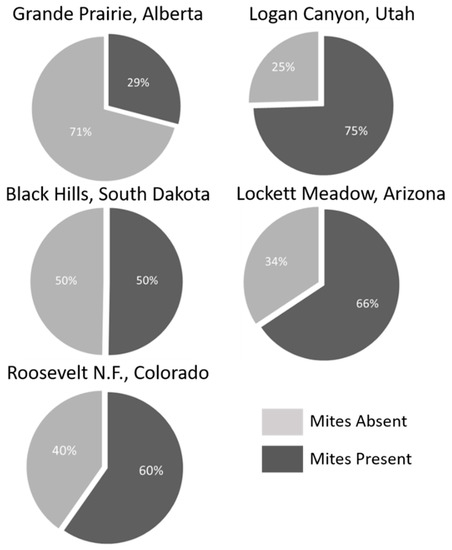
Figure 4.
Percent beetles carrying mites in each sampled population.
A pairwise comparison of the total mite species richness per beetle showed no difference between populations (p > 0.05; Table 4). Specific indicator species in each population varied, with some overlap occurring across Alberta, South Dakota, and Colorado. There was no overlap in indicator species between the southern-most and northern-most populations (Table 2).
Table 4.
Pairwise population comparisons of total mite species richness per beetle.
3.2. Partitioning Compositional Differences Using Measures of Beta Diversity
The mite assemblages associated with the five bark beetle populations differed geographically based on the presence and absence of species and their relative abundances (Table 5; LRT = 7159; p = 0.001). Tarsonemus endophloeus was present in mid-latitude populations (Utah, Colorado, and South Dakota), with highest abundances in South Dakota and Colorado. Tarsonemus endophloeus was rare in Utah and absent from the southernmost (Arizona) and northernmost (Alberta) populations in our study (Figure 5; Table 2). Dendrolaelaps quadrisetus Berlese was found only in Arizona and Utah; however, these were captured in 2016 and not in 2017. Trichouropoda utahensis Hirschmann and Wisniewski, in particular, was unique to middle and southern mountain pine beetle populations from Utah, Arizona, and in Colorado (where T. maeandralis Hirschmann also was found). It is also indicative of Utah where it was most abundant (Figure 5; Table 2). Mites in the genus Trichouropoda are not reported in Alberta in our study location; however, they have been observed on mountain pine beetles from the southwest of the province near Banff National Park [56]. Some rare species, which include Histiogaster arborsignis Woodring, Nanacarus sp., and Parawinterschmidtia sp., were captured in very low numbers.
Table 5.
(A) Multivariate test statistic showing likelihood ratio test (LRT) values for population effect on mite composition based on the presence/absence of species and abundances where Df = degrees of freedom; (B) Wald test statistics for population differences shown in (A); (C) LRT for differences in mite species across all populations. Asterisk (*) shows significance at p ≤ 0.05.
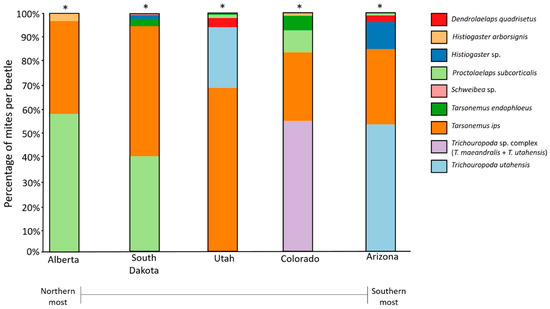
Figure 5.
Mite assemblages shown as percentage of each mite species (excluding extremely rare species) sampled across five populations. Asterisk (*) indicates significantly different assemblages between populations (for full statistics, see Table 5).
Differences in mite composition between populations can be further explained by measures of nestedness and turnover (species replacement). On a scale of 0–1 where 1 = complete dissimilarity, the total dissimilarity in mite composition (βsor) across populations was 0.54. The majority of dissimilarity resulted from turnover (βsim) which explained 0.43 of the total dissimilarity, while nestedness (βsne) accounted for 0.114 of the total dissimilarity.
The highest rates of turnover occurred between the southernmost beetle populations (Arizona and Utah) and the other populations, particularly Alberta (Figure 6a). High rates of turnover were also seen between southern-most population (Arizona) and each of the mid-latitude populations (Colorado and South Dakota) as well as between the northernmost population (Alberta) and the mid-latitude populations (Figure 6a). The mite assemblages of Arizona and Utah were completely nested, i.e., the mites found in Utah were a subset of those found in Arizona. Alberta mite assemblages were a subset of those found in South Dakota and other middle populations (Figure 6a,b).
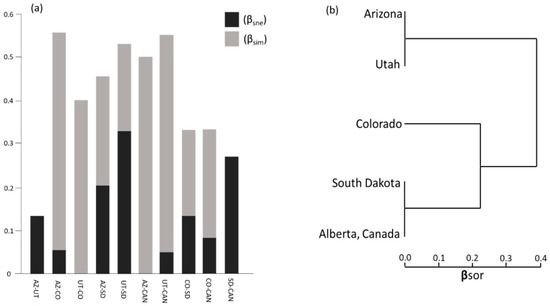
Figure 6.
(a) Sorenson dissimilarity indices of Beta (β) diversity for mite communities partitioned into nestedness (βsne) and turnover (βsim) from southern-most (Arizona [AZ]) to northern-most (Alberta, Canada [CAN]) sampled populations; (b) cluster dendrogram showing degree of nestedness based on overall dissimilarity (βsor).
4. Discussion
Geographically distant mountain pine beetle populations have different symbiotic mite assemblages despite some commonalities reflected in species overlap. Sorenson’s dissimilarity values for beta diversity indicate that the mite assemblage of beetle populations geographically closer to one another are more similar than populations that are geographically more distant. This was most evident between Alberta and all other populations. Turnover and nestedness patterns varied although species richness did not show any significant variability across populations.
4.1. Differences in Species Richness and Abundance
No significant differences were detected in mite species richness, presumably because richness per beetle was generally very low for all populations. Species accumulation curves approached asymptote in all populations (although not at the same rates), indicating that our sampling efforts adequately captured the overall mite richness associated with these populations. However, the disparities in species accumulation curves between populations may also be due to the possible presence of cryptic species that could not be uncovered. The number of mites per beetle (mite load) did not vary on a latitudinal gradient (as predicted), suggesting that other factors may better explain these differences. We observed that post-outbreak and ‘endemic’ stage populations had higher mite abundances, and observably higher total richness (Table 2) suggesting that mite loads may be indicative of beetle population phase. Hofstetter, et al. [57] show that higher mite loads dominated by Tarsonemus mites correlated with decreased beetle progeny densities because of mite introduction of antagonistic blue-stain fungi. While our sampling efforts could not test particular hypotheses, our observed mite load trends may provide insight on population specific ecological dynamics in mountain pine beetles. High mite loads can affect beetle flight [27,33] or influence their reproductive success within trees [58]. The specific effects of different mite levels on mountain pine beetles has not been tested. Our analysis of mite community patterns provides a foundational step towards understanding these effects.
The finding that Tarsonemus ips and Proctolaelaps subcorticalis occurred in all populations suggests that these mites may not be affected by latitude, pine tree host, climate, or beetle population stage. Trichourpoda utahensis was only found in Arizona and Utah; and although also found in Colorado, occurred alongside a second Trichouropoda species, T. maeandralis (which was not the case for Arizona and Utah). Trichouropoda mites carry fungi that differ from the mutualistic fungi carried by the mountain pine beetles, and its relationship with collapsing beetle population has been suggested [16].
4.2. Beta Diversity Patterns
As expected, populations relatively closer together shared more species between them than those geographically distant. High nestedness at these sites may indicate a low overall phoretic mite biodiversity [59]. Utah and Arizona (and likewise South Dakota and Alberta) showed nested patterns where mite species were likely removed rather than replaced. This could be due to the large latitudinal and subsequent climate shift between these populations resulting in loss of species with changes in local climate.
High rates of species turnover are explained by environmental differences causing some species to be replaced by others more suited to the new environment [60]. Although not specifically tested in this study, we hypothesize that environmental filtering, specifically temperature, serves as a likely explanation for differences in mite community assemblages across latitude. Beta diversity patterns driven by turnover are associated with temperature seasonality, which may be experienced across a latitudinal gradient [61]. Other complementary abiotic factors may contribute to high levels of turnover, particularly dispersal ability. Hill, et al. [62], showed that spatial patterns and environmental heterogeneity play a large role in explaining high levels of dissimilarity [in community assemblage] among sites in passively transported invertebrates and are better explained by increased turnover. However, dispersal limitations are often defined for arthropods by temperature [63], which may be the ultimate driver of the latitudinal patterns.
Differences in host tree species may also help explain mite composition patterns across bark beetle populations. Our data analysis could not accommodate testing for differences in mite composition by host tree because host tree and location are confounding factors except for South Dakota and Colorado which shared the same host tree species (Table 1), and beetles collected via flight traps may come from a variety of tree species. Fungal symbiota associated with the mountain pine beetle induce different secondary chemical responses in different host tree species which may contribute to the tree’s attractiveness as a host environment for the beetle and its associates [64,65]. In our study, although Colorado and South Dakota populations shared the same host (Pinus ponderosa), the overall mite compositions associated with these populations differed significantly. However, it should be noted that sampling years varied. However, these two populations did differ in their beetle population stage—Colorado was a collapsing population from an epidemic while the South Dakota population was increasing to epidemic status. Vissa et al. [35] reported vastly different mite loads associated with beetles attacking two different tree species within a single region in Portugal, suggesting that dominant host tree type can also affect beetle-associated mite abundances. Here we found that the population from limber pine (Utah) had beetles with the greatest mite loads. Tree genotype has also been shown to drive different defense production, insect preference, and long-term population dynamics [66,67].
Temperature affects patterns in species diversity across latitudinal gradients [68]. Our colder population of Alberta had the lowest mite diversity while the others, similarly warmer populations, had contrasting higher mite diversities. Evans, et al. [69] showed that a Trichouropoda sp. associated with the southern pine beetle had the highest reproductive success in warmer temperatures. This was reflected in our results where populations with higher average minimum and maximum temperatures also had more mites per beetle. Species of Trichouropoda were also absent in Alberta but prevalent in Colorado, Utah, and Arizona, where both temperature and precipitation were higher during development years; however, this may be confounded with the population stages in these populations.
4.3. Implications for Shifts in Functional Groups of Mites
The concept of environmental filtering in symbiotic mite communities associated with bark beetle systems is not well explored. Swenson et al. [70] hypothesized that abiotic (i.e., environmental) filtering not only alters species assemblages in plants, but also alters the functional diversity. Thus, in climatically ‘extreme’ regions, not only are there fewer species [70], but the functional groups can be altered as well [71]. While we were unable to identify specific shifts in the functional groups of mites, the observed compositional differences may contain vital information on the resulting functional shifts.
High taxonomic turnover does not directly translate to a significant functional turnover [72]. Fish faunas with high taxonomic beta diversity were associated with low functional beta diversity, suggesting that although species assemblages varied, they maintained shared functional attributes [72]. Our methods were unable to tease apart the functional diversity patterns associated with symbiotic mite populations or allow us to specifically identify which mite species are being replaced and by whom; however, we did observe some uniformity in the abundant functional groups across all populations. Fungivores (particularly Tarsonemus mites) were abundant in each epidemic population, followed by a generalist predator (P. subcorticalis), suggesting that these species likely affect beetle population dynamics (either by promoting the spread of fungi or by direct predation).
5. Conclusions
To our knowledge, this is the first study to examine and partition the differences in the beta diversity of symbiotic mite communities associated with an economically important North American bark beetle (the mountain pine beetle) across a wide range of its distribution; and may serve as a model system for estimating diversity patterns of symbiota associated with other major insect pests in pine forest systems. As anticipated, the composition of mite biodiversity associated with mountain pine beetles varied geographically although no mite assemblage was entirely unique, and environmental differences driven by geography can best explain these differences. Our assessment of mite species composition patterns provides foundational information for further steps to identifying key species interactions shaping forest insect systems.
Author Contributions
Corresponding author S.V., R.W.H. and D.A.U. contributed significantly to the conceptualization, mite collection, sample processing and editorial process of this manuscript. D.A.U. additionally provided significant assistance in statistical analyses. Authors D.M., J.E.M., and B.A.M. conducted extensive sampling and mite data processing for South Dakota, Colorado, and Alberta respectively; and also actively contributed to the written materials in this manuscript. Author W.K. served as the primary identification resource for mite data in this manuscript and also contributed as a manuscript editor. Finally, author M.L.E. conceptualized experimental design of the Canadian component, provided some editorial help, and facilitated the Canadian research work by obtaining the necessary funding. All authors have reviewed this manuscript in its entirety and approve of its submission. All authors have read and agreed to the published version of the manuscript.
Funding
The Canadian component of this manuscript was largely funded by the National Science and Engineering Research Council (NSERC) Discovery Grant.
Acknowledgments
We would additionally like to acknowledge the contributions of the following organizations, researchers, technical support individuals: The United States Department of Agriculture (USDA)/Forest Service (FS) and Rocky Mountain Research Stations (RMRS), Northern Arizona University (NAU), Utah State University, Black Hills National Forest, Alberta Agriculture and Forestry, John Moser, Elizabeth Alden, David Soderberg, Devin Letourneau, Pam Melnick, Jeffrey Mallete, Madison Martz, Karis Miller and Roy St. Laurent (NAU Statistical Consulting Lab). We additionally thank Heather Proctor, University of Alberta for her assistance with mite identifications and for editing.
Conflicts of Interest
The authors declare no conflict of interest.
References
- Hart, S.J.; Veblen, T.T.; Schneider, D.; Molotch, N.P. Summer and winter drought drive the initiation and spread of spruce beetle outbreak. Ecology 2017, 98, 2698–2707. [Google Scholar] [CrossRef] [PubMed]
- Biedermann, P.H.; Müller, J.; Grégoire, J.C.; Gruppe, A.; Hagge, J.; Hammerbacher, A.; Hofstetter, R.W.; Kandasamy, D.; Kolarik, M.; Kostovcik, M.; et al. Bark beetle population dynamics in the Anthropocene: Challenges and solutions. Trends Ecol. Evol. 2019, 34, 914–924. [Google Scholar] [CrossRef]
- De Groot, M.; Ogris, N. Short-term forecasting of bark beetle outbreaks on two economically important conifer tree species. For. Ecol. Manag. 2019, 450, e117495. [Google Scholar] [CrossRef]
- Raffa, K.F.; Aukema, B.H.; Bentz, B.J.; Carroll, A.L.; Hicke, J.A.; Turner, M.G.; Romme, W.H. Cross-scale drivers of natural disturbances prone to anthropogenic amplification: The dynamics of bark beetle eruptions. BioScience 2008, 58, 501–517. [Google Scholar] [CrossRef]
- Bentz, B.J.; Régnière, J.; Fettig, C.J.; Hansen, M.E.; Hayes, J.L.; Hicke, J.A.; Kelsey, R.G.; Negrón, J.F.; Seybold, S.J. Climate change and bark beetles of the western United States and Canada: Direct and indirect effects. BioScience 2010, 60, 601–613. [Google Scholar] [CrossRef]
- Bentz, B.J.; Bracewell, R.R.; Mock, K.E.; Pfrender, M.E. Genetic architecture and phenotypic plasticity of thermally-regulated traits in an eruptive species, Dendroctonus ponderosae. Evol. Ecol. 2011, 25, 1269–1288. [Google Scholar] [CrossRef]
- Cullingham, C.I.; Cooke, J.E.K.; Dang, S.; Davis, C.S.; Cooke, B.J.; Coltman, D.W. Mountain pine beetle host-range expansion threatens the boreal forest. Mol. Ecol. 2011, 20, 2157–2171. [Google Scholar] [CrossRef] [PubMed]
- Raffa, K.F.; Powell, E.N.; Townsend, P.A. Temperature-driven range expansion of an irruptive insect heightened by weakly coevolved plan defenses. Proc. Natl. Acad. Sci. USA 2013, 110, 2193–2198. [Google Scholar] [CrossRef]
- Wood, S.L. The bark and ambrosia beetles of North and Central America (Coleoptera: Scolytinae), a taxonomic monograph. Great Basin Nat. Mem. 1982, 6, 1–1356. [Google Scholar]
- Rosenberger, D.W.; Venette, R.C.; Maddox, M.P.; Aukema, B.H. Colonization behaviors of mountain pine beetle on novel hosts: Implications for range expansion into northeastern North America. PLoS ONE 2017, 12, e0176269. [Google Scholar] [CrossRef]
- Reid, R.W. Biology of the mountain pine beetle, Dendroctonus monticolae Hopkins, in the east Kootenay region of British Columbia, I. Life cycle, brood development, and flight periods. Can. Entomol. 1962, 94, 531–538. [Google Scholar] [CrossRef]
- Amman, G.D.; McGregor, M.D.; Dolph, R.E. Reprinted. (Updated 2002). Mountain pine beetle. USDA Forest Service. For. Insect Dis. Leafl. 1990, 2, 1–12. [Google Scholar]
- Six, D.L.; Bracewell, R. Dendroctonus. Bark Beetle; Elsevier: Amsterdam, The Netherlands, 2015; pp. 305–350. [Google Scholar]
- Hofstetter, R.W.; Dinkins-Bookwalter, J.; Davis, T.S.; Klepzig, K.D. Symbiotic associations of bark beetles. Bark Beetles; Elsevier: Amsterdam, The Netherlands, 2015; pp. 209–245. [Google Scholar]
- Vissa, S.; Hofstetter, R.W. The role of mites in bark and ambrosia beetle–fungal interactions. In Insect Physiology and Ecology; Intech Press: London, UK, 2017; pp. 135–156. [Google Scholar]
- Mercado, J.; Ortiz-Santana, B.; Kay, S. Fungal Frequency and Mite Load Trends Interact with a Declining Mountain Pine Beetle Population. Forests 2018, 9, 484. [Google Scholar] [CrossRef]
- Six, D.L.; Paine, T.D. Effects of Mycangial Fungi and Host Tree Species on Progeny Survival and Emergence of Dendroctonus ponderosae (Coleoptera: Scolytidae). Environ. Entomol. 1998, 27, 1393–1401. [Google Scholar] [CrossRef]
- Mock, K.E.; Bentz, B.J.; O’Neill, E.M.; Chong, J.P.; Orwin, J.; Pfrender, M.E. Landscape-scale genetic variation in a forest outbreak species, the mountain pine beetle (Dendroctonus ponderosae). Mol. Ecol. 2007, 16, 553–568. [Google Scholar] [CrossRef] [PubMed]
- Hunt, D.W.A.; Borden, J.H.; Rahe, J.E.; Whitney, H.S. Nutrient-mediated germination of Beauveria bassiana conidia on the integument of the bark beetle Dendroctonus ponderosae (Coleoptera: Scolytidae). J. Invertebr. Pathol. 1984, 44, 304–314. [Google Scholar] [CrossRef]
- Wegensteiner, R. Pathogens in bark beetles. In Bark and Wood Boring Insects in Living Trees in Europe: A Synthesis; Springer: Dordrecht, The Netherlands, 2007; pp. 291–313. [Google Scholar]
- Mercado, J.E.; Hofstetter, R.W.; Reboletti, D.M.; Negro, F. Phoretic symbionts of the mountain pine beetle (Dendroctonus ponderosae Hopkins). For. Sci. 2014, 60, 512–526. [Google Scholar] [CrossRef]
- Klepzig, K.D.; Moser, J.C.; Lombardero, F.J.; Hofstetter, R.W.; Ayres, M.P. Symbiosis and competition: Complex interactions among beetles, fungi, and mites. Symbiosis 2001, 30, 83–96. [Google Scholar]
- Cardoza, Y.J.; Moser, J.C.; Klepzig, K.D.; Raffa, K.F. Multipartite symbioses among fungi, mites, nematodes, and the spruce beetle, Dendroctonus rufipennis. Environ. Entomol. 2008, 37, 956–963. [Google Scholar] [CrossRef]
- Knee, W.; Beaulieu, F.; Skevington, J.H.; Kelso, S.; Cognato, A.I.; Forbes, M.R. Species boundaries and host range of tortoise mites (Uropodoidea) phoretic on bark beetles (Scolytinae), using morphometric and molecular markers. PLoS ONE 2012, 7, e47243. [Google Scholar] [CrossRef]
- Knee, W.; Beaulieu, F.; Skevington, J.H.; Kelso, S.; Forbes, M.R. Cryptic species of mites (Uropodoidea: Uroobovella spp.) associated with burying beetles (Silphidae: Nicrophorus): The collapse of a host generalist revealed by molecular and morphological analyses. Mol. Phylogenet. Evol. 2012, 65, 276–286. [Google Scholar] [CrossRef]
- Moser, J.C. Mite predators of the southern pine beetle. Ann. Entomol. Soc. Am. 1975, 68, 1113–1116. [Google Scholar] [CrossRef]
- Moser, J.C. Phoretic carrying capacity of flying southern pine beetles (Coleoptera: Scolytidae). Can. Entomol. 1976, 108, 807–808. [Google Scholar] [CrossRef]
- Moser, J.C. Use of sporothecae by phoretic Tarsonemus mites to transport ascospores of coniferous bluestain fungi. Trans. Br. Mycol. Soc. 1985, 84, 750–753. [Google Scholar] [CrossRef]
- Hofstetter, R.W.; Moser, J.; Blomquist, S. Mites associated with bark beetles and their hyperphoretic ophiostomatoid fungi. Biodivers. Ser. 2014, 12, 165–176. [Google Scholar]
- Moser, J.C.; Perry, T.J.; Solheim, H. Ascospores hyperphoretic on mites associated with Ips typographus. Mycol. Res. 1989, 93, 513–517. [Google Scholar] [CrossRef]
- Moser, J.C.; Konrad, H.; Blomquist, S.R.; Kirisits, T. Do mites phoretic on elm bark beetles contribute to the transmission of Dutch elm disease? Naturwissenschaften 2010, 97, 219–227. [Google Scholar] [CrossRef]
- Lindquist, E.E. New species of Tarsonemus (Acarina: Tarsonemidae) associated with bark beetles. Can. Entomol. 1969, 101, 1219–1314. [Google Scholar] [CrossRef]
- Kinn, D.; Witcosky, J. Variation in southern pine beetle attack height associated with phoretic Uropodid mites. Can. Entomol. 1978, 110, 249–251. [Google Scholar] [CrossRef]
- Wilson, D.S.; Knollenberg, W.G. Adaptive indirect effects: The fitness of burying beetles with and without their phoretic mites. Evol. Ecol. 1987, 1, 139–159. [Google Scholar] [CrossRef]
- Vissa, S.; Hofstetter, R.W.; Bonifácio, L.; Khaustov, A.; Knee, W.; Uhey, D.A. Phoretic mite communities associated with bark beetles in the maritime and stone pine forests of Setúbal, Portugal. Exp. Appl. Acarol. 2019, 77, 117–131. [Google Scholar] [CrossRef] [PubMed]
- Lombardero, Â.J.; Klepzig, K.D.; Moser, J.C.; Ayres, M.P. Biology, demography and community interactions of Tarsonemus (Acarina: Tarsonemidae) mites phoretic on Dendroctonus frontalis (Coleoptera: Scolytidae). Agric. For. Entomol. 2001, 2, 193–202. [Google Scholar] [CrossRef]
- Lombardero, M.J.; Ayres, M.P.; Hofstetter, R.W.; Moser, J.C.; Klepzig, K.D. Strong indirect interactions of Tarsonemus mites (Acarina: Tarsonemidae) and Dendroctonus frontalis (Coleoptera: Scolytidae). Oikos 2003, 102, 243–252. [Google Scholar] [CrossRef]
- Hofstetter, R.W.; Dempsey, T.D.; Klepzig, K.D.; Ayres, M.P. Temperature-dependent effects on mutualistic and phoretic associations. Community Ecol. 2007, 8, 47–56. [Google Scholar] [CrossRef]
- Walter, D.E.; Proctor, H.C. Mites on plants. In Mites: Ecology, Evolution & Behavior; Springer: Dordrecht, The Netherlands, 2013; pp. 281–339. [Google Scholar]
- Walter, D.E.; Proctor, H.C. Mites: Ecology, Evolution and Behaviour; CABI Publishing: Wallingford, UK, 1999; pp. 52–55. [Google Scholar]
- Hofstetter, R.W.; Moser, J.C. The role of mites in insect-fungus associations. Ann. Rev. Entomol. 2014, 59, 537–557. [Google Scholar] [CrossRef] [PubMed]
- Mori, B.A.; Proctor, H.C.; Walter, D.E.; Evenden, M.L. Phoretic mite associates of mountain pine beetle at the leading edge of an infestation in northwestern Alberta, Canada. Can. Entomol. 2011, 143, 44–55. [Google Scholar] [CrossRef]
- Lindgren, B.S. A multiple funnel trap for scolytid beetles (Coleoptera). Can. Entomol. 1983, 115, 299–302. [Google Scholar] [CrossRef]
- Reboletti, D.M. A Multi-Partite Mutualism: Bark Beetles, Fungi, and Mites. Ph.D. Thesis, Northern Arizona University, Flagstaff, AZ, USA, 2008. [Google Scholar]
- Davis, T.S.; Hofstetter, R.W. The effects of gallery density and ratio on the fitness and fecundity of two sympatric bark beetles. Environ. Entomol. 2009, 38, 639–650. [Google Scholar] [CrossRef]
- PRISM Climate Group, Oregon State University. Available online: http://prism.oregonstate.edu (accessed on 31 August 2020).
- Canada’s Changing Climate Report. Natural Resources Canada, Government of Canada, 2019. Available online: https://www.nrcan.gc.ca/maps-tools-publications/publications/climate-change-publications/canada-changing-climate-reports/canadas-changing-climate-report/21177 (accessed on 31 August 2020).
- Oksanen, J.; Kindt, R.; Legendre, P.; O’Hara, B.; Stevens, M.H.H.; Oksanen, M.J.; Suggests, M.A.S.S. The vegan package. Community Ecol. Package 2007, 10, 719. [Google Scholar]
- Venables, W.N.; Ripley, B.D. Exploratory multivariate analysis. In Modern Applied Statistics with S; Springer: New York, NY, USA, 2002; pp. 301–330. [Google Scholar]
- Wang, Y.I.; Naumann, U.; Wright, S.T.; Warton, D.I. mvabund–an R package for model-based analysis of multivariate abundance data. Methods Ecol. Evol. 2012, 3, 471–474. [Google Scholar] [CrossRef]
- Akaike, H. Maximum likelihood identification of Gaussian autoregressive moving average models. Biometrika 1973, 60, 255–265. [Google Scholar] [CrossRef]
- Baselga, A. Partitioning abundance-based multiple-site dissimilarity into components: Balanced variation in abundance and abundance gradients. Methods Ecol. Evol 2017, 7, 799–808. [Google Scholar] [CrossRef]
- Baselga, A.; Orme, C.D.L. Betapart: An R package for the study of beta diversity. Methods Ecol. Evol. 2012, 3, 808–812. [Google Scholar] [CrossRef]
- Cáceres, M.D.; Legendre, P. Associations between species and groups of sites: Indices and statistical inference. Ecology 2009, 90, 3566–3574. [Google Scholar] [CrossRef]
- McCune, B.; Grace, J.B. Analysis of Ecological Communities; MjM Software: Gleneden Beach, OR, USA, 2002. [Google Scholar]
- Peralta Vázquez, G.H. Ecology of Mite Phoresy on Mountain Pine Beetles. Ph.D. Thesis, University of Calgary, Calgary, AB, Canada, 2018. [Google Scholar]
- Hofstetter, R.W.; Cronin, J.T.; Klepzig, K.D.; Moser, J.C.; Matthew, A.E.; Ayres, P. Antagonisms, mutualisms and commensalisms affect outbreak dynamics of the southern pine beetle. Oecologia 2006, 147, 679–691. [Google Scholar] [CrossRef]
- Pfammatter, J.A.; Malas, K.M.; Raffa, K.F. Behaviours of phoretic mites (Acari) associated with Ips pini and Ips grandicollis (Coleoptera: Curculionidae) during host-tree colonization. Agric. For. Entomol. 2016, 18, 108–118. [Google Scholar] [CrossRef]
- Wright, D.H.; Reeves, J.H. On the meaning and measurement of nestedness of species assemblages. Oecologia 1992, 92, 416–428. [Google Scholar] [CrossRef]
- Brown, J.H.; Ernest, S.K.M.; Parody, J.M.; Haskell, J.P. Regulation of diversity: Maintenance of species richness in changing environments. Oecologia 2001, 126, 321–332. [Google Scholar] [CrossRef]
- Archibald, S.B.; Greenwood, D.R.; Mathewes, R.W. Seasonality, montane beta diversity, and Eocene insects: Testing Janzen’s dispersal hypothesis in an equable world. Palaeogeogr. Palaeoclimatol. Palaeoecol. 2013, 371, 1–8. [Google Scholar] [CrossRef]
- Hill, M.J.; Heino, J.; Thornhill, I.; Ryves, D.B.; Wood, P.J. Effects of dispersal mode on the environmental and spatial correlates of nestedness and species turnover in pond communities. Oikos 2017, 126, 1575–1585. [Google Scholar] [CrossRef]
- Bradshaw, W.E.; Holzapfel, C.M. Genetic response to rapid climate change. Mol. Ecol. 2008, 17, 157–166. [Google Scholar] [CrossRef] [PubMed]
- Jost, R.W.; Rice, A.V.; Langor, D.W.; Boluk, Y. Monoterpene emissions from lodgepole and jack pine bark inoculated with mountain pine beetle-associated fungi. J. Wood Chem. Technol. 2008, 28, 37–46. [Google Scholar] [CrossRef]
- Arango-Velez, A.; El Kayal, W.; Copeland, C.C.J.; Zaharia, L.I.; Lusebrink, I.; Cooke, J.E.K. Differences in defence responses of Pinus contorta and Pinus banksiana to the mountain pine beetle fungal associate Grosmannia clavigera are affected by water deficit. Plant Cell Environ. 2016, 39, 726–744. [Google Scholar] [CrossRef]
- Holeski, L.M.; Hillstrom, M.L.; Whitham, T.G.; Lindroth, R.L. Relative importance of genetic, ontogenetic, induction, and seasonal variation in producing a multivariate defense phenotype in a foundation tree species. Oecologia 2012, 170, 695–707. [Google Scholar] [CrossRef] [PubMed]
- McIntyre, P.J.; Whitham, T.G. Plant genotype affects long-term herbivore population dynamics and extinction: Conservation implications. Ecology 2003, 84, 311–322. [Google Scholar] [CrossRef]
- Mittelbach, G.G.; Schemske, D.W.; Cornell, H.V.; Allen, A.P.; Brown, J.M.; Bush, M.B.; Harrison, S.P.; Hurlbert, A.H.; Knowlton, N.; Lessios, H.A.; et al. Evolution and the latitudinal diversity gradient: Speciation, extinction and biogeography. Ecol. Lett. 2007, 10, 315–331. [Google Scholar] [CrossRef]
- Evans, L.M.; Hofstetter, R.W.; Ayres, M.P.; Klepzig, K.D. Temperature alters the relative abundance and population growth rates of species within the Dendroctonus frontalis (Coleoptera: Curculionidae) community. Environ. Entomol. 2011, 40, 824–834. [Google Scholar] [CrossRef]
- Swenson, N.G.; Enquist, B.J.; Pither, J.; Kerkhoff, A.J.; Boyle, B.; Weiser, M.D.; Elser, J.J.; Fagan, W.F.; Forero-Montaña, J.; Fyllas, N.; et al. The biogeography and filtering of woody plant functional diversity in North and South America. Glob. Ecol. Biogeogr. 2012, 21, 798–808. [Google Scholar] [CrossRef]
- Flores, O.; Seoane, J.; Hevia, V.; Azcárate, F.M. Spatial patterns of species richness and nestedness in ant assemblages along an elevational gradient in a Mediterranean mountain range. PLoS ONE 2018, 13, e0204787. [Google Scholar] [CrossRef]
- Villéger, S.; Grenouillet, G.; Brosse, S. Decomposing functional β-diversity reveals that low functional β-diversity is driven by low functional turnover in European fish assemblages. Glob. Ecol. 2013, 22, 671–681. [Google Scholar] [CrossRef]


Publisher’s Note: MDPI stays neutral with regard to jurisdictional claims in published maps and institutional affiliations. |
© 2020 by the authors. Licensee MDPI, Basel, Switzerland. This article is an open access article distributed under the terms and conditions of the Creative Commons Attribution (CC BY) license (http://creativecommons.org/licenses/by/4.0/).