1. Introduction
Boreal fires are necessary for a healthy ecosystem yet a hazard to humans when uncontrolled [
1]. Wildland fires in Alaska are characterized by a relatively small number of large wildfires ignited by lightning in remote areas [
2]. This results in large year-to-year variability in area burned, dominated by individual years with extremely large totals. The number of years where total area burned exceeds statistical norms has increased in frequency and impact in recent years [
3]. The 2015 season burned more than 2 million hectares in Alaska and has been attributed to anthropogenic climate change [
4]. Future projections suggest that the frequency of large fires will continue to increase [
5,
6,
7]. The vast boreal forests, with stand-replacing crown fires, dominate both the ecological backdrop and impact of wildfires in Alaska, though wildfire effects in Arctic tundra appear to be increasing as well [
8,
9]. During a busy fire season, limited firefighting resources force difficult decisions on a day-to-day basis. Anticipating current and future needs for those resources requires reliable assessments of wildfire potential aided by analysis of changes in landscape flammability.
Fire danger is rated on daily to seasonal timescales using a variety of indices constructed from meteorological data. These indices characterize the likelihood and anticipated hazards of wildfire and are used operationally to help fire managers assess risks to threatened values and prioritize the response. Different “fire management” systems are used in different locations. In the contiguous US, the National Fire-Danger Rating System (NFDRS) [
10,
11,
12] is the primary tool used by managers. The Fire Weather Index (FWI) system [
13], which is a component of the Canadian Forest Fire Danger Rating System (CFFDRS) [
14] is used by fire managers in Canada, Alaska, and around the world. The FWI rates day-to-day changes in wildfire potential, specifically developed for boreal ecosystems. The necessary inputs are fewer for the FWI than the NFDRS [
15], making FWI more manageable in data-sparse areas like Alaska. For more than 25 years, Alaska wildland fire management organizations have used the FWI system [
12] for rating day-to-day changes in wildfire potential. With general satisfaction among the fire management community, there has been little interest in replacing the system as the primary fire potential assessment tool. Given the notable ongoing and projected changes in the Arctic and subarctic environment that impact fire activity and operations, a broader set of tools would serve the fire management community.
Numerous studies have compared the different fire danger rating systems for their specific uses. Mölders [
15] evaluated the sensitivity of FWI and NFDRS to errors in numerical weather data forcing over Interior Alaska for the summer of 2005 and concluded that both sets of indices performed adequately. Lee et al. [
9] compared four systems used in Canada and found that each system performs well at different tasks, and all contribute useful information for management decisions. Vajda et al. [
10] compared the Finnish Forest Fire Index (FFI) to the FWI over Finland. They concluded that both indices performed similarly over southern and central Finland, but the FWI identified more high-danger incidents than FFI in northern Finland. These studies demonstrate the utility of comparing indices in specific locations and were a motivating factor for this study for Alaska to compare 13 indices of flammability over multiple years.
Comparisons of indices are not always straightforward because indices have different ranges that require normalization, and indices can be constructed using different parameters. Comparisons are particularly useful when new meteorological data streams become available and are compatible with a broader set of indices. It is incumbent on fire managers and their research partners to evaluate new science and models that may be improvements on traditional wildfire potential assessment tools.
In the current study, observation-based downscaled data on a 20 km grid [
16] were used to evaluate two drought assessment indices: the Evaporative Demand Drought Index (EDDI) [
17] and the Standardized Precipitation Evapotranspiration Index (SPEI) [
18]. This study will provide an opportunity to compare these drought assessment products with those designed specifically for wildland fire applicability. Evaluation of the corresponding National Fire Danger Rating System (NFDRS) components and indices was not attempted in this study due to the lack of an available code base [
19]. However, among NFDRS intermediate outputs, Vapor Pressure Deficit (VPD) can be calculated from the available station data and has been included in this assessment because of its increasing popularity in fire potential assessments [
20,
21].
With increasing accessibility of atmospheric or environmental variables from gridded reanalysis histories and forecast models, new representations of weather and climate phenomena are being rolled out as alert systems for many concerns of human interest, including wildland fire potential. This study utilizes some of these advancements in the Alaska context. In all, 13 different fire indices were compared to determine which best indicate changing landscape flammability and significant fire activity for Alaska. This analysis uses a suite of meteorological observations to construct indicators of fire danger (i.e., FWI, EDDI, SPEI, and VPD) and evaluates these indices using the thermal anomaly detection from the Moderate Resolution Imaging Spectroradiometer (MODIS) Active Fire Product [
22]. These MODIS detections represent the days, locations, and sizes of significant fire events responsible for the area burned in Alaska [
23].
2. Materials and Methods
2.1. Predictive Service Areas in Alaska
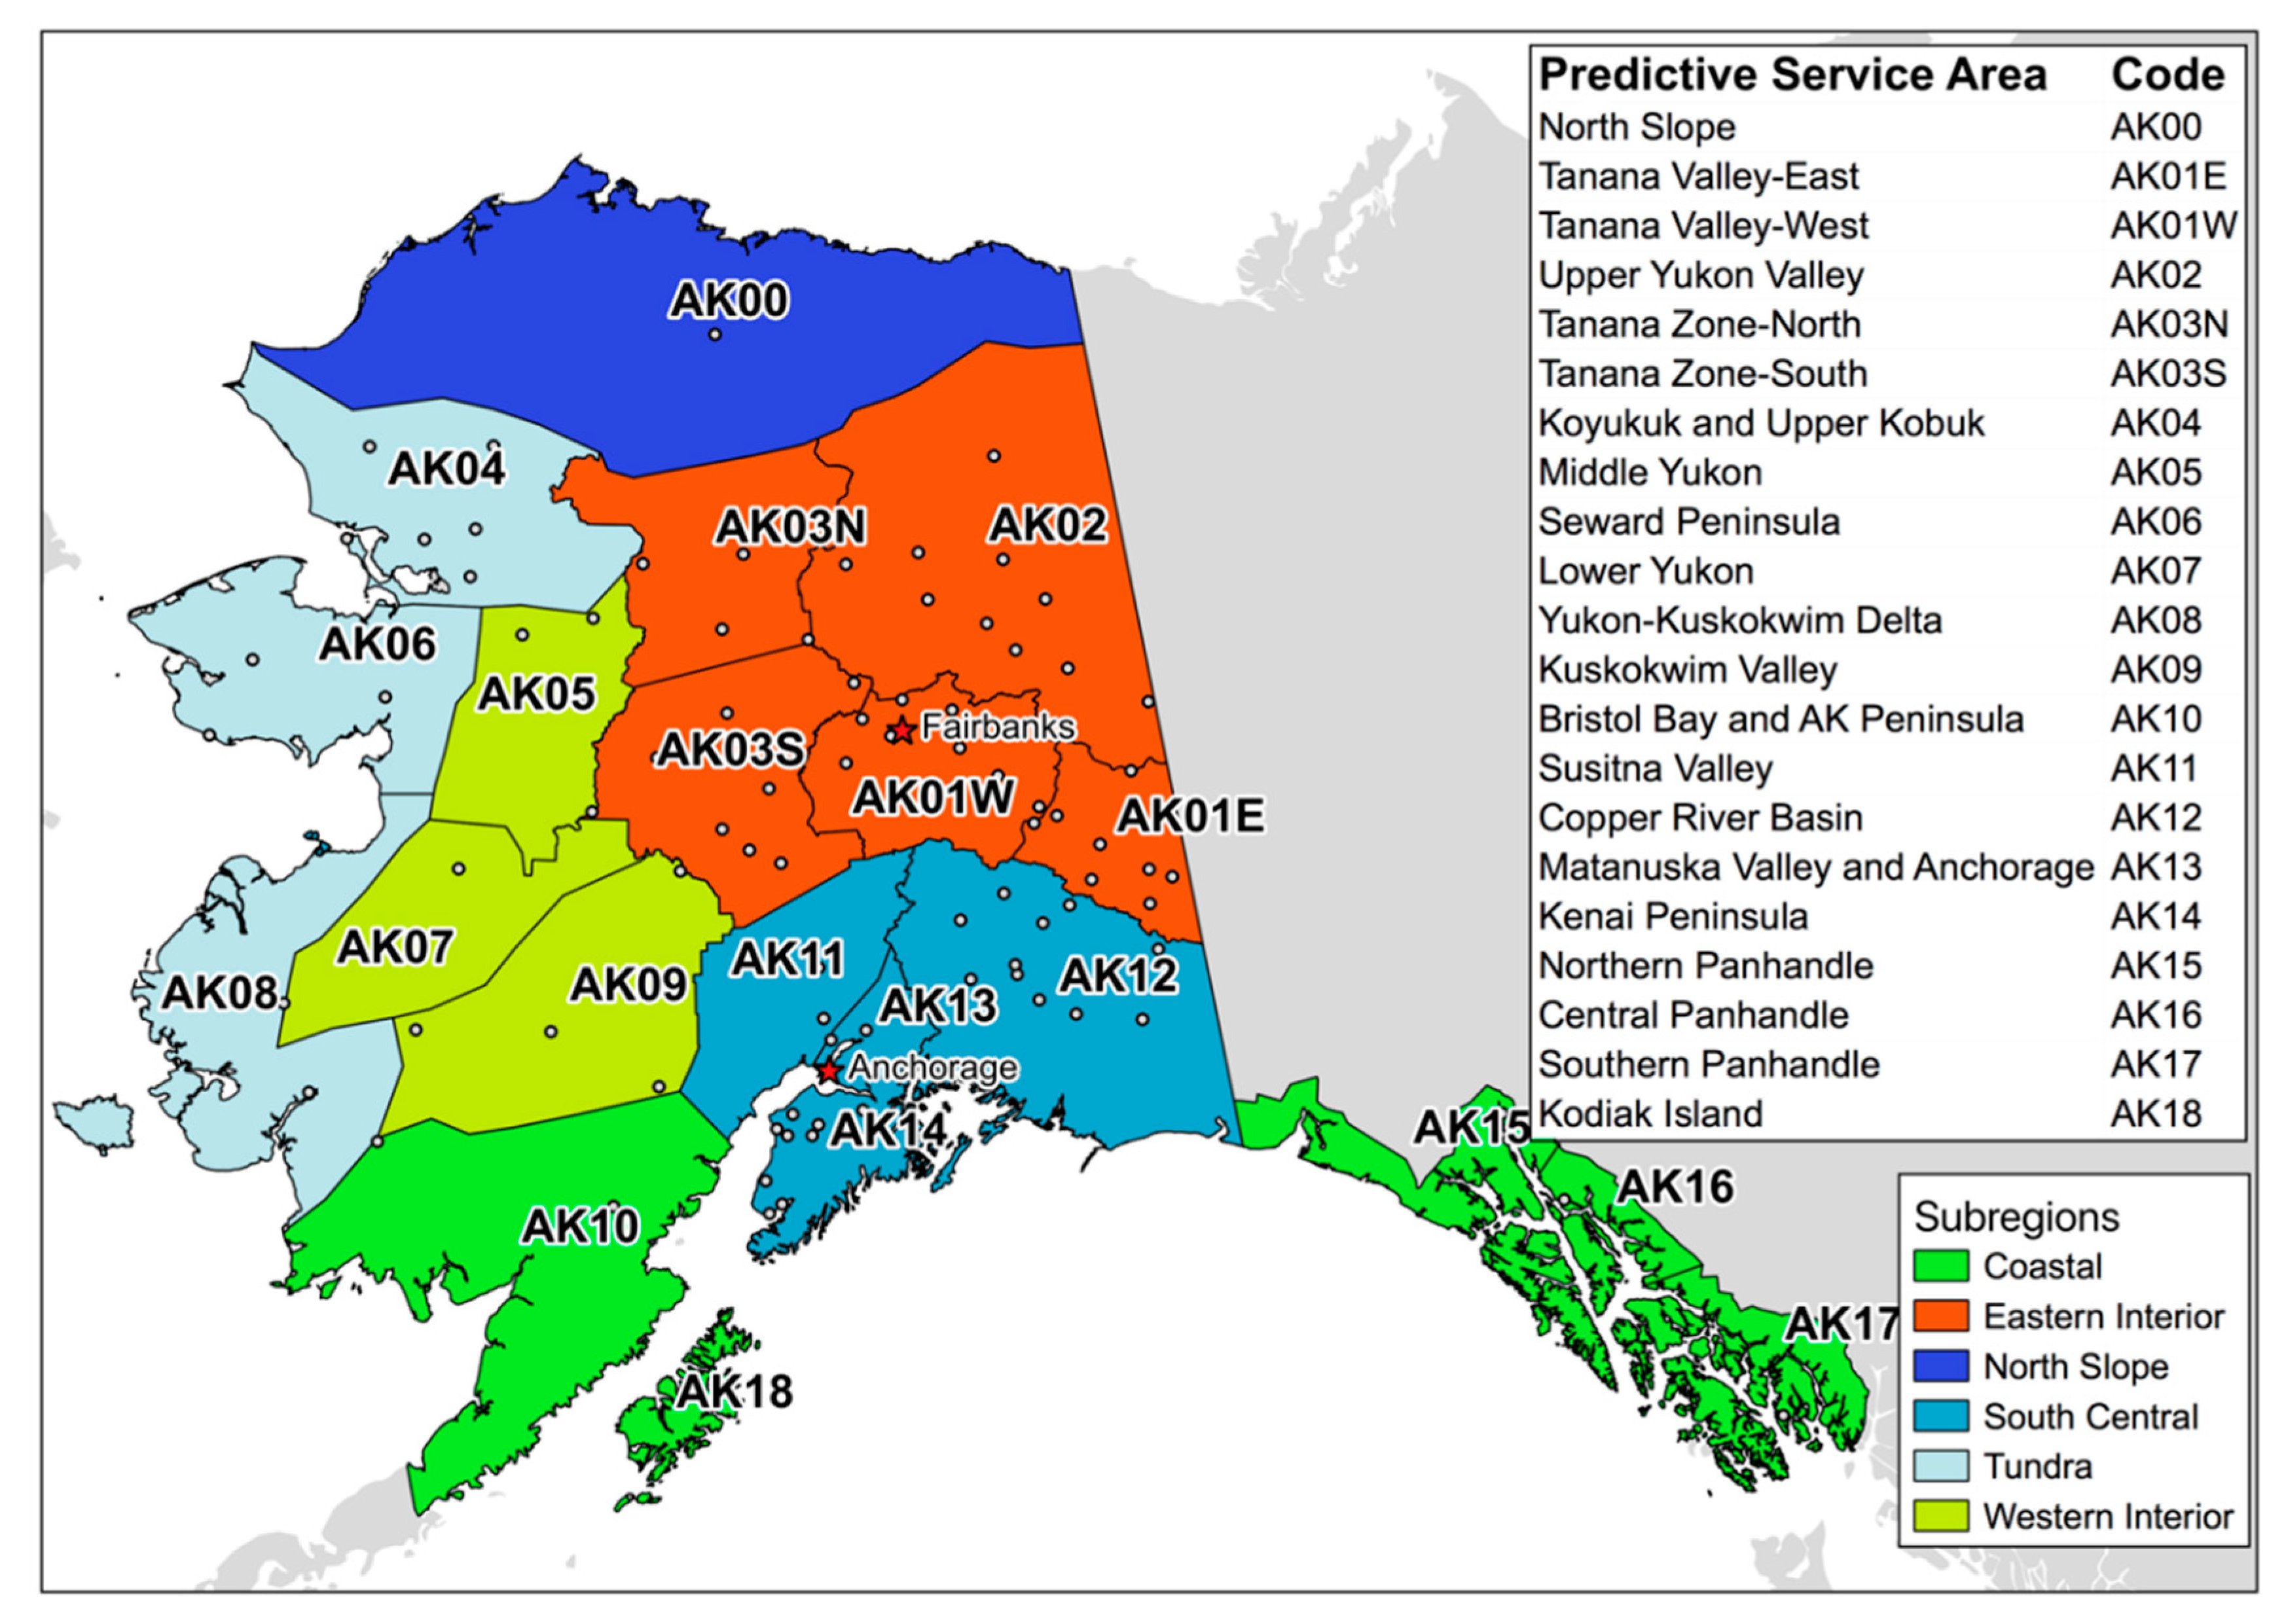
Wildfire impact and the fire management response are not evenly distributed across the Alaska landscape. We used the Predictive Service Areas (PSAs) to evaluate the performance of 13 different wildfire indices. In 2001, Alaska established 21 PSAs based on climate, ecology, management responsibility, and fire history information (
Figure 1). The Alaska Interagency Coordination Center’s Predictive Services unit uses these spatial divisions to update 7-day fire potential outlooks throughout the fire season. Considerable work has been done to understand the relationship between weather, fuel conditions, and wildland fire potential in each PSA, using a 25-year observation history dating to 1994 [
23]. In this study, all analysis was conducted at the scale of these PSAs.
2.2. Fire Potential Indices
Fire weather indices are important tools in assessing fire risk. Wildland flammability has traditionally been represented as fuel moistures that reflect the relative effects of wetting and drying from atmospheric variables. They are generally categorized to represent different antecedent drying periods of days, weeks, and months and the effect on different fuelbed categories, such as litter and duff. Newer indices more directly measure the atmospheric influence on that drying process. Thirteen different indices were evaluated to determine their comparative utility in identifying when, where, and how significant wildfire activity occurs in Alaska.
The Canadian FWI system, in use by the Alaska fire management community since 1992, represents cumulative drying and potential flammability in three fuel moisture codes and one fire behavior index using a simple set of daily surface meteorological variables taken at solar noon. The Fine Fuel Moisture Code (FFMC) represents short-term drying of fine fuels utilizing 2-m temperature, 2-m relative humidity, 10-m wind speed, and 24-h precipitation to increment the previous day’s value. The Duff Moisture Code (DMC) represents cumulative drying and wetting of duff fuels just below the surface using 2-m temperature, 2-m relative humidity, and 24-h precipitation to increment the previous day’s value. Drought alone does not produce extreme burning conditions. However, combined with dry, more available surface fuels, these conditions produce maximum flammability. The Drought Code (DC) represents cumulative drying and wetting of deeper duff and uses only 2-m temperature and 24-h precipitation to increment the previous day’s value. The Buildup Index (BUI) is not a single fuel moisture code but rather an index of overall flammability based on a weighted combination of DMC and DC. It is weighted heavily toward DMC. However, as DMC rises, the importance of DC increases, potentially making BUI equal to as much as double the DMC estimate under extreme drought conditions.
The Vapor Pressure Deficit (VPD) is known for monitoring greenhouse conditions and is gaining popularity as an indicator of short-term drying in an increasing variety of wildland fire potential assessments [
24]. It is an estimate of absolute atmospheric moisture deficit that combines 2-m temperature and 2-m relative humidity into a simple measure of absolute moisture deficit.
The Evaporative Demand Drought Index (EDDI) and Standardized Precipitation Evapotranspiration Index (SPEI) are similar measures of evapotranspiration stress designed as successors to traditional drought indicators such as the Palmer Drought Index. They are formatted in the same way, expressing the range of conditions as wetter and drier than normal to serve a wide variety of drought assessment applications. Both are designed to estimate cumulative drying over a user-specified time period. In an effort to make the best comparisons with the FWI tools and VPD, EDDI and SPEI versions for 1-, 15-, 52-, and 90-day time periods were calculated. The EDDI is based on a climatological normalization of the reference evapotranspiration (ET0) derived from the meteorological conditions [
17]. In this analysis, ET0 is computed following the American Society of Civil Engineers (ASCE) Standardized Reference ET equation [
25]. In the case of EDDI, the ET0 values were then converted via an inverse normal approximation [
17]. SPEI conducts the normalization similarly on the time series of precipitation minus the ET0 [
18] instead of ET0 alone. Negative values of SPEI indicate a greater precipitation deficit and therefore greater fire risk, which is the opposite of the other indices. As a result, where SPEI is compared to other indicators (EDDI, FWI codes and indices, and VPD), its numeric sign is reversed to facilitate the comparison.
While EDDI and SPEI are formally normalized within their calculations, BUI, DMC, FFMC, DC, and VPD typically are not. In an effort to provide a more consistent scale for comparison with EDDI and SPEI, the BUI, DMC, FFMC, DC, and VPD indices were normalized by determining their percentile rankings. That is, within each PSA, the daily values of each index were sorted over the 15-year period and ranked with a percentile score. The highest values received scores of 1.0, the lowest values received scores of 0.0, and all other values received intermediate rankings. Therefore, these five indices will be primarily presented in the form of percentiles in subsequent sections unless noted otherwise, while EDDI and SPEI will retain their already normalized character. Such percentile distributions are commonly used in fire weather analyses [
26].
While all of the indices will be compared equally, it is useful to group them conceptually according to their antecedent lag periods.
Table 1 presents the groupings of the short-, mid-, and long-lag indices. Short-lag indices respond quickly to changes in day-to-day weather conditions, while long-lag indices better reflect monthly to seasonal drought conditions. This analysis provides a good opportunity to see the ability of EDDI and SPEI to reflect different timescales of atmospheric influence. Though they have no counterpart in the FWI system, 90-day versions of EDDI and SPEI were added to the analysis to explore whether a long-term drought measure might be an important indicator of active fire occurrence and growth.
2.3. MODIS Active Fire Detection History
We used MODIS Active Fire Detection data to represent wildfire activity and evaluate the performance of the 13 indices. The MODIS Collection 6 Active Fire Product User’s Guide Revision B [
27] describes the active fire product in detail, detailing how it can be obtained and used and providing additional information for prospective users. MODIS Active Fire Detection data have been collected since the TERRA and AQUA satellites went operational in 2001 and 2002, respectively. Consistent data for Alaska begin in 2003, which serves as the start of our study period. Though direct broadcast of MODIS detections is publicly available and used to identify emerging fire activity, this study employed the science-grade reprocessed data using Collection 6 methods due to its accuracy and consistency over time. This study used the 240,000 individual MODIS heat detections, each identified by date and time, over a 15-year period from 2003–2017. The Alaska database of MODIS Active Fire Detections used in this study was derived from the Global Monthly Fire Location Product (MCD14ML). The MCD14ML represents the latest reprocessed data based on the Collection 6 standard established in 2015 at the University of Maryland. “Reprocessing of the entire MODIS data archive is periodically performed to incorporate better calibration, algorithm refinements, and improved upstream data into all MODIS products.” [
27]. This dataset is quite robust for Alaska as it has been found to be relatively free of false positives, with 97% of the detections falling within buffered final fire perimeters over 2001–2013 [
23]. Those few detections from known stationary sources such as volcanoes and oil field activities were also flagged and excluded. This study employed two measures spanning 2003–2017 that are calculated for each PSA: MODIS Day and MODIS Count. MODIS Days are those days that have at least one MODIS active detection in a PSA. The MODIS Count is the number of detections on each of those days. Within a PSA there can only be 1 MODIS day for a given date but there can be multiple MODIS Counts if there are detections in more than one pixel of a PSA.
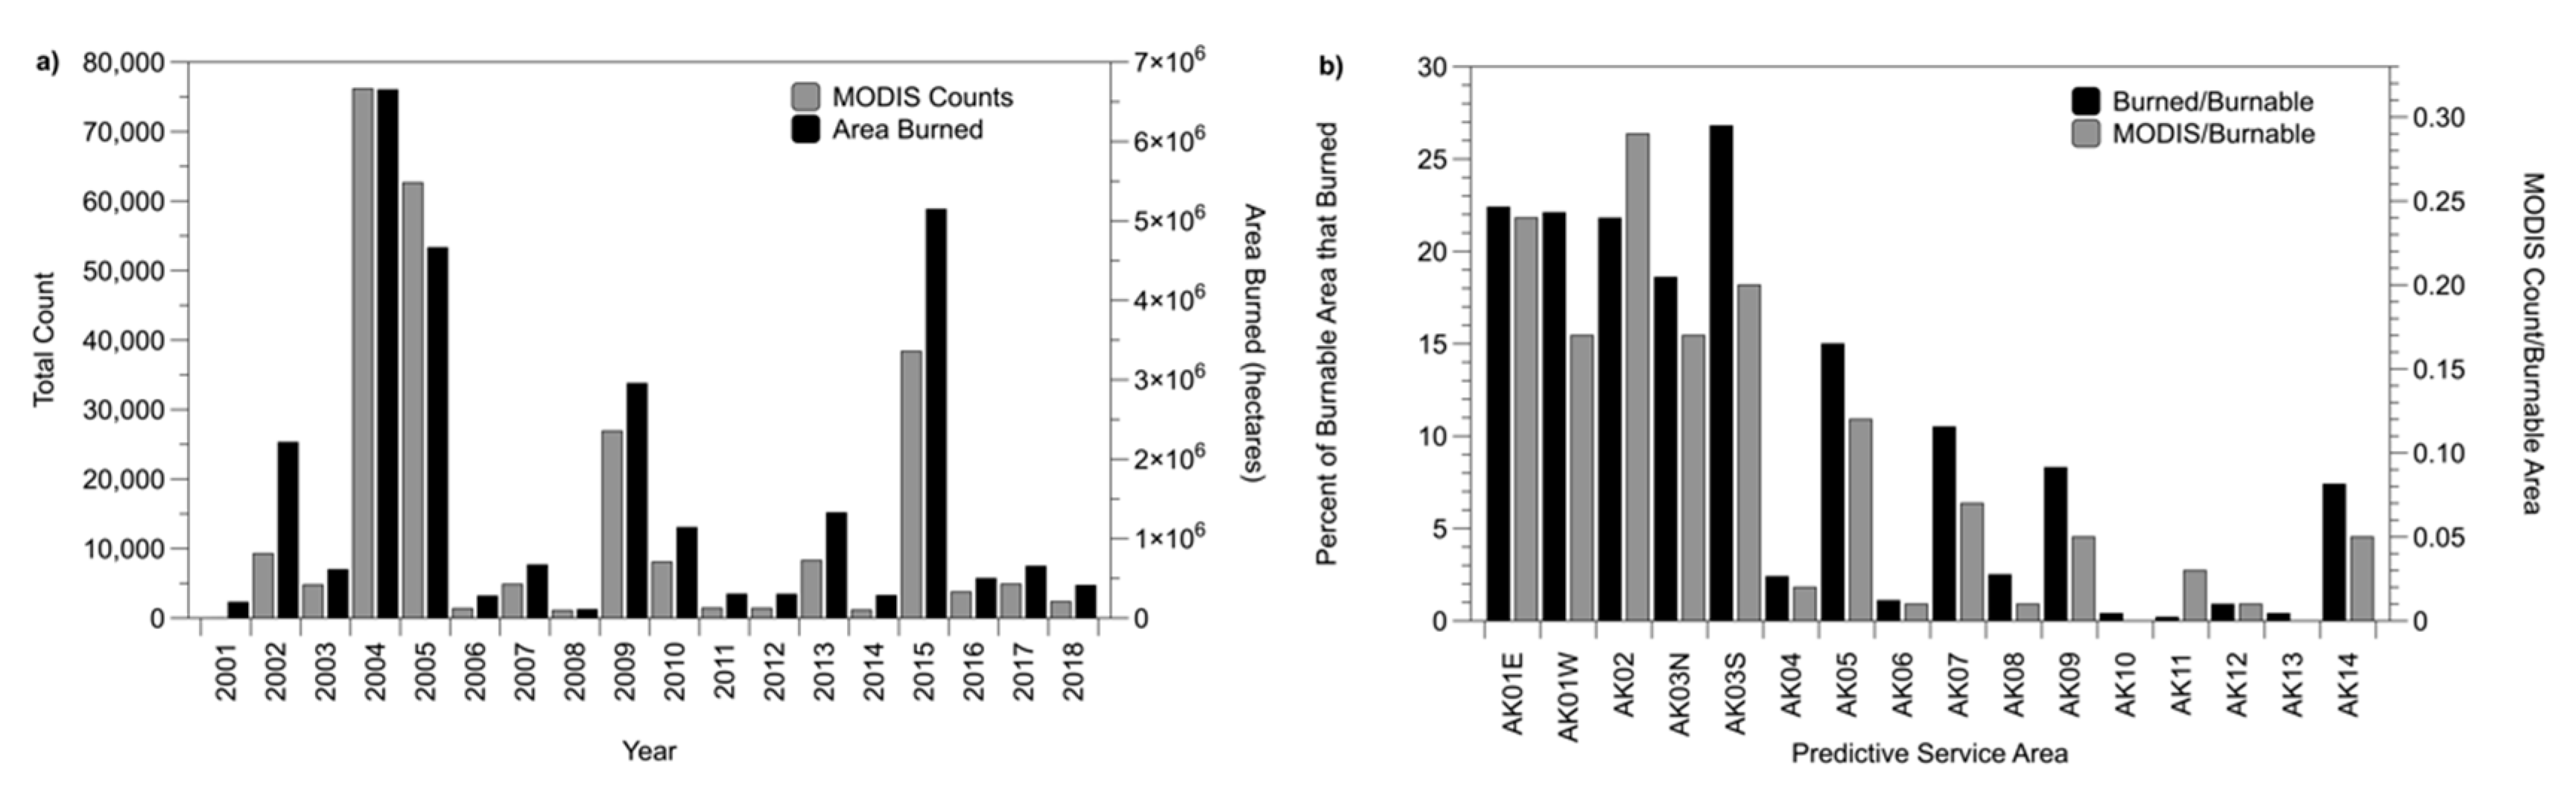
The Alaska Interagency Coordination Center has maintained the Alaska seasonal fire history of the area burned by wildland fires since 1940. These data represent the magnitude of the fire season, but generally do not provide the daily record needed to evaluate the 13 fire indices. Therefore, the daily MODIS data were selected as an alternative. While the signal from the spectral bands used to produce MODIS active fire detections can be obscured by clouds [
23], both temporal and spatial distributions (
Figure 2) show good agreement for the MODIS data with area burned totals from agency data during the analysis period [
24]. Over the 2001–2018 record, MODIS detection counts (
Figure 2a, grey bars) are highly correlated with area burned (
Figure 2a, black bars) each year. When stratified by PSA, the active fire detection data (
Figure 2b, grey bars) closely match the area burned (black bars) in each PSA as well.
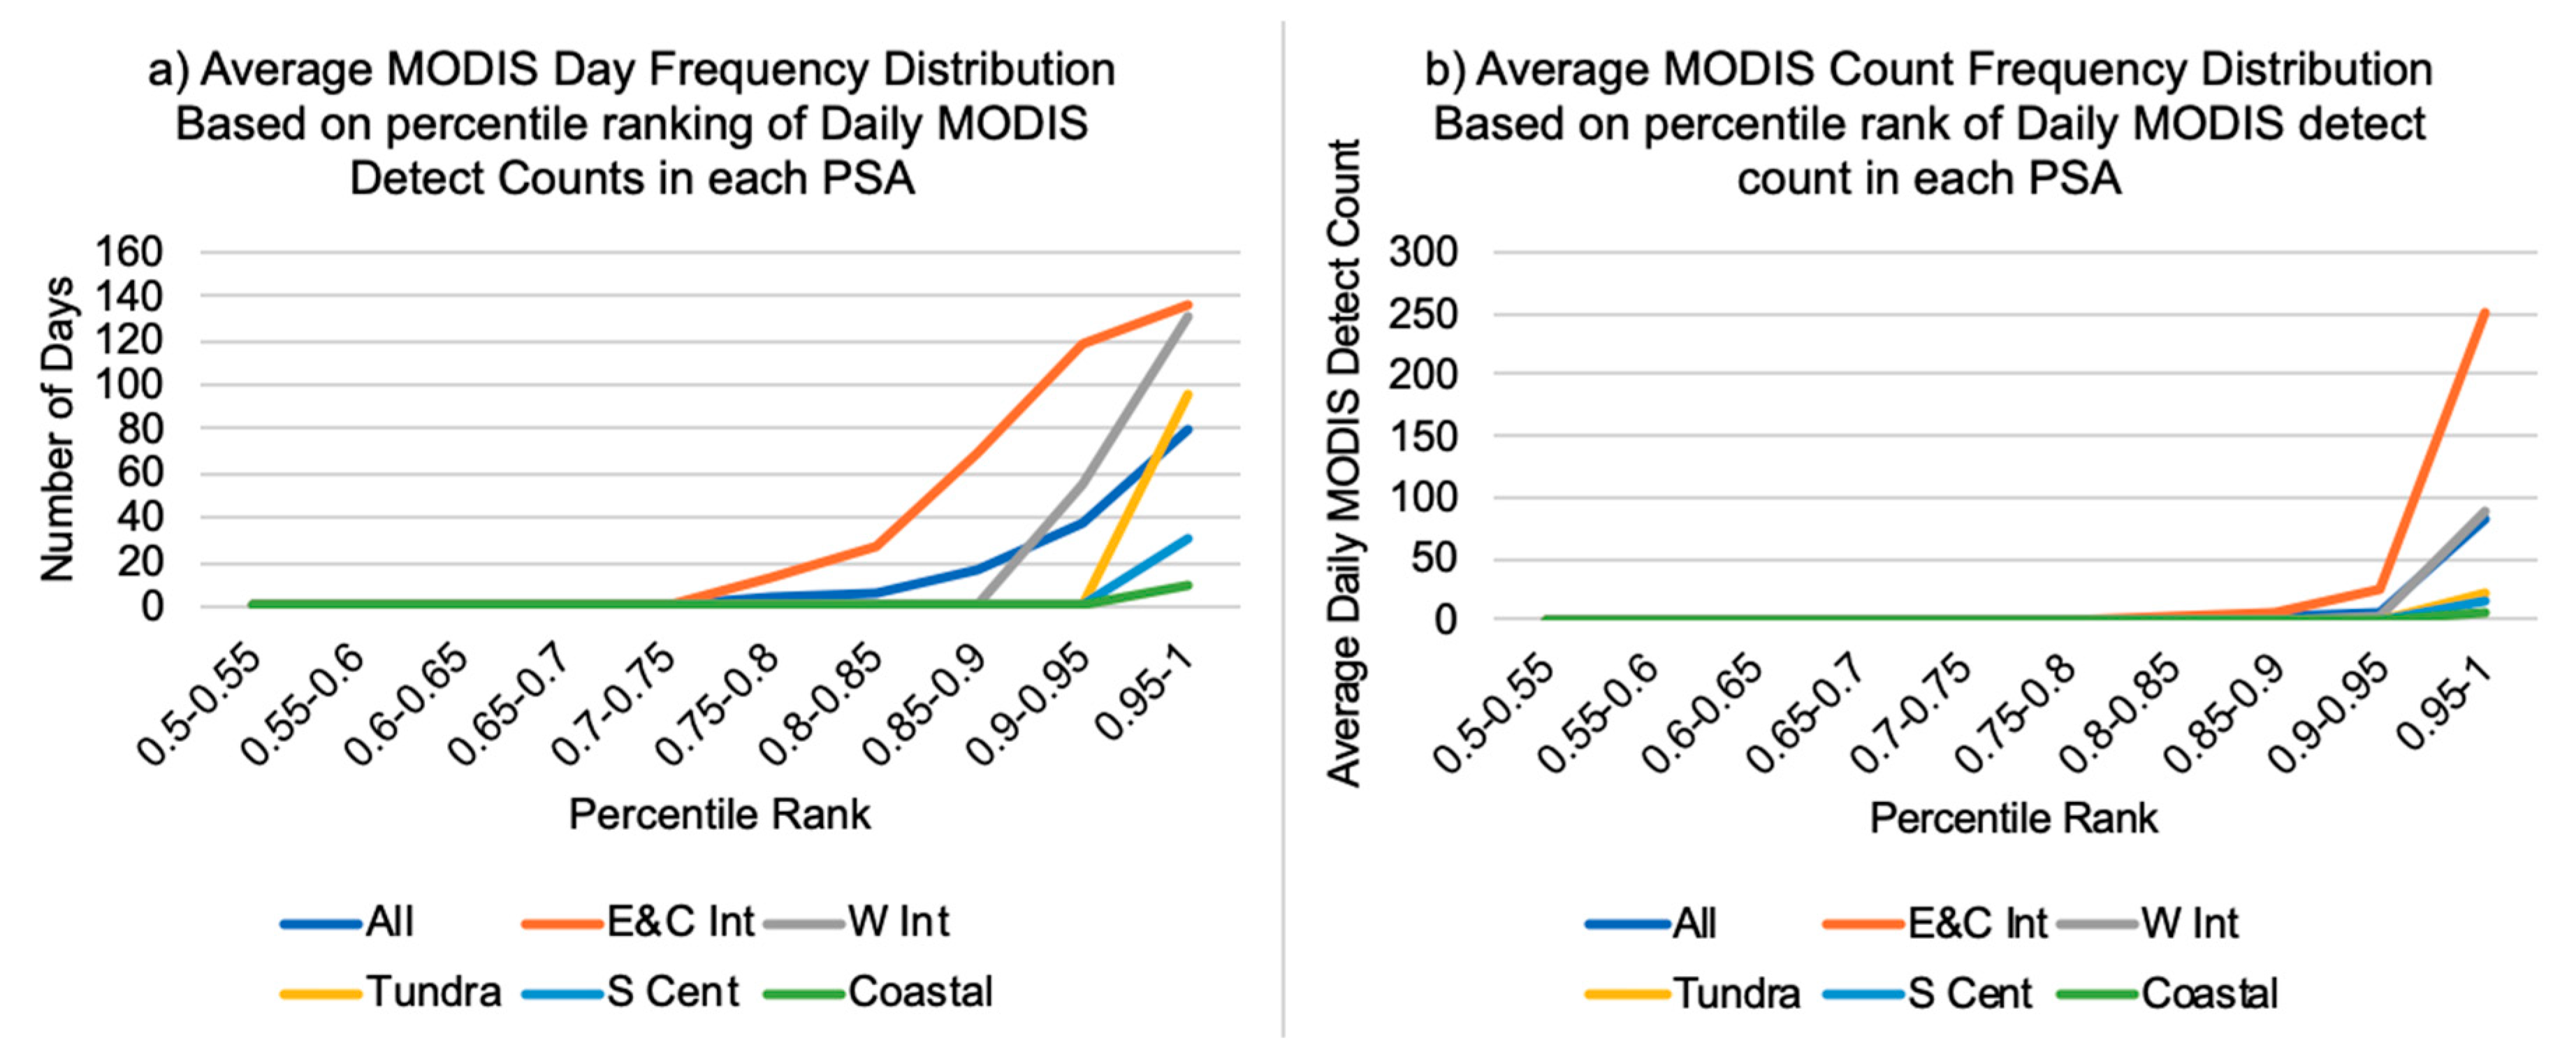
This study also groups the results by subregions or “natural regions” of PSAs for simplicity. The five regions were identified by grouping PSAs (see locations in
Figure 1) with similar levels of area burned and MODIS detection counts (see
Figure 2). PSAs in the Eastern Interior (E&C Int; AK01E, AK01W, AK02, AK03N, AK03S) demonstrated a 7%–11% overall MODIS Day frequency. Those in the Western Interior (W Int; AK05, AK07, AK09) produced 4%–6% MODIS Day frequency overall. Combined MODIS Day frequencies for the tundra PSAs (AK04, AK06, AK08) ranged from 2%–3%. With lower overall frequencies, Southcentral (S Cent; AK11, AK13, AK14) and Coastal PSAs (AK10, AK15, AK16, AK17, AK18) were grouped due to their proximity and climate. The Interior subregions are bordered to the north and south by the Brooks and Alaska Range mountains, respectively, and contain much of the boreal forest in Alaska. These zones have a continental climate characterized by relatively hot, dry summers and cold winters and are located within the Interior climate divisions [
28,
29]. The Interior encompasses most of the historical area burned in Alaska, and the main fire season generally occurs in June–July. The coastal and tundra zones have much more maritime climates, especially those in the south, and are dominated by tundra vegetation in the northern zones and coastal rainforests in the south.
2.4. Alaska Interagency Fire Weather Index Database
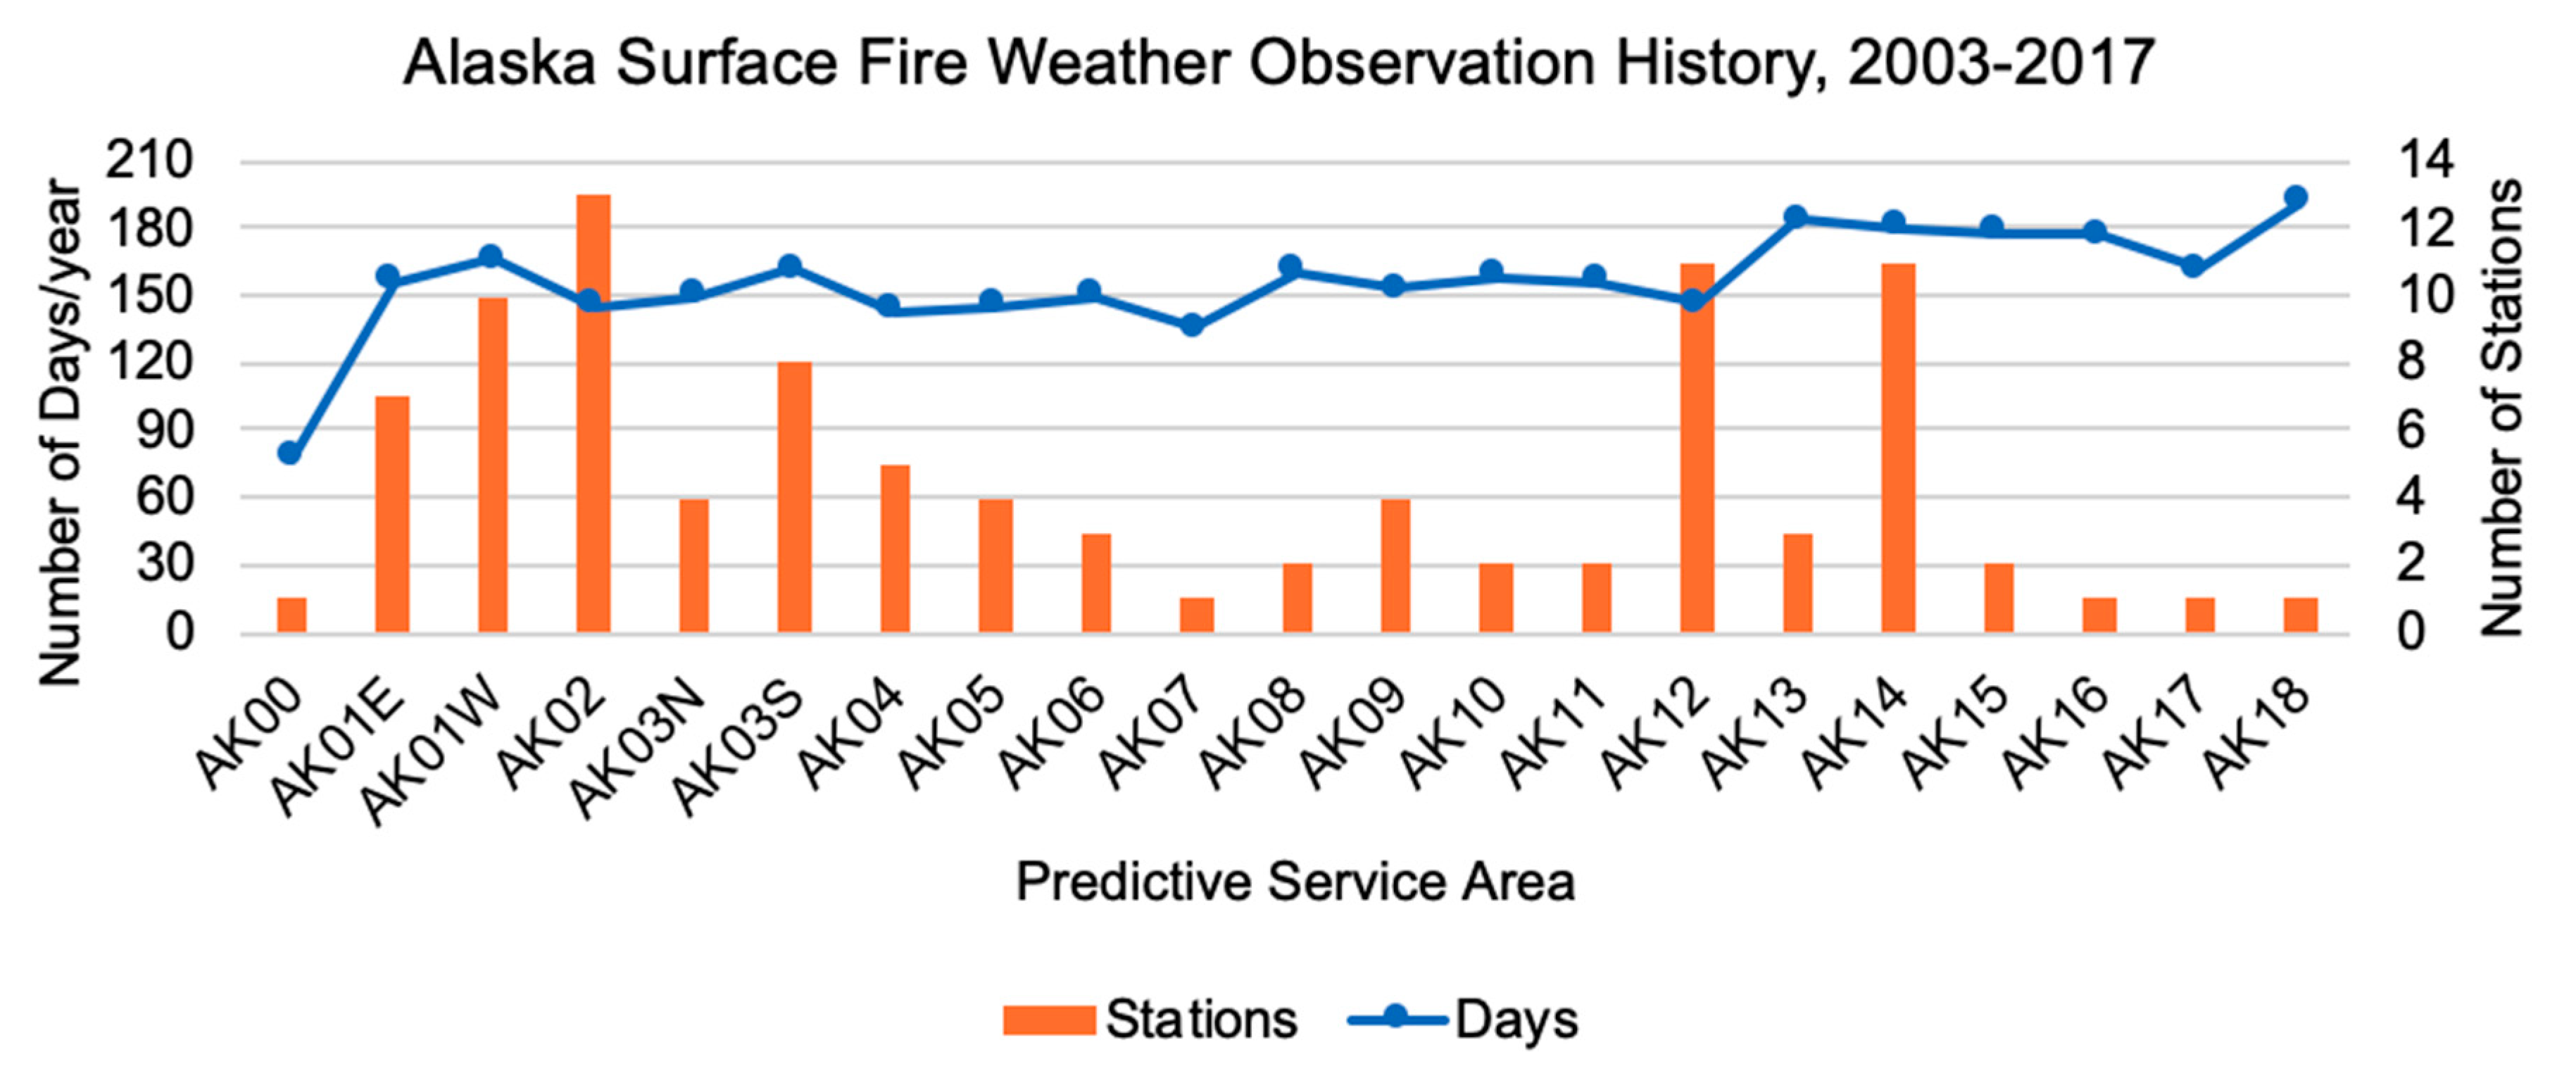
The daily temperature, humidity, wind speed, and precipitation variables in the Alaska Interagency Fire Weather Index Database (AKIFWID) dataset (available online at akff.mesowest.org) were used to produce the BUI, DMC, FFMC, DC, and VPD indices for 2003–2017. Two primary surface observation networks within AKIFWID have sufficient records during the active fire season and were used in this study. The interagency network of Remote Automated Weather Stations (RAWS), configured for fire weather monitoring, is complemented by additional Automated Surface Observing Systems (ASOS) stations. These stations are operated by the National Weather Service, Federal Aviation Administration, and Department of Defense at a number of airports around the state. The locations of the stations used in this study are shown in
Figure 1. Only stations with consistent observation records from 2003–2017 were used for this analysis. The observation history of the stations selected for analysis is shown in
Figure 3, grouped by PSA. These 96 stations each provide an average of 2484 daily weather observations representing about 165 days of the fire season each year. The FWI and VPD indices were calculated from individual weather records, and daily index histories were developed for each of the 96 stations. For each PSA, the daily station indices were averaged, resulting in a consistent set of daily index records for each PSA for comparison over 2003–2017. The AKIFWID database begins in the mid-1990s and was therefore not suitable to compute EDDI and SPEI, which require a long-term reference climatology within their calculation. Therefore, downscaled reanalysis data described in the following section were used to compute those indices.
2.5. Downscaled ERA-Interim Reanalysis
Downscaled gridded observation-based reanalysis data were used to compute the drought indices (EDDI and SPEI) that required consistent long-term (i.e., 30 years) records not available in the AKIFWID station data. These data are on a 20 km grid that covers all of Alaska and were derived from the ERA-Interim reanalysis for 1979–2017 [
16]. They were produced by a dynamical downscaling procedure, which uses a regional weather model to produce higher spatial/temporal resolution data from the original coarse reanalysis product. In this case, the ERA-Interim reanalysis was used to drive the Weather Research and Forecasting (WRF) model [
30], resulting in a 20-km spatial resolution product. These dynamically downscaled data are advantageous in Alaska since they add fine spatial detail to the gridded meteorological parameters in the complex terrain found in the Interior with the help of WRF. The downscaled data are described and evaluated in detail in [
16] and are available online at
https://registry.opendata.aws/wrf-alaska-snap/. The ERA-Interim reanalysis is one of the best performing reanalysis products for Alaska [
31,
32]. The daily temperature, humidity, and precipitation variables from the dynamical downscaled reanalysis were used to compute EDDI and SPEI over the study period of 2003–2017 and are based on the 1979–2017 reference climatology. The reference evapotranspiration (ET0) input values for EDDI and SPEI were computed at each 20 km grid point in the downscaled ERA-Interim dataset, and the values were then summed to the appropriate time period being evaluated (i.e., 1-, 15-, 52-, and 90-day). The final PSA average of each index was then produced for 2003–2017 to be analyzed against the MODIS data using grid points at or below 600 m elevation.
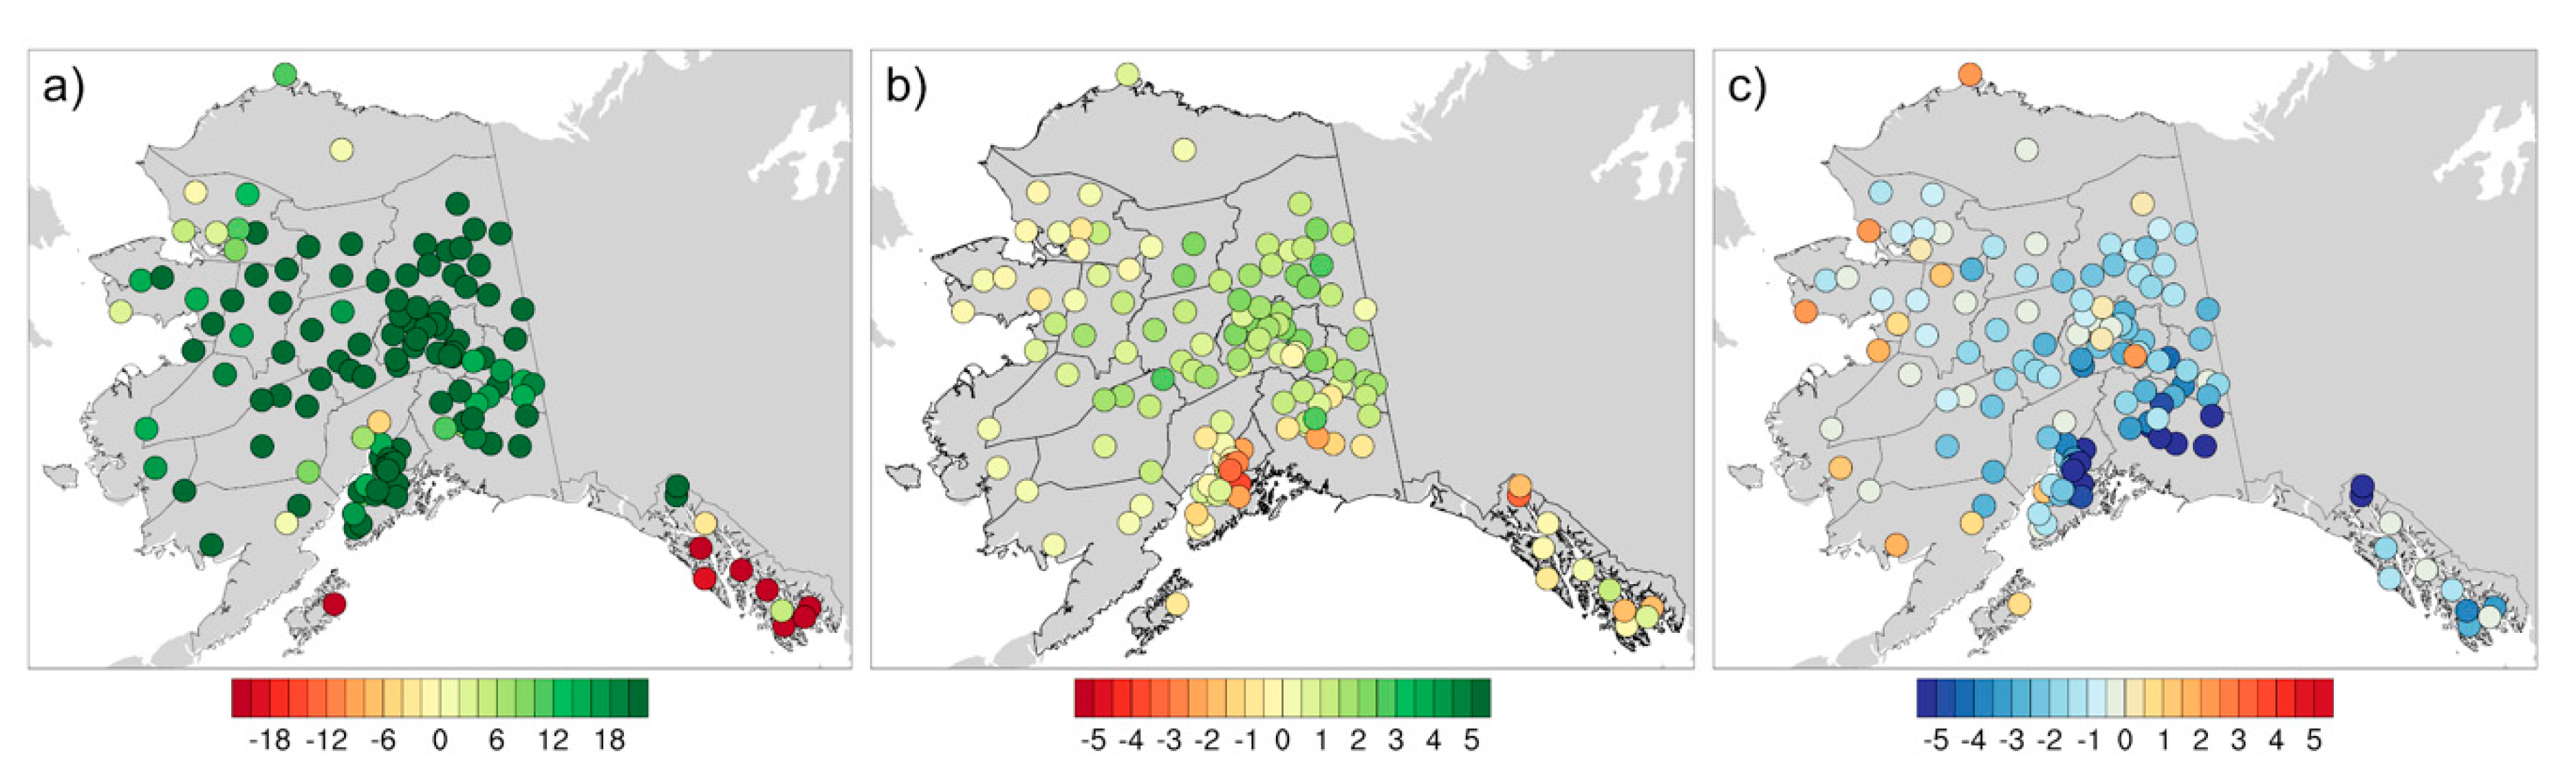
Reanalysis and the dynamical downscaling procedure both incorporate dynamical models to produce their output that, coupled with the limited availability of observations in the north for assimilation, can give rise to biases in the data. Quantifying the biases in any derived dataset, such as this downscaled product, by comparing to surface observations is necessary to help interpret results.
Figure 4 shows a direct comparison between the AKIFWID surface observations and the corresponding values from the nearest model grid location with similar elevation. Fuelbed drying and landscape flammability are heavily influenced by current ambient temperatures and atmospheric humidity. In both, significant bias is detected during the summer months (i.e., May–August) in this dataset. Dew point temperature reveals a wet bias compared to corresponding surface measurements throughout Interior Alaska (
Figure 4b), and ambient surface temperature shows a variable, but notable, cold bias throughout the boreal regions (
Figure 4c). These differences impact derived fire index values each day. With heavy fuel loads, as are found in the boreal forest, these deviations actually accumulate over time in the assessment of drought and problem fire potential. A positive precipitation bias (
Figure 4a) is widespread across the entire fire-prone landscape, consistent with the wet bias in dew point, but a direct evaluation of the causes is beyond the scope of this study. In contrast, there is a negative (dry) bias throughout the southeastern panhandle. These biases are all consistent with prior findings [
16].
2.6. Frequency Distribution Analysis
All data in this study were analyzed and compared according to their frequency distributions. Frequency distributions were calculated for the MODIS Day and MODIS Count variables, and these distributions serve as the observations against which the 13 fire indices were evaluated for their ability to accurately predict fire occurrences. However, simply computing frequency distributions for the fire indices and then comparing them to those of MODIS would not be optimal since dangerous fire weather conditions can be present even when no fires were burning or ignited on those days. Such an analysis would not provide a fair evaluation of the fire indices. Therefore, conditional frequency analysis was used to relate the frequency of different levels of fire danger indices to the presence or absence of wildland fires on the landscape. In this study, the conditional frequencies were calculated by determining the frequency of different ranges of each fire index during MODIS Days and Counts. This quantity was then divided by the total number of days in the record that met those same fire index thresholds. This relatively simple statistical approach accounts for the false negative or false positive errors and is often applied within the wildland fire management community to assess the efficacy of fire weather indices (e.g., [
26]).
Conditional frequency distributions were produced for the 13 fire indices over each of the 21 PSAs. PSA-level values were averaged to construct conditional frequency distributions for the five Alaska subregions (see
Figure 1). Each conditional frequency distribution was compared to the corresponding observed frequency distribution of days with active fires detected by MODIS. This approach was selected because any index that can accurately assess fire weather conditions should have a frequency distribution that is similar to that of wildland fire occurrences. The MODIS Day and MODIS Count distributions represent the observations of significant wildfire fire activity. To assess the differences between a fire index and observed distributions, cumulative departure scores were calculated for both. This was done by summing over the differences between a fire index conditional frequency distributions and that from MODIS Day and Count (Equation (1)). Each distribution’s frequency range (in the form of a cumulative distribution) was rescaled to match that of MODIS. This ensured that all the departures were positive so this simple scoring metric is a sum of positive values. The cumulative departure scores relative to the MODIS Day distribution were calculated by the following:
where i represents a percentile bin in the cumulative distribution. Each percentile bin represents 5% of the data, resulting in 20 total bins. In Equation (1), the cumulative departures are calculated as the sum over all of the percentile bins of the differences between fire index frequencies and the MODIS Day frequencies. This calculation was done for each of the 13 fire indices. The same formula was also applied to the MODIS Counts, where a further step was needed to convert them to average daily counts by dividing the total by 2745 (the number of days in each distribution’s historic record).
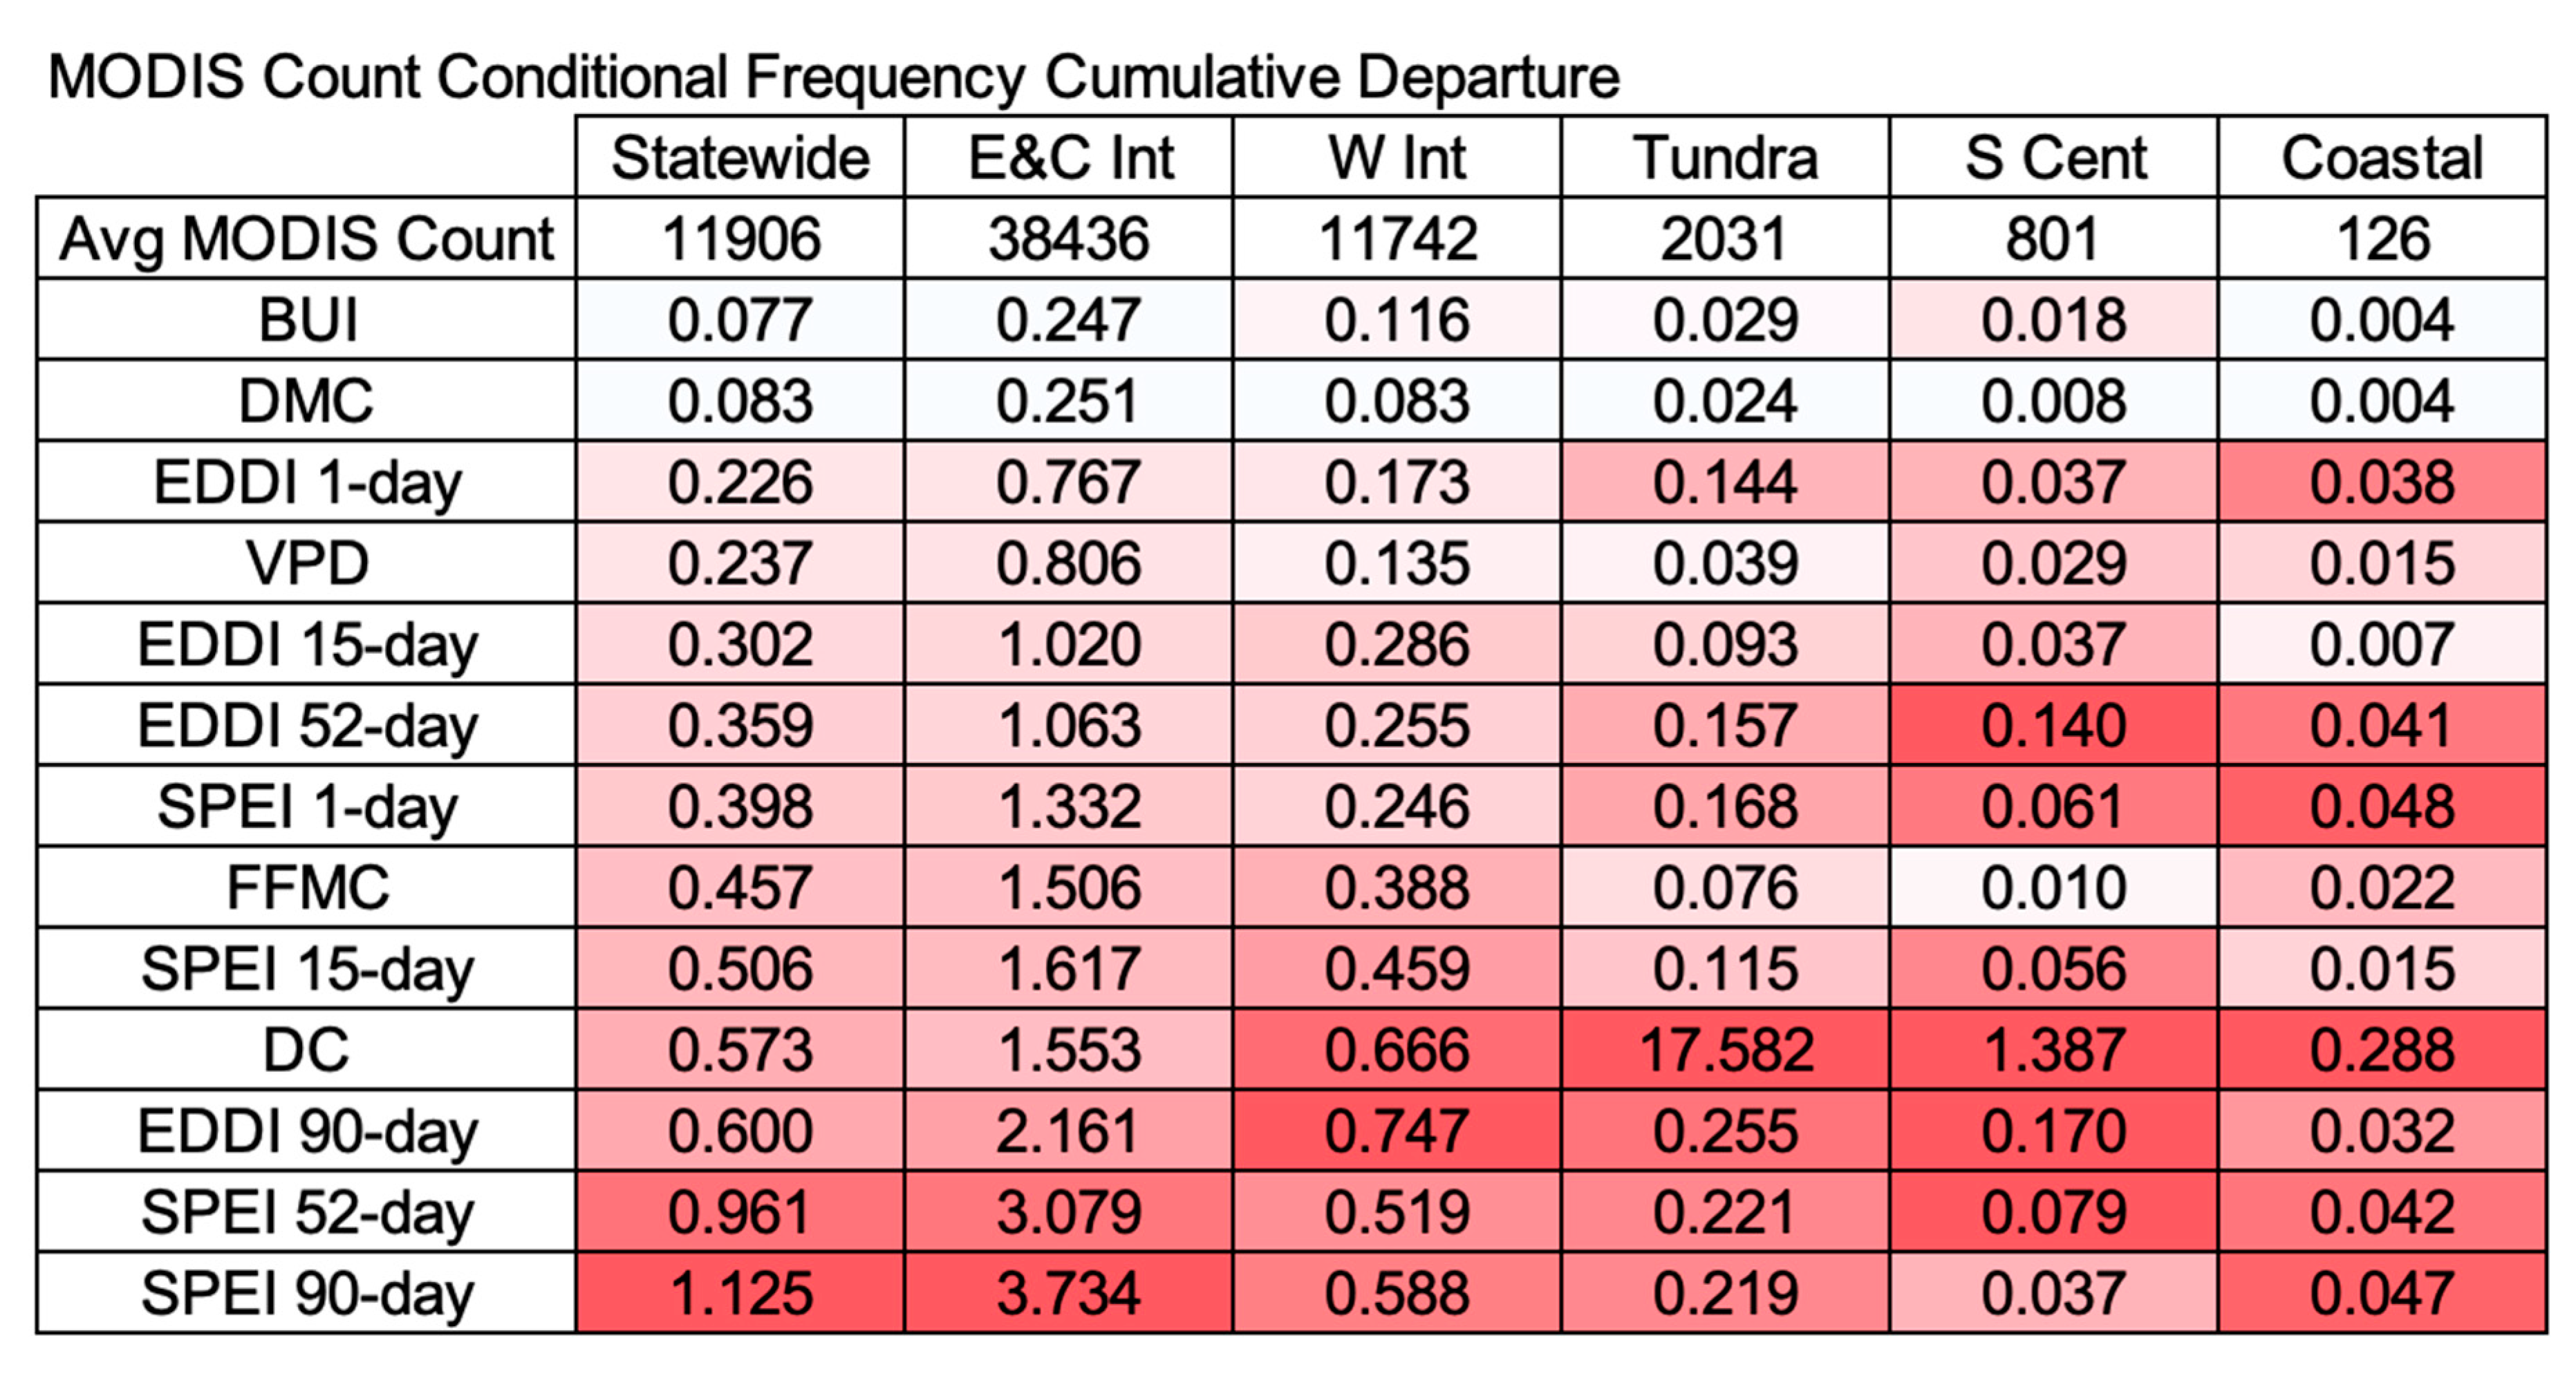
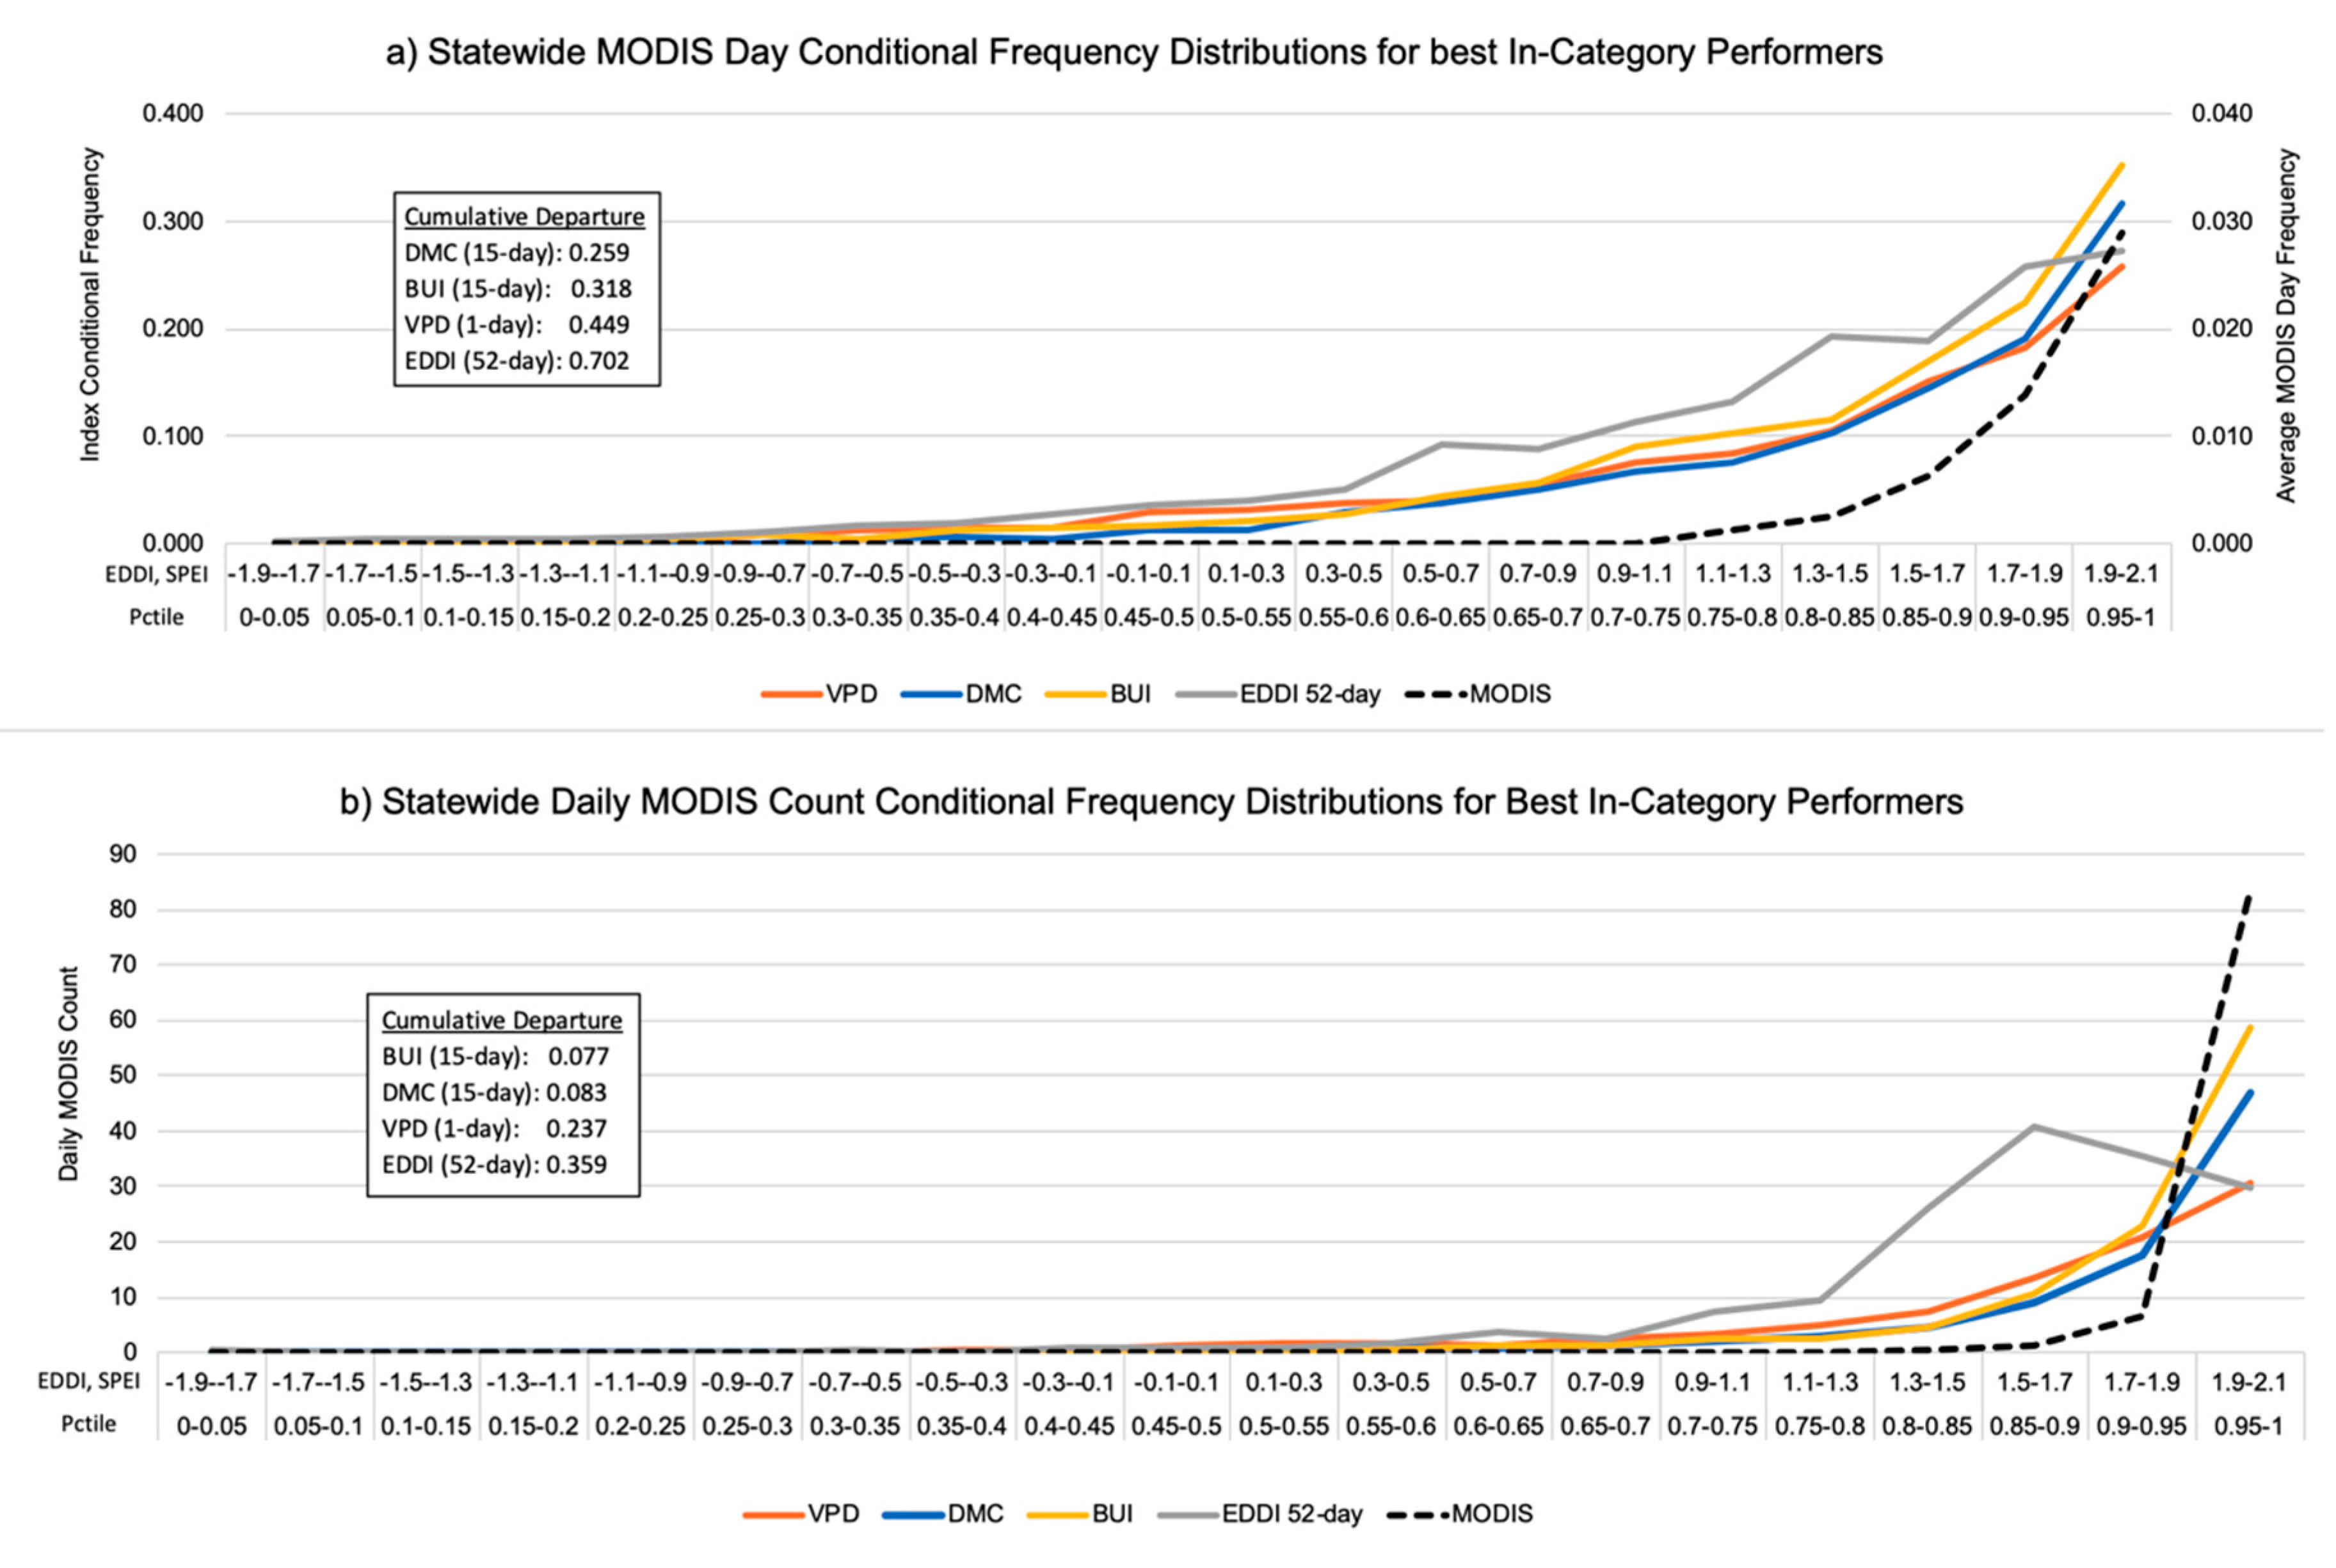
4. Discussion
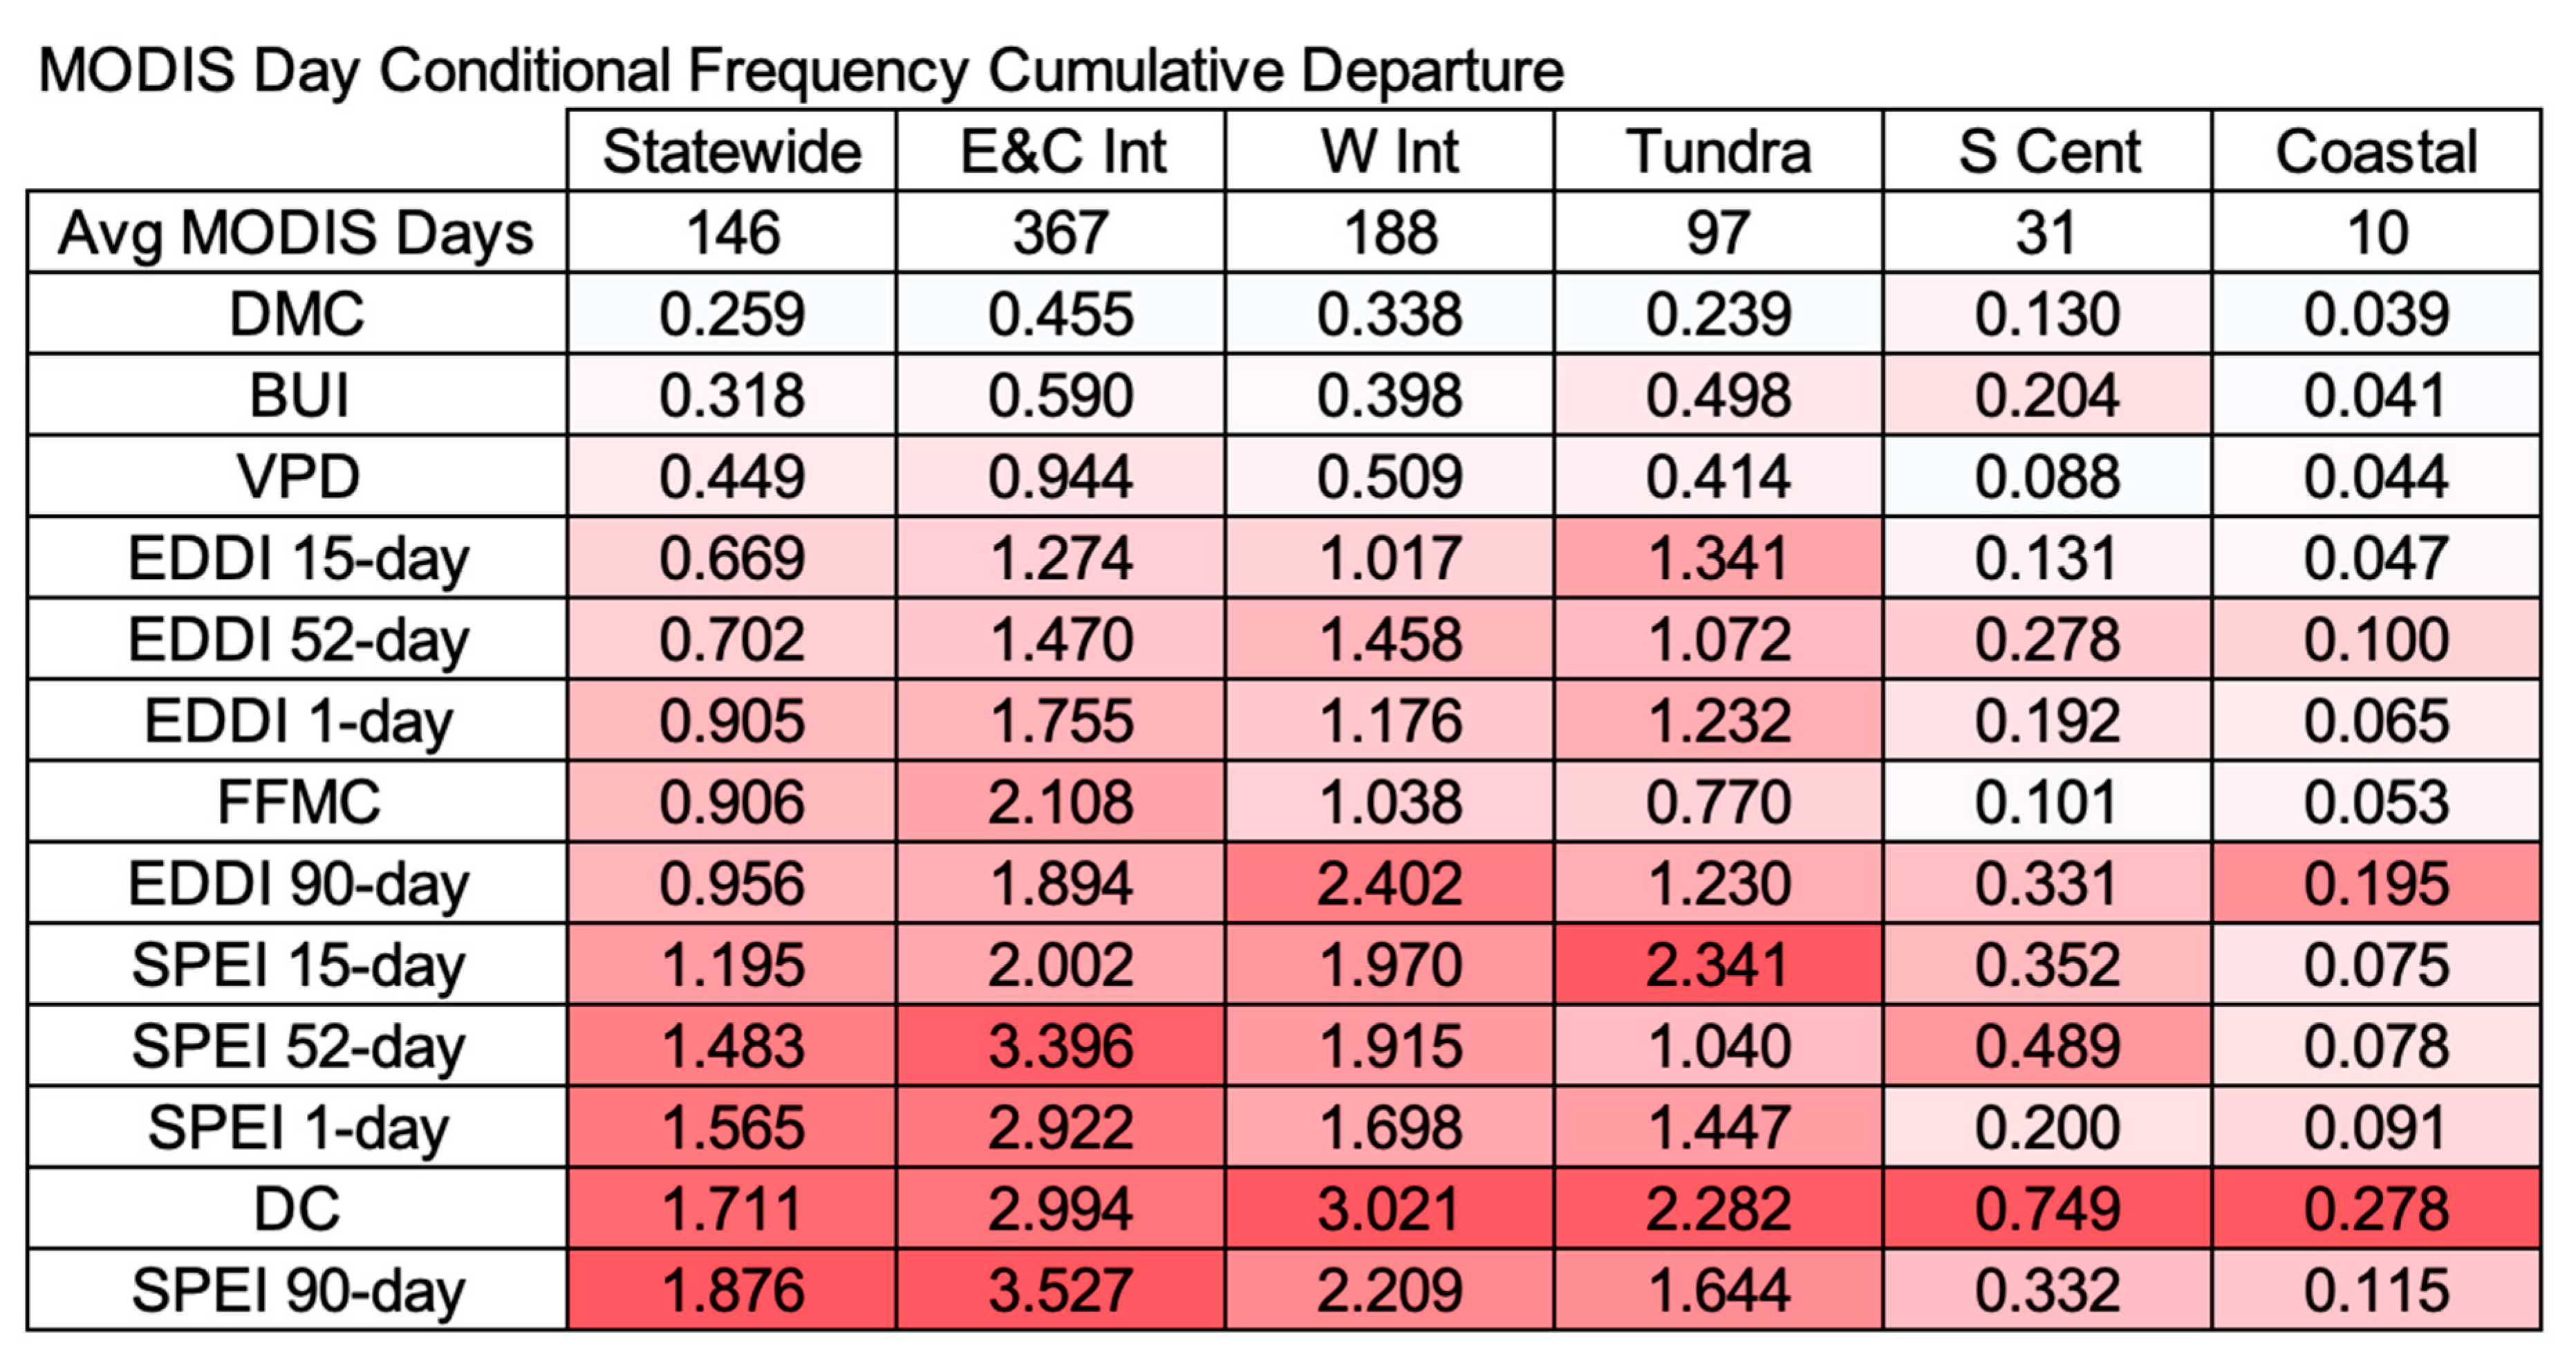
Based on our analysis, the Duff Moisture Code (DMC) and Buildup Index (BUI) performed best of the 13 indices that were compared. They produced the conditional frequencies that compared most favorably with MODIS Day and MODIS Count frequencies at PSA and subregional levels as well as statewide. These results generally reflect fire manager experience in Alaska using these indices in an operational setting. DMC produced lower cumulative departure scores for MODIS Days. BUI demonstrated a lower cumulative departure for MODIS Counts when considered statewide, heavily weighted to the East and Central Interior where the majority of area burned over the study period. In addition, BUI generally produced the highest conditional frequencies at the highest (driest) percentile ranks. This was particularly true with respect to daily MODIS Counts, which represent the size of fire growth events.
The cumulative departures relative to the MODIS Days (
Figure 8) are higher on average than for the MODIS Count cumulative departures (
Figure 9). There are several important factors to consider that account for these differences. Fire activity detection is limited to those instances where fires actually grow significantly. Other days may, in fact, offer flammable conditions without active fire detection because there are no current ignitions or active fires at the time. MODIS detections are also not able to fully capture the frequency and impact of moderate fire spread or small fires that are less visible to MODIS detection. Many smaller fires and some days of fire growth for larger fires exhibit no MODIS detections [
34]. This level of fire activity would more likely correspond to more intermediate index percentiles, some of which is manifest in the index conditional frequencies. Despite these omissions, the best performing indices are good predictors of landscape flammability and significant fire activity.
The top three performers (DMC, BUI, and VPD) were all calculated from surface weather observations from AKIFWID, while EDDI and SPEI were derived from the downscaled reanalysis. This may suggest that the underlying data and index formulations could be important impediments to considering newer alternatives. The apparent bias of the downscaled ERA-Interim reanalysis dataset is detailed in
Section 2.5. The resulting distinctions between EDDI and SPEI performance are based entirely on the inclusion of positively biased precipitation as a factor in SPEI. Embedded normalization methods used to produce EDDI and SPEI, as explained in
Section 2.2, also create apparent distortions in the distribution of landscape flammability conditions associated with evapotranspiration stress.
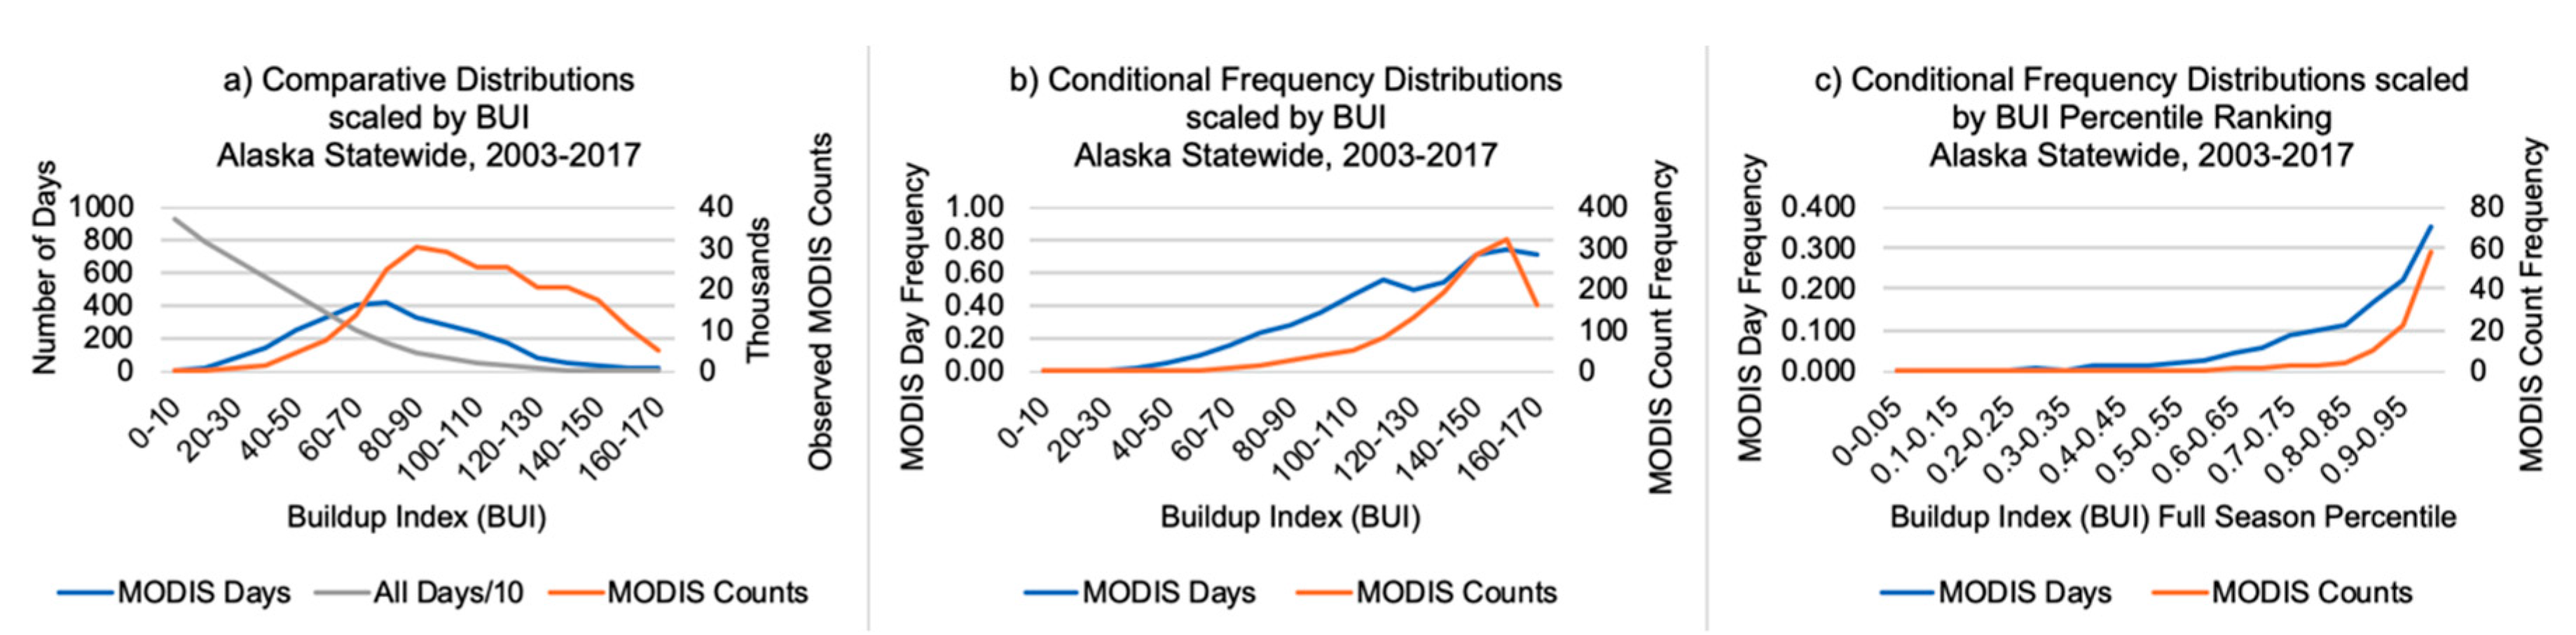
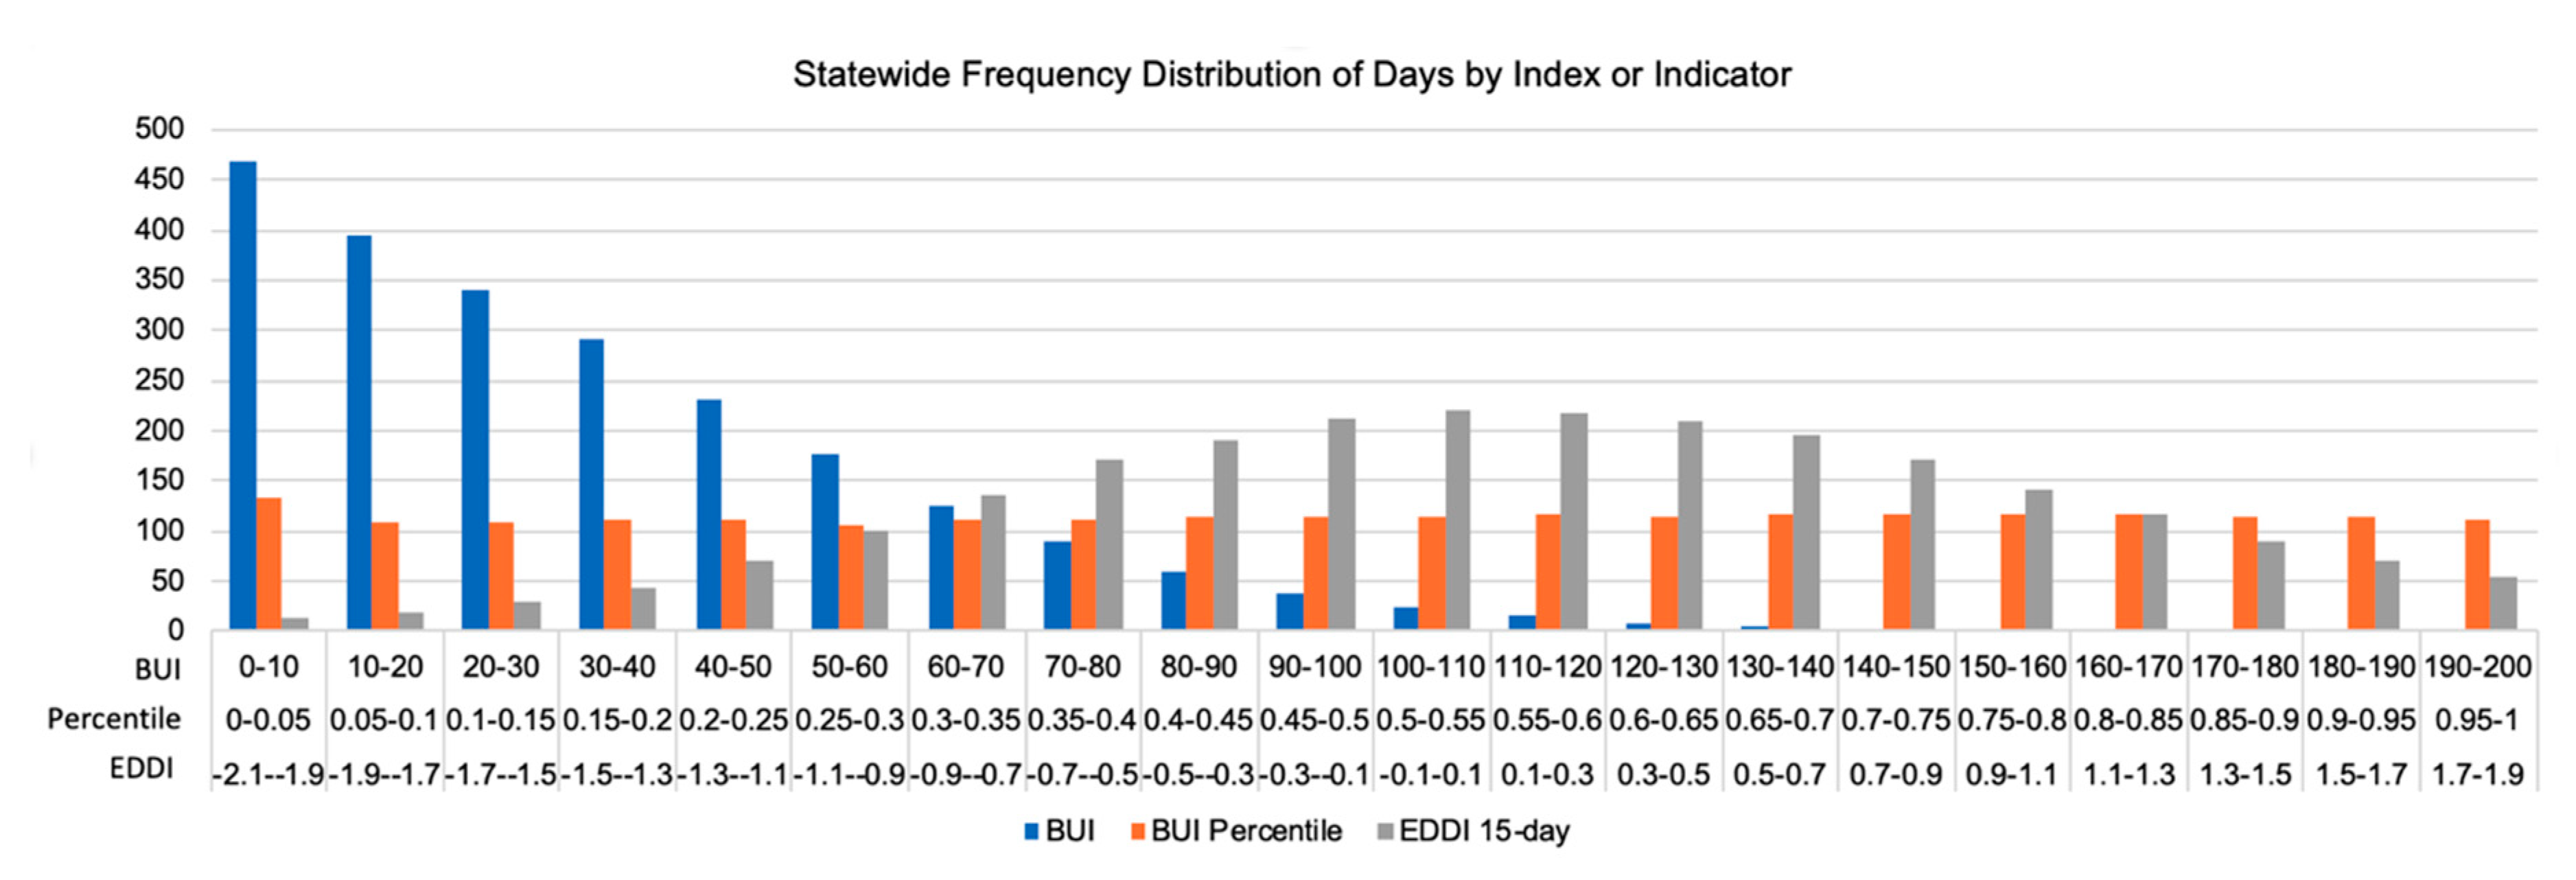
Distributions of objective BUI values, rescaled BUI percentiles, and the corresponding EDDI 15-day values are compared in
Figure 11. Both the BUI percentile rank and EDDI 15-day distributions skew the real variability in BUI frequencies, which shows that there were very few days in the record with high values. Importantly, normalization of the ET0 distributions to produce EDDI distorts the real ranking by co-mingling a disproportionate number of low potential days, correctly represented by BUI, up into and with the mid-range classes of its distribution. A similar concern is the disproportionate redistribution of index-related MODIS fire activity down into more intermediate (normal) classes for EDDI and SPEI. This results in raising conditional frequencies for intermediate ranges and lowering peak frequencies at the highest index levels, making it hard to distinguish probability and risk effectively.
Significant wildfire occurrence and growth in Alaska are on the rise, however results here show that the set of long-lag drought indices (e.g., DC, EDDI 52-day, SPEI 52-day) were generally the poorest performers throughout our analysis, possibly reflecting the fact that extended droughts have not typically impacted large portions of the state on a year-to-year basis. Only 2 of the 15 years in this analysis period, 2004 and 2005, show notable late season fire activity due to extended drought. Conversely, localized drought conditions in those two significant years in the analysis period suggest that there is a need to distinguish late season departures due to significant long-lag drought when they occur. BUI, more than DMC, incorporates long-term drought from DC. With warming temperatures, increasing frequency of local and general late season droughts may become more of a problem. It is also worth noting that at high latitudes there is an increased likelihood that other warming induced processes (e.g., convective activity or early loss of snow pack and drying) will impact fire danger in the future. This motivates future research into diverse indices that may be helpful in capturing these changing dynamics. For drought, BUI may be more suitable than DMC, as it incorporates long-term drought from DC. From our results, it appears that the higher peak MODIS Day and MODIS Count conditional frequencies at the highest percentiles favor BUI over DMC and suggest that it could be the better index under those extreme conditions.
5. Conclusions
In this study, we evaluated 13 fire weather indices against MODIS active fire data in Alaska. Based on our results, we can conclude that DMC and BUI, which are operationally used by the Alaska fire management community in their assessments of seasonal severity and overall landscape flammability, can be continued to be used with confidence. Fire models that incorporate BUI in overall fire potential and fire behavior assessments are likely to produce effective results throughout boreal landscapes in Alaska. One novel result is that VPD showed effectiveness throughout the state. Therefore, it is worth considering this index as an alternative to FFMC among the short-lag/1-day indices. Though its conditional frequency distributions fall short of DMC and BUI as an indicator of significant fire days and growth events, VPD was clearly the third best performer according to the cumulative difference scores. Conventionally, FFMC and BUI have been combined to identify those days with both extended, antecedent drying and current evaporative stress. These results suggest that VPD may prove to be an effective replacement for FFMC as an assessment tool. Further, it is apparent that VPD and DMC may be preferable to both FFMC and BUI for tundra ecosystems.
Fire behavior and fire danger models integrate a range of antecedent fuel moisture lag periods to determine flammability, some among the indicators studied here. Generally, that flammability is represented with models that estimate spread rates, fireline intensity, cumulative heat per unit area, and fuel consumption. These models have been in use for decades and have no apparent updates or replacements in the future. They are not designed for plug-and-play replacements. It is important to determine how new findings like these can help inform those models as they continue to be used. For example, transforming VPD into an improved FFMC could be a major advancement. However, unless models that represent wildland flammability conditions are designed to utilize these new indicators or the indicators are formulated to better fit as model inputs, they will continue to fall short in utility for fire management decisions.
This evaluation recognizes several questions and issues that require further exploration and analysis. They follow three lines: one that recognizes a critical data gap, another that identifies resources and indices not considered here, and one that considers how further refinements in the analysis could produce additional insight. Understanding of temporal and spatial distribution of precipitation is limited in Alaska, as modeled reanalysis representations show problematic bias and there are not enough surface observations to represent it. As a result, assumptions about its mitigating influence are affected by models developed for and data collected from much different environments. Improvements in remote sensing and more sophisticated modeling could help better inform analyses that are impacted by this critical factor. Preliminary examination of the new European Centre for Medium-Range Weather Forecasts ERA5 reanalysis [
35] suggests that it may produce better results for high latitude Alaska due to reduced bias in its processes. Spatial resolution at 20 km or finer, histories dating to at least 1981, and data available provisionally with just a 2- to 5-day time lag are all desirable factors for monitoring fire indices. With an increasing number of new ways to evaluate atmospheric influences, interest in a wide range of indicators that could be used for assessing landscape flammability is significant. It would have been valuable to include NFDRS Energy Release Component in the evaluation if the calculations had been accessible. Finally, the promise of radar-based remote sensing being integrated into the Evaporative Stress Index suggests that it could bring important initialization information to bear on modeled results and therefore warrants future evaluation. While this comparative review evaluated all indices across the 6-month Alaska snow-free period, subseasonal differences are known to be represented differently among the indices evaluated. All of these questions, as well as advancements not yet identified, suggest that further work is necessary and that interest among fire managers will be ongoing.


 ,
, 


