Abstract
Research Highlights: During drought, reduced soil water availability and increased vapor pressure deficit diminished transpiration in a mature beech stand (Fagus sylvatica L.). Dominant trees were more affected than suppressed trees. The share of soil water uptake from deeper layers decreased. The ability of individual trees in the forest stand to save water during drought was apparently dependent on their social status. This would be relevant for forest management. Objectives: We investigated which basal area classes of trees contribute more or less to total transpiration under wet and dry conditions, and from which soil layers they took up water. We hypothesized that dominant trees have a better adaptability to drought and diminish transpiration more than suppressed trees. Methods: The water budget of the forest stand was continuously monitored throughout the entire observation period. Xylem sap flux measurements using thermal dissipation probes were performed during the vegetation period at different depths in the trunks of ten representative trees. A radial distribution model of the sap flow density pattern was used to compute whole-tree and stand transpiration. Water budget was simulated using a physiology-based model. Results: During drought, the fraction of suppressed trees to whole-canopy transpiration of the forest stand increased and the share of soil water uptake from deeper layers decreased. Conclusions: The behavior of dominant trees under drought conditions could be interpreted as a water-conserving strategy. Thinning by removing suppressed trees should be employed to stabilize forests.
1. Introduction
Dominant greenhouse gases released into Earth’s atmosphere continued to increase their atmospheric concentration, which reached new record highs [1]. Climate models project increasingly dry summers in Central Europe [2,3]. In central and Northern Europe, more extreme heat, drought, and storm events are expected and will be accompanied by increased disturbance pressure by biotic agents [4]. Forest stands in the northeastern German lowlands are particularly sensitive because they grow predominantly on sandy soils with low water holding capacity. Furthermore, many coniferous monocultures are being transformed into mixed forests by the re-introduction of broadleaf tree species; however, this forest management directive ignored the potential adverse effects of global climate change on European beech (Fagus sylvatica L.) in these areas [5]. In the center of this species’ distribution range (i.e., SW Germany), beech stands have shown continued climate change-related growth declines since the 1980s at low elevations; however, increases in growth have been reported at high altitudes [6]. The different growth responsiveness of beech in ancient and recent forests to N deposition and water deficits was considered to be consequence of differences in nutrient cycling and availability in the past [7]. Reducing stem density for maximizing the radial growth of target trees can increase the trees’ drought sensitivity [8]. In an assessment of the temporal development of growth of the widespread European beech, the highest sensitivity and lowest drought resistance was found in the core of the species’ distribution area, while the dry range edge populations showed particularly high resistance to drought and little evidence of drought-related declines in growth [9]. To minimize the impacts of climate change, knowledge of the degree of adaptability or the vulnerability of a plant species to projected environmental conditions is essential.
In summer 2003, Western Europe was affected by an extreme heat and drought event with above-normal solar radiation and below-normal relative air humidity [10]. A French working group reviewed the knowledge of eco-physiological responses of forests to this extreme drought [11]. The authors analyzed the impact of drought on water exchange at the soil-root and canopy-atmosphere interfaces and reviewed the irreversible damage possibly imposed on internal water transfer in trees, particularly within xylem. Using a terrestrial biosphere simulation model to assess continent-scale changes in primary productivity during 2003, a 30% reduction in gross primary productivity across Europe was estimated [12]. Combining physiological measurements (i.e., a stable isotope approach) with hydrodynamic modelling of stomatal aperture, it was found that beech trees were able to cope with the drought of 2003 and concluded that beech trees have been operating at their hydraulic limits; however, a longer or repeated drought period would have affected tree growth considerably [13].
The components of forest ecosystem water budgets, including canopy and soil evaporation, water uptake from different soil depths and soil water drainage, can be estimated relatively precisely if the calibration of process-bases simulation models can be based on time series of measured precipitation, stand precipitation, soil moisture at different depths, and transpiration, and if additional vegetation or soil-specific parameters, such as leaf area index (LAI), fine root distribution, and water retention characteristics, are available.
Compared to canopy evaporation, transpiration has been shown to be far more difficult to estimate by means of modelling because it is essentially regulated by stomata, plant internal resistances and limited soil water supplies. Additionally, the hydraulic architecture of a tree is known to determine the water flux from roots to leaves [14,15,16]. The plant’s internal water transport and gas exchange is limited by the water conductivity of the xylem. Xylem sap flux measurements enable the differentiation of transpiration in different vegetation layers of forest stands because over a period of one day or longer, the total transpiration of the canopy approximately corresponds to the amount of water flow through the trunk [17].
To upscale from tree to stand, the structural heterogeneity of the stand must be considered [18]. In even-aged stands, the importance of this point is constricted; however, measurements should be conducted by stratifying the range of basal area and crown projection area of the trees. An open question is whether water deficits impact all trees in a beech stand in the same way or if dominant and suppressed trees are affected differently. Potentially, forest management could help to design a structure of forest stands minimizing the impacts of drought stress. The transpiration rate of each individual tree is determined both by the microclimate in its ambient atmosphere in the canopy and by the water availability around its root system. Hence, the susceptibility of trees to drought depends on tree height, exposed position, and root depth.
Forest management may influence the growth trends of forests because gaps in the beech canopy affect the growth and transpiration rates of neighboring trees [19]. Another working group assessed a beech forest in southwestern Germany and found that co-dominant and dominant trees had lower growth recovery and lower growth resilience after drought than did the predominant trees [20]. They hypothesized that under a warmer climate, thinning might reduce the effects of drought by allocating more growing space to individual trees; in this way, the resilience and stability of beech can be increased at both the tree and the stand levels.
The aim of our study was to analyze the water budget in a mature beech forest stand over four years differing in drought conditions and to measure sap flux to study the effect of drought on transpiration of individual trees based on their social status in the even-aged forest stand. Which basal area classes of trees contribute most and least to total transpiration under wet and dry conditions, and which soil layers do they draw water from? We hypothesized that dominant trees have a better adaptability to drought and diminish transpiration more than suppressed trees.
2. Materials and Methods
2.1. Site Description
We studied a mature European beech (Fagus sylvatica L.) stand located in the forest district of Beerenbusch near Rheinsberg in North Brandenburg, Germany. The site represents an intensive monitoring core plot (04-1207) of the International Cooperative Programme on Assessment and Monitoring of Air Pollution Effects on Forests (ICP Forests, Level II Program, http://icp-forests.net/); the site is located approximately 600 m west of Lake Stechlin (53.1° N, 13.0° E) at an altitude of 78 m a.s.l.. The long-term mean annual temperature (1951–2000) was 8.0 °C, and the mean annual total precipitation was 586 mm a−1 (data from Neuglobsow Station of the German Meteorological Service, distance 3 km). The stand was established in 1888 as a plantation of beech trees under a Scots pine (Pinus sylvestris L.) stand. After the last pine trees were cut between 1985 and 1988, a pure beech stand evolved, reaching an age of 114 years in 2002 with a mean height of 27.3 m and with trunk diameter and basal area averaging 33.4 cm and 24.9 m2 ha−1, respectively. The LAI calculated using measured data on litter fall and specific leaf area ranges between 4.9 in 2003 and 8.2 in 2004. The 7.4 ha wide forest stand with a canopy coverage of 85% was growing on groundwater-distant, slightly podzolized brown earth (Brunic Arenosol (Dystric)). The humus type is moder. The forest floor is covered by sparse ground vegetation (~1% coverage). An experimental plot 0.5 ha in size was established and contained 108 beech trees. For a more detailed description of the soil conditions we refer to [21,22].
2.2. Weather Conditions and Water Budget Measurements
Air temperature, precipitation, relative humidity, and solar radiation were observed at the open field area of the ICP Forests Level II plot Beerenbusch—pine, 04-1202 [23] approximately 3 km distant from the experimental site.
Stand precipitation was measured as the sum of canopy drop and stemflow. Canopy drop was continuously measured using a gutter with an area of 0.8 m2 and a tipping bucket rain gauge. Additionally, weekly measurements were carried out using 15 samplers (RS 200, UMS, Munich, Germany), each with an area of 314 cm2. Stemflow was collected using stem collars at five stems. Canopy interception was calculated as the difference between open land precipitation and stand precipitation.
Soil water content (vol.%) was measured hourly in the beech stand at soil depths of 0.2, 0.7, and 2.5 m at distances of 0.5 m, 1.5 m and 2.5 m from a dominant tree by Theta probe ML2x (Delta-T Devices Ltd., Cambridge, UK).
2.3. Sap Flux Measurements and Canopy Transpiration Calculations
The trees (108 individuals) were sorted according to the decreasing basal area (Abas). After cumulating 10 classes of the same cumulated basal area but with different numbers of trees were formed. We selected one representative tree with median basal area in each class for xylem sap flux measurements (Table 1) and assumed a hint on the social status of the trees from a linear relationship between basal area and crown length [24]. Trees of the basal area classes 9 and 10 are suppressed trees with lower height.

Table 1.
Diameter at 1.3 m and tree height of the measured beech trees of ten basal area classes (in periods 2002–2003 and 2004–2005, different trees were selected).
Sap flux density (SFD) was measured using constant power thermal dissipation probes according to Granier [25]. Sap flux sensors, electronic controls, and energy supply units were constructed in our electronics lab. Sensors were heated by rechargeable 12 V DC batteries. The measured values (mV between thermocouples connected in series in the heated and unheated sensors) were recorded at 10-s intervals and stored as 30-min mean values on a data logger (21X, Campbell Scientific Ltd., Leicestershire, UK). The measurements were taken at a wood depth of 0–22 mm below bark for all trees, at 22–44 mm for five trees and at 44–66 mm for one dominant tree. The SFD of each tree was calculated using the function relating SFD to thermal dissipation [25]. To avoid any thermal impacts from radiation, sensors were shielded and thermally insulated, and installed on the northeast-facing side of the trunk. Previous measurements did not reveal any systematic deviations caused by cardinal direction.
Beech trees are characterized by a diffuse porous xylem anatomy and reveal a radial variation in SFD [26,27,28]. To model the radial SFD profile, we used SFD data (daily sums) from beech trees collected by inserting probes to different depths in the trunks. SFD and trunk radius were normalized as follows: The respective maximum value of sap flux density was set to 1 (SFDrel = 100%) for each tree, and the whole-woody radius (r) (the value at ½ the diameter at 1.3 m without bark) was set to 100% [27]. With this procedure, in trees of different diameter coeval annual rings were located nearly at the same position of the normalized radius. The model in equation 1 was fitted to data using Mathematica version 9 (Wolfram research):
To calculate whole-tree transpiration, we substituted SFDrel = 100% and the standardized radius in the model with the maximum measured SFD value and the real radius of the trunk, respectively. Related SFD values from the model were multiplied with the annuli of the cross-sectional area of the trunk in per mill radial steps. The whole-tree transpiration [kg per tree] is the sum of these products. Canopy transpiration was computed by extrapolating the results from the ten measured trees to the entire stand using basal area relation. The basic data of sap flow density as well as meteorological data are publicly accessible at doi:10.4228/ZALF.2005.312. (Supplementary Materials).
2.4. Simulation of Water Budget
For simulating the water budget, we used a modified version of the BIOME-BGC model (version 4.2) [29]. This model simulates the processes of water, carbon, and nitrogen dynamics in generalized biomes. An extended version of this model (version ZALF) allows for the simulation of managed forest stands, contains a multi-layer soil water model, and considers more species and site specificity. The included processes of the water budget are evaporation from canopy and soil; transpiration; stand precipitation as sum of canopy drop and stem flow, snow storage and snow melt, surface runoff, infiltration, drainage, and capillary rise. Potential transpiration was calculated by solving the Penman-Monteith equation, from which actual transpiration was derived applying a layer specific density function for soil water uptake over the root depth according to [30], described in [31]. This reduction function considers the vertical root distribution, and soil water availability. Drought was indicated by the number of days where relative extractable water available in the top 50 cm of soil (REW50) falls below 0.4 [32].
The effects of drought stress on the reduction of transpiration of each tree was normalized by relating transpiration to a high value according to equation 2, where Tmed is the median value of transpiration.
The soil water stress index (SWSI) as an eco-hydrological drought indicator was calculated following Equation (3) [33]:
From June to August 2002 and 2003, all days with drought stress (SWSI < 0) were distinguished from days without drought stress (SWSI ≥ 0). Within these two groups an analysis of transpiration reduction as a function of the basal area class of trees was performed.
The model was calibrated using observed data from the ICP Forest Level II plot, and the model was applied to calculate the water and carbon budgets of intensive monitoring plots [34,35]. In this study, the analysis focused on simulated transpiration and distribution of soil water uptake from different soil depths.
3. Results
3.1. Meteorology and Water Budget of the Ecosystem
The year 2003 was characterized by a summer drought, especially by low precipitation of 467 mm a−1, which contrasted with the excessively moist year of 2002 with an annual precipitation of 813 mm a−1 and two years of moderate precipitation (Table 2). The precipitation of 2003 was approximately 120 mm a−1 less than the long-term average. Additionally, the vapor pressure deficit (VPD) and the global radiation of the summer in 2003 were higher than average. Between 17% and 25% of annual precipitation was evaporated by the canopy. The remaining stand precipitation that entered the soil was considerably lower during the dry year. After subtracting transpiration, soil evaporation, and changes in soil storage, only 52 mm a−1 was drained from 2.5-m soil depth in 2003; this value is only 20% to 40% of the rates observed in other years. In the summer 2003, during 81 of 107 days REW50 values fell below 0.4 (Table 2).
Table 2.
Site conditions and water fluxes (mm a−1) at the study site during the four years of investigation. Values based on simulation results are marked by an asterisk (*). REW50 describes the number of days where the relative extractable water available in the top 50 cm of soil falls below 0.4.
Simulated daily transpiration rates agreed well with measured values (r2 = 0.734, T* = 0.86T + 0.19), even when the simulation model slightly overestimated low transpiration rates and underestimated high transpiration.
3.2. Canopy Transpiration and Soil Water Uptake
The total canopy transpiration measured during the 2002, 2003, 2004, and 2005 seasons was 213 mm, 237 mm, 235 mm, and 278 mm, respectively (Table 2). The maximum daily transpiration values of 3 mm were measured on bright summer days. On rainy days, the transpiration decreased. The seasonal course was unique in each year and corresponded to the shape of the REW50 and the VPD. In the drought year 2003, the canopy transpiration first attained a seasonal maximum in late spring. During summer, however, canopy transpiration decreased to values lower than 1 mm per day on hot days in August (Figure 1). These low transpiration rates in summer were compensated by relatively high values in late spring, leading to annual transpiration sum not different from 2004. This was indicated by the ratio of actual to potential transpiration (T/Tp, both simulated) decreased in 2003 from values greater than 0.82 to values of 0.59 and 0.57 in June and August, respectively.
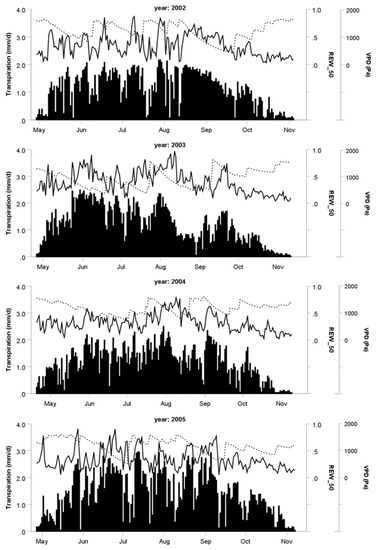
Figure 1.
Daily canopy transpiration (bars), VPD (solid lines), and REW50 (dotted lines) over four seasons (2002–2005).
On summer days with high radiation and well-watered conditions, whole-tree transpiration of a dominant beech tree (basal area class 2) was as high as 373 L per day. On the same day, a relatively small and suppressed tree (basal area class 10) transpired only 20 L. Furthermore, 55% of the total transpiration was caused by trees in basal area classes 1–3 (Figure 2). However, in 2003, this value decreased to 47%; in contrast, the portion of transpiration by suppressed trees (i.e., basal area classes 9 and 10) increased from approximately 7% to 10%.
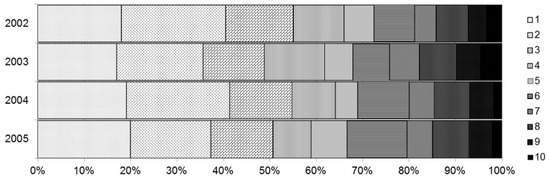
Figure 2.
Shares of ten basal area classes in the total canopy transpiration during the 2002, 2003, 2004, and 2005 growing seasons (class 1 = dominant, class 10 = suppressed).
Comparing days under drought stress (SWSI < 0) versus days without drought stress (SWSI ≥ 0) in the summer periods of 2002 and 2003, a different behavior of the 10 basal area classes regarding transpiration reduction was found (Figure 3). Dominant trees (class 1–3) reduced their transpiration under drought stress stronger than suppressed trees (class 8–10). On the other hand, dominant trees were able to increase transpiration under well-watered conditions more than suppressed trees. However, this result cannot be statistically confirmed due to high variance (Spearman-Rho = 0.107 for no drought, 0.069 for drought).
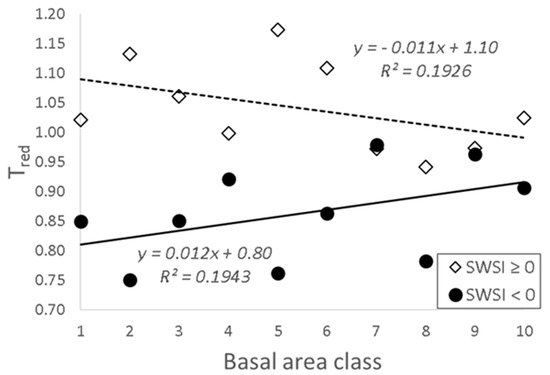
Figure 3.
Reduced transpiration of the 10 tree classes 2002 and 2003 under drought stress (SWSI < 0) and with sufficient water supply (SWSI ≥ 0). During periods of drought stress, dominant trees (class 1) reduced transpiration more than suppressed trees (class 10).
The higher contribution of suppressed trees to whole-canopy transpiration during periods of drought seems to correspond to a shift in the vertical distribution of fractions of soil water uptake from lower to upper layers (Figure 4). The percentage of soil water uptake from the upper humus-rich soil layers down to soil depths of 8 cm increased from 37% in 2002 to 43% in 2003.
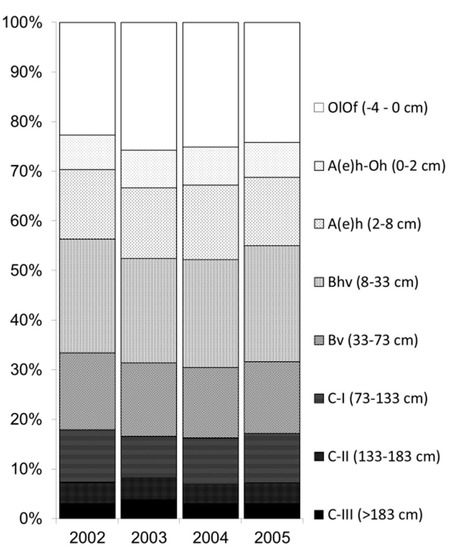
Figure 4.
Vertical distribution of relative soil water uptake over four years, based on simulation results of the water budget.
4. Discussion
The canopy transpiration rate of a European beech stand with a sufficient water supply depends on the topographical situation, the weather conditions, and the age and structure of the stand. Our results on the annual transpiration rates from our study site agree with the results described by other authors [26,36,37,38,39]. European beech is regarded as a relatively drought-sensitive tree species [40,41], but it is less sensitive in mixed stands than in pure stands; this range of sensitivity is partially dependent on the species type of the neighboring trees [42]. An investigation of various forests around the world has shown a pronounced drought sensitivity in larger trees and greater inherent vulnerability to hydraulic stress, and concluded that larger trees suffer more than smaller trees during drought [43]. Some studies measured higher growth declines in dominant trees than in suppressed trees in response to drought events [44,45,46]. With increasing tree height, a decrease in the mean canopy stomatal conductance of individual beech tree crowns was observed [47]; however, also an increasing stomatal conductance with beech tree height was reported [48]. Measurements along crowns demonstrate that stomata from leaves in the mid-canopy showed less sensitivity to drought than did stomata from leaves at the top of the trees. In our study, suppressed trees contributed to a higher fraction to canopy transpiration in 2003 than they did in the other years. In the dry year (2003), the stomata of leaves were presumably closed more often due to increased VPD and restricted soil water availability (Table 2). Therefore, the transpiration level was reduced. Exposed crown parts, however, were more strongly affected by those dry periods. Investigation of tree ring growth in different tree compartments of dominant mature beech trees revealed the highest growth variability and climate sensitivity in exposed upper crown parts [49].
In our investigation, the differing proportion of transpiration in the dry year of 2003 corresponded to the model results on the soil water budget, in which the contribution of shallow soil layers to the total water uptake increased. This result can be explained based on findings on the allometric relationships among stem and crown dimensions, biomass amounts, and leaf area in beech tress [24] and on the root system [50]: Coarse root biomass was related to diameter at breast height (DBH) of the trees and larger trees tended to grow deeper roots [51], but total fine root biomass of beech trees decreased with increasing stand age [52]. Young trees seemed to have less coarse roots and more fine roots, but the opposite was found for older trees. Therefore, it can be assumed that suppressed trees predominantly take water from the upper soil layers, while the dominant trees may have the opportunity to uptake water from the deeper soil layers. Dominant beech trees seem to invest relatively more biomass in coarse roots than do trees of lower social status [53]. Understory trees increased their fine root density close to the surface, and thus, these trees do not have access to water in the deeper soil, particularly when precipitation events are small; in contrast, overstory trees will benefit from water stored in deeper soil layers [54].
According to our simulation results, the fraction of water uptake is increased by shallow roots, but also by the deepest roots (>133 cm), while the proportion from the medium soil depth is reduced in the dry year of 2003 (Figure 4). This fact suggests that hydraulic lift mechanisms, such as those shown for oak [55], are possible at our study site. However, the authors could not find evidence for uplifted water in beech trees in a mixed forest. Hydraulic lift is the passive transfer of water through the roots from the wetter and deeper soil layers to the drier and shallower soil layers [56]. Hydraulic redistribution of soil water by roots could increase whole-stand water use up to 50% during a dry season [57].
When interpreting transpiration rates and the soil water budgets, we must consider that measured transpiration differed among single trees and their social status within the forest stand. In contrast, the soil water budget was calculated using a stand-specific simulation model without spatial differentiation. This model used a function of vertical fine root distribution and soil water availability to determine the vertical distribution of soil water uptake. A tree-specific simulation that uses specific fine root distributions could be advantageous, but this type of simulation requires data for model parameterization that is unavailable at the site.
Changes in the water consumption of trees of different social status during water shortages might be relevant for forest management. Generally, it is assumed that thinning increases soil water availability due to increased throughfall and reduced water uptake by the remaining trees [58]. A study on the climate sensitivity of radial growth of beech showed that dominant and co-dominant trees were more sensitive to dry conditions than intermediate trees [59]. This seems to correspond to our results, even though sensitivity to drought was defined differently, i.e., radial growth vs. transpiration. Presumably, the essential difference between trees of several basal area classes was their subtle differentiated adaptability to drought stress. Plants budget their water in very different ways and along a continuum that ranges from the water-conserving behavior displayed by isohydric plants to the ‘risk-taking’ behavior displayed by anisohydric plants [60,61]. Compared to very isohydric coniferous tree species, beech generally has a rather anisohydric water use strategy, and is a rather isohydric when compared to ring-porous oaks [62,63]. However, this could vary within the tree species. In this context, our hypothesis was confirmed: As shown in Figure 2 and Figure 3, dominant trees have more water-conservation behavior and higher adaptability to drought compared to suppressed trees. As a consequence for forest management, thinning a beech stand by eliminating suppressed individuals should result in increased stability under drought conditions.
5. Conclusions
Changes in the water consumption of different tree basal area classes during periods of water shortage might be relevant for forest management. Trees of different basal area classes have varying adaptability to drought stress. During the drought of 2003, the reduction in transpiration was relatively higher in dominant trees than in suppressed trees. The corresponding water uptake shifted from deeper to shallow soil layers. Beside reduced soil water availability diminished transpiration apparently resulted from stomata closure caused by increased VPD, which predominantly affected exposed crown parts. The share of soil water uptake from deeper layers decreased during drought. In the context of isohydric and anisohydric plant types, the behavior of dominant trees could be interpreted as a water-conserving strategy. Consequently, thinning by removing suppressed trees should be employed to stabilize forests under drought conditions.
Supplementary Materials
The basic data of sap flow density as well as meteorological data are publicly accessible at doi:10.4228/ZALF.2005.312.
Author Contributions
Both co-authors participated in conceptualization, methodology, software, formal analysis, validation, investigation, resources, data curation, review and editing; writing—original draft preparation, D.L.; project administration, H.J.; D.L measured and calculated sap flux; H.J. measured and simulated the water budget; All authors have read and agreed to the published version of the manuscript.
Funding
This research received no external funding.
Acknowledgments
The investigation was funded by institutional funding of the Leibniz Centre for Agricultural Landscape Research (ZALF). We thank Bodo Grossmann for construction and servicing the sap flux measuring systems and Kurt-Christian Kersebaum for language editing. The authors would like to thank the anonymous reviewers for their constructive comments, which contributed to the quality of this study.
Conflicts of Interest
The authors declare no conflict of interest.
References
- Blunden, J.; Arndt, D.S. State of the Climate in 2016. Bull. Amer. Meteor. Soc. 2017, 98, Si-S277. [Google Scholar] [CrossRef]
- Hlásny, T.; Mátyás, C.; Seidl, R.; Kulla, L.; Merganičová, K.; Trombik, J.; Dobor, L.; Barcza, Z.; Konôpka, B. Climate change increases the drought risk in Central European forests: What are the options for adaptation? Lesn. Cas. J. 2014, 60, 5–8. [Google Scholar] [CrossRef]
- Kjellstrom, E.; Nikulin, G.; Hansson, U.; Strandberg, G.; Ullerstig, A. 21st century changes in the European climate: Uncertainties derived from an ensemble of regional climate model simulations. Tellus Ser. A-Dyn. Meteorol. Oceanogr. 2011, 63, 24–40. [Google Scholar] [CrossRef]
- Bolte, A.; Ammer, C.; Löf, M.; Madsen, P.; Nabuurs, G.-J.; Schall, P.; Spathelf, P.; Rock, J. Adaptive forest management in central Europe: Climate change impacts, strategies and integrative concept. Scand. J. For. Res. 2009, 24, 471–480. [Google Scholar] [CrossRef]
- Geßler, A.; Keitel, C.; Kreuzwieser, J.; Matyssek, R.; Seiler, W.; Rennenberg, H. Potential risks for European beech (Fagus sylvatica L.) in a changing climate. Trees-Struct. Funct. 2007, 21, 1–11. [Google Scholar] [CrossRef]
- Dulamsuren, C.; Hauck, M.; Kopp, G.; Ruff, M.; Leuschner, C. European beech responds to climate change with growth decline at lower, and growth increase at higher elevations in the center of its distribution range (SW Germany). Trees-Struct. Funct. 2017, 31, 672–686. [Google Scholar] [CrossRef]
- Mausolf, K.; Härdtle, W.; Hertel, D.; Leuschner, C.; Fichtner, A. Impacts of multiple environmental change drivers on growth of European beech (Fagus sylvatica): Forest history matters. Ecosystems 2019. [Google Scholar] [CrossRef]
- Mausolf, K.; Wilm, P.; Hardtle, W.; Jansen, K.; Schuldt, B.; Sturm, K.; von Oheimb, G.; Hertel, D.; Leuschner, C.; Fichtner, A. Higher drought sensitivity of radial growth of European beech in managed than in unmanaged forests. Sci. Total Environ. 2018, 642, 1201–1208. [Google Scholar] [CrossRef]
- Cavin, L.; Jump, A.S. Highest drought sensitivity and lowest resistance to growth suppression are found in the range core of the tree Fagus sylvatica L. not the equatorial range edge. Glob. Chang. Biol. 2017, 23, 362–379. [Google Scholar] [CrossRef]
- Rebetez, M.; Mayer, H.; Dupont, O.; Schindler, D.; Gartner, K.; Kropp, J.P.; Menzel, A. Heat and drought 2003 in Europe: A climate synthesis. Ann. For. Sci. 2006, 63, 569–577. [Google Scholar] [CrossRef]
- Breda, N.; Huc, R.; Granier, A.; Dreyer, E. Temperate forest trees and stands under severe drought: A review of ecophysiological responses, adaptation processes and long-term consequences. Ann. For. Sci. 2006, 63, 625–644. [Google Scholar] [CrossRef]
- Ciais, P.; Reichstein, M.; Viovy, N.; Granier, A.; Ogee, J.; Allard, V.; Aubinet, M.; Buchmann, N.; Bernhofer, C.; Carrara, A.; et al. Europe-wide reduction in primary productivity caused by the heat and drought in 2003. Nature 2005, 437, 529–533. [Google Scholar] [CrossRef] [PubMed]
- Hentschel, R.; Hommel, R.; Poschenrieder, W.; Grote, R.; Holst, J.; Biernath, C.; Gessler, A.; Priesack, E. Stomatal conductance and intrinsic water use efficiency in the drought year 2003: A case study of European beech. Trees 2016, 30, 153–174. [Google Scholar] [CrossRef]
- Tyree, M.T.; Ewers, F.W. The hydraulic architecture of trees and other woody plants. New Phytol. 1991, 119, 345–360. [Google Scholar] [CrossRef]
- Cruiziat, P.; Cochard, H.; Ameglio, T. Hydraulic architecture of trees: Main concepts and results. Ann. For. Sci. 2002, 59, 723–752. [Google Scholar] [CrossRef]
- Aranda, I.; Cano, F.J.; Gasco, A.; Cochard, H.; Nardini, A.; Mancha, J.A.; Lopez, R.; Sanchez-Gomez, D. Variation in photosynthetic performance and hydraulic architecture across European beech (Fagus sylvatica L.) populations supports the case for local adaptation to water stress. Tree Physiol. 2015, 35, 34–46. [Google Scholar] [CrossRef]
- Kaufmann, M.R.; Kelliher, F.M. Measuring transpiration rates. In Techniques and Approaches in Forest Tree Ecophysiology; Lassoie, J.P., Hinckley, T.M., Eds.; CRC Press: Boca Raton, FL, USA, 1991; pp. 117–140. [Google Scholar]
- Čermák, J.; Kučera, J.; Nadezhdina, N. Sap flow measurements with some thermodynamic methods, flow integration within trees and scaling up from sample trees to entire forest stands. Trees 2004, 18, 529–546. [Google Scholar] [CrossRef]
- Dalsgaard, L.; Mikkelsen, T.N.; Bastrup-Birk, A. Sap flow for beech (Fagus sylvatica L.) in a natural and a managed forest—effect of spatial heterogeneity. J. Plant Ecol. 2011, 4, 23–35. [Google Scholar] [CrossRef]
- Diaconu, D.; Kahle, H.P.; Spiecker, H. Thinning increases drought tolerance of European beech: A case study on two forested slopes on opposite sides of a valley. Eur. J. For. Res. 2017, 136, 319–328. [Google Scholar] [CrossRef]
- Jochheim, H.; Einert, P.; Ende, H.-P.; Kallweit, R.; Lüttschwager, D.; Schindler, U. Wasser- und Stoffhaushalt eines Buchen-Altbestandes im Nordostdeutschen Tiefland - Ergebnisse einer 4jährigen Messperiode. Arch. Für Forstwes. Und Landsch. 2007, 41, 1–14. [Google Scholar]
- Sommer, M.; Jochheim, H.; Höhn, A.; Breuer, J.; Zagorski, Z.; Busse, J.; Barkusky, D.; Meier, K.; Puppe, D.; Wanner, M.; et al. Si cycling in a forest biogeosystem - the importance of transient state biogenic Si pools. Biogeosciences 2013, 10, 4991–5007. [Google Scholar] [CrossRef]
- Kallweit, R.; Kätzel, R. Einleitung. In Forstliche Umweltkontrolle—Ergebnisse aus Zehnjährigen Untersuchungen zur Wirkung von Luftverunreinigungen in Brandenburgs Wäldern; Landesforstanstalt Eberswalde (LFE): Eberswalde, Germany, 2001; pp. 8–15. [Google Scholar]
- Bartelink, H.H. A model of dry matter partitioning in trees. Tree Physiol. 1998, 18, 91–101. [Google Scholar] [CrossRef] [PubMed]
- Granier, A. Une novelle méthode pour la mesure du flux de sève brute dans le tronc des arbres. Ann. For. Sci. 1985, 42, 193–200. [Google Scholar] [CrossRef]
- Granier, A.; Biron, P.; Lemoine, D. Water balance, transpiration and canopy conductance in two beech stands. Agric. For. Meteorol. 2000, 100, 291–308. [Google Scholar] [CrossRef]
- Lüttschwager, D.; Remus, R. Radial distribution of sap flux density in trunks of a mature beech stand. Ann. Sci. 2007, 64, 431–438. [Google Scholar] [CrossRef]
- Saveyn, A.; Steppe, K.; Lemeur, R. Spatial variability of xylem sap flow in mature beech (Fagus sylvatica) and its diurnal dynamics in relation to microclimate. Botany 2008, 86, 1440–1448. [Google Scholar] [CrossRef]
- Thornton, P.E.; Law, B.E.; Gholz, H.L.; Clark, K.L.; Falge, E.; Ellsworth, D.S.; Goldstein, A.H.; Monson, R.K.; Hollinger, D.; Falk, M.; et al. Modeling and measuring the effects of disturbance history and climate on carbon and water budgets in evergreen needleleaf forests. Agric. For. Meteorol. 2002, 113, 185–222. [Google Scholar] [CrossRef]
- Koitzsch, R.; Helling, R.; Vetterlein, E. Simulation des Bodenfeuchteverlaufs unter Berücksichtigung der Wasserbewegung und des Wasserentzuges durch Pflanzenbestände. Arch. Für Acker- Und Pflanzenbau Und Bodenkd. 1980, 24, 717–725. [Google Scholar]
- Mirschel, W.; Wenkel, K.-O.; Koitzsch, R. Simulation of soil water and evapotranspiration using the model BOWET and data sets from Krummbach and Eisenbach, two research catchments in North Germany. Ecol. Model. 1995, 81, 53–69. [Google Scholar] [CrossRef]
- Breda, N.; Granier, A. Intra- and interannual variations of transpiration, leaf area index and radial growth of a sessile oak stand (Quercus petraea). Ann. For. Sci. 1996, 53, 521–536. [Google Scholar] [CrossRef]
- Aguilos, M.; Stahl, C.; Burban, B.; Hérault, B.; Courtois, E.; Coste, S.; Wagner, F.; Ziegler, C.; Takagi, K.; Bonal, D. Interannual and Seasonal Variations in Ecosystem Transpiration and Water Use Efficiency in a Tropical Rainforest. Forests 2019, 10, 14. [Google Scholar] [CrossRef]
- Jochheim, H.; Puhlmann, M.; Beese, F.; Berthold, D.; Einert, P.; Kallweit, R.; Konopatzky, A.; Meesenburg, H.; Meiwes, K.J.; Raspe, S.; et al. Modelling the carbon budget of intensive forest monitoring sites in Germany using the simulation model BIOME-BGC. Iforest Biogeosciences For. 2009, 2, 7–10. [Google Scholar] [CrossRef]
- Jochheim, H.; Janott, M.; Granke, O.; Olschofsky, K.; Fischer, R.; Fleck, S.; Kallweit, R.; Schulz, C. Modelling the Carbon Budget of Forests at Intensive Monitoring Plots under Current and Future Climate with Biome-BGC; Leibniz Centre for Agricultural Landscape Research (ZALF): Müncheberg, Germany, 2011; p. 98. [Google Scholar]
- Keitel, C.; Adams, M.A.; Holst, T.; Matzarakis, A.; Mayer, H.; Rennenberg, H.; Gessler, A. Carbon and oxygen isotope composition of organic compounds in the phloem sap provides a short-term measure for stomatal conductance of European beech (Fagus sylvatica L.). Plant Cell Environ. 2003, 26, 1157–1168. [Google Scholar] [CrossRef]
- Schipka, F.; Heimann, J.; Leuschner, C. Regional variation in canopy transpiration of Central European beech forests. Oecologia 2005, 143, 260–270. [Google Scholar] [CrossRef]
- Schmidt, M.W.T. Canopy Transpiration of Beech Forests in Northern Bavaria—Structure and Function in Pure and Mixed Stands with Oak at Colline and Montane Sites; Universität Bayreuth: Bayreuth, Germany, 2007. [Google Scholar]
- Baumgarten, M.; Weis, W.; Kühn, A.; May, K.; Matyssek, R. Forest transpiration—Targeted through xylem sap flux assessment versus hydrological modeling. Eur. J. For. Res. 2014, 133, 677–690. [Google Scholar] [CrossRef]
- Kozlowski, T.T.; Kramer, P.J.; Pallardy, S.G. The Physiological Ecology of Woody Plants; Academic Press: San Diego, CA, USA, 1991. [Google Scholar]
- Czajkowski, T.; Ahrends, B.; Bolte, A. Critical limits of soil water availability (CL-SWA) for forest trees—An approach based on plant water status. Landbauforsch. Vti Agric. For. Res. 2009, 2, 87–94. [Google Scholar]
- Mölder, I.; Leuschner, C. European beech grows better and is less drought sensitive in mixed than in pure stands: Tree neighbourhood effects on radial increment. Trees-Struct. Funct. 2014, 28, 777–792. [Google Scholar] [CrossRef]
- Bennett, A.C.; McDowell, N.G.; Allen, C.D.; Anderson-Teixeira, K.J. Larger trees suffer most during drought in forests worldwide. Nat. Plants 2015, 1. [Google Scholar] [CrossRef]
- Liu, Y.; Muller, R.N. Effect of drought and frost on radial growth of overstory and understory stems in a deciduous forest. Am. Midl. Nat. 1993, 129, 19–25. [Google Scholar] [CrossRef]
- Martínez-Vilalta, J.; Lopez, B.C.; Loepfe, L.; Lloret, F. Stand- and tree-level determinants of the drought response of Scots pine radial growth. Oecologia 2012, 168, 877–888. [Google Scholar] [CrossRef]
- Zang, C.; Pretzsch, H.; Rothe, A. Size-dependent responses to summer drought in Scots pine, Norway spruce and common oak. Trees-Struct. Funct. 2012, 26, 557–569. [Google Scholar] [CrossRef]
- Schäfer, K.V.R.; Oren, R.; Tenhunen, J.D. The effect of tree height on crown level stomatal conductance. Plant Cell Environ. 2000, 23, 365–375. [Google Scholar] [CrossRef]
- Van Wittenberghe, S.; Adriaenssens, S.; Staelens, J.; Verheyen, K.; Samson, R. Variability of stomatal conductance, leaf anatomy, and seasonal leaf wettability of young and adult European beech leaves along a vertical canopy gradient. Trees-Struct. Funct. 2012, 26, 1427–1438. [Google Scholar] [CrossRef]
- Latte, N.; Lebourgeois, F.; Claessens, H. Growth partitioning within beech trees (Fagus sylvatica L.) varies in response to summer heat waves and related droughts. Trees-Struct. Funct. 2016, 30, 189–201. [Google Scholar] [CrossRef]
- Bolte, A.; Rahmann, T.; Kuhr, M.; Pogoda, P.; Murach, D.; Von Gadow, K. Relationships between tree dimension and coarse root biomass in mixed stands of European beech (Fagus sylvatica L.) and Norway spruce (Picea abies L. Karst.). Plant Soil 2004, 264, 1–11. [Google Scholar] [CrossRef]
- Kuhr, M. Grobwurzelarchitektur in Abhängigkeit von Baumart, Alter, Standort und Sozialer Stellung; Georg-August-Universität Göttingen: Göttingen, Germany, 2000. [Google Scholar]
- Finér, L.; Helmisaari, H.S.; Lõhmus, K.; Majdi, H.; Brunner, I.; Børja, I.; Eldhuset, T.; Godbold, D.; Grebenc, T.; Konôpka, B.; et al. Variation in fine root biomass of three European tree species: Beech (Fagus sylvatica L.), Norway spruce (Picea abies L. Karst.), and Scots pine (Pinus sylvestris L.). Plant Biosyst. 2007, 141, 394–405. [Google Scholar] [CrossRef]
- Le Goff, N.; Ottorini, J.M. Root biomass and biomass increment in a beech (Fagus sylvatica L.) stand in North-East France. Ann. For. Sci. 2001, 58, 1–13. [Google Scholar] [CrossRef]
- Grote, R.; Gessler, A.; Hommel, R.; Poschenrieder, W.; Priesack, E. Importance of tree height and social position for drought-related stress on tree growth and mortality. Trees 2016, 30, 1467–1482. [Google Scholar] [CrossRef]
- Zapater, M.; Hossann, C.; Breda, N.; Brechet, C.; Bonal, D.; Granier, A. Evidence of hydraulic lift in a young beech and oak mixed forest using O-18 soil water labelling. Trees-Struct. Funct. 2011, 25, 85–894. [Google Scholar] [CrossRef]
- Caldwell, M.M.; Richards, J.H. Hydraulic lift—Water efflux from upper roots improves effectiveness of water-uptake by deep roots. Oecologia 1998, 79, 1–5. [Google Scholar] [CrossRef]
- Domec, J.C.; King, J.S.; Noormets, A.; Treasure, E.; Gavazzi, M.J.; Sun, G.; McNulty, S.G. Hydraulic redistribution of soil water by roots affects whole-stand evapotranspiration and net ecosystem carbon exchange. New Phytol. 2010, 187, 171–183. [Google Scholar] [CrossRef] [PubMed]
- Breda, N.; Granier, A.; Aussenac, G. Effects of thinning on soil and tree water relations, transpiration and growth in an oak forest (Quercus petraea (Matt.) Liebl.). Tree Physiol. 1995, 15, 295–306. [Google Scholar] [CrossRef] [PubMed]
- Van der Maaten, E. Climate sensitivity of radial growth in European beech (Fagus sylvatica L.) at different aspects in southwestern Germany. Trees-Struct. Funct. 2012, 26, 777–788. [Google Scholar] [CrossRef]
- Attia, Z.; Domec, J.C.; Oren, R.; Way, D.A.; Moshelion, M. Growth and physiological responses of isohydric and anisohydric poplars to drought. J. Exp. Bot. 2015, 66, 4373–4381. [Google Scholar] [CrossRef] [PubMed]
- Martínez-Sancho, E.; Vásconez-Navas, L.K.; Seidel, H.; Dorado-Liñán, I.; Menz, A. Responses of contrasting tree functional types to air warming and drought. Forests 2017, 8, 450. [Google Scholar] [CrossRef]
- Magh, R.K.; Bonn, B.; Grote, R.; Burzlaff, T.; Pfautsch, S.; Rennenberg, H. Drought superimposes the positive effect of Silver Fir on water relations of European Beech in mature forest stands. Forests 2019, 10, 897. [Google Scholar] [CrossRef]
- Klein, T. The variability of stomatal sensitivity to leaf water potential across tree species indicates a continuum between isohydric and anisohydric behaviours. Funct. Ecol. 2014, 28, 1313–1320. [Google Scholar] [CrossRef]


© 2020 by the authors. Licensee MDPI, Basel, Switzerland. This article is an open access article distributed under the terms and conditions of the Creative Commons Attribution (CC BY) license (http://creativecommons.org/licenses/by/4.0/).