Article

Are Climate Factors Driving the Contemporary Wildfire Occurrence in China?

1
College of Forestry, Northeast Forestry University, Harbin 150040, China
2
Key Laboratory of Geographical Processes and Ecological Security in Changbai Mountains, Ministry of Education, School of Geographical Sciences, Northeast Normal University, Changchun 130024, China
3
School of Environmental and Forest Sciences, University of Washington, Seattle, WA 98195, USA
4
College of Forestry, Fujian Agriculture and Forestry University, Fuzhou 350002, China
5
Asia Forest Research Centre, Faculty of Forestry, University of British Columbia, Vancouver, BC V6T 1Z4, Canada
*
Authors to whom correspondence should be addressed.
Forests 2021, 12(4), 392; https://doi.org/10.3390/f12040392
Submission received: 9 February 2021 / Revised: 22 March 2021 / Accepted: 23 March 2021 / Published: 26 March 2021
(This article belongs to the Section Forest Ecology and Management)

Abstract

:
Understanding the drivers of wildfire occurrence is of great value for fire prevention and management, but due to the variation in research methods, data sources, and data resolution of those studies, it is challenging to conduct a large-scale comprehensive comparative qualitative analysis on the topic. China has diverse vegetation types and topography, and has undergone rapid economic and social development, but experiences a high frequency of wildfires, making it one of the ideal locations for wildfire research. We applied the Random Forests modelling approach to explore the main types of wildfire drivers (climate factors, landscape factors and human factors) in three high wildfire density regions (Northeast (NE), Southwest (SW), and Southeast (SE)) of China. The results indicate that climate factors were the main driver of wildfire occurrence in the three regions. Precipitation and temperature significantly impacted the fire occurrence in the three regions due to the direct influence on the moisture content of forest fuel. However, wind speed had important influence on fire occurrence in the SE and SW. The explanation power of the landscape and human factors varied significantly between regions. Human factors explained 40% of the fire occurrence in the SE but only explained less than 10% of the fire occurrence in the NE and SW. The density of roads was identified as the most important human factor driving fires in all three regions, but railway density had more explanation power on fire occurrence in the SE than in the other regions. The landscape factors showed nearly no influence on fire occurrence in the NE but explained 46.4% and 20.6% in the SE and SW regions, respectively. Amongst landscape factors, elevation had the highest average explanation power on fire occurrence in the three regions, particularly in the SW. In conclusion, this study provides useful insights into targeted fire prediction and prevention, which should be more precise and effective under climate change and socio-economic development.

1. Introduction

With increasing human development and associated climate change, the frequency of wildfires, particularly megafires, has escalated worldwide in recent years, seriously affecting the atmospheric environment, forest ecology, and the safety of humans and wildlife. Globally, the length of the fire season increased by 19% from 1979 to 2013 [1], and this trend of longer fire seasons [2], larger fires [3], more homes burned, and more frequent large evacuations [4] is expected to continue. In 2016, the Fort McMurray Fire in Alberta, Canada caused a mandatory citywide evacuation and the loss of 2400 homes and commercial structures [5]. In 2018, wildfires in California, including the Woolsey Fire and the Camp Fire, killed at least 86 people, destroyed more than 18,000 structures, and led to the evacuation of 200,000 people, becoming California’s deadliest and most destructive wildfire season on record [6]. With climate change and population growth, more unprecedented challenges related to wildfires are expected [7].
Although there is an agreement on the importance of wildfire prevention, the causes of forest fires are still too complicated for a consensus. Many studies agree that climate change has driven wildfire regimes over long-term scales; however, other studies state that some nonmeteorological factors, especially socio-economic factors, such as road density and GDP, should be considered as leading drivers of modern wildfire regimes [8,9]. This view point is widely disputed in modern wildfire studies, and affects fire management policies in various regions. A considerable number of fire driver identification studies have been carried out in different forest ecosystems across the world [10,11,12], consistently indicating that fire drivers and their influences vary regionally, and that the interactions between drivers have multiple dynamic effects on forest fires [10,13]. In addition, other technical factors, including modelling approaches, data resolution, and study scale in time and space, can lead to large differences in identification of fire drivers for the same region, such as in the Chinese boreal forest [14,15], the Canadian boreal forest [16,17], and the Mediterranean region [17,18].
China has diverse vegetation types and topography, rapid economic and social development, strict wildfire management systems, and a high frequency of wildfires. A diversity of fire hotspot density is mainly observed in Northeast, Southeast and Southeast China due to the heterogeneity in vegetation types, climate and other factors. The Chinese Government has made great effort in wildfire management. “Prevention and Suppression” is the core principle of wildfire management in China, implemented after the catastrophic fire in 1987 (the Black Dragon fire), which burned 1.1 million ha of forest, and caused the deaths of more than 200 people. However, currently there is a lack of comprehensive understanding about fire drivers across China given the regional focus of studies, combined with the variation in data sources, methodological and other technical factors, which limits the development of adequate and consistent national forest fire management policies and a global understanding of the fire characteristics.
Taking all aforementioned factors into consideration, three regions that are hotspots of fire density, including the Daxing’an Mountains in Northeast China (NE), Yunnan and Guizhou provinces in Southwest China (SW), and Fujian and Zhejiang provinces in Southeast China (SE), were selected for this study. The same potential fire drivers and technical factors were applied in the three regions in order to achieve a comparable and comprehensive research result. The main objectives of this study were to: (1) reveal the relative importance of climate factors in influencing the wildfire occurrence; (2) identify if the major fire drivers vary spatially in China; (3) and fill a research gap on the drivers of contemporary wildfires in China at a national scale.

2. Materials and Methods
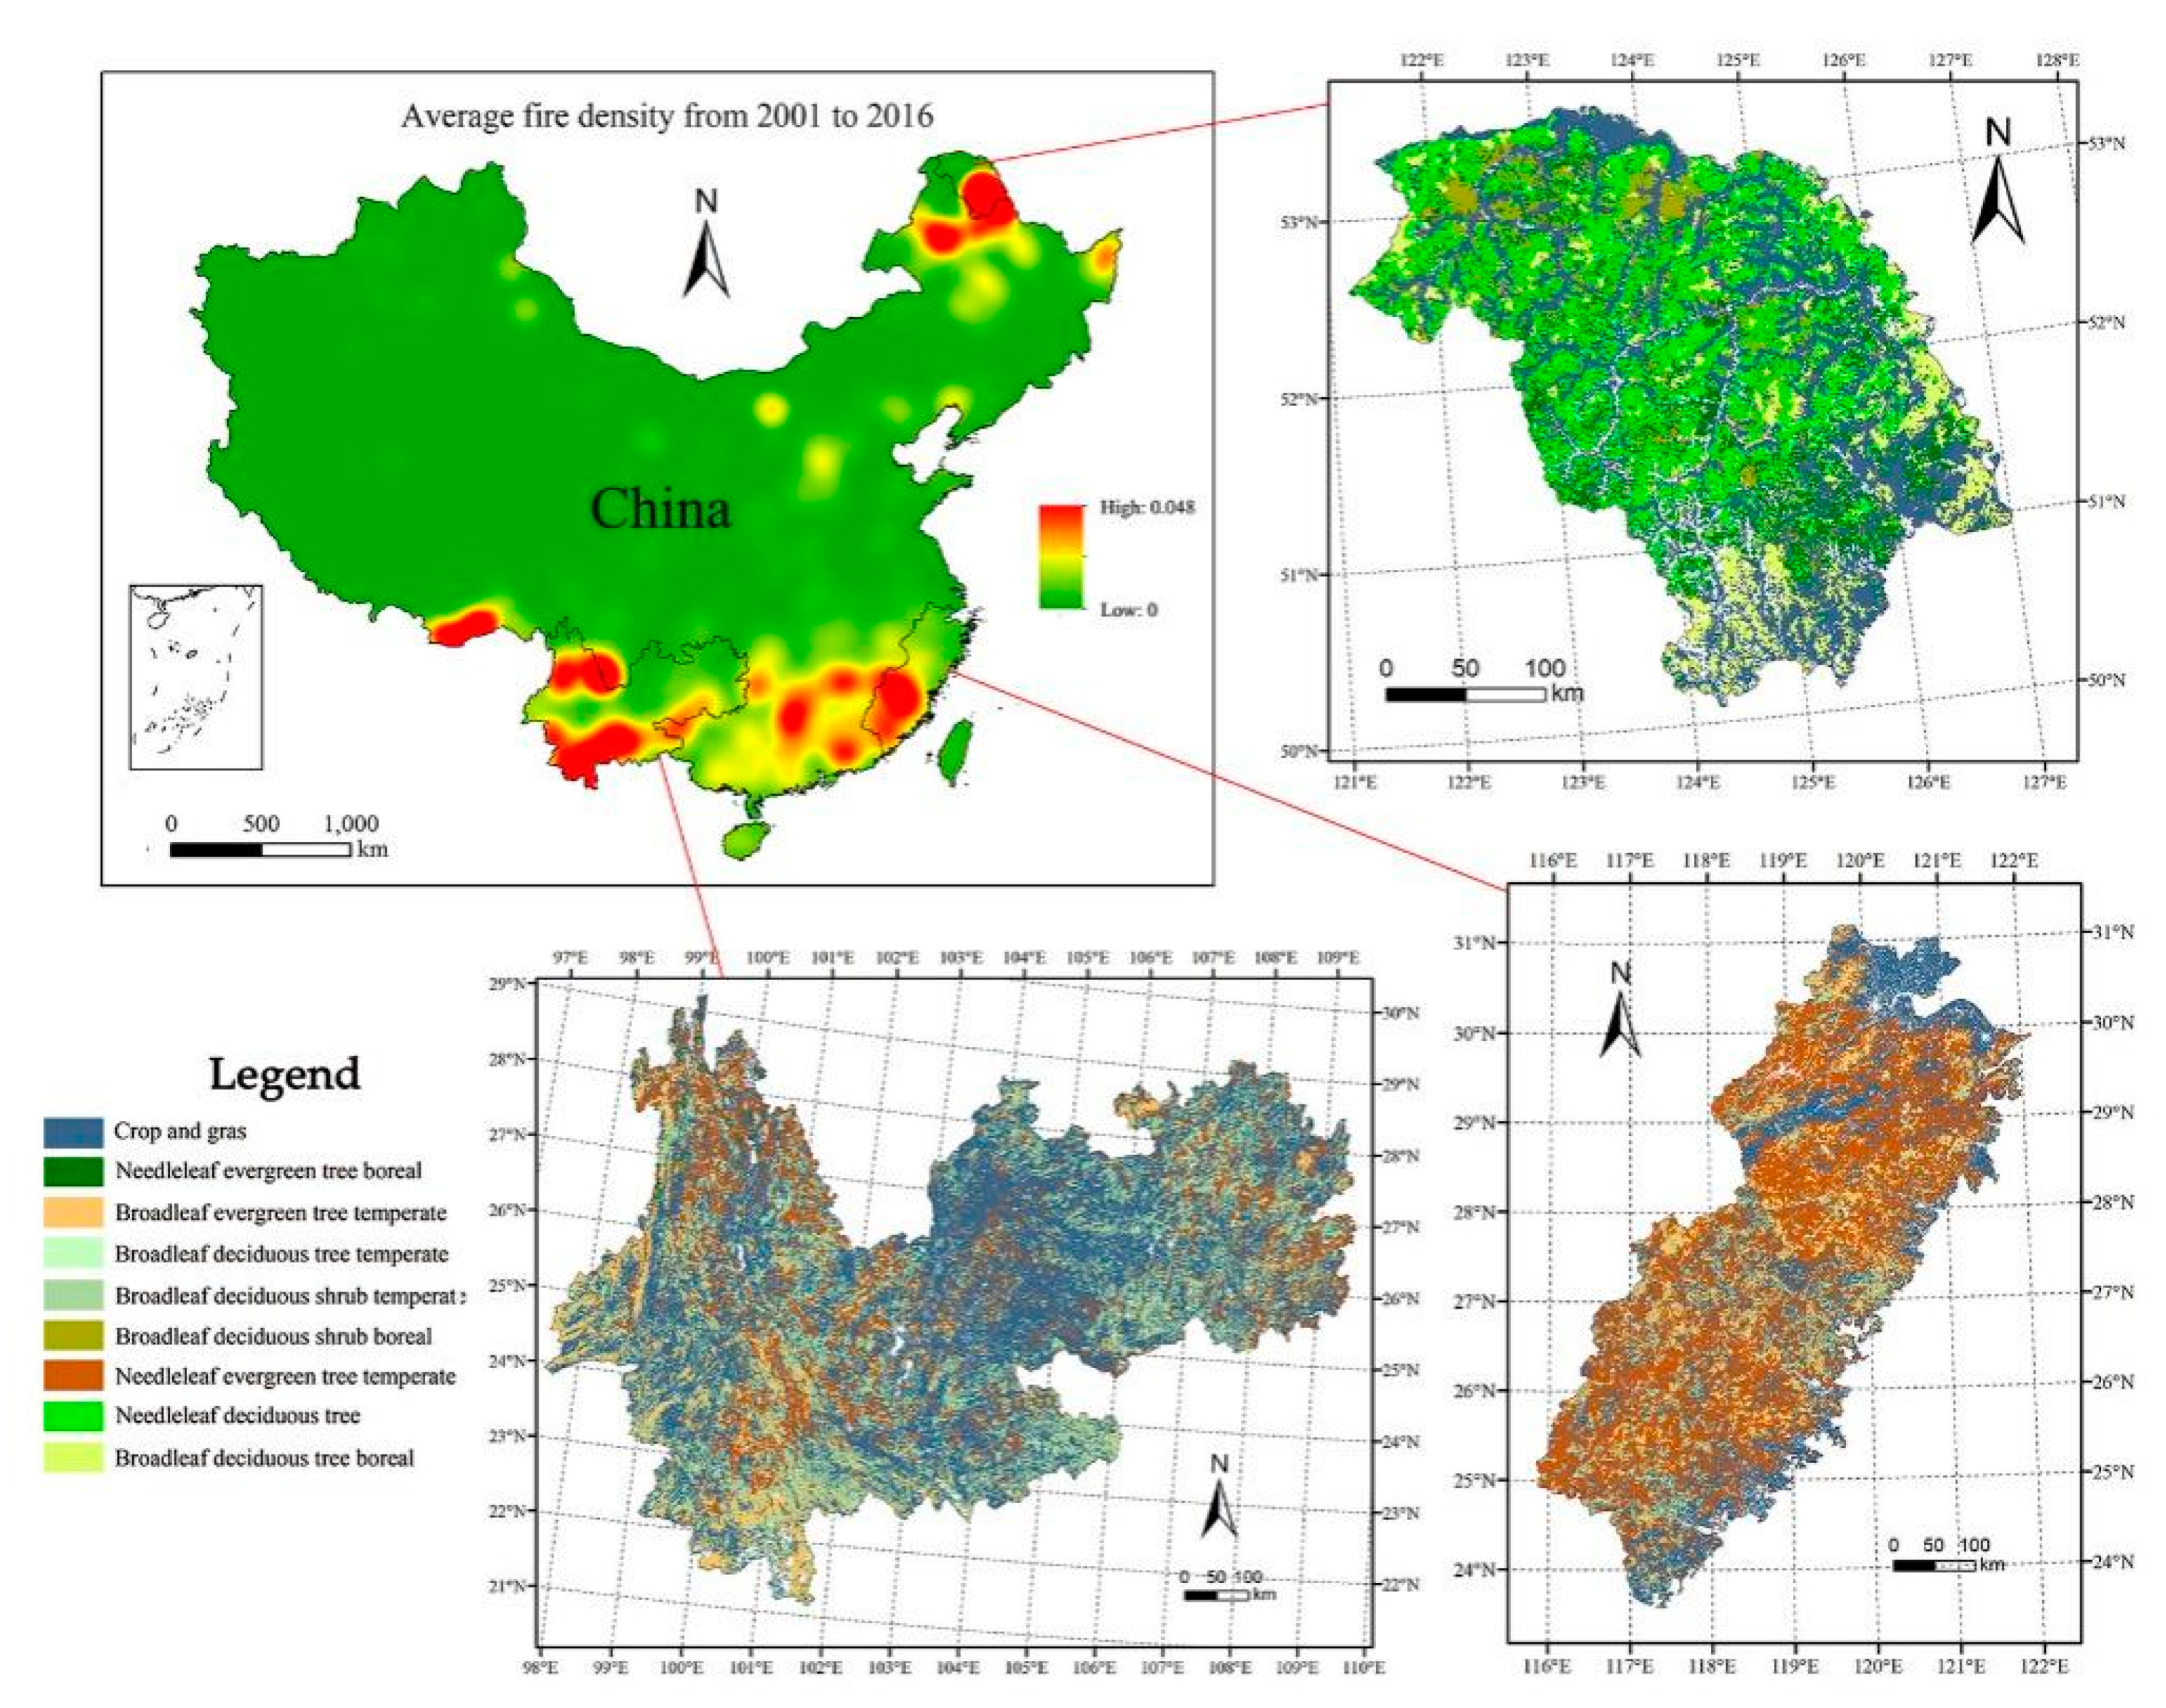
2.1. Study Area

Three regions in China with high fire hotspot density were selected as the study area (Figure 1). A description of the natural landscapes, socioeconomic conditions, forest types, and fire regimes of these three regions can be found in Table 1.

2.2. Fire Data (Dependent Variable)

A complete historical field record of wildfire data has been kept by the Chinese government since 1950, although fire data was only documented at a national level until 1999. Fire data at the provincial level are available for years after 1999, but they lack spatial location (i.e., coordinates) of the burned areas, which leads to uncertainty in fire driver analysis between different study regions. Instead, remote sensing data obtained by the Moderate Resolution Imaging Spectrometer (MODIS) radiometer Terra and Aqua satellites have been used as a suitable and reliable source for monitoring vegetation fires [23]. MODIS fire products (MOD14A1) (https://lpdaac.usgs.gov/products/mod14a1v006/, accessed on 15 March 2020) were consistently used from 2001 to 2017 in the three study regions.
MOD14A1 is a rapid-response fire product for operational near-real time active fires (“hotspots”) data users with a daily timescale and at 1 km of spatial resolution [24]. Combined to a land cover map of China (generated in 2000 with also 1 km of spatial resolution (http://westdc.westgis.ac.cn, accessed on 8 March 2019), only fire ignitions that occurred within vegetation regions were included in this study. Additionally, a hotspots filter process, designed in the R language, was conducted to minimize errors caused by repeated recordings of a fire point. The filter principle is based on the distance between two active fires and the time of fire occurrence. If the active fires were detected on the same day and the distance between the active fires was less than 1 km, we treated the active fires as the same fire. Due to the strict forest fire fighting policy, forest fires, especially those that occur in the subtropical regions of China, will generally be suppressed within 24 h and are unlikely to spread too far. It is important to note that this filter was designed conservatively, and if fire behavior in a region spreads quickly, the filter “distance” may be greater than 1 km.
The Random Forests modelling approach that requires continuous dependent variables (e.g., fire density) [18,25] was applied in this study. To derive a continuous dependent variable, we used the nonparametric method Kernel Density Estimation (KDE) to create a continuous fire occurrence density surface based on the spatial fire ignitions. KDE has been widely applied in many fire drivers studies in recent years [18,26]. We generated a fire density map for each study region with 500 m × 500 m grid based on the KDE module in the ArcGIS 19.0 software. The fire density maps were then scaled up to 8 km × 8 km grids within each study region. The extraction of corresponding independent variables for dependent variable was conducted based on the density grids using an overlay analysis in ArcGIS 19.0 software. The same bandwidth was used for the three study regions during the KDE calculations in order to maintain comparability of results.

2.3. Influencing Factors (Independent Variables)

We classified all potential influencing factors into three categories: climate, landscape and human factors. Fire driver analysis for the three regions was performed initially based on individual category, and then on the combined factors.

2.3.1. Climate Factors

The major climate factors that drive fire occurrence include temperature, relative humidity, wind speed and precipitation [27,28], and the climate factors of the previous fire season can significantly influence future fire occurrence [29]. In this study, the air temperature, relative humidity, wind speed and precipitation of current and previous fire season were used for the analysis. The fire season varies in different regions of China; in the NE, it extends from March to July and September to November; in the SE from September to April of the following year; and in the SW from October to June of the following year. The climate dataset was generated by the Geographical Sciences and Resources Research Institute, Chinese Academy of Sciences. The data generating process was based on the combination of reanalysis dataset from National Centre for Environmental Prediction (NCEP)/National Center for Atmospheric Research (NCAR) with Modis Normalized Differential Vegetation Index (NDVI) (http://www.gscloud.cn, accessed on 15 March 2020) and Digital Elevation Model (GLS DEM) (7 data). Validation results show a high data quality, with an R2 value between 0.86 and 0.95 [30]. These data were downloaded in the Earth System Science Data Sharing Platform, China (http://www.geodata.cn/index.html, accessed on 15 March 2020). Since fire density was calculated annually, only fire season climate variables were included. The fire season climate variables of each grid were retrieved and correspondingly used in the analysis of continuous fire density. The climate variables (temperature, relative humidity, wind speed and precipitation) were interpolated using the ANUSPLIN method and ArcGIS grid calculator was applied to process the data and generate the average value of variables of each grid.

2.3.2. Landscape Factors

Landscape factors in this study refer to those related to topography and vegetation variables. More specifically, these include the average slope (°), elevation (m), NDVI (Normalized Difference Vegetation Index) (0–1), GVMI (Global Vegetation Moisture Index) of each grid and the proportion of land cover (forest, shrub, grass and crop) in each grid.
Elevation and slope (steepness) can affect the amount and structure of vegetation that are closely associate with fire occurrence. The value of elevation and slope of each grid was retrieved from the Digital Elevation Model (DEM) (resolution 25 m) dataset collected from the National Administration of Surveying, Mapping and Geoinformation of China (http://ngcc.cn/article//sjcg/dlg, accessed on 15 March 2020) and was used directly in the modelling process.
Both NDVI and GVMI were included as Landscape factors in the study. NDVI was used to calculate the Fractional vegetation cover (FVC) which is a simple graphical indicator that can be used to assess whether the observed target contains live or dead vegetation [31]. FVC was considered as a proxy of the corresponding fuel amount and GVMI was used to represent the fuel moisture in this study.
GVMI is derived from Systeme Probatoire d’Observation de la Terre (SPOT) Vegetation data [32] to estimate vegetation moisture. It is built on combination of near-infrared and short-wave infrared regions of the electromagnetic spectrum. In this paper, near-infrared and short wave infrared bands’ corresponding MODIS bands are band2 (841−876 nm) and band6 (1628−1652 nm), were used to calculate the GVMI. As MODIS products, the MOD09A1 product provides calibrated reflectance for seven spectral bands at 500 m pixel resolution and 8-day temporal resolution. Seventeen images from MODO9A1 during 2001–2017 that cover mainland China were downloaded (https://e4ftl01.cr.usgs.gov/MOLT/MOD09A1.006/, accessed on 15 March 2020). The batch processing tool (MODIS Reprojection Tool, MRT) was used to splice and project the downloaded MODIS images and the images were resampled into 1 km. A detailed statement about the calculation of GVMI can be found in Liu et al. 2009.
The proportion of forest, shrub, grass and crop in each grid were calculated using ArcGIS 19.0 software based on the digital map of vegetation type (1:1,000,000) generated by the resources and environment science data center, Chinese Academy of Sciences (http://www.resdc.cn/Default.aspx, accessed on 29 July 2020).

2.3.3. Human Factors

Human factors in this study refer to those related to socio-economic factors, including density of railway, density of road, Gross Domestic Product (GDP), population density and proportion of residential area in each grid.
The variables railway, residential area, and road were retrieved based on a 1:250,000 Digital Line Graphic (DLG) map generated in 2000 by the National Administration of Surveying, Mapping and Geoinformation of China (http://ngcc.cn/article//sjcg/dlg, accessed on 8 March 2019).
Gridded demographic and socioeconomic data were obtained from the Resource and Environment Data Cloud Platform provided by the Chinese Academy of Sciences (http://www.resdc.cn/doi, accessed on 29 July 2020). These data include grid population density and per capita GDP for the years 2000, 2003, 2005, and 2010 at a 1-km resolution. Based on these data, the Raster Calculator tool in Arcgis v19 software was used to calculate the average annual growth rates of population and GDP from 2000 to 2010, and population and GDP data for 2011–2017 were generated based on the growth rates. Results were then connected with fire points and control points using the ArcGIS Raster Extraction tool.

2.4. Data Analysis

Random Forests (RF) modelling approach, which is a nonparametric technique derived from regression trees that can handle continuous dependent variables, was used in this study. RF is a combination of many trees, where each tree is generated by bootstrap samples, leaving about a third of the overall sample for validation (the out-of-bag predictions (OOB)). RF can select important variables and calculate the relative importance of each independent variable automatically no matter how many variables are used initially (Cutler et al., 2007). This method has been demonstrated to have a high prediction accuracy, high tolerance to outliers and “noise” [33,34], and has been widely applied in many different research fields in the past [35,36], particularly in studies related to wildfire drivers in recent years [18,37]. RF generates variable importance measures for a given variable by comparing increases in OOB error when that variable is randomly permuted while all others remain unchanged [38,39].

3. Results

3.1. Relation of Climate Factors to Fire Occurrence

Precipitation, wind speed and temperature were the main drivers of fire occurrence in the SE and SW regions, with similar impact factors; however, wind speed did not show an important effect in the NE but relative humidity did instead (Figure 2a). Overall, wind speed is the most important factor in all three regions, and relative humidity of “one year prior to fire” has the lowest influence on fire occurrence. Among the three regions, climate factors have relatively greater impact in the SW and SE than in the NE (Figure 2b).

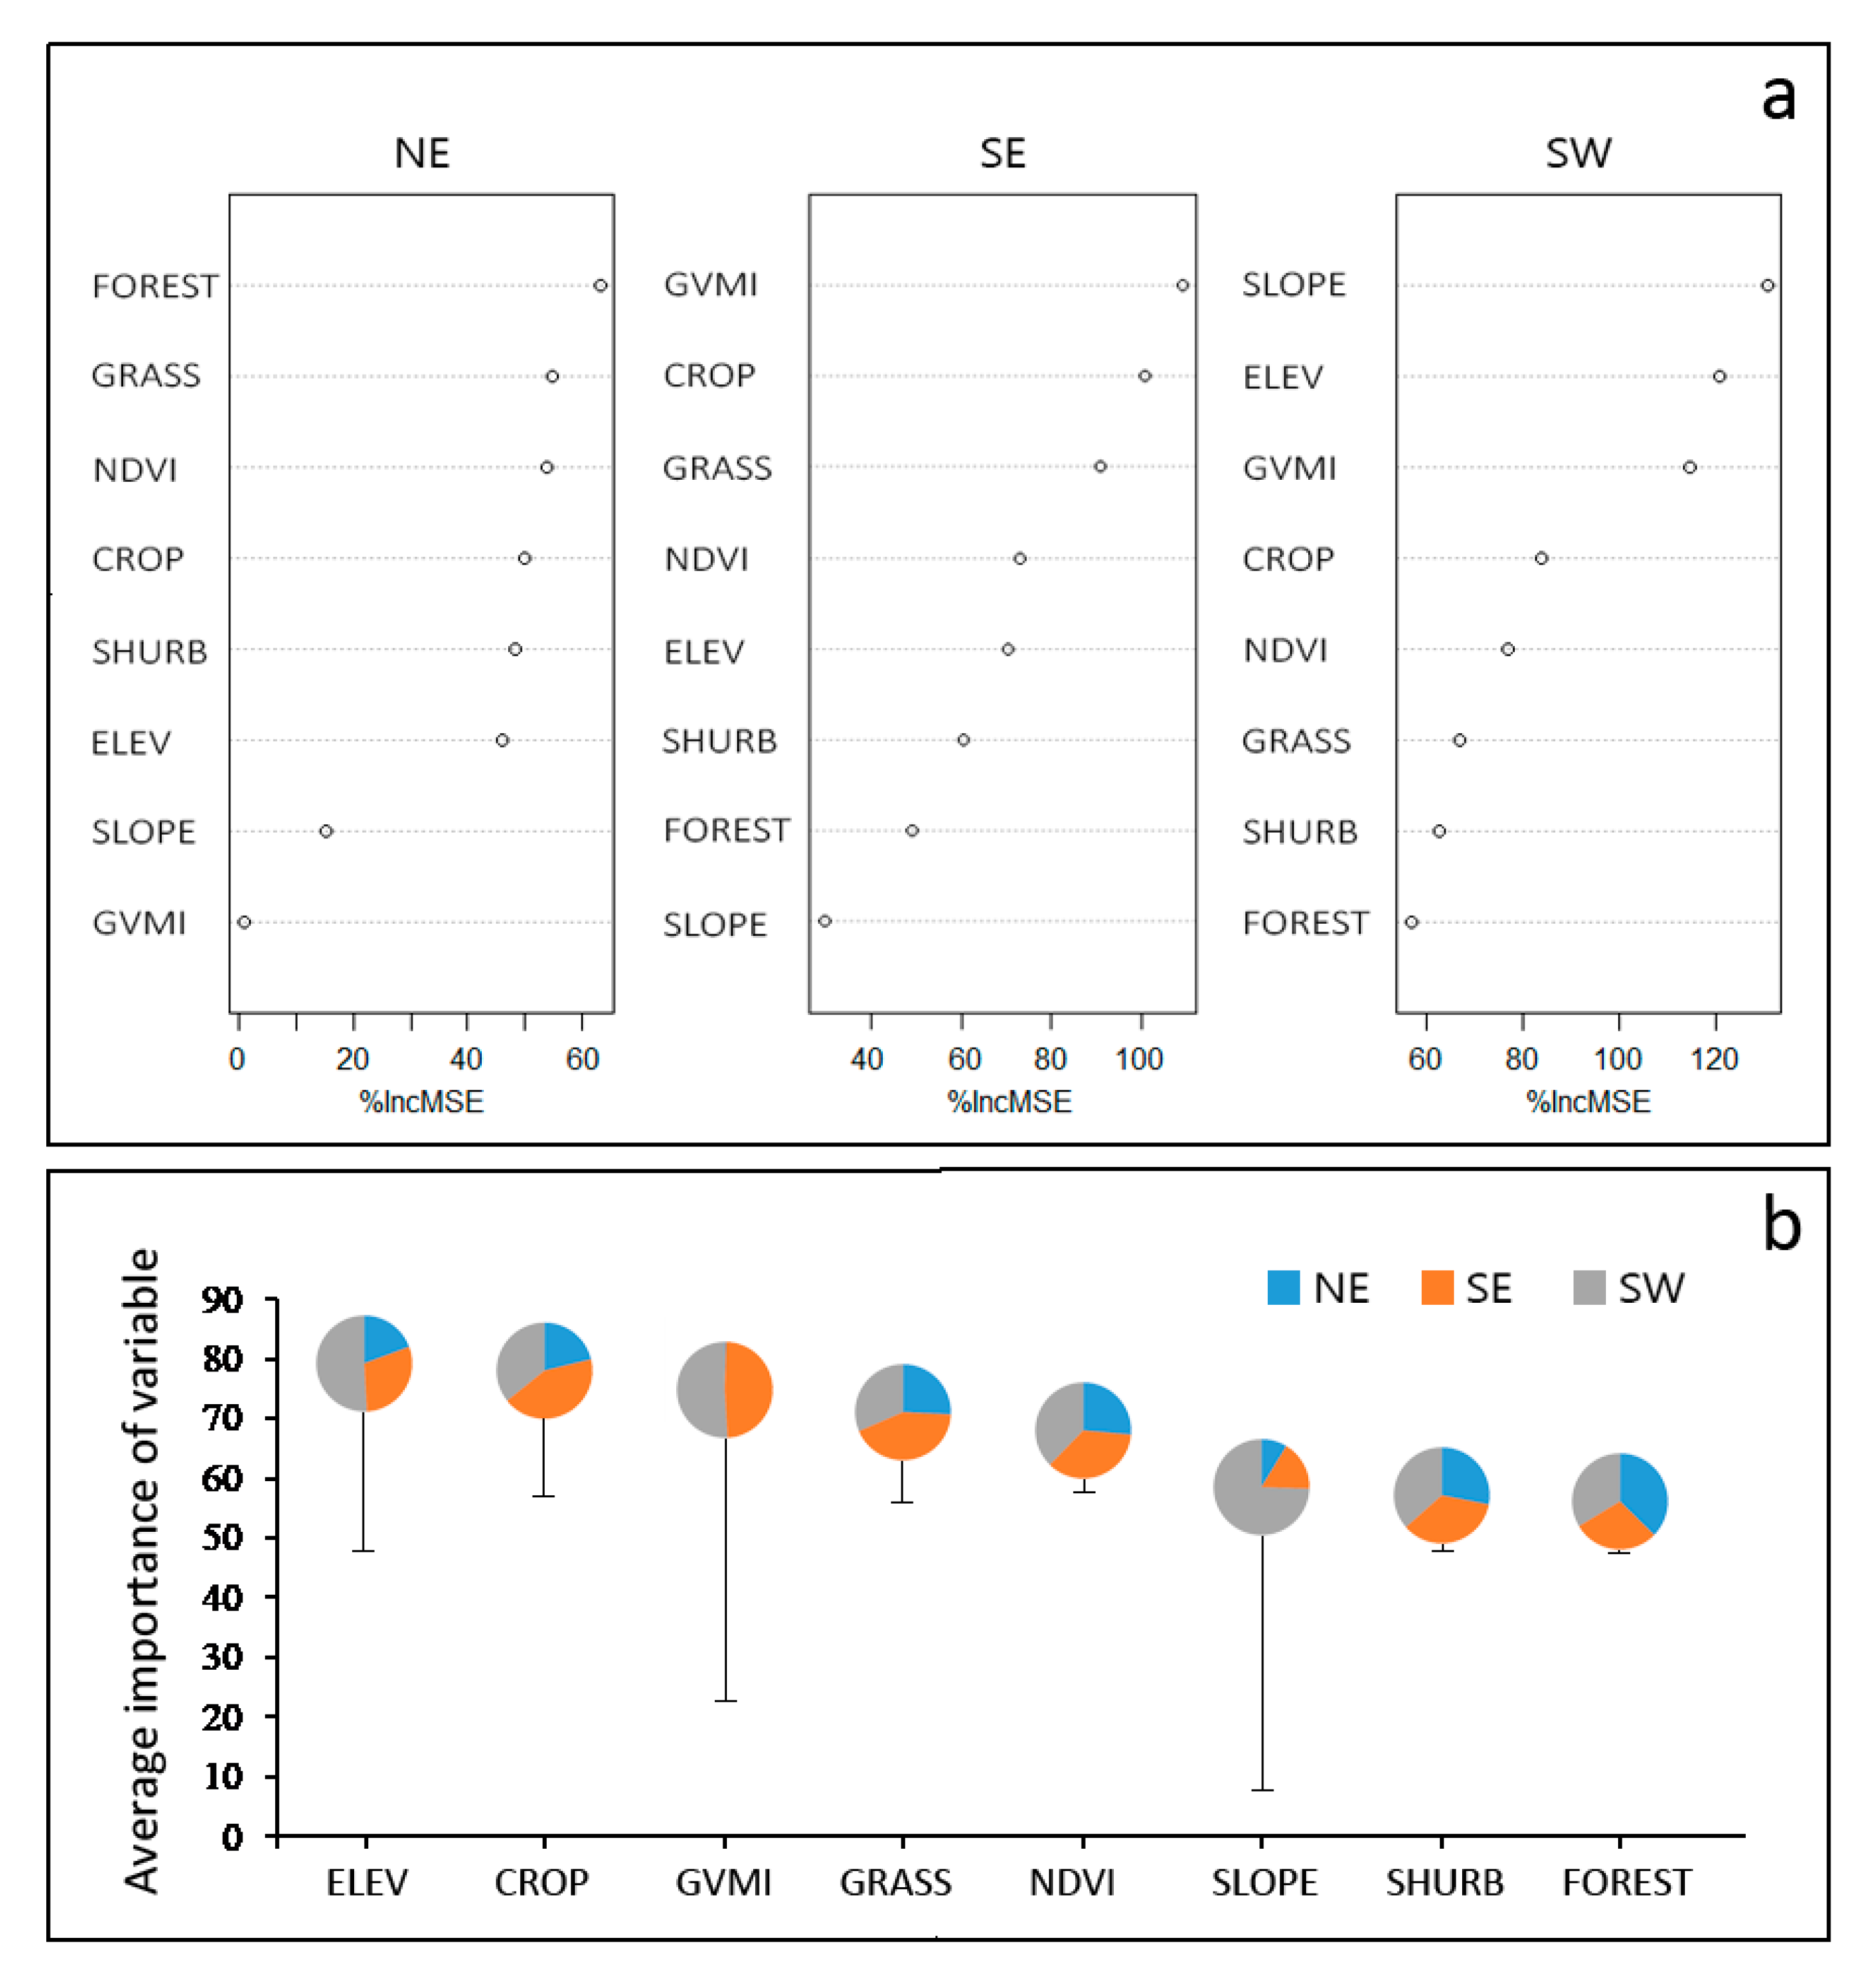
3.2. Relation of Landscape Factors to Fire Occurrence

In NE and SE regions, vegetation factors such as NDVI, proportion of crop and grass covers are key drivers of fire occurrence; however, topographic factors, such as slope and elevation, have major impact on fire occurrence in SW (Figure 3a). Overall, the elevation and the proportion of forest cover have the highest and the lowest influence on fire occurrence, respectively, in all three regions. Among the three regions, landscape factors have relatively greater impact in the SW and SE regions than in the NE region (Figure 3b).

3.3. Relation of Human Factors to Fire Occurrence

Human factors have different impacts among the three regions (Figure 4a). Overall, the density of railways and roads has the highest influence on fire occurrence, and in contrast, the proportion of residential areas has the lowest influence on fire occurrence in all three regions. Among the three regions, human factors have relatively greater impact in the SE than in the other two regions (Figure 4b).

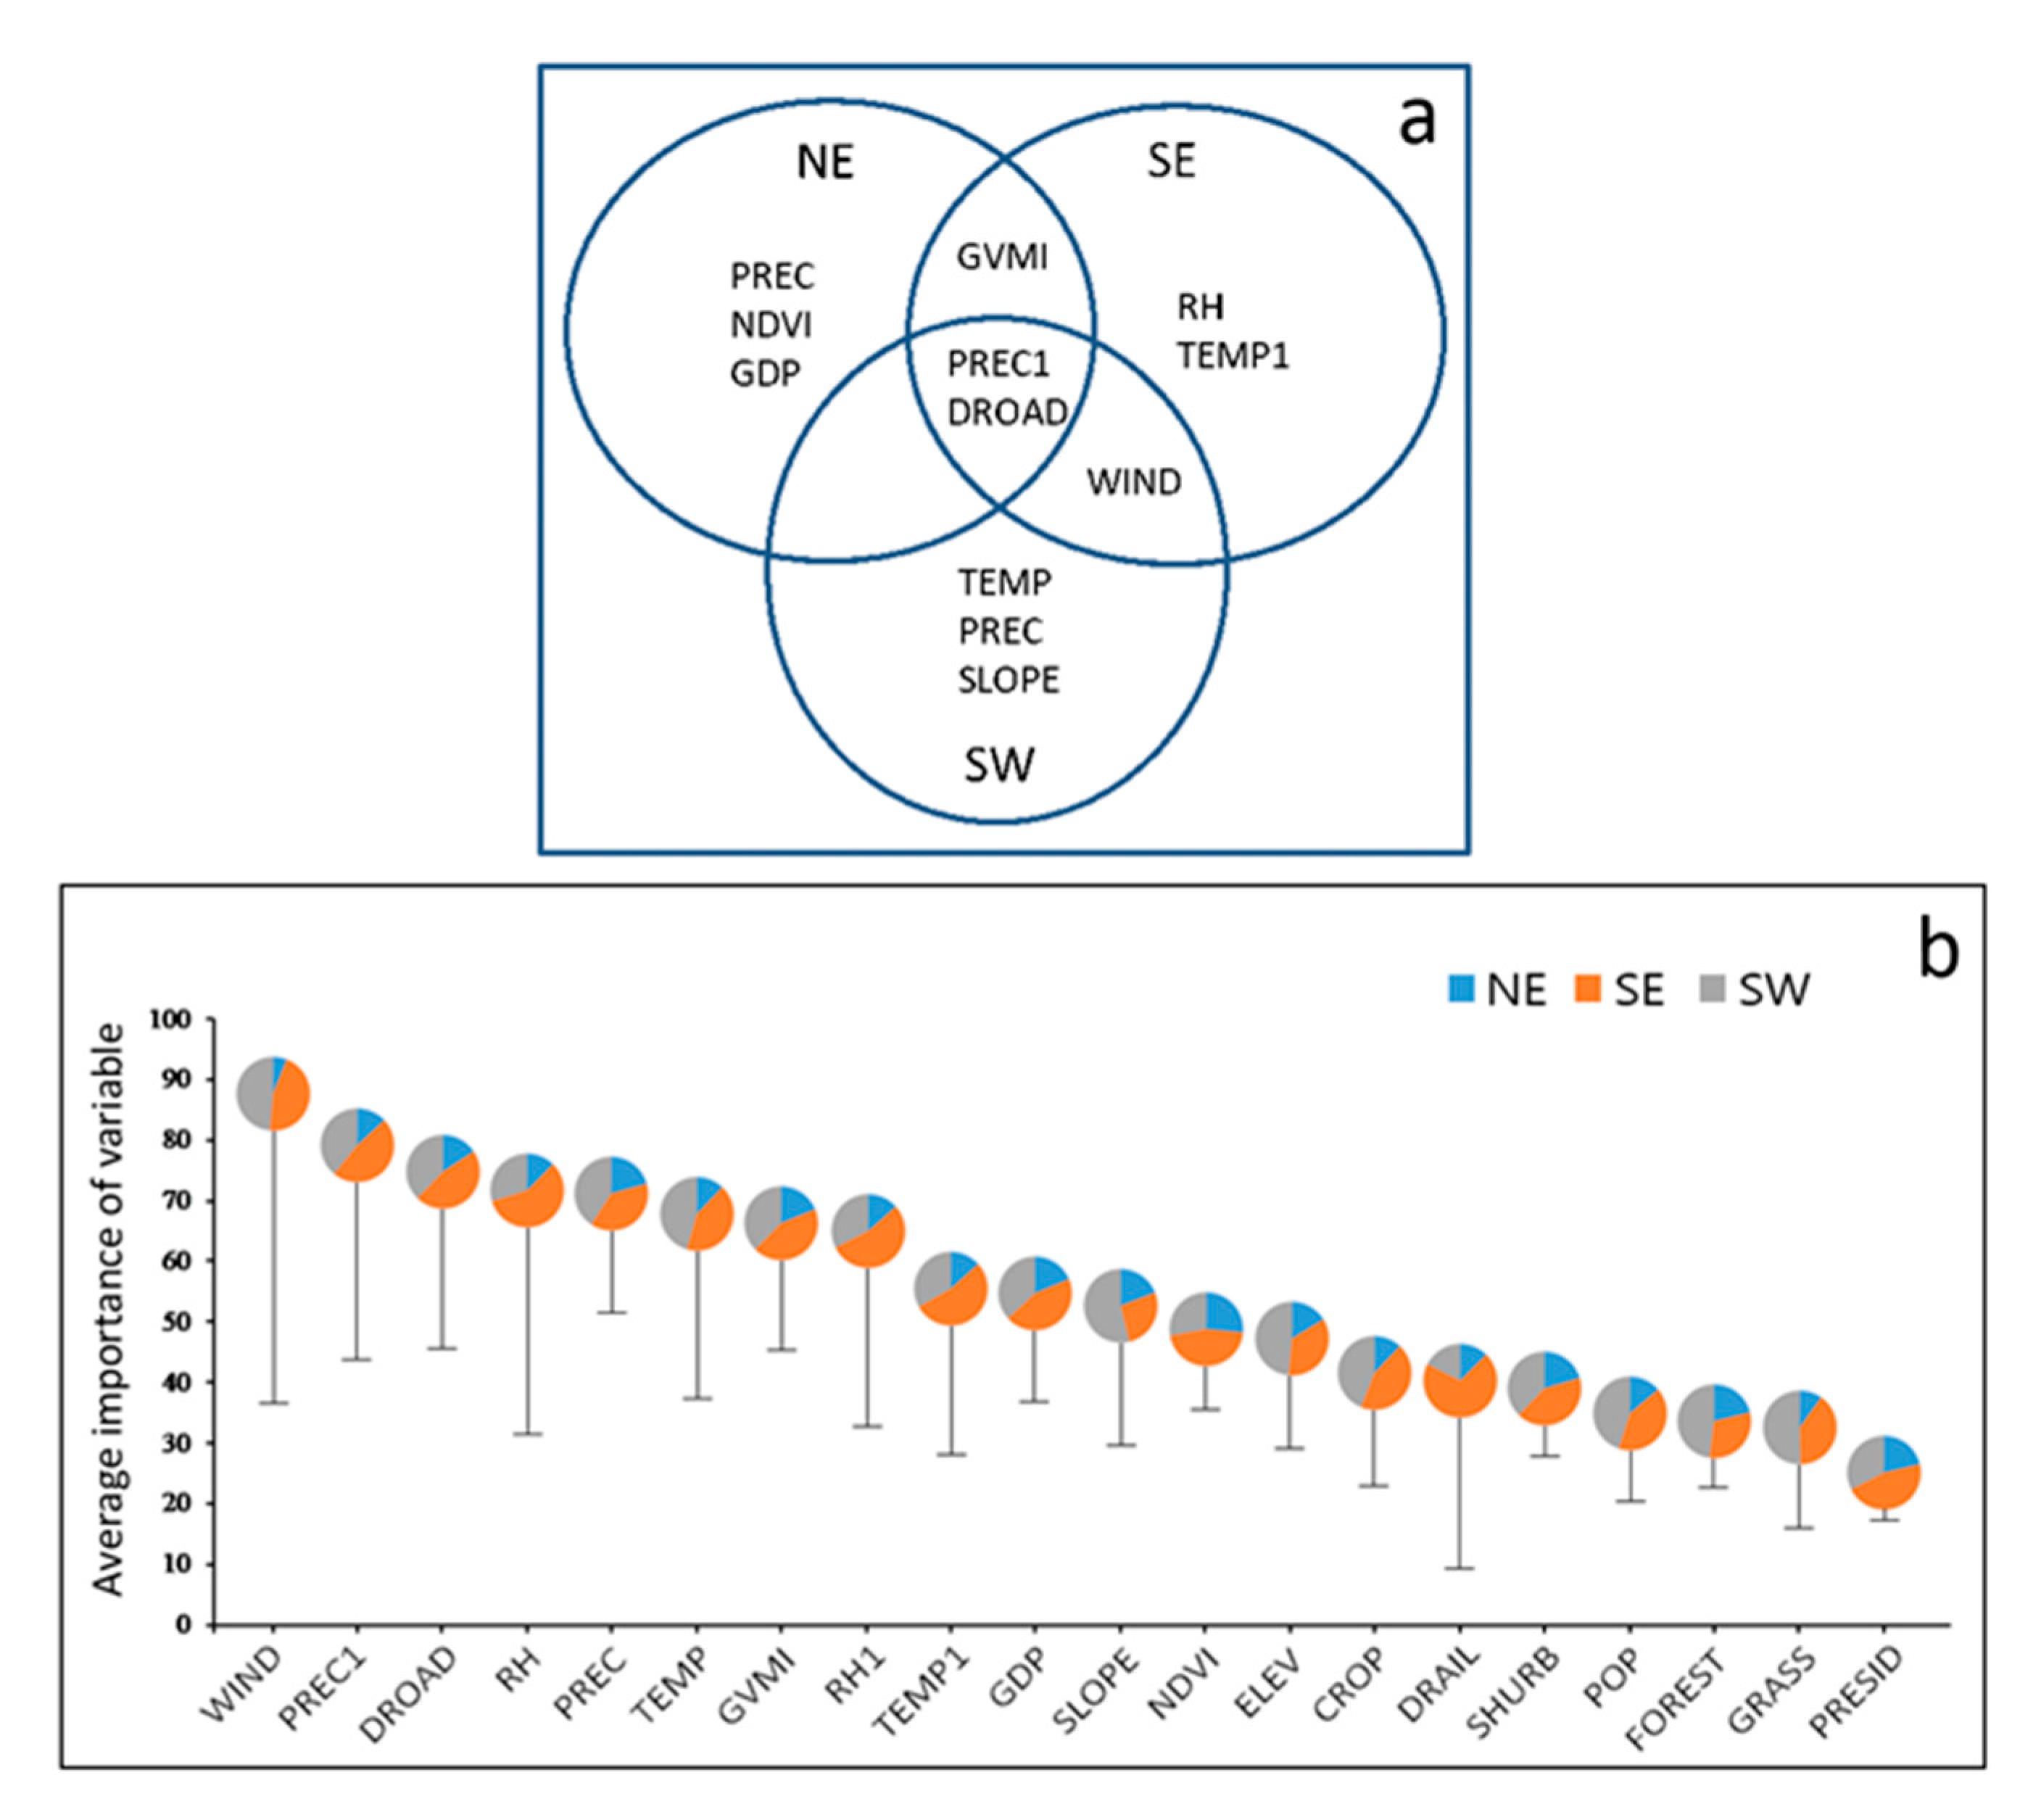
3.4. The Combined Impact of All Factors on Fire Occurrence

We found six important fire drivers in each region and the same factors that shared between three regions. The density of roads and precipitation of “one year prior to fire” are the same fire drivers in the three regions; additionally, the NE and SE shared the same fire driver-GVMI, and the SE and SW have the same fire driver-wind speed (Figure 5a).
The analysis based on all variables shows that, overall, climate factors, especially wind speed, precipitation and relative humidity, play the most important role in driving fires and have a greater impact than the landscape and human factors in these regions. The density of roads and GVMI, as a human and landscape factor, respectively, have the most important influence on fire occurrence in the three regions, while the influence of other factors varies among the three regions (Figure 5b).

3.5. Explanation Power of Each Variable Category on Fire Occurrence

The explanation power of each variable category on fire occurrence according to the results obtained from the tuning function of this method is given in Table 3. Climate factors explained 74.89%, 70.56% and 63.46% of the fire occurrence in the NE, SE and SW region, respectively. However, the explanation power of the landscape and human factors varied significantly among the regions. For instance, the human factors explained 40% of fire occurrence in the SE but only explained less than 10% of the fire occurrence in the NE and SW. Additionally, landscape factors showed nearly no influence on fire occurrence in the NE but explained 46.4% and 20.6% in the SE and SW region, respectively (Table 3). The correlation between the observed and the predicted values in three categories of factors in the three regions have significant differences. For complete variables, the correlations between the observed and the predicted values in the three regions are 0.76, 0.69 and 0.66 for the NE, SE and SW, respectively (Table 3).

4. Discussion

A common view is that with increased economic and social development, the influence of the human factors on wildfire will continue to increase globally [40]. In the past few decades, China has undergone rapid economic development and urbanization, and human factors have therefore been speculated to be the dominant drivers of increased wildfire occurrences. However, our study indicated that overall climate factors play a greater role than nonclimate factors (landscape and human factors) in contemporary wildfire occurrences in China, and this is consistent with the findings of other studies [13,37].
Our study shows that wind speed has an important influence on fire occurrence in the SE and SW. Strong wind speed can accelerate the evaporation of the surface moisture of the forest, leading to a drier fuel load and a higher likelihood of burning. A previous study also indicated that wind speed positively impacts the fire occurrence in subtropical forests in China [19]. The precipitation and temperature significantly impact the fire occurrence in the three regions. High precipitation levels contribute to fuel moisture, which in turn decreases the possibility of fire ignition [41]. The temperature directly influences the fuel moisture content. High temperatures can contribute to the increased evaporation from plants, as well as the decreased moisture content of potential fire fuels, leading to the increased probability of fire occurrence [42]. Our findings are consistent with previous studies [43,44], including those conducted in the boreal and subtropical forests of China [19,45].
On the other hand, previous studies have demonstrated that climate-dominant effects can be altered by local factors, especially in strongly human-affected landscapes [46]. For example, fire occurrence may be closely associated with the dynamic change in the spatial pattern of the vegetation distribution and composition across a landscape, which can be directly impacted by human activities such as fire ignition or suppression [41,47].
The density of the roads was identified as the most important human factor driving fires in China. The density of the roads represents the accessibility to the forest, which is the main cause of fire in some regions. Railway density has more explanation power on fire occurrence in the SE than other regions. A previous study stated that railways in Fujian are regarded more as an economic indicator rather than a source of fire ignition [48]. Overall, amongst the landscape factors, the elevation has the highest average explanation power on fire occurrence in the three regions, particularly in the SW. The importance of elevation to fire occurrence has been pointed out by other studies [10,49]. Elevation dampens fire occurrence, as human activity is reduced in high-altitude areas; thus decreasing the likelihood of human-caused ignition. It should be noted that GDP was found to have a significant impact on forest fire occurrences in the NE, mainly due to the relatively slow economic development in this area. Low urbanization, and highly forest-dependent industries, result in considerable human disturbances and therefore more fires. With more economic development, forest fires in the NE forest area may differ from those in the other regions in the future.
After the “Black Dragon Fire” in 1987, the Chinese government undertook a wildfire management policy named “Prevention and Suppression”, which promoted “fire exclusion” in the nation’s forests and was strictly enforced after 2000. Specific measures in this policy include establishing a fire monitoring system, reinforcing fire prevention publicity, setting up fire inspection stations, and developing fire lines or buffer zones adjacent to infrastructure where many fires can ignite. These measures may mitigate the influence of human activity on contemporary wildfires in China. The long-term strict “fire exclusion” policy can alter stand composition, reduce the biodiversity of forest ecosystems [50,51], and, more importantly, alter the native fire regime [52]. Wildfires generally become less frequent but more severe under “fire exclusion”, which can lead to larger, more intense, and more violent modern fires because of high biomass loadings, multilayer stand structures, and the high connectivity of the biomass [53]. This strict fire exclusion has been impacting fire regimes in China since the 1990s, and this impact may be strengthened as it interacts with the effects of climate change in the future. It is not a question of if a large and severe wildfire will occur, but rather, when and how. In light of this, China may urgently need an adaptive, alternative, and targeted wildfire management plan more so than ever before.
By quantitatively analyzing the main influencing factors of contemporary wildfires in three regions of China with different vegetation types and socio-economic conditions, this study promotes the implementation of regionally specific fire management strategies. It can also act as a reference for the study of wildfire drivers in other regions around the world within the contexts of climate change and socio-economic development.

5. Conclusions

Overall, our study illustrated that climate factors contribute more to explaining forest fire occurrence in the three regions of China, as compared to landscape and human factors. Wind speed has an important influence on fire occurrence in the SE and SW. Precipitation and temperature significantly impact fire occurrence in the three regions due to the direct influence on the moisture content of the forest fuel. The study also provides evidence that fire drivers vary significantly among regions. For instance, the landscape factors (slope, elevation) have a more significant influence on forest fire occurrence in the SW than in the NE and SE. The landscape and human factors also showed significant impact on fire occurrence in the SE compared to the NE and SW. As a whole, the study provides useful insights into targeted fire prediction and prevention, which should be more precise and effective under climate change and socio-economic development.

Author Contributions

Conceptualization, Z.L., H.H., G.W.; methodology, Z.L., Z.S., M.G., F.G.; software, Z.L., Z.S.; validation, F.G.; statistical analysis, Z.S.; resources, M.G., F.G.; writing-original draft preparation, Z.L., F.G.; writing-review and editing, E.C.A., H.H., G.W.; project administration, H.H.; funding acquisition, H.H. All authors have read and agreed to the published version of the manuscript.

Funding

This research was funded by the National Key R&D Plan of Strategic International Scientific and Technological Innovation Cooperation Project, grant number 2018YFE0207800.

Acknowledgments

We would like to thank the editor and anonymous reviewers for their useful advice that helped to improve the manuscript.

Conflicts of Interest

The authors declare no conflict of interest.

References

  1. Jolly, W.M.; Cochrane, M.A.; Freeborn, P.H.; Holden, Z.A.; Brown, T.J.; Williamson, G.J.; Bowman, D.M. Climate-Induced Variations In Global Wildfire Danger From 1979 to 2013. Nat. Commun. 2015, 6, 7537. [Google Scholar] [CrossRef] [PubMed]
  2. Westerling, A.L.; Hidalgo, H.G.; Cayan, D.R.; Swetnam, T.W. Warming and Earlier Spring Increase Western U.S. Forest Wildfire Activity. Science 2006, 313, 940–943. [Google Scholar] [CrossRef] [PubMed] [Green Version]
  3. Dennison, P.E.; Brewer, S.C.; Arnold, J.D.; Moritz, M.A. Large Wildfire Trends in the Western United States, 1984–2011. Geophys. Res. Lett. 2014, 41, 2928–2933. [Google Scholar] [CrossRef]
  4. Rasker, R. Resolving the Increasing Risk from Wildfires in the American West. Solutions 2015, 6, 55–62. [Google Scholar]
  5. Landis, M.S.; Edgerton, E.S.; White, E.M.; Wentworth, G.R.; Sullivan, A.P.; Dillner, A.M. The impact of the 2016 Fort McMurray Horse River Wildfire on ambient air pollution levels in the Athabasca Oil Sands Region, Alberta, Canada. Sci. Total Environ. 2018, 618, 1665–1676. [Google Scholar] [CrossRef]
  6. Ciara, N. Time. Retrieved Camp Fire Death Toll Lowered After Human Remains Were Mistakenly Sorted into Separate Bags. Available online: https://time.com/5470154/camp-fire-human-remains/ (accessed on 4 December 2018.).
  7. Ruffault, J.; Mouillot, F. Contribution of Human and Biophysical Factors to the Spatial Distribution of Forest Fire Ignitions and Large Wildfires in a French Mediterranean Region. Int. J. Wildland Fire 2017, 26, 498–508. [Google Scholar] [CrossRef] [Green Version]
  8. Schoennagel, T.; Balch, J.K.; Brenkert-Smith, H.; Dennison, P.E.; Harvey, B.J.; Krawchuk, M.A.; Mietkiewicz, N.; Morgan, P.; Moritz, M.A.; Rasker, R.; et al. Adapt to More Wildfire in Western North American Forests as Climate Changes. Proc. Natl. Acad. Sci. USA 2017, 114, 4582–4590. [Google Scholar] [CrossRef] [Green Version]
  9. Grala, K.; Grala, R.K.; Hussain, A.; Cooke, W.H.; Varner, J.M. Impact of Human Factors on Wildfire Occurrence in Mississippi, United States. For. Policy Econ. 2017, 81, 38–47. [Google Scholar] [CrossRef]
  10. Miranda, B.R.; Sturtevant, B.R.; Stewart, S.I.; Hammer, R.B. Spatial and Temporal Drivers of Wildfire Occurrence in the Context of Rural Development in Northern Wisconsin, USA. Int. J. Wildland Fire 2012, 21, 141–154. [Google Scholar] [CrossRef]
  11. Nunes, A.; Lourenco, L.; Meira, A.C. Exploring Spatial Patterns and Drivers of Forest Fires in Portugal (1980–2014). Sci. Total Environ. 2016, 573, 1190–1202. [Google Scholar] [CrossRef]
  12. Garcia-Llamas, P.; Suarez-Seoane, S.; Taboada, A.; Fernandez-Manso, A.; Quintano, C.; Fernandez-Garia, V. Environmental Drivers of Fire Severity in Extreme Fire Events that Affect Mediterranean Pine Forest Ecosystems. For. Ecol. Manag. 2019, 433, 24–32. [Google Scholar] [CrossRef]
  13. Sturtevant, B.R.; Cleland, D.T. Human and Biophysical Factors Influencing Modern Fire Disturbance in Northern Wisconsin. Int. J. Wildland Fire 2007, 16, 398–413. [Google Scholar] [CrossRef] [Green Version]
  14. Hu, T.Y.; Zhou, G.S. Drivers of Lightning-and Human-Caused Fire Regimes in the Great Xing’an Mountains. For. Ecol. Manag. 2014, 329, 49–58. [Google Scholar] [CrossRef]
  15. Guo, F.T.; Innes, J.L.; Wang, G.Y.; Ma, X.Q.; Sun, L.; Hu, H.Q.; Su, Z.W. Historic Distribution and Driving Factors of Human-Caused Fires in the Chinese Boreal Forest Between 1972 and 2005. J. Plant Ecol. 2015, 8, 480–490. [Google Scholar] [CrossRef] [Green Version]
  16. Cavard, X.; Boucher, J.F.; Bergeron, Y. Vegetation and Topography Interact with Weather to Drive the Spatial Distribution of Wildfires in the Eastern Boreal Forest of Canada. Int. J. Wildland Fire 2015, 24, 391–406. [Google Scholar] [CrossRef] [Green Version]
  17. Parisien, M.A.; Parks, S.A.; Krawchuk, M.A.; Little, J.M.; Flannigan, M.D.; Gowman, L.M.; Moritz, A.M. An Analysis of Controls on Fire Activity in Boreal Canada: Comparing Models Built with Different Temporal Resolutions. Ecol. Appl. 2014, 24, 1341–1356. [Google Scholar] [CrossRef] [PubMed]
  18. Oliveira, S.; Oehler, F.; San-Miguel-Ayanz, J.; Camia, A.; Pereira, J.M.C. Modeling Spatial Patterns of Fire Occurrence in Mediterranean Europe Using Multiple Regression and Random Forest. For. Ecol. Manag. 2012, 275, 117–129. [Google Scholar] [CrossRef]
  19. Guo, F.; Wang, G.; Su, Z.; Liang, H.; Wang, W.; Lin, F.; Liu, A. What Drives Forest fire in Fujian, China? Evidence from Logistic Regression and Random Forests. Int. J. Wildland Fire 2016, 25, 505–519. [Google Scholar] [CrossRef]
  20. China National Statistical Bureau, China Statistical Yearbook 2017; China’s Statistics Press: Beijing, China, 2017.
  21. Zhang, Y.P.; Hu, H.Q. Climatic Change and its Impact on Forest Fifire in Daxing’an Mountains. J. Northeast. For. Univ. 2008, 36, 29–31. [Google Scholar]
  22. Zheng, H.; Chen, J.; Zhang, X.; Zhang, C.; Zhang, C.; Chen, H. Study on the Forecast System of Forest Fire Weather Ranks in Fujian. Meteorol. Mon. 2001, 3, 38–44, (In Chinese with English Abstract). [Google Scholar]
  23. Amraoui, M.; Pereira, M.G.; DaCamara, C.C.; Calado, T.J. Atmospheric Conditions Associated with Extreme Fire Activity in the Western Mediterranean Region. Sci. Total Environ. 2015, 524–525, 32–39. [Google Scholar] [CrossRef]
  24. Justice, C.O.; Giglio, L.; Korontzi, S.; Owens, J.; Morisette, J.T.; Roy, D.; Descloitres, J.; Alleaume, S.; Petitcolin, F.; Kaufman, Y. The MODIS Fire Products. Remote Sens. Environ. 2002, 83, 244–262. [Google Scholar] [CrossRef]
  25. Liu, Z.; Yang, J.; Chang, Y.; Weisberg, P.J.; He, H.S. Spatial Patterns and Drivers of Fire Occurrence and its Future Trend Under Climate Change in a Boreal Forest of Northeast China. Glob. Chang. Biol. 2012, 18, 2041–2056. [Google Scholar] [CrossRef]
  26. Kalabokidis, K.D.; Koutsias, N.; Konstantinidis, P.; Vasilakos, C. Multivariate Analysis of Landscape Wildfire Dynamics in a Mediterranean Ecosystem of Greece. Area 2007, 39, 392–402. [Google Scholar] [CrossRef]
  27. Pereira, M.G.; Trigo, R.M.; da Camara, C.C.; Pereira, J.M.; Leite, S.M. Synoptic Patterns Associated with Large Summer Forest Fires in Portugal. Agric. For. Meteorol. 2005, 129, 11–25. [Google Scholar] [CrossRef]
  28. Syphard, A.D.; Radeloff, V.C.; Keuler, N.S.; Taylor, R.S.; Hawbaker, T.J.; Stewart, S.I.; Clayton, M.K. Predicting Spatial Patterns of Fire on a Southern California Landscape. Int. J. Wildland Fire 2008, 17, 602–613. [Google Scholar] [CrossRef]
  29. Littell, J.S.; Mckenzie, D.; Peterson, D.L.; Westerling, A.L. Climate and Wildfire Area Burned in Western U.S. Ecoprovinces, 1916–2003. Ecol. Appl. 2009, 19, 1003–1021. [Google Scholar] [CrossRef]
  30. Jing, W.L.; Feng, M.; Yang, Y.P. A Statistical Downscaling Approach of NCEP/NCAR Reanalysis Temperature Data. J. Geo-Inf. Sci. 2013, 15, 819–828. [Google Scholar] [CrossRef]
  31. Gutman, G.; Ignatov, A. The Derivation of the Green Vegetation Fraction from NOAA/AVHRR Data for Use in Numerical Weather Prediction Models. Int. J. Remote Sens. 1998, 19, 1533–1543. [Google Scholar] [CrossRef]
  32. Liu, M.; Huang, F.; Zhang, H.; Wang, P. Vegetation Canopy Water Content Estimation Using Gvmi and EWT Model from MODIS Data. In Proceedings of the 2009 2nd International Congress on Image and Signal Processing, Tianjin, China, 17–19 October 2009. [Google Scholar]
  33. Breiman, L. Random Forests. Mach. Learn 2001, 45, 5–32. [Google Scholar] [CrossRef] [Green Version]
  34. Archibald, S.; Roy, D.P.; Van Wilgen, B.W.; Scholes, R.J. What Limits fire? An Examination of Drivers of Burnt Area in Southern Africa. Glob. Chang. Biol. 2009, 15, 613–630. [Google Scholar] [CrossRef] [Green Version]
  35. Cutler, D.R.; Edwards, T.C.; Beard, K.H.; Cutler, A.; Hess, K.T.; Gibson, J.; Lawler, J.J. Random Forests for Classification in Ecology. Ecology 2007, 88, 2783–2792. [Google Scholar] [CrossRef] [PubMed]
  36. Su, Z.W.; Hu, H.Q.; Wang, G.Y.; Ma, Y.F.; Yang, X.J.; Guo, F.T. Using GIS and Random Forests to Identify Fire Drivers in a Forest City, Yichun, China. Geomat. Nat. Hazards Risk 2018, 9, 1207–1229. [Google Scholar] [CrossRef] [Green Version]
  37. Wu, Z.W.; He, H.S.; Yang, J.; Liu, Z.H.; Liang, Y. Relative Effects of Climatic and Local Factors on Fire Occurrence in Boreal Forest Landscapes of Northeastern China. Sci. Total Environ. 2014, 493, 472–480. [Google Scholar] [CrossRef] [PubMed]
  38. Abdel-Rahman, E.M.; Ahmed, F.B.; Ismail, R. Random Forest Regression and Spectral Band Selection Forest Imating Sugarcane Leaf Nitrogen Concentration Using EO-1Hyperion Hyperspectral Data. Int. J. Remote Sens. 2013, 34, 712–728. [Google Scholar] [CrossRef]
  39. Marston, C.G.; Danson, F.M.; Armitage, R.P.; Giraudoux, P.P.; Pleydell, D.R.J.; Wang, Q.; Qui, J.M.; Craig, P.S.A. Random Forest Approach for Predicting the Presence of Echinococcus Multilocularis Intermediate Host Ochotona Spp. Presence in Relation to Landscape Characteristics in Western China. Appl. Geogr. 2014, 55, 176–183. [Google Scholar] [CrossRef] [Green Version]
  40. Syphard, A.D.; Radeloff, V.C.; Keeley, J.E.; Hawbaker, T.J.; Clayton, M.K.; Stewart, S.I.; Hammer, R.B. Influence on California Fire Regimes. Ecol. Appl. 2007, 17, 1388–1402. [Google Scholar] [CrossRef]
  41. Zumbrunnen, T.; Pezzatti, G.B.; Menendez, P.; Bugmann, H.; Burgi, M.; Conedera, M. Weather and Human Impacts on Forest Fires: 100 Years of Fire History in Two Climatic Regions of Switzerland. For. Ecol. Manag. 2011, 261, 2188–2199. [Google Scholar] [CrossRef]
  42. Chuvieco, E.; Cocero, D.; Riaño, D.; Martin, P.; Martínez-Vega, J.; de la Riva, J.; Pérez, F. Combining NDVI and Surface Temperature for the Estimation of Live Fuel Moisture Content in Forest Fire Danger Rating. Remote Sens. Environ. 2004, 92, 322–331. [Google Scholar] [CrossRef]
  43. Wotton, B.M.; Martell, D.L.; Logan, K.A. Climate Change and People-Caused Forest Fire Occurrence in Ontario. Clim. Chang. 2003, 60, 275–295. [Google Scholar] [CrossRef]
  44. Maingi, J.K.; Henry, M.C. Factors Influencing Wildfire Occurrence and Distribution in Eastern Kentucky, USA. Int. J. Wild-Land Fire 2007, 16, 23–33. [Google Scholar] [CrossRef] [Green Version]
  45. Chang, Y.; Zhu, Z.L.; Bu, R.C.; Chen, H.G.; Feng, Y.T.; Li, Y.H.; Hu, Y.M.; Wang, Z.C. Predicting Fire Occurrence Patterns with Logistic Regression in Heilongjiang Province, China. Landsc. Ecol. 2013, 28, 1989–2004. [Google Scholar] [CrossRef]
  46. Ganteaume, A.; Camia, A.; Jappiot, M.; San-Miguel-Ayanz, J.; Long-Fournel, M.; Lampin, C. A Review of the Main Driving Factors of Forest Fire Ignition Over Europe. Environ. Manag. 2013, 51, 651–662. [Google Scholar] [CrossRef] [Green Version]
  47. Hawbaker, T.J.; Radeloff, V.C.; Stewart, S.I.; Hammer, R.B.; Keuler, N.S.; Clayton, M.K. Human and Biophysical Influences on Fire Occurrence in the United States. Ecol. Appl. 2013, 23, 565–582. [Google Scholar] [CrossRef] [PubMed]
  48. Guo, F.; Su, Z.; Wang, G.; Sun, L.; Lin, F.; Liu, A. Wildfire Ignition in the Forests of Southeast China: Identifying Drivers and Spatial Distribution to Predict Wildfire Likelihood. Appl. Geogr. 2016, 66, 12–21. [Google Scholar] [CrossRef]
  49. Pereira, M.G.; Caramelo, L.; Orozco, C.V.; Costa, R.; Tonini, M. Space Time Clustering Analysis Performance of an Aggregated Dataset: The Case of Wildfires in Portugal. Environ. Model. Softw. 2015, 72, 239–249. [Google Scholar] [CrossRef]
  50. Hessburg, P.F.; Agee, J.K.; Franklin, J.F. Dry Forest and Wildland Fires of the Inland Northwest USA:Contrasting the Landscape Ecology of the Pre-Settlement and Modern Era. For. Ecol. Manag. 2005, 211, 117–139. [Google Scholar] [CrossRef]
  51. Merschel, A.G.; Spies, T.A.; Heyerdahl, E.K. Mixed-Conifer Forests of Central Oregon: Effects of Logging and Fire Exclusion Vary with Environment. Ecol. Appl. 2014, 24, 1670–1688. [Google Scholar] [CrossRef]
  52. Scholl, A.E.; Taylor, A.H. Fire Regimes, Forest Change, and Self-Organization in an Old-Growth Mixed-Conifer Forest, Yosemite National Park, USA. Ecol. Appl. 2010, 20, 362–380. [Google Scholar] [CrossRef] [PubMed]
  53. Stephens, S.L.; Moghaddas, J.J.; Edminster, C.; Fiedler, C.E.; Haase, S.; Harrington, M.; Keeley, J.E.; Knapp, E.E.; Mclv, E.R.J.D.; Metlen, K.; et al. Fire Treatment Effects on Vegetation Structure, Fuels, and Potential Fire Severity in Western U.S. Forests. Ecol. Appl. 2009, 19, 305–320. [Google Scholar] [CrossRef] [Green Version]
Figure 1. Active fire density in each study areas (NE, SW, and SE) from 2001 to 2016 and its spatial distribution of land cover types (http://www.resdc.cn, accessed on 29 July 2020). Hot (cold) colors indicate the high (low) number of active fires derived from the resources and environment science data center, Chinese Academy of Sciences (http://www.resdc.cn/Default.aspx, accessed on 29 July 2020).
Forests 12 00392 g001
Figure 2. Variable importance measures (%IncMSE- Increase in Mean Square Error) of climate factors derived from Random Forest analysis in different regions (a). Comparison of the relative importance of variables to fire occurrence (pie charts) and the relative importance of each variable among three regions (different portions within each pie chart) (b). The bars below each pie chart represent the standard deviation of the relative importance of each variable among the three regions. %IncMSE (x-axis) quantifies the importance of a variable by measuring the change in prediction accuracy when the values of the variable are randomly permuted compared with the original observations. Abbreviated variable names are described in Table 2.
Forests 12 00392 g002
Figure 3. Variable importance measures (%IncMSE- Increase in Mean Square Error) of landscape factors from Random Forests in different regions (a). Comparison of the relative importance of variables to fire occurrence (pie charts) and the relative importance of each variable among three regions (different portions within each pie chart) (b). The bars below each pie chart represent the standard deviation of the relative importance of each variable amongst the three forest ecosystems. %IncMSE (x-axis) quantifies the importance of a variable by measuring the change in prediction accuracy when the values of the variable are randomly permuted compared with the original observations. Abbreviated variable names are described in Table 2.
Forests 12 00392 g003
Figure 4. Variable importance measures (%IncMSE- Increase in Mean Square Error) of human factors from Random Forests in different regions (a). Comparison of the relative importance of variables to fire occurrence (pie charts) and the relative importance of each variable among the three regions (different portions within each pie chart) (b). The bars below each pie chart represent the standard deviation of the relative importance of each variable amongst three forest ecosystems. %IncMSE (x-axis) quantifies the importance of a variable by measuring the change in prediction accuracy when the values of the variable are randomly permuted compared with the original observations. Abbreviated variable names are described in Table 2.
Forests 12 00392 g004
Figure 5. The first six important fire drivers in different regions (a). Comparison of the relative importance of variables to fire occurrence (pie charts) and the relative importance of each variable among the three regions (different portions within each pie chart) (b). Abbreviated variable names are described in Table 3.
Forests 12 00392 g005
Table 1. Description of study regions.
Study AreaTopography and Climate ConditionsHuman and Economic ConditionsForest Resources and Vegetation TypesFire Regime
Northeast (NE, Daxing’an Mountains)Total area is 83,500 km2. Terrain is low mountains and hills and slope is between 15°–30°. It has a cool temperate zone with mean annual temperatures between −2 °C and 4 °C, a range extending from −52.3 °C to 39.0 °C, and annual precipitation of 350–500 mm [19].The total population is about 500,000. Per capita Gross Domestic Product (GDP) was around USD 6000 in 2016 [20].Natural forest is abundant in this area and it is considered an important forest base in China. Dominant tree species are Dahurian larch (Larix gmelinii Rupr.), Mongolian pine (Pinus sylvestris L. var. mongolica Litv.), and Mongolian oak (Quercus mongolica Fischer ex Ledeb.).The current fire regime is less frequent but more severe than the historical fire regime. Anthropogenic fires account for nearly 70% of total fire ignitions [21]. According to MOD14A1 product, the average active fires number in forested areas from 2000–2016 was 646, with an annual density of 4.31 × 10⁻³/km2.
Southeast (SE, Fujian and Zhejiang Provinces)Total area is 229,500 km2. Terrain is characterized by high mountains and hills, which accounts for nearly 80% of the total area of Fujian. It is a humid subtropical climate with annual average rainfall of 1200–2000 mm and annual average temperature of 16–20 °C.The total population is about 95 million. Per capita Gross Domestic Product (GDP) was around USD 14,500 in 2016 [20].Forest coverage is about 65% of the region. Forest plantation is dominant in this area. Dominant tree species include Pinus massoniana Lamb., Curnninghamia lanceolata, Casuarina equisetifolia L., and Phyllostachys heterocycla.Relatively high forest fire frequency as compared to Northeastern China. Nearly 95% of fires are caused by human activities [22]. The average active fires number in forested areas from 2000–2016 was 1955, and the annual density was 10.9 × 10⁻³/km2.
Southwest (SW, Yunnan and Guizhou Provinces)Total area is 560,000 km2. Characterized by plateau terrain, which accounts for 80% of the total area. The average altitude is 2000 m.Terrain features lead to greater spatial heterogeneity of temperature and precipitation. Min and max annual temperature is between 3–25 °C. Min and max annual precipitation is between 600–2700 mm. The total population is about 83 million. Per capita Gross Domestic Product (GDP) was around USD 4600 in 2016 [20].Forest coverage is about 55% of the region. Major forest types are evergreen broadleaf and coniferous forest. Vegetation types are abundant, including more than 420 families of plants. Dominant tree species include Pinus yunnanensis Franch, and Pinus kesiya var. langbianensis.Southwest has the highest fire occurrence compared to the Northeast and Southeast of China. Similar to Southeast China, nearly 95% of fires are caused by human activities in Southwest. The average active fires number in forested areas from 2000–2016 was 5452, and the annual density was 10.9 × 10⁻³/km2.
Table 2. Independent variables included in forest fire model development for Random Forests-Regression.
VariableVariable NameCodeResolution/UnitSource
Climate factorAverage precipitation of fire season (the year of fire)PREC1 km/mmNational Earth System Science Data Center (http://www.geodata.cn/index.html, accessed on 15 March 2020)
Average relative humidity of fire season (the year of fire)RH1 km/%
Average temperature of fire season (the year of fire)TEMP1 km/℃
Average wind speed of fire season (the year of fire)WIND1 km/m·s−1
Average precipitation of fire season of one year prior the firePREC11 km/mm
Average relative humidity of fire season of one year prior the fireRH11 km/%
Average temperature of fire season of one year prior the fireTEMP11 km/℃
Landscape factorElevationELEV25 m/mNational Administration of Surveying, Mapping and Geoinformation of China, 2002 (http://ngcc.cn/article/sjcg/dlg/, accessed on 8 March 2019)
SlopeSLOPE25 m/degree
Forest vegetation coverageFVC500 m/%International Scientific and Technical Data Mirror Site, Computer Network Information Center, Chinese Academy of Sciences (http://www.gscloud.cn, accessed on 15 March 2020)
Global vegetation moisture indexGVMI1 km/ Value range 0–0.9It is built on a combination of near-infrared and short-wave infrared regions of the electromagnetic spectrum. Red band in Normalized Difference Vegetation Index (NDVI) was substituted for short-wave infrared(Liu et al., 2009)
Forest proportionFOREST1:1,000,000/%Resource and Environment Data Cloud Plat form (http://www.resdc.cn, accessed on 29 July 2020)
Shrub proportionSHRUB1:1,000,000/%
Grass proportionGRASS1:1,000,000/%
Crop proportionCROP1:1,000,000/%
Human factorRailway densityDRAIL1:100,000/km·km−2National Administration of Surveying, Mapping and Geoinformation of China, 2002 (http://ngcc.cn/article/sjcg/dlg/, accessed on 29 July 2020)
Road densityDROAD1:100,000/km·km−2
Residence proportionPRESID1:100,000/%
Per capita GDPGDP1 km/RMB·km−2Resource and Environment Data Cloud Platform (http://www.resdc.cn, accessed on 29 July 2020), 2000, 2005, 2010, 2015
Density of populationPOP1 km/Number of people·km−2
Table 3. Results of the models created with Random Forest under different category of variables in each region, including the correlation values between observed (obs) and predicted (pred) values.
Study RegionVariablesVariance ExplainedMean Squared ResidualsCorrelation Obs. vs. Pred.
NEComplete variable76.01%0.000069610.767
Climate74.89%0.000072980.748
Human factor2.84%0.000281180.033
Landscape factor0.80%0.0002917280.047
SEComplete variable67.60%0.0001615090.691
Climate70.56%0.0001467670.711
Human factor42.07%0.0002887560.433
Landscape factor46.43%0.0002671790.466
SWComplete variable65.15%0.0001471450.669
Climate63.46%0.0001546430.641
Human factor6.02%0.0003977750.068
Landscape factor20.65%0.0003358490.208
Publisher’s Note: MDPI stays neutral with regard to jurisdictional claims in published maps and institutional affiliations.

