Abstract
Changes in natural habitats for human use can alter the distribution of biodiversity, favoring species that are more tolerant to environmental disturbance. Usually, these species comprise clades of habitat generalists, which have biological mechanisms to colonize environments with different environmental conditions. However, such effects are still poorly understood for most biological groups, such as the Amazon odonates. Therefore, this study aims to evaluate the effects of land use along an environmental gradient on the phylogenetic and taxonomic diversity of Odonata in the Amazon. We tested the following hypotheses: In deforested areas (e.g., pasture for cattle, palm plantation, and logging), the Odonata community will be more taxonomically and phylogenetically impoverished than in forested areas. We assume that the modification of the natural habitat causes loss of specialist forest species and favors specialist species of open areas and/or habitat generalists. Data sampling was performed in 195 streams under different land-use types: livestock areas, palm monoculture, timber exploitation, and forest areas taken as reference sites. Our results showed that anthropogenic impacts affected the phylogenetic diversity of odonates and the increase in shrub vegetation was related to the increase in the phylogenetic diversity of communities. On the other hand, shrub vegetation is indicative of disturbed areas, where secondary vegetation predominates, with less canopy cover due to the absence or discontinuity of the native tree cover in these habitats. Nonetheless, species richness and abundance were not related to the effects of anthropogenic land use. Finally, our results suggest that the phylogenetic diversity of Amazonian odonates is related to riparian vegetation structure.
1. Introduction
The search to understand how species are distributed and what processes affect their distribution patterns has always been a major challenge for researchers addressing community ecology problems [1]. This is due to the increasing rate of environmental changes, resulting in biodiversity loss and depletion of ecosystem services [2,3]. In this context, for assessing environmental changes, some groups such as odonates are remarkably good models for studies on ecological dynamics, behavior, and evolutionary biology [4,5,6]. This is because of their sensitivity to changes in the aquatic environment, high species diversity, and association with different types of aquatic environments as well as living on the boundary with the terrestrial environment [7]. Although, for Odonata, there is a noticeable recent increase in the number of ecological studies, some approaches are still scarce, such as evolutionary approaches, due to the difficulties in measuring phylogenetic relationships among species [8,9]. This knowledge gap has led many studies to consider species as independent entities with equivalent environmental importance and function [10]. However, the closer species are phylogenetically, the more likely that they will respond in a similar way to the environmental changes, both in function for ecosystem services and in response to environmental conditions [11,12,13].
In this perspective, environmental variation and changes in natural habitats resulting from anthropogenic uses can promote the distribution of species more tolerant to altered habitats [14,15]. Phylogenetically, it is expected that clades composed of more habitat-generalist species should be found in habitats modified for land use (e.g., monoculture, pasture, and urban habitats), as they are considered capable of colonizing environments with different environmental conditions, due to differences in behavioral responses and thermoregulatory strategies [6,16]. Due to the specificity of habitat requirements, some Odonata species are restricted to streams with vegetation cover that consists of taller plants and are represented by smaller-sized individuals that spend most of their time perched and are considered forest specialists [17]. On the other hand, many species have positive relationships with habitats in open areas and consist mostly of individuals with larger body-sizes. This latter group have the specific habit of staying in open areas where they can thermoregulate more efficiently [18]. Theoretically, odonates are classified into three thermoregulatory groups: (1) Thermal conformers, which present smaller body sizes and show higher conductance, in which body temperature varies with the environment, mainly due to heat exchange [19]; (2) Heliothermic, which have larger body sizes and consequently lower conductance, with activities determined primarily by solar irradiation; and (3) Endothermic, which are able to produce heat by controlling hemolymph movement, flight, and wing-whirring [20].
These patterns are the result of interactions between species metabolism and heat exchange with the environment. Smaller-sized individuals have a high surface-to-volume ratio and consequently thermoregulate by gaining or losing energy according to the variation in environmental temperature [21,22]. On the other hand, for larger species, the surface-to-volume ratio is lower, decreasing the efficiency of body temperature changes by environmental heat exchange [22]. Consequently, individuals from this latter group are more tolerant of solar-irradiated environments [23,24]. Due to the influence of thermoregulation strategies on species distribution, the transformation of the landscape for anthropogenic uses may cause the replacement of the forest specialists by the species from open areas and/or habitat generalists [14,25]. However, so far, it is not known whether this filter is random among the species of each group or whether there is a direct influence of evolutionary history (evolutionary inertia) on this environmental filtering [4].
In recent years, extensive use of renewable and non-renewable resources in the Amazon has occurred. Most of this exploitation is driven by rural development, resulting in a general change in land cover and consequently, high biodiversity loss [26,27]. This is most remarkable in regions with high traffic flow facilitated by roads and waterways that increase the potential for land-use change for agriculture or livestock [28]. This scenario is typical in the Belem Centre of Endemism [29], which is included in the “Arc of Deforestation”, the region with the highest deforestation rates in Brazil [30]. These high rates were mainly promoted by the expansion of infrastructure (e.g., roads and hydroelectric power plants) and the emergence of new economic activities, such as mining, logging, livestock and soybean farms, and other industries [31,32]. In this region, deforestation increases land degradation and causes changes in species composition and fluctuations in climate conditions [33,34]. The effects of these changes are even more harmful to the most sensitive ecosystems such as aquatic ecosystems (e.g., small streams), which depend closely on riparian vegetation. Thus, any change in vegetation can affect biodiversity at the local and/or regional level [35,36,37,38,39,40].
At the local level, this transformation usually begins with the loss of riparian vegetation, resulting in the homogenization of substrates, contaminant leaching into water bodies, increasing margin erosion and changes in air and water temperature [41,42]. At the regional level, the loss of primary vegetation is most related to a decrease in the vegetation cover in drainage basins, leading to compaction and soil sealing, channeling of watercourses, as well as isolation among forest remnants, which can affect gene flow between areas [22]. In addition, most anthropogenic land uses can generate fragmented landscapes composed of secondary vegetation or areas in regeneration. Although secondary vegetation contributes to maintaining biodiversity, it is often not sufficient to support the physical structures in streams as expected for native forests [43]. Given these issues, this study aimed to assess the effects of land-use on the phylogenetic and taxonomic diversity of Odonata along an environmental gradient in the Amazon. Thus, we tested the following hypothesis: In deforested areas (e.g., pasture for cattle areas, palm plantation, and logging), the Odonata community will be more taxonomically and phylogenetically impoverished than in forested areas. We assumed that the modification of the natural habitat caused the loss of specialist forest species and favored species specialized in open areas and/or habitat generalists.
2. Material and Methods
2.1. Study Area
Sampling was performed in 195 streams in two areas of the eastern Amazon (Figure 1). The collections occurred along a land-use gradient, considering the land uses that most contribute to deforestation in this region of the Amazon [33]. In this framework, sampling was carried out in areas of cattle grazing [35], agriculture with palm monoculture [14], managed logging [7], and in forested areas [7,14,17]. Samplings were performed during the Amazonian dry season, from July to December of 2010 to 2017. The climate of both regions is classified as tropical forest AF (with rainfall occurring almost every month of the year) under the Köppen system [44], with an average annual temperature of 26 °C and an annual rainfall of up to 2500 mm, according to the National Meteorological Institute (INMET).
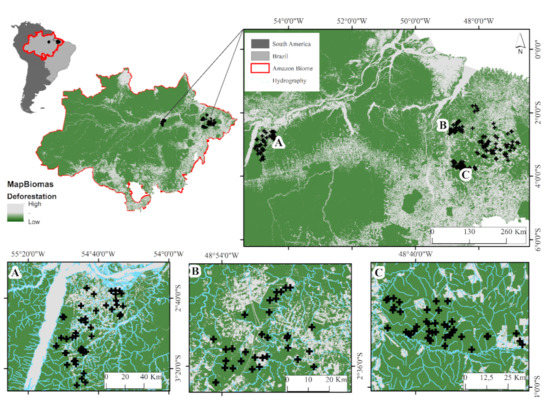
Figure 1.
Study area (streams). Tapajos Basin (A), Capim basin (B) and Acará basin (C), in the Belém. Pará, Brazil. (Source: https://mapbiomas.org/; accessed on 20 May 2020).
2.2. Biological Sampling
The collection of Odonata specimens was based on a scanning sampling method within a fixed area, which has already been used in previous studies [45,46,47,48]. The sampling consisted of collecting adult individuals along a 150 m length of each stream; each 15 m section was divided into three segments, with sampling performed only within the two first segments, to ensure greater independence of the segments. The third segment was used to allow the observers to move among segments without disturbing the substrate (for further details, see [47]). We recognize that our sampling design does not result in complete species inventories; in particular, dragonfly species that fly far from the aquatic systems may have been omitted. However, our standardized method allows comparisons of community composition among streams. The average time spent at each sampled stream was one hour. The collections were carried out between 10 a.m. and 2 p.m.; this interval is the highest luminosity period in the riverbed [21]. These were the minimum conditions necessary to ensure that all Odonata groups (thermal conformers, heliothermics, and endothermics) were active at the time of collection [21,49]. The storage and conservation of the collected odonates followed the protocol described by Lencioni [50]. The specimens were deposited in the Zoology collection of the Laboratory of Ecology and Conservation of the Federal University of Pará.
2.3. Environmental Variables and Habitat Characterization
To assess the degree of habitat degradation, habitat variables (e.g., characteristics of riparian vegetation, channel morphology and canopy cover) were measured along each transect, following the instructions in the habitat monitoring protocol of [51,52]. Additional details and descriptions of the methods can be found in Juen et al. [53]. Dissolved oxygen (mg/L), conductivity (lS/m), hydrogen potential (pH), turbidity (mg/L), temperature (°C), and total dissolved solids (TDS) were measured and obtained with electronic equipment. To obtain the percentage of primary vegetation cover, we used images downloaded and processed by the National Water Agency (ANA). Information about microbasins was extracted following “Codification of hydrographic basins by the method of Otto Pfafstetter applied at ANA”. We then used TerraClass, a project of the Brazilian government that produces systemic maps, to identify the use and coverage of deforested areas in the Brazilian Legal Amazon [54].
2.4. Phylogenetic Tree
The initial purpose was to infer a phylogenetic hypothesis containing all the Amazonian species known to date. For this, we conducted an extensive search of the literature, museum records, and unpublished data from our research group and other research groups in Latin America (members of Sociedad de Odonatologia Latinoamericana (SOL), (http://www.odonatasol.org/; accessed on 14 February 2019). We emphasize that the collection of Odonata from the Zoology Museum of the Federal University of Pará is one of those with the most significant representation of the taxon’s biodiversity for the Brazilian Amazon. In addition, we also searched the Web of Science and SciELO platforms for additional information, in which the search terms phylog*, taxonom*, systematic*, clad* and Amazon* were used together with all the common scientific and common names of Amazonian odonates. After the initial research, all articles that potentially possessed phylogenetic trees were examined, and the references cited in the studies found were used to find additional publications. In total, 26 scientific studies were used to extract information on species’ evolutionary relationships.
To reconstruct the phylogeny of odonates with Amazonian species (collection and scientific articles), we used the method “backbone”, which is simply a taxa graft onto an existing phylogeny [55]. In this case, the phylogenetic hypothesis proposed by Waller and Svensson [56] was used as a “backbone” for the construction of the supertree (http://www.odonatephenotypicdatabase.org/shiny/shinyTree/; 10 January 2018). This phylogenetic hypothesis was built using 13 genetic markers and dated by using fossil records with Bayesian inference. This hypothesis has all odonate families and about 21% of all described species; therefore, as far as the authors are aware, it is the most complete phylogeny. The species that occur in both oriental and occidental Amazon that were not included in the phylogeny by Waller and Svensson [56] are now manually included as polytomies at the base of their respective families or genera (Supplementary File S1). Using the phylogeny assembled by Waller and Svensson [56] as the backbone in the supertree procedure was necessary to avoid conflicts of information from different studies for the same families, as we did not carry out analyses to reconstruct the phylogeny. However, a compilation of data was the most parsimonious strategy to obtain the maximum amount of information [57].
We used the R platform to insert the Amazonian taxa and performed the following steps: Step 1: We numbered all the nodes. Next, we identified the basal nodes of the families and genera and named them with their respective names. Step 2: We inserted absent taxon in their respective basal nodes (genera or family). Step 3: In some cases, genera that were not present in the supertree were included and positioned as polytomies at the base of the family, considering their relationship according to studies that have already been established [58,59,60,61] (Figure 2). Step 4: Only valid species whose identification is largely resolved in the literature were included in the supertree, and in addition, the taxa underwent a review by specialists in the group. Taxa that presented some identification problems were not included. Step 5: From this supertree containing all Amazonian species, we generated 1000 phylogenies randomly shuffling the position of the species included as polytomies within their respective clades (Supplementary File S2). For this, we use the packages ape [62], Geiger [63], phylotools [64], adephylo [65] and Hmisc [66]. Similar approaches have already been used in other studies, which we highlight below: Duarte [67] and Debastiani et al. [68] for plant communities; Martins et al. [69] and Loyola et al. [70] for communities of Anura; Devictor et al. [71] and Gianuca et al. [72] for bird communities; Brum et al. [73] for primate communities. However, we did not find anything similar for the groups of invertebrates, which are the most difficult to perform, due to their extraordinary biodiversity and the paucity of studies on their phylogenetic relationships.
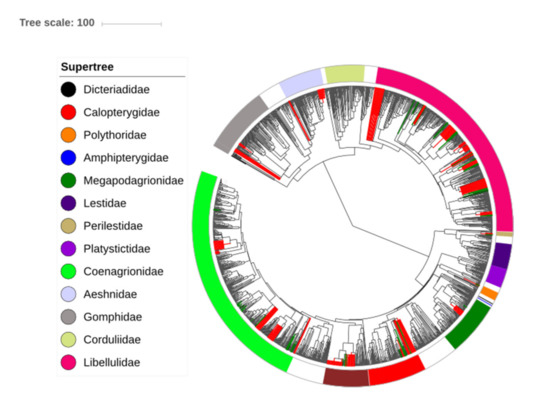
Figure 2.
Phylogenetic tree of the Odonata (modified from Waller and Svensson [56]). The branches indicate the evolutionary relationships between taxa worldwide, while green branches are Amazonian taxa and red branches are Amazonian species without molecular data inserted at the root of their respective genera (which were never included before). Families listed in the legend occur in the Brazilian Amazon and are highlighted in the phylogenetic tree according to the respective color.
The tree proposed by Waller and Svensson [56] is time-calibrated with fossils downloaded from the Paleobiology Database. They considered taxonomic groups and names found on the World Odonata List. They queried GenBank for each species in the list and then downloaded all the associated data using the R package seqinr. Two separate time-calibrated trees were generated in BEAST for computational reasons (one for Zygoptera and one for Anisoptera) and they were later combined (using the median age of the root of each subtree) into a single tree with divergence time set between the two suborders with fossils. In both analyses, the nodes of each family were named following the classification proposed in the World Odonata List (https://www.pugetsound.edu/academics/academicresources/slatermuseum/biodiversity resources/dragonflies/world-odonata-list2/; accessed on 23 July 2018).
2.5. Statistical Analysis
We calculated the standardized effect size of phylogenetic diversity (sesPD) [74], for all communities using 1000 phylogenetic trees to account for the phylogenetic uncertainty in the species relatedness. We used the null model “phylogeny. pool” to investigate whether an observed pattern could have arisen by chance [75]. Positive values indicate higher phylogenetic diversity in communities than expected according to the null model, while negative values indicate lower phylogenetic diversity than expected by the null model. To calculate sesPD, we used the picante package [76]. We used the sesPD index as a response variable, the environmental variables that described the studied sites as fixed effects, and the microbasins as a random effect. We considered the environmental variables as fixed effects in the model because they describe, in detail, the variation in the studied environments; thus, this allowed the model to test the effects of land-use changes along an environmental gradient. On the other hand, for the random effects, we selected the microbasins because, for this study, we were not testing the possible ecological effects of the microbasins on the community structure.
For each model, the parameters—Coefficient of Variation and Standard Deviation—were generated from the effects of fixed variables on community phylogenetic diversity (sesPD). We then calculated the average of the 1000 coefficients of variation and standard deviations of the fixed models. Subsequently, a type I error probability (p-value; α = 0.05) was estimated for each mean of the coefficients of variation and standard deviation of the fixed variables. In addition, we generated an average of the R2 values for fixed and random models. The values of the global index of Moran (I) were tested in the residual model [77]. To assess the effects of land use on the richness and abundance of Odonata species, we also performed a Generalized Linear Mixed Model (GLMM). We use environmental metrics as explanatory variables and the microbasins in the study area as a random variable. We conducted these analyses using the lme4 package [78] with the glmer function. To model phylogenetic diversity (sesPD), we used the Gaussian distribution. For both metrics of abundance and richness, we used a Poisson distribution.
However, before formally testing the effects of environmental variables on phylogenetic diversity, species richness, and abundance, we performed data reduction to avoid collinearity of the environmental variables. Since there were eleven habitat-structuring variables (Supplementary File S3), we used Principal Component Analysis (PCA) to calculate a small number of independent variables. The first two main components explained 54.1% of the variability in the variables of habitat structuring (Table 1, Figure 3). The variables’ wood debris volume (r = 0.688), mean canopy cover (r = 0.928), Mean canopy cover of small trees (0.916), Mean canopy cover of woody understory (r = 0.863) and the proportion of mean primary vegetation cover by microbasins (r = 0.609) presented relationships greater than 60% with the first two axes [79] and were selected as predictors in the models (Figure 4). All analyses were calculated using the R software (R Development Core Team 2019).

Table 1.
Results of the Principal Components Analysis (PCA) performed on the correlation matrix of the environmental variables describing the cover of different habitat types.
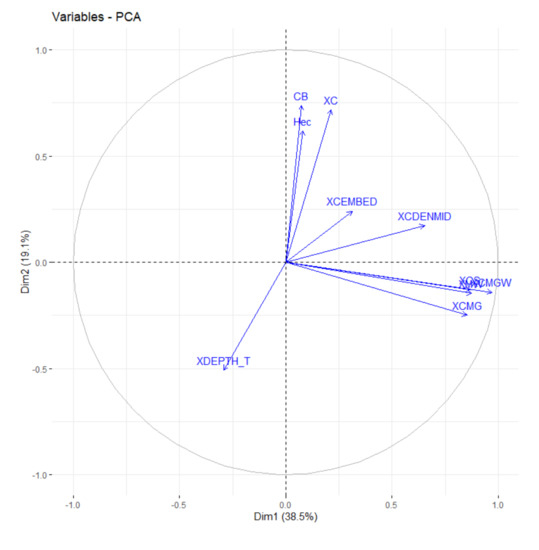
Figure 3.
Principal component analysis (PCA) based on environmental variables of sampled streams. Wood debris volume (XC); Mean canopy coverage of the channel (XCDENMID); Mean canopy cover of small trees (XCS); Mean canopy cover of woody understory (XMW); Mean Canopy Coverage (XXC); Mean total canopy cover (XCMG), Mean coverage of woody canopy (XCMGW); Mean depth thalweg (XDEPTH_T); Mean Channel Immersion (XCEMBED); Proportion of primary vegetation (by microbasin) (CB); Total size of the microbasins (Hec).
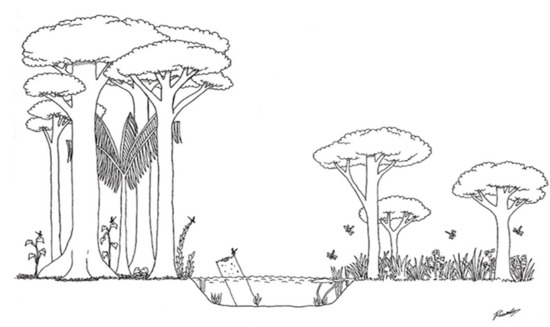
Figure 4.
A hypothetical summary describing the physical structure of the streams sampled in the study, according to variables selected by the PCA axes. The left bank of the stream represents a structured forest environment, with the presence of a closed canopy formed by the canopies of large trees, which act as permanent sources of wood (perch or oviposition point) inside and outside the channel. The right side of the stream represents an environment altered for anthropogenic uses, with few and sparse large trees and a predominance of shrubs and grasses, allowing the entry of more light and heat.
3. Results
A total of 5378 individuals were collected and 126 Odonata species were identified. The families with the highest species richness were Libellulidae (n = 51 spp.), Coenagrionidae (n = 46 spp.), Calopterygidae (n = 11 spp.) and Gomphidae (n = 5 spp.). The most abundant species were Erythrodiplax basalis [80] (n = 424), Chalcopteryx rutilans [81] (n = 369), Mnesarete aenea [81] (n = 589), Argia infumata [82] (n = 335) and Heteragrion silvarum [82] (n = 323) (Supplementary File S1).
When evaluating the effects of physical habitat variables on the phylogenetic diversity of the Odonata community, the coefficients showed that the metrics of wood debris volume and the percent mean canopy cover of small trees had a positive relationship with the phylogenetic diversity of Odonata. However, only the mean canopy cover of small trees was significant (Estimate = 0.540; Sdt. Error = 0.078; p = 0.023), suggesting that the increase in small trees in the stream margins affected the phylogenetic diversity of Odonata. On the other hand, the variables of mean canopy cover of woody understory, mean canopy coverage and the proportion of mean primary vegetation by microbasin had a negative relationship with the phylogenetic diversity of Odonata, but none of these variables were significant in the models (Table 1). Lastly, the final mean R2 of the coefficient of variation of the fixed portion of the model explained 66% (R2 = 0.660) of the variation in the data, and the final mean R2 of the random portion of the model explained 54% (R2 = 0.540) (Table 2).
Table 2.
Results of General Linear Mixed Model (GLMM) evaluating the effects of structural physical variables of streams on the phylogenetic diversity of the Odonata community (sesPD) in the Brazilian Amazon.
When assessing the effects of the structural physical variables of streams on species abundance, only the variable percent mean canopy cover of small trees exhibited a significant negative effect (Estimate = −0.1636; Std. Error = 0.0694; Df = 1; p-value = 0.0184). The fixed portion of the model explained 22% (R2 = 0.223) of the variation in the data and the random portion of the model explained 7% (R2 = 0.071). In the evaluation of the physical habitat effects on species richness, only the variable mean canopy coverage showed a significant negative effect (Estimate = −0.0524; Std. Error = 0.0129; Df = 1; p-value = 0.0057). The fixed portion of the model explained 20% (R2 = 0.208) of the variation in the data and the random portion of the model explained 11% (R2 = 0.114) (Table 3).
Table 3.
Results of General Linear Mixed Model (GLMM), describing the effects of environmental variables on the abundance and taxonomic richness of Odonata in the Brazilian Amazon.
4. Discussion
Our results suggest that the expansion of anthropogenic land use over the natural landscape in the Brazilian Amazon affects the phylogenetic diversity of Odonata. Physical attributes of streams that are presumably more frequent in areas modified by anthropogenic activities (shrubs around streams) had a positive relationship with the phylogenetic diversity of Odonata [4,83]. In this context, local metrics from the stream riparian zones directly affected the phylogenetic diversity of Odonata communities. On the other hand, regional metrics, such as the proportion of primary vegetation coverage by microbasins did not significantly affect phylogenetic diversity. A similar result was obtained when evaluating the expansion of land-use for anthropogenic uses on the taxonomic diversity of Odonata species (richness and abundance). Although the models were significant, they showed weak support as predictors of variation in community structure.
Notably, the variation in shrub vegetation is a metric that accounts for most habitats in open areas, as the predominance of shrub vegetation suggests the absence of large tree cover [84,85]. This may result from anthropogenic land uses, as the predominance of shrubby vegetation is more frequent on the banks of streams that drain pastures, palm monoculture, and other anthropogenic landscapes [86]. The positive relationship between the canopy of small trees and phylogenetic diversity may respond to the increased invasion of species adapted to disturbed environments [87,88]. This result is not consistent with the hypothesis proposed here that areas of anthropogenic use would show less phylogenetic diversity in response to a subset of species that would be favored by the environmental conditions created in the disturbed environments [89].
In general, areas of human use lose specialized species of forest habitats and favor habitat generalist species. This loss may be happening throughout the phylogeny and, therefore, some families may be negatively affected more than others [90]. All our results lead us to believe that land-use changes may affect specific groups within families and/or genera. We suggest that in the future, with the availability of a better-resolved phylogeny for Neotropical species, studies should assess lineage losses within families and/or genera. In environments with higher primary vegetation, there is a predominance of some species of the genera Acanthallagma, Mnesarete, Aeolagrion, Microstigma, and Mecistogaster. These genera belong to the suborder Zygoptera and contain most of the species that specialize in forest habitats. When analyzing the phylogeny, these groups are closely related, as they belong almost entirely to the Coenagrionidae family [91,92]. On the other hand, in the most deforested environments, there is a predominance of species that are considered habitat generalists from the genera Erythrodiplax, Orthemis, Acanthagrion, and Ischnura, and the majority of species from the genus Argia [35,93,94,95]. In these deforested environments, they found representatives from the two suborders, Anisoptera and Zygoptera, and the two most diverse families in Amazonia, Coenagrionidae and Libellulidae, which exhibit completely antagonistic reproductive and ecophysiological behavior [19]. However, these species have particulars in common and these particulars would favor some species of the two families. For example, Erythrodiplax fusca, Diastatops obscura and Ischnura capreolus have a strong relationship with open areas and oviposition occurs in lentic environments [7,46]. The interaction between these families and environmental conditions has been proposed to be useful environmental indicators [73]. Furthermore, the high phylogenetic diversity found in our study may reflect the high diversity of the Libellulidae family, which, alone, represented 48% of all species observed. Most Libellulidae possess heliothermic characteristics, as they spend most of their time flying and require direct sunlight for their foraging [7,19]. It is possible that anthropogenic processes may favor species in this family, as the removal of riparian vegetation has expanded the amplitude of the spatial niche [7,19].
Similar patterns have been recorded for other taxonomic groups, such as plants [96], where smaller fragments were phylogenetically more dispersed, while larger fragments were phylogenetically more clustered, possibly in response to species invasions into small internal fragments. Lineages that tolerate environmental changes are probably among the terminal nodes of phylogeny, such as genera and species. Thus, within the same family, they could have distinct lineages with different responses to disturbed environments [9,96]. The findings from this study may also reflect the distribution of specimens in the immature stages of Odonata, since several studies have highlighted a strong congruence between the distribution of Odonata larvae and adults [97,98]. In some previous studies of Odonata, the community structure was affected by the same environmental variables when considering both adults and immature states [97,99,100]. For some genera, water temperature is an important factor for community structure; for example, the genus Acanthagrion is more tolerant of water temperature variation [101]. Dissolved oxygen is also an important predictor in the community structure of some genera and can have a strong influence on the reproductive strategies of most species. This may be related to oviposition behavior, as adult females may select the most appropriate habitats for oviposition, mainly ovipositing in more oxygenated waters [102,103].
In conclusion, the conversion of native forest to land use for anthropogenic purposes affects the phylogenetic diversity of Odonata. However, the effects found on taxonomic diversity (richness and abundance) were weak. The increase in phylogenetic diversity should be interpreted with caution because it reflects the increase in specialist species from open areas and/or habitat generalists and a decrease in specialist species from forest habitats, which are restricted to a specific range of environmental conditions. It is important to highlight that we evaluated the recent effects of land use in the Amazon (a little over 100 years) on the phylogeny of Odonata. We conclude that the effects found are not related to the evolutionary history of odonates but to the loss of more conserved lineages and the invasions of species adapted to the disturbed environments of the most phylogenetically derived clades (genera and species). The main outcome is the loss of closely related species, which probably perform similarly in the studied ecosystems. Despite being an order of predatory species, the Odonata response pattern is congruent with other orders of aquatic insects that are experiencing similar stressors [104,105,106].
Finally, our results showed that land use affects the phylogenetic diversity of Amazonian odonates. However, the same was not seen for taxonomic diversity since the effects found were to be weak. Certainly, our results reinforce the discussions that metrics such as phylogenetic and functional diversity may be more accurate predictors of anthropic effects than taxonomic metrics. Therefore, we do not discard the hypothesis of a possible effect of land use on the taxonomic diversity of adult Odonata. We suggest that future studies invest in multivariate analysis of matrices, as they will likely find results consistent with ours. In addition, it is necessary to increase the buffer zone on the banks of streams, to mitigate the effects of the surrounding land-use changes on forests’ specialist species. However, we recommend caution when interpreting the results of phylogenetic diversity, since high values of diversity are not always linked to environmental integrity [10,96].
Supplementary Materials
The following are available online at https://www.mdpi.com/article/10.3390/f12081061/s1, Table S1: Supplementary File S1, Table S2: Supplementary File S2, Table S3: Supplementary File S3.
Author Contributions
Conceptualization, F.G.d.C., L.D. and L.J.; methodology, F.G.d.C., G.D.d.S.S., G.N., L.D. and L.J.; software, F.G.d.C., G.N. and G.D.d.S.S.; validation, L.J. and L.D.; formal analysis, F.G.d.C. and G.N.; investigation, F.G.d.C.; resources, L.J.; data curation, F.G.d.C. and L.J.; writing—original draft preparation, F.G.d.C. and G.N.; writing—review and editing, F.G.d.C.; visualization, L.J. and L.D.; supervision, L.J. and L.D.; project administration, L.J.; funding acquisition, F.G.d.C. and L.J. All authors have read and agreed to the published version of the manuscript.
Funding
We thank the National Council for Scientific and Technological Development (CNPq) for financing the projects entitled “Influence of the different types of land-use on the biodiversity of eastern Amazonia” (grant number: 449314/2014-2), “Resilience times of aquatic communities after selective logging in eastern Amazonia” (grant numbers: 449314/2014-2; 481015/2011-6). Finally, we thank the Pró-Reitoria de Pesquisa e Pós-Graduação (PROPESP)/Universidade Federal do Pará (UFPA) for the support received from the Qualified Publication Support Program.
Institutional Review Board Statement
Ethical review and approval were waived for this study. According to Federal Law nº 11.794/08, CEUA’s competence is linked to the evaluation of teaching and research activities involving vertebrate animals or materials and data derived from them or part of them.
Informed Consent Statement
Not applicable.
Acknowledgments
We would like to thank Conservation International (CI), Agropalma Group, 33 Forest, Foundation for the State of Amazonian Research (FAPESPA), Rainforest Institute (IFT) and CIKEL Ltd., for their financial and logistical support. We thank the National Council for Scientific and Technological Development (CNPq) for financing the projects entitled “Influence of the different types of land-use on the biodiversity of eastern Amazonia” (grant number: 449314/2014-2), “Resilience times of aquatic communities after selective logging in eastern Amazonia” (grant numbers: 449314/2014-2; 481015/2011-6). We also thank the Coordenação de Aperfeiçoamento de Pessoal de Nível Superior (Capes) for PhD scholarships to FGC (process: 303252/2013-8) and CNPq for the research productivity scholarships for LD (process: 307527/2018-2) and LJ (process: 304710/2019-9).
Conflicts of Interest
The authors declare no conflict of interest.
References
- Hawkins, C.P.; Mykrä, H.; Oksanen, J.; Vander Lain, J.J. Environmental disturbance can increase beta diversity of stream macroinvertebrate assemblages. Glob. Ecol. Biogeogr. 2015, 24, 483–494. [Google Scholar] [CrossRef]
- Pennington, R.T.; Hughes, M.; Moonlight, P.W. The Origins of Tropical Rainforest Hyperdiversity. Trends Plant. Sci. 2015, 20, 5–7. [Google Scholar] [CrossRef]
- Walpole, M.; Almond, R.E.A.; Besançon, C.; Butchart, S.H.M.; Carr, G.M.; Collen, B.; Collette, L.; Davidson, N.C.; Fazel, A.M.; Galloway, J.N.; et al. Tracking Progress Toward the 2010 Biodiversity Target and Beyond. Ecology 2015, 325, 1503–1504. [Google Scholar] [CrossRef] [PubMed]
- Bybee, S.; Córdoba-Aguilar, A.; Duryea, M.C.; Futahashi, R.; Hansson, B.; Lorenzo-Carballa, M.O.; Schilder, R.; Stoks, R.; Suvorov, A.; Svensson, E.I.; et al. Odonata (dragonflies and damselflies) as a bridge between ecology and evolutionary genomics. Front. Zool. 2016, 13, 1–20. [Google Scholar] [CrossRef] [PubMed]
- Sánchez-herrera, M.; Ware, J.L. Biogeography of Dragonflies and Damselflies: Highly Mobile Predators. Glob. Adv. Biogeogr. 2011, 14, 953–978. [Google Scholar]
- Resende, B.O.; Ferreira, V.R.S.; Brasil, L.S.; Calvão, L.B.; Mendes, T.P.; De Carvalho, F.G.; Mendoza-Penagos, C.C.; Bastos, R.C.; Brito, J.S.; de Oliveira Junior, J.M.B.; et al. Impact of environmental changes on the behavioral diversity of the Odonata (Insecta) in the Amazon. Sci. Rep. 2021, 11, 9742. [Google Scholar] [CrossRef] [PubMed]
- Calvão, L.B.; Juen, L.; Oliveira-Junior, J.M.B.; Batista, J.D.; De Marco, P.J. Land use modifies Odonata diversity in streams of the Brazilian Cerrado. J. Insect Conserv. 2018, 22, 675–685. [Google Scholar] [CrossRef]
- Webb, C.O.; Ackerly, D.D.; Mcpeek, M.A.; Donoghue, M.J. Phylogenies and Community Ecology. Annu. Rev. Ecol. Syst. 2002, 33, 475–505. [Google Scholar] [CrossRef]
- Arroyo-Rodríguez, V.; Cavender-Bares, J.; Escobar, F.; Melo, F.P.L.; Tabarelli, M.; Bráulio, S.A. Maintenance of tree phylogenetic diversity in a highly fragmented rain forest. J. Ecol. 2012, 100, 702–711. [Google Scholar] [CrossRef]
- Gerhold, P.; Cahill, J.F.; Winter, M.; Bartish, I.V.; Prinzing, A. Phylogenetic patterns are not proxies of community assembly mechanisms (they are far better). Funct. Ecol. 2015, 29, 600–614. [Google Scholar] [CrossRef]
- Faith, D.P.; Magallón, S.; Hendry, A.P.; Conti, E.; Yahara, T.; Donoghue, M.J. Evosystem services: An evolutionary perspective on the links between biodiversity and human well-being. Curr. Opin. Environ. Sustain. 2010, 2, 66–74. [Google Scholar] [CrossRef]
- Pillar, V.D.; Duarte, L.D.S. A framework for metacommunity analysis of phylogenetic structure. Ecol. Lett. 2010, 13, 587–596. [Google Scholar] [CrossRef]
- Díaz, S.; Purvis, A.; Cornelissen, J.H.C.; Mace, G.M.; Donoghue, M.J.; Ewers, R.M.; Jordano, P.; Pearse, W.D. Functional traits, the phylogeny of function, and ecosystem service vulnerability. Ecol. Evol. 2013, 3, 2958–2975. [Google Scholar] [CrossRef]
- Carvalho, F.G.; de Oliveira Roque, F.; Barbosa, L.; de Assis Montag, L.F.; Juen, L. Oil palm plantation is not a suitable environment for most forest specialist species of Odonata in Amazonia. Anim. Conserv. 2018, 21, 1–8. [Google Scholar] [CrossRef]
- Bastos, R.C.; Brasil, L.S.; Oliveira-Junior, J.M.B.; Carvalho, F.G.; Lennox, G.D.; Barlow, J.; Juen, L. Morphological and phylogenetic factors structure the distribution of damselfly and dragonfly species (Odonata) along an environmental gradient in Amazonian streams. Ecol. Indic. 2021, 122, 107257. [Google Scholar] [CrossRef]
- Qian, H.; Deng, T.; Jin, Y.; Mao, L.; Zhao, D.; Ricklefs, R.E. Phylogenetic dispersion and diversity in regional assemblages of seed plants in China. Proc. Natl. Acad. Sci. USA 2019, 116, 23192–23201. [Google Scholar] [CrossRef] [PubMed]
- Oliveira-Junior, J.M.B.; Juen, L. The Zygoptera/Anisoptera Ratio (Insecta: Odonata): A New Tool for Habitat Alterations Assessment in Amazonian Streams. Neotrop. Entomol. 2019, 48, 552–560. [Google Scholar] [CrossRef]
- Dutra, S.; De Marco, P. Bionomic differences in odonates and their influence on the efficiency of indicator species of environmental quality. Ecol. Indic. 2015, 49, 132–142. [Google Scholar] [CrossRef]
- De Marco, P.; Batista, J.D.; Cabette, H.S.R. Community assembly of adult odonates in tropical streams: An ecophysiological hypothesis. PLoS ONE 2015, 10, e0123023. [Google Scholar] [CrossRef] [PubMed]
- Corbet, P.S.; May, M.L. Fliers and perchers among Odonata: Dichotomy or multidimensional continuum? A provisional reappraisal the flier/percher template. Int. J. Odonatol. 2008, 11, 155–171. [Google Scholar] [CrossRef]
- May, M.L. Thermoregulation and adaptation to temperature in dragonflies (Odonata: Anisoptera). Ecol. Monogr. 2009, 4, 1–32. [Google Scholar] [CrossRef]
- Hassall, C.; Thompson, D.J. The effects of environmental warming on odonata: A review. Int. J. Odonatol. 2008, 11, 131–153. [Google Scholar] [CrossRef]
- Corbet, P.S.; Suhling, F.; Soendgerath, D. Voltinism of odonata: A review. Int. J. Odonatol. 2006, 9, 1–44. [Google Scholar] [CrossRef]
- Juen, L.; Marco, P. De Dragonfly endemism in the Brazilian Amazon: Competing hypotheses for biogeographical patterns. Biodivers. Conserv. 2012, 21, 3507–3521. [Google Scholar] [CrossRef]
- Dalzochio, M.S.; Périco, E.; Renner, S.; Sahlén, G.G. Effect of tree plantations on the functional composition of Odonata species in the highlands of southern Brazil Effect of tree plantations on the functional composition of Odonata species in the highlands of southern Brazil. Hydrobiologia 2018, 808, 283–300. [Google Scholar] [CrossRef]
- Barlow, J.; Lennox, G.D.; Ferreira, J.; Berenguer, E.; Lees, A.C.; Mac Nally, R.; Thomson, J.R.; Frosini, S.; Ferraz, D.B.; Louzada, J.; et al. double biodiversity loss from deforestation. Nature 2016, 535, 144–147. [Google Scholar] [CrossRef] [PubMed]
- Nobre, C.A.; Sampaio, G.; Borma, L.S.; Castilla-Rubio, J.C.; Silva, J.S.; Cardoso, M. Land-use and climate change risks in the Amazon and the need of a novel sustainable development paradigm. PNAS 2016, 113, 10759–10768. [Google Scholar] [CrossRef]
- Garrett, R.D.; Koh, I.; Lambin, E.F.; le Polain de Waroux, Y.; Kastens, J.H.; Brown, J.C. Intensification in agriculture-forest frontiers: Land use responses to development and conservation policies in Brazil. Glob. Environ. Chang. 2018, 53, 233–243. [Google Scholar] [CrossRef]
- Cardoso, M.; Silva, D.A.; Rylands, A.B.; Fonseca, G.A.B.D.A. The Fate of the Amazonian Areas of Endemism. Conserv. Biol. 2005, 19, 689–694. [Google Scholar]
- Fearnside, P.M. Deforestation in Brazilian Amazonia: History, rates, and consequences. Conserv. Biol. 2005, 19, 680–688. [Google Scholar] [CrossRef]
- Carvalho, W.D.; Mustin, K.; Hilário, R.R.; Vasconcelos, I.M.; Eilers, V.; Fearnside, P.M. Deforestation control in the Brazilian Amazon: A conservation struggle being lost as agreements and regulations are subverted and bypassed. Perspect. Ecol. Conserv. 2019, 17, 122–130. [Google Scholar] [CrossRef]
- Raftopoulos, M.; Morley, J. Ecocide in the Amazon: The contested politics of environmental rights in Brazil. Int. J. Hum. Rights 2020, 24, 1616–1641. [Google Scholar] [CrossRef]
- Amigo, I. The Amazon’s Fragile Future. Nature 2020, 578, 505–507. [Google Scholar] [CrossRef] [PubMed]
- Fuller, C.; Ondei, S.; Brook, B.W.; Buettel, J.C. Protected-area planning in the Brazilian Amazon should prioritize additionality and permanence, not leakage mitigation. Biol. Conserv. 2020, 248, 108673. [Google Scholar] [CrossRef]
- Miguel, T.B.; Oliveira-junior, J.M.B.; Ligeiro, R.; Juen, L. Odonata (Insecta) as a tool for the biomonitoring of environmental quality. Ecol. Indic. 2017, 81, 555–566. [Google Scholar] [CrossRef]
- Pletterbauer, F.; Melcher, A.; Graf, W. Climate Change Impacts in Riverine Ecosystems; Aquatic Ecology Series; Springer: Cham, Switzerland, 2018; Volume 8, pp. 203–224. [Google Scholar] [CrossRef]
- Dala-Corte, R.B.; Melo, A.; Siqueira, T.; Bini, L.M.; Martins, R.T.; Cunico, A.M.; Pes, A.M.; Magalhães, A.L.B.; Godoy, B.S.; Leal, C.G.; et al. Thresholds of freshwater biodiversity in response to riparian vegetation loss in the Neotropical region. J. Appl. Ecol. 2020, 57, 1391–1402. [Google Scholar] [CrossRef]
- Carlucci, M.B.; Seger, G.D.S.; Sheil, D.; Amaral, I.L.; Chuyong, G.B.; Ferreira, L.V.; Galatti, U.; Hurtado, J.; Kenfack, D.; Leal, D.C.; et al. Phylogenetic composition and structure of tree communities shed light on historical processes infl uencing tropical rainforest diversity. Ecography Cop. 2016, 39, 1–10. [Google Scholar] [CrossRef]
- Steffen, W.; Richardson, K.; Rockström, J.; Cornell, S.E.; Fetzer, I.; Bennett, E.M.; Biggs, R.; Carpenter, S.R.; De Vries, W.; De Wit, C.A.; et al. Planetary boundaries: Guiding changing planet. Science 2015, 347, 1259855. [Google Scholar] [CrossRef]
- Leal, C.G.; Lennox, G.D.; Ferraz, S.F.B.; Ferreira, J.; Gardner, T.A.; Thomson, J.R.; Berenguer, E.; Lees, A.C.; Hughes, R.M.; MacNally, R.; et al. conservation of tropical aquatic species. Science 2020, 121, 117–121. [Google Scholar] [CrossRef] [PubMed]
- Meleason, M.A.; Quinn, J.M. Influence of riparian buffer width on air temperature at Whangapoua Forest, Coromandel Peninsula, New Zealand. For. Ecol. Manag. 2004, 191, 365–371. [Google Scholar] [CrossRef]
- Prudente, B.S.; Pompeu, P.S.; Juen, L. Effects of reduced-impact logging on physical habitat and fish assemblages in streams of Eastern Amazonia. Freshw. Biol. 2016, 62, 303–316. [Google Scholar] [CrossRef]
- Zermeño-Hernández, I.; Pingarroni, A.; Martínez-Ramos, M. Agricultural land-use diversity and forest regeneration potential in human-modified tropical landscapes. Agric. Ecosyst. Environ. 2016, 230, 210–220. [Google Scholar] [CrossRef]
- Peel, M.C.; Finlayson, B.L.; McMahon, T.A. Updated world map of the Koppen-Geiger climate classification. Meteorol. Z. 2007, 11, 1633–1644. [Google Scholar] [CrossRef]
- Brasil, L.S.; Oliveira-Júnior, J.M.; Calvão, L.B.; Carvalho, F.G.; Monteiro-Júnior, C.S.; Dias-Silva, K.; Juen, L. Spatial, biogeographic and environmental predictors of diversity in Amazonian Zygoptera. Insect Conserv. Divers. 2018, 11, 174–184. [Google Scholar] [CrossRef]
- Cezário, R.R.; Firme, P.P.; Pestana, G.C.; Vilela, D.S.; Juen, L.; Cordero-Rivera, A.; Guillermo, R. Sampling Methods for Dragonflies and Damselflies. Meas. Arthropod Biodivers. 2020, 9, 223–240. [Google Scholar] [CrossRef]
- Nessimian, J.L.; Venticinque, E.M.; Zuanon, J.; De Marco, P.; Gordo, M.; Fidelis, L.; D’arc Batista, J.; Juen, L. Land use, habitat integrity, and aquatic insect assemblages in Central Amazonian streams. Hydrobiologia 2008, 614, 117–131. [Google Scholar] [CrossRef]
- Simaika, J.P.; Samways, M.J. Biophilia as a universal ethic for conserving biodiversity. Conserv. Biol. 2010, 24, 903–906. [Google Scholar] [CrossRef] [PubMed]
- Corbet, P.S. Dragonflies: Behaviour and Ecology of Odonata; Harley Books; Martins: Colchester, UK, 1999. [Google Scholar]
- Lencioni, F.A.A. 2006b Damselflies of Brazil, an Illustrated Identification Guide: II–Coenagrionidae Families; Print Editora: São Paulo, Brazil, 2006. [Google Scholar]
- Peck, D.V.; Herlihy, B.H.; Hill, R.M.; HUgles, P.R.; Kaufmann, D.J.; Klemm, J.M.; Lazoechak, F.H.; McCormick, S.A.; Peterson, P.L.; Ringold, T.; et al. Environmental Monitoring and Assessment Program-Surface Waters Western Pilot Study: Field Operations Manual for Wadeable Streams; US Environmental Protection Agency: Washington, WA, USA, 2006; p. 275.
- Kaufmann, P.R.; Levine, P.; Robison, E.G.; Seeliger, C.; Peck, D.V. Quantifying Physical Habitat in Wadeable Streams; EPA/620/R-99/003; U.S. Environmental Protection Agency: Washington, DC, USA, 1999.
- Juen, L.; Cunha, E.J.; Carvalho, F.G.; Ferreira, M.C.; Begot, T.O.; Andrade, A.L.; Shimano, Y.; Leão, H.; Pompeu, P.S.; Montag, L.F.A. Effects of Oil Palm Plantations on the Habitat Structure and Biota of Streams in Eastern Amazon. River Res. Appl. 2016, 32, 2081–2094. [Google Scholar] [CrossRef]
- Bernard, E.; Barbosa, L.; Carvalho, R. Participatory GIS in a sustainable use reserve in Brazilian Amazonia: Implications for management and conservation. Appl. Geogr. 2010, 31, 564–572. [Google Scholar] [CrossRef]
- Soltis, D.; Soltis, P.; Endress, P.; Chase, M.W.; Manchester, E.; Judd, W.; Majure, L.; Mavrodiev, E. Phylogeny and Evolution of the Angiosperms; University of Chicago Press: Chicago, IL, USA, 2018; ISBN 978-0226383613. [Google Scholar]
- Waller, J.T.; Svensson, E.I. Body size evolution in an old insect order: No evidence for Cope’s Rule in spite of fitness benefits of large size. Evolution 2017, 71, 2178–2193. [Google Scholar] [CrossRef]
- Webb, C.O.; Donoghue, M.J. Phylomatic: Tree assembly for applied phylogenetics. Mol. Ecol. Notes 2005, 5, 181–183. [Google Scholar] [CrossRef]
- Dijkstra, K.D.B.; Kalkman, V.J.; Dow, R.A.; Stokvis, F.R.; Van Tol, J. Redefining the damselfly families: A comprehensive molecular phylogeny of Zygoptera (Odonata). Syst. Entomol. 2014, 39, 68–96. [Google Scholar] [CrossRef]
- Carle, F.L.; Kjer, K.M.; May, M.L. A molecular phylogeny and classification of Anisoptera (Odonata). Arthropod Syst. Phylogeny 2015, 73, 281–301. [Google Scholar]
- Lestsch, H.; Gottsberger, B.; Ware, J.L. Not going with the flow: A comprehensive time-calibrated phylogeny of dragonflies (Anisoptera: Odonata: Insecta) provides evidence for the role of lentic habitats on diversification. Mol. Ecol. 2016, 25, 1340–1353. [Google Scholar] [CrossRef] [PubMed]
- Torres-pachón, M.; Novelo-Gutiérrez, R.; Los, A.E. De Phylogenetic analysis of the genus Argia Rambur, 1842 (Odonata: Coenagrionidae), based on morphological characters of larvae and mitochondrial DNA sequences. Org. Divers. Evol. 2017, 1842, 409–420. [Google Scholar] [CrossRef]
- Paradis, E.; Schliep, K. ape 5.0: An environment for modern phylogenetics and evolutionary analyses in R. Bioinformatics 2019, 35, 526–528. [Google Scholar] [CrossRef] [PubMed]
- Pennell, M.W.; Eastman, J.M.; Slater, G.J.; Brown, J.W.; Uyeda, J.C.; Fitzjohn, R.G.; Alfaro, M.E.; Harmon, L.J. macroevolutionary models to phylogenetic trees. Bioinformatics 2014, 30, 2216–2218. [Google Scholar] [CrossRef] [PubMed]
- Revell, L.J. phytools: An R package for phylogenetic comparative biology (and other things). Methods Ecol. Evol. 2012, 217–223. [Google Scholar] [CrossRef]
- Dray, S.; Dufour, A. The ade4 Package: Implementing the Duality Diagram for Ecologists. J. Stat. Softw. 2007, 22, 1–20. [Google Scholar] [CrossRef]
- Tian, L.; Cai, T.; Goetghebeur, E.; Wei, L. Model evaluation based on the sampling distribution of estimated absolute prediction error. Biometrika 2007, 94, 297–311. [Google Scholar] [CrossRef]
- Duarte, L.D.S. Phylogenetic habitat filtering influences forest nucleation in grasslands. Oikos 2011, 120, 208–215. [Google Scholar] [CrossRef]
- Debastiani, V.J.; Muller, S.C.; Oliveira, J.M.; Rocha, F.S.; Sestren-Bastos, M.C.; Duarte, L.D.S. Recurrent patterns of phylogenetic habitat filtering in woody plant communities across phytogeographically distinct grassland-forest ecotones. Community Ecol. 2015, 16, 1–9. [Google Scholar] [CrossRef][Green Version]
- Martins, C.D.A.; Roque, F.D.O.; Santos, B.A. What Shapes the Phylogenetic Structure of Anuran Communities in a Seasonal Environment? The Influence of Determinism at Regional Scale to Stochasticity or Antagonistic Forces at Local Scale. PLoS ONE 2015, 10, 1–14. [Google Scholar] [CrossRef] [PubMed]
- Loyola, R.D.; Lemes, P.; Brum, F.T.; Provete, D.B.; Duarte, L.D.S. Clade-specific consequences of climate change to amphibians in Atlantic Forest protected areas. Ecography 2014, 37, 65–72. [Google Scholar] [CrossRef]
- Devictor, V.; Clavel, J.; Julliard, R. Defining and measuring ecological specialization. J. Appl. Ecol. 2010, 47, 15–25. [Google Scholar] [CrossRef]
- Gianuca, A.T.; Dias, R.A.; Debastiani, V.J.; Duarte, L.D.S. Habitat filtering influences the phylogenetic structure of avian communities across a coastal gradient in southern Brazil. Austral. Ecol. 2014, 39, 29–38. [Google Scholar] [CrossRef]
- Brum, F.T.; Debastiani, V.J.; Loyola, R.; Duarte, L.D.S. Clade-specific impacts of human land use on primates. Nat. E Conserv. 2014, 12, 144–149. [Google Scholar] [CrossRef]
- Faith, D.P. Conservation evaluation and phylogenetic diversity. Biol. Conserv. 1992, 61, 1–10. [Google Scholar] [CrossRef]
- Webb, C.O. Exploring the Phylogenetic Structure of Ecological Communities: An Example for Rain Forest Trees. Am. Nat. Smaller 2000, 156, 145–155. [Google Scholar] [CrossRef]
- Kembel, S.W.; Cowan, P.D.; Helmus, M.R.; Cornwell, W.K.; Morlon, H.; Ackerly, D.D.; Blomberg, S.P.; Webb, C.O. Picante: R tools for integrating phylogenies and ecology. Bioinformatics 2010, 26, 1463–1464. [Google Scholar] [CrossRef]
- Diniz-Filho, J.A.F.; Bini, L.M.; Hawkins, B.A. Spatial autocorrelation and red herrings in geographical ecology. Glob. Ecol. Biogeogr. 2003, 12, 53–64. [Google Scholar] [CrossRef]
- Bates, D.; Mächler, M.; Bolker, B.; Walker, S. Fitting Linear Mixed-Effects Models Using lme4. J. Stat. Softw. 2015, 67, 1–48. [Google Scholar] [CrossRef]
- Legendre, P.; Legendre, L. Numeral Ecology; Elsevier: Amsterdam, The Netherlands, 1998; Volume IX, p. 839. [Google Scholar]
- Kirby, W.F. A Synonymic Cataloque of Neuroptera Odonta, or Dragonflies, with an Appendix of Fossil Species; Gurney and Jackson: London, UK, 1890; Volume IX, p. 202. [Google Scholar]
- Rambur, P. Histoire Naturelle des Insectes: Neuropteres. Librairie Encyclopédique de Roret: Paris, France, 1842; Volume XVII, p. 534. [Google Scholar]
- Selys, E.L. Biology of Odonata. Des Lettres des B. art. Belgique 1862, 2, 5–44. [Google Scholar]
- Cavender-Bares, J.; Kozak, K.H.; Fine, P.V.A.; Kembel, F.; Kembel, S.W. The merging of community ecology and phylogenet-ic biology. Ecol. Lett. 2009, 12, 693–715. [Google Scholar] [CrossRef] [PubMed]
- Chokkalingam, U.; De Jong, W. Secondary Forest: A working definition and typology. Int. For. Rev. 2001, 3, 19–26. [Google Scholar]
- Guimarães, J.R.S.; Veiga, C.M.J.; Costa-Neto, S.V.; Tostes, L.C.L. Floristic Diversity of Secondary Forest in the Eastern Amazon, State of Amapá. Floresta 2016, 46, 343–351. [Google Scholar] [CrossRef]
- Aide, T.M.; Clark, M.L.; Grau, H.R.; López-Carr, D.; Levy, M.A.; Redo, D.; Bonilla-Moheno, M.; Riner, G.; Andrade-Núñuez, M.J.; Muñiz, M. Deforestation and Reforestation of Latin America and the Caribbean. Biotropica 2013, 45, 262–271. [Google Scholar] [CrossRef]
- Dai, X.; Chen, C.; Li, Z.; Wang, X. Taxonomic, phylogenetic, and functional diversity of ferns at three differently disturbed sites in Longnan County, China. Diversity 2020, 12, 135. [Google Scholar] [CrossRef]
- Yessoufou, K.; Letshwiti, K.D. Is high species richness at intermediate disturbance level valuable for phylogenetic conservation? A test on bird species in South-East Botswana. Afr. J. Ecol. 2018, 56, 555–562. [Google Scholar] [CrossRef]
- Pavoine, S.; Bonsall, M.B. Measuring biodiversity to explain community assembly: A unified approach. Biol. Rev. 2011, 86, 792–812. [Google Scholar] [CrossRef]
- Šigutová, H.; Šipoš, J.; Dolný, A. A novel approach involving the use of Odonata as indicators of tropical forest degrada-tion: When family matters. Ecol. Indic. 2019, 104, 229–236. [Google Scholar] [CrossRef]
- Carvalho, F.G.; Pinto, N.S.; Oliveira-Junior, J.M.B.; Juen, L. Effects of marginal vegetation removal on Odonata communities Efeitos da retirada da vegetação marginal sobre a comunidade de Odonata. Acta Limnol. Bras. 2013, 25, 10–18. [Google Scholar] [CrossRef]
- Rodrigues, M.E.; Moura, E.B.; Koroiva, R.; Borges, A.C.P.; Roque, F.D.O. Survey of Dragonflies (Odonata) in Palm Swamps of Cerrado Hotspot. Entomol. News 2018, 128, 24–38. [Google Scholar] [CrossRef]
- Hannon, E.R.; Hafernik, J.E. Reintroduction of the rare damselfly Ischnura gemina (Odonata: Coenagrionidae) into an urban California park. J. Insect Conserv. 2007, 11, 141–149. [Google Scholar] [CrossRef]
- Dalzochio, M.S.; Périco, E.; Renner, S.; Sahlén, G. Description of the final stadium larva of Erythrodiplax media (Odonata: Libellulidae) with preliminary key to known South American larvae in the genus. Int. J. Odonatol. 2018, 21, 93–104. [Google Scholar] [CrossRef]
- Rocha-Ortega, M.; Rodríguez, P.; Córdoba-Aguilar, A. Can dragonfly and damselfly communities be used as bioindicators of land use intensification? Ecol. Indic. 2019, 107, 105553. [Google Scholar] [CrossRef]
- Matos, F.A.; Magnago, L.F.S.; Gastauer, M.; Carreiras, J.; Meira-Neto, J.A.A.; Edwards, D.P. Effects of landscape configuration and composition on phylogenetic diversity of trees in a highly fragmented tropical forest. J. Ecol. 2016, 105, 265–276. [Google Scholar] [CrossRef]
- Mendes, T.P.; Oliveira-Junior, J.M.B.; Cabette, H.S.R.; Batista, J.D.; Juen, L. Congruence and the Biomonitoring of Aquatic Ecosystems: Are Odonate Larvae or Adults the Most Effective for the Evaluation of Impacts. Neotrop. Entomol. 2017, 46, 631–641. [Google Scholar] [CrossRef] [PubMed]
- Godoy, B.S.; Faria, A.P.J.; Juen, L.; Sara, L.; Oliveira, L.G. Taxonomic sufficiency and effects of environmental and spatial drivers on aquatic insect community. Ecol. Indic. 2019, 107, 1–10. [Google Scholar] [CrossRef]
- Brito, J.G.; Martins, R.T.; Oliveira, V.C.; Hamada, N.; Nessimian, J.L.; Hughes, R.M.; Ferraz, S.F.B.; Paula, F.R. Biological indicators of diversity in tropical streams: Congruence in the similarity of invertebrate assemblages. Ecol. Indic. 2018, 85, 85–92. [Google Scholar] [CrossRef]
- Valente-Neto, F.; Roque, F.O.; Rodrigues, M.E.; Juen, L.; Swan, C.M. Toward a practical use of Neotropical odonates as bioindicators: Testing congruence across taxonomic resolution and life stages. Ecol. Indic. 2016, 61, 952–959. [Google Scholar] [CrossRef]
- Fulan, J.Â.; Dosanjos, M.R.; Machado, N.G. Effect of temperature on the life cycle of Acanthagrion Selys, 1876 (Insecta: Coenagrionidae) under artificial conditions. Biota Neotrop. 2015, 15, 1–3. [Google Scholar] [CrossRef][Green Version]
- De Marco, P.; Latini, A.O.; Resende, D.C. Ecology, Behavior and Bionomics Thermoregulatory Constraints on Behavior: Patterns in a Neotropical Dragonfly Assemblage. Neotrop. Entomol. 2005, 34, 155–162. [Google Scholar] [CrossRef]
- Fulan, J.Â.; Henry, R.; Davanso, R.C.S. Effects of daily changes in environmental factors on the abundance and richness of Odonata. Acta Limnol. Bras. 2011, 23, 23–29. [Google Scholar] [CrossRef]
- Bried, J.T.; Herman, B.D.; Ervin, G.N. Umbrella potential of plants and dragonflies for wetland conservation: A quantitative case study using the umbrella index. J. Appl. Ecol. 2007, 44, 833–842. [Google Scholar] [CrossRef]
- Cardoso, P.; Barton, P.S.; Birkhofer, K.; Chichorro, F.; Deacon, C.; Fartmann, T.; Fukushima, C.S.; Gaigher, R.; Habel, J.C.; Hallmann, C.A.; et al. Scientists’ warning to humanity on insect extinctions. Biol. Conserv. 2020, 242, 108426. [Google Scholar] [CrossRef]
- Samways, M.J.; Barton, P.S.; Birkhofer, K.; Chichorro, F.; Deacon, C.; Fartmann, T.; Fukushima, C.S.; Gaigher, R.; Habel, J.C.; Hallmann, C.A.; et al. Solutions for humanity on how to conserve insects. Biol. Conserv. 2020, 242, 108427. [Google Scholar] [CrossRef]


Publisher’s Note: MDPI stays neutral with regard to jurisdictional claims in published maps and institutional affiliations. |
© 2021 by the authors. Licensee MDPI, Basel, Switzerland. This article is an open access article distributed under the terms and conditions of the Creative Commons Attribution (CC BY) license (https://creativecommons.org/licenses/by/4.0/).