Article

Conservation Agriculture Could Improve the Soil Dry Layer Caused by the Farmland Abandonment to Forest and Grassland in the Chinese Loess Plateau Based on EPIC Model

1
College of Natural Resources and Environment, Northwest A&F University, Yangling 712100, China
2
Key Laboratory of Plant Nutrition and the Agri-Environment in Northwest China, Ministry of Agriculture, Yangling 712100, China
*
Author to whom correspondence should be addressed.
Forests 2021, 12(9), 1228; https://doi.org/10.3390/f12091228
Submission received: 23 July 2021 / Revised: 3 September 2021 / Accepted: 7 September 2021 / Published: 9 September 2021
(This article belongs to the Section Forest Ecology and Management)

Abstract

:
Converting farmland to forest and grassland alleviated water loss and soil erosion. However, water-intensive grasslands and woodlands could form dry soil layers in the arid or semi-arid zones. Therefore, it is necessary to explore a management method to solve this pedological problem. In this study, based on the Environment Policy Integrated Climate (EPIC) model, the crop productivity and soil dry layer was predicted from 2018 to 2038 in alfalfa and apple land. Then, conservation agriculture and conventional tillage systems were used to repair the soil dry layer in apple and alfalfa systems from 2039–2050 in order to explore their potential. Model verification showed that EPIC simulations of yield, ET, and SWC were generally reliable. The predicted results showed that soil drought was more intense in alfalfa systems. Alfalfa’s annual decrease rate and total amount in the soil available water (SAW) were 27.31 mm year−1 and 652.76 mm, higher than 13.62 mm year−1 and 476 mm of the apple system, and the DSLT of apple’s system was thicker, but DSL-SWC was higher than alfalfa. In the recovery process, the restoration degree of soil desiccation in conservation agriculture was significantly higher than in conventional tillage systems (p < 0.05). In addition, the recovery effect increased with the increase of planting times of shallow root crops, such as potato and soybean. The recovery rate was 27.1 ± 1.72 mm year−1, DSLT was 750 ± 51.2 cm in conventional tillage systems, and the recovery rate was 44.7 ± 1.99 mm year−1, DSLT was 258.3 ± 74.9 cm in conservation agriculture systems. This study provides an effective farmland management method to alleviate soil desiccation and further reveals the new role of the Epic Model in future drought assessment.

1. Introduction

Changes in land use and land cover impact regional and global climate change, food security, and ecosystem dynamics [1,2]. To control soil erosion and desertification [3], the Chinese Government launched a large-scale vegetation restoration project at the beginning of the 21st century in the Loess Plateau in northwest China, which converts farmland to forest and grasslands [4,5]. However, planting high-water-consuming non-native forests and grasslands in arid areas has resulted in the formation of soil dry layers, which is difficult to recover. This alters ecological and hydrological cycles, and this adversely affects the succession of regional vegetation [6,7,8,9,10]. Soil dry layers caused by drought climate and incorrect vegetation cultivation was frequently reported in arid regions worldwide [11], which included the southwestern United states [12], the Loess Plateau of China [11,13], southern Australia [14], and Amazonia [15].
Soil desiccation is a hydrological phenomenon unique to semi-arid and sub-humid regions [11]. This phenomenon is caused by the excessive depletion of deep soil moisture content (SMC) by artificial vegetation and long-term shortages of rainwater supply, which is difficult to remediate by changes to land use [16,17,18]. Large-scale vegetation restoration has increased the water loss on the Loess Plateau leading to deep soil drying. Moreover, when unsuitable vegetation species are selected for vegetation restoration, it possibly causes vegetation degradation [19]. For example, artificial grassland cultivating alfalfa to support agriculture and animal husbandry on the Loess Plateau could cause severe soil desiccation [20]. Soil degradation is difficult to recover in the short term [21,22]. Li [23] found that the mean gravimetric water content of the 5–10 m soil profile in Changwu County, China, decreased from 21.9% in 1985 to 13.6% in 1997 when alfalfa was cultivated. Liang et al. [24] found that cultivating erect milkvetch (Astragalus adsurgens Pall.) in a grassland in Wuqi County, China, resulted in soil desiccation that reached 3, 5, and 8 m soil depth after growing for 3, 5, and 6 years, respectively. Peng et al. [25] found that SMC of 0–15 m soil layer under apple orchards in Luochuan, China, decreased by 1282–1315 mm between 1970 and 2000.
Deep soil dry layers in artificial grasslands often take 5–7 years or more to form [20,26], and economic forests take more than 10 years [27,28]. Therefore, it is difficult to reveal the drying process and mechanism through short-term determination of SMC and water use efficiency (WUE) [19]. In recent years, a combination of short-term experiments and modeling has become an important tool for studying desiccated soil [29]. Model simulations can reduce research costs and time and analyse what data will be relevant [30]. Currently, there are several widely used crop growth models, which include EPIC [31], DSSAT [32], WOFOST [33], and CropSyst [34], YIELD [35], CropWat [36], and CENTRURY [37]. Among them, EPIC performs well when simulating crop productivity and also has a complete hydrological cycle module. The EPIC model was used on the Loess Plateau at the end of the 20th century to simulate crops productivity [38,39]. Wang et al. [40] used long-term experimental data and survey data of alfalfa–grain crop rotation to verify the feasibility of the EPIC model for moisture in the semi-humid region of the Loess Plateau. They reported that including potato and soybean in crop rotations can help with the recovery of soil desiccation. Qiao et al. [41] used EPIC to simulate yield, soil erosion, and nitrogen leaching from major food crops in a transition zone of agriculture and animal husbandry in Northern China. However, thus far, the EPIC model has been mainly applied to annual field crops, and there has been no research on the productivity and WUE of perennial grasslands and orchards. It is difficult to capture the relationships between soil desiccation and WUE under different vegetation covers in a region that converted farmland to grasslands and forests. In addition, in the hydrological simulation process, previous studies only verified and evaluated SMC, and evapotranspiration (ET) is often ignored. ET directly relates to crop water consumption and WUE, and the evaluation of its accuracy is an important step. If its accuracy is too low, there will be uncertainty in the hydrological simulation.
The main objectives of the present study were to: (1) evaluate the reliability and sensitivity of the EPIC model on yield, ET, and SMC in artificial grasslands, economic forests, and conservation rotation system; (2) predict the drought degree and crop water productivity for alfalfa and apple systems in 2018–2038; (3) explore the feasibility of conservation agriculture systems to relieve dry soil layer in a semi-arid zone.

2. Materials and Methods

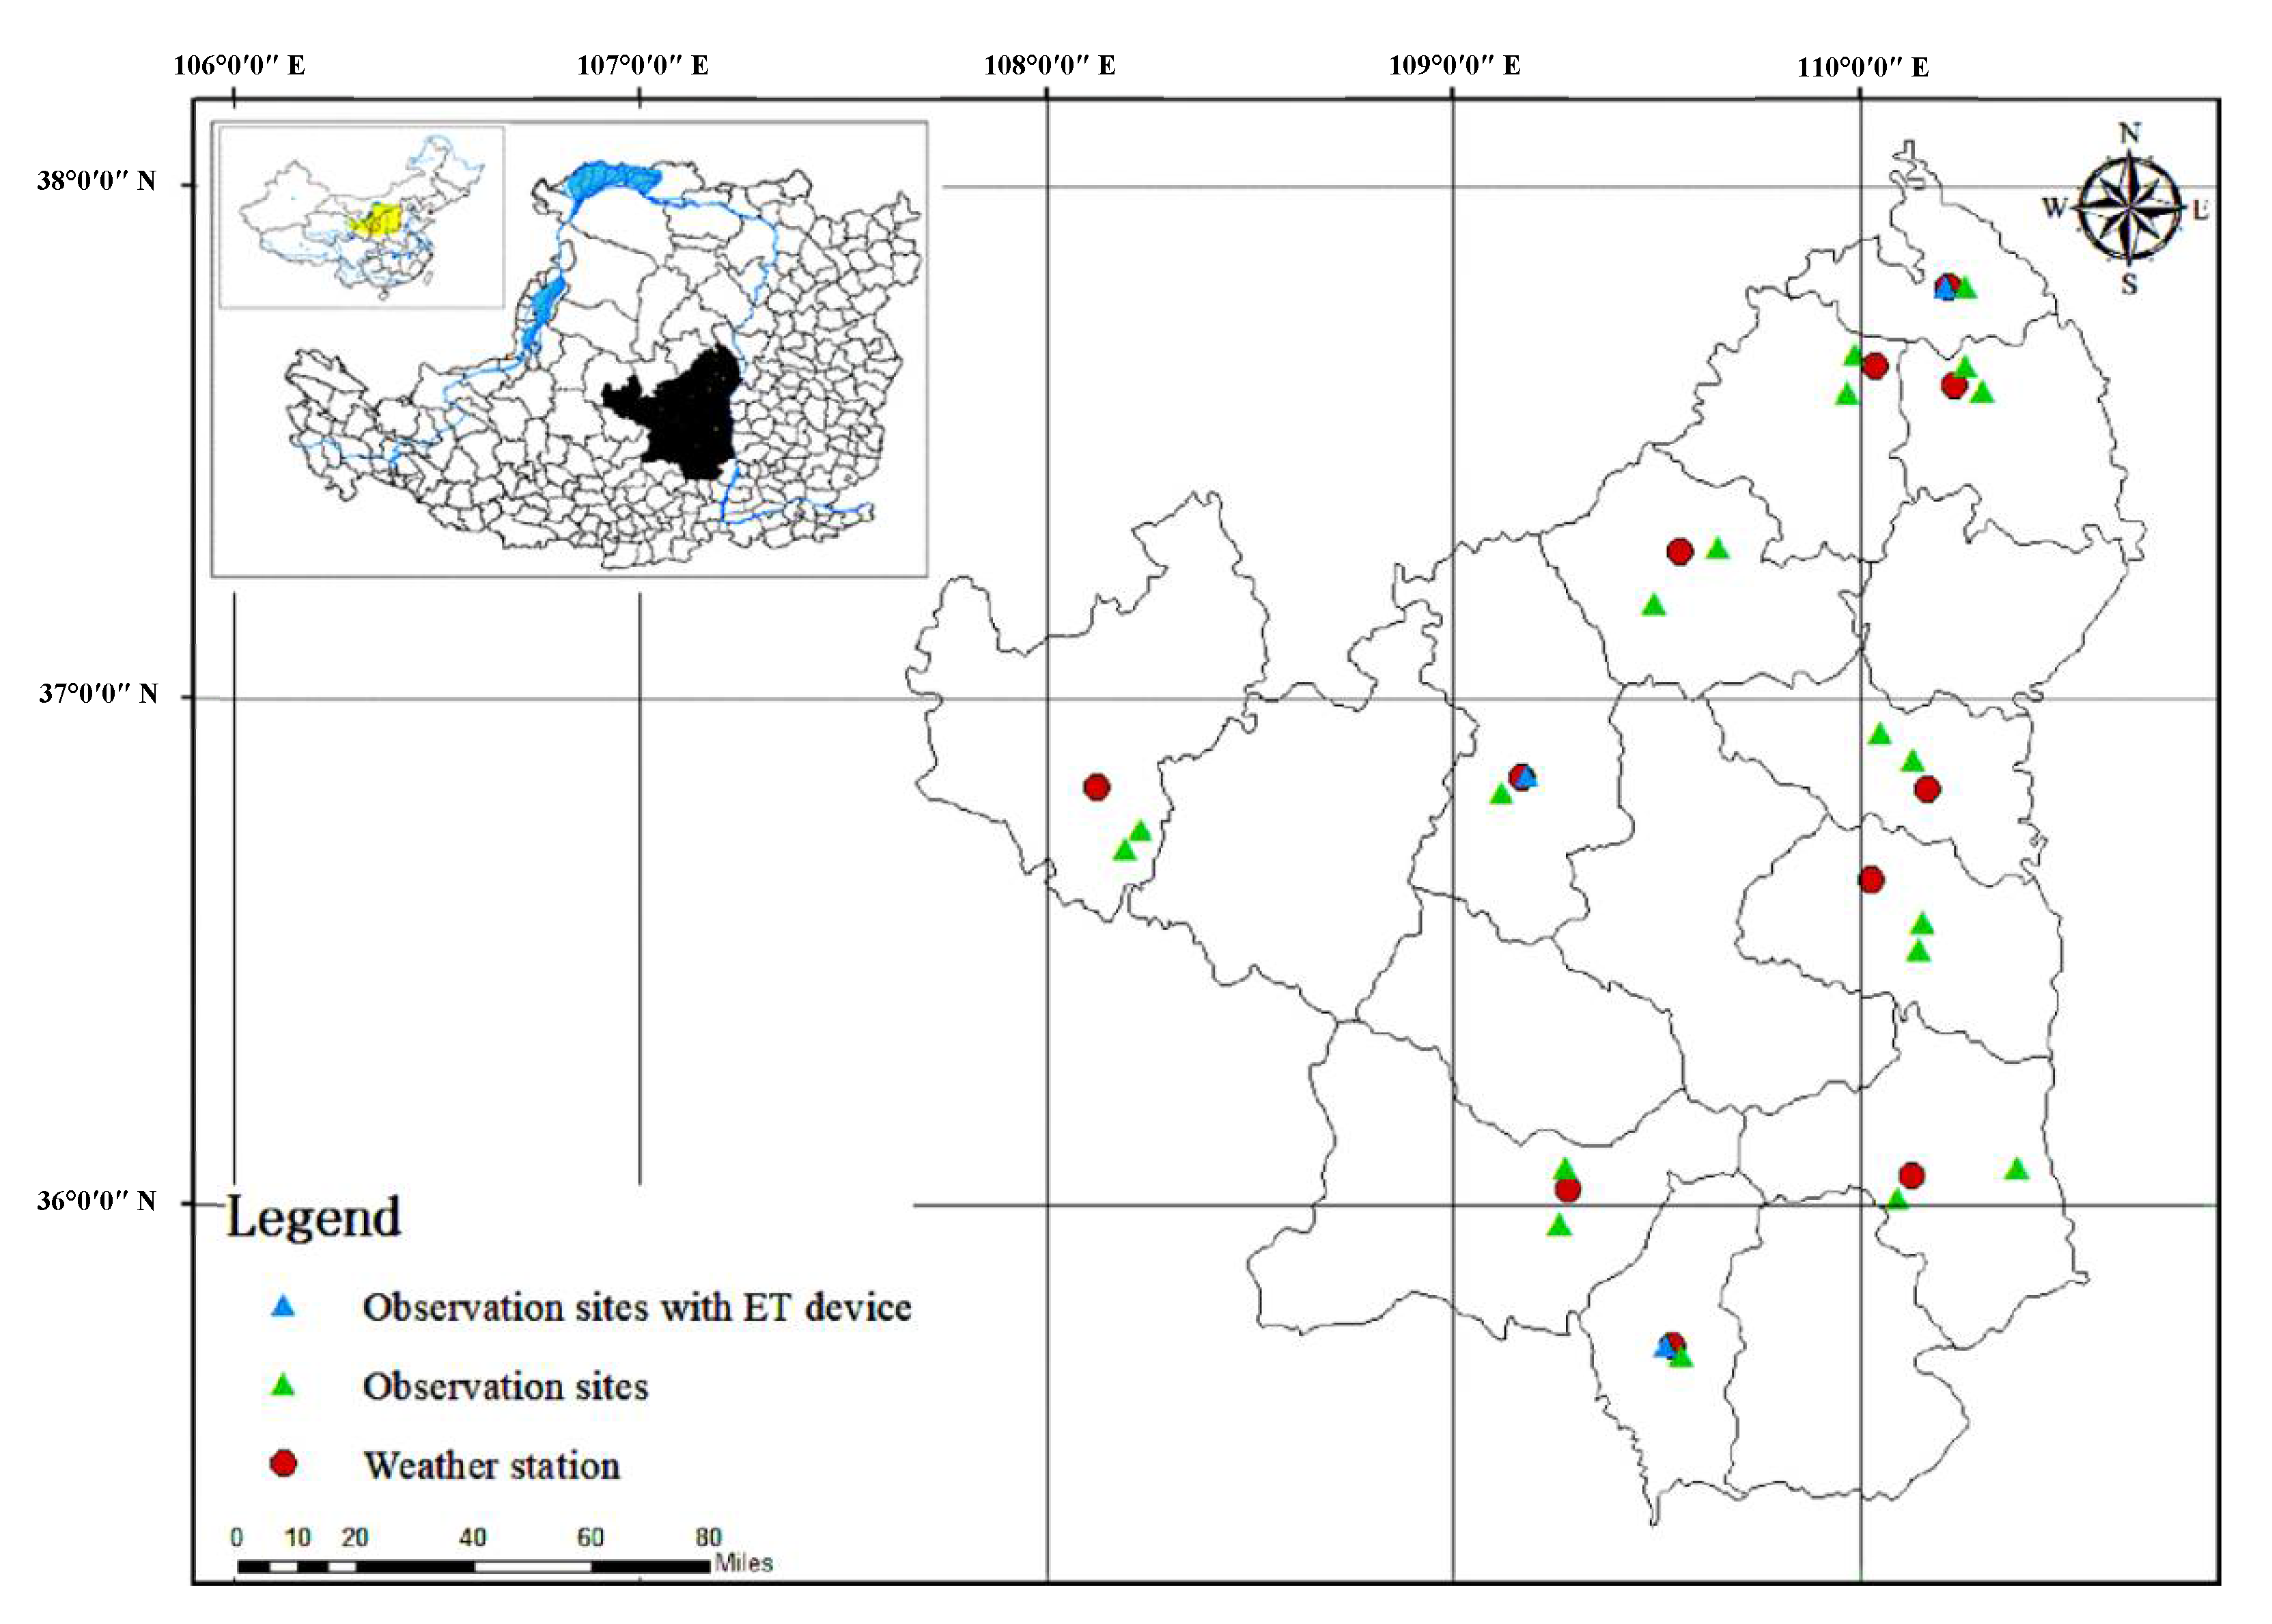
2.1. Site Description

The studies zone is located in the hinterland of the Loess Plateau of China (107°41′–110°47′ E, 35°20′–38°24′ N), with an altitude between 847 and 1255 m (Figure 1). From the south to the north, the temperature and rainfall gradually increase, and the elevation gradually decreases. The terrain is mostly hilly gullies and remnants of gullies, experiences drought, and has experienced severe soil erosion. The climate in this area is characterized as middle-temperate and semi-arid. The average annual temperature is 8–12 °C; rainfall is 438–660 mm. The climate is dry, and the evaporation rates are high. The annual average sunshine hours are 2761 h, the annual total radiation is 580.5 kJ cm−2, the annual average temperature is 8.4 °C, and the frost-free period is 160–170 d. The soil type is Loessi-Orthic Primosols, deep soils, which are loose. The groundwater is deep, mostly below 50 m, and generally is not linked to surface water circulation on the land.

2.2. Data Collection and Monitoring

Meteorological data from 2013 to 2017 came from the China Meteorological Data Network (http://data.cma.cn, accessed on 30 March 2020) and National and Provincial Scientific Research Base of Northwest A&F University (https://kyy.nwsuaf.edu.cn/kyjd/gjjkyjd/index.htm, accessed on 20 April 2020). Future climate data for 2018–2050 were from MIROC5 model under experiment RCP 6.0 of project CMIP5 (https://esgf-node.llnl.gov/search/cmip5/, accessed on 10 August 2020). The soil dataset, such as soil texture, soil moisture at field capacity, and wilting point, was based on the China soil database (http://vdb3.soil.csdb.cn/, accessed on 13 November 2019) and soil attribute data, volume1–6, soil species of China (http://www.resdc.cn/data.aspx?DATAID=185, accessed on 15 March 2020).
Crop parameters were mainly referred to in related literature [38,40,42,43], and field measurement and adjustment with model calibration and sensitivity analysis (Table S1).
The planting and harvesting dates of all stations were adjusted according to the management data of monitoring stations. Meanwhile, the automatic fertilization module of EPIC was opened to prevent N and P stress affecting drought and water productivity assessment. The age of the apple (Malus domestica (Suckow) Borkh.) forest was 8–14 years, and the planting density was 4 m × 5 m. Alfalfa (Medicago sativa L.) grass was sown 5–7 years.
In order to obtain sufficient soil water consumption data, soil evapotranspiration (ET) was monitored in Ansai, Mizhi, and Luochuan. Tree transpiration (ET) was calculated by trunk sap flux (SF), and the SF was measured by thermal-dissipation probes FLGS-TDP (Dynamax, CA, USA). Detailed description and calculation, please refer to the reference [44]. RR-WT40 small-sized evapotranspiration apparatus (Rainroot, Beijing, China) was used to measure ET of farmland and alfalfa.

2.3. Crop Rotation Treatment

In this study, 4 crops, soybean (Glycine max (Linn.) Merr.), potato (Solanum tuberosum L.), wheat (Triticum aestivum L.), corn (Zea mays L.), tree crop rotations, and two system of conventional tillage and conservation agriculture were tested, as shown in Table 1. The experimental area is one crop—a year cropping system. In the conservation agriculture system, no-tillage management was adopted in the field, and crop residues were 100% returned to the field. In the conventional tillage system, traditional tillage was adopted, and crop straw was not returned to the field. Moreover, there was no irrigation in this study, and rainfall was the only source of water for the soil.

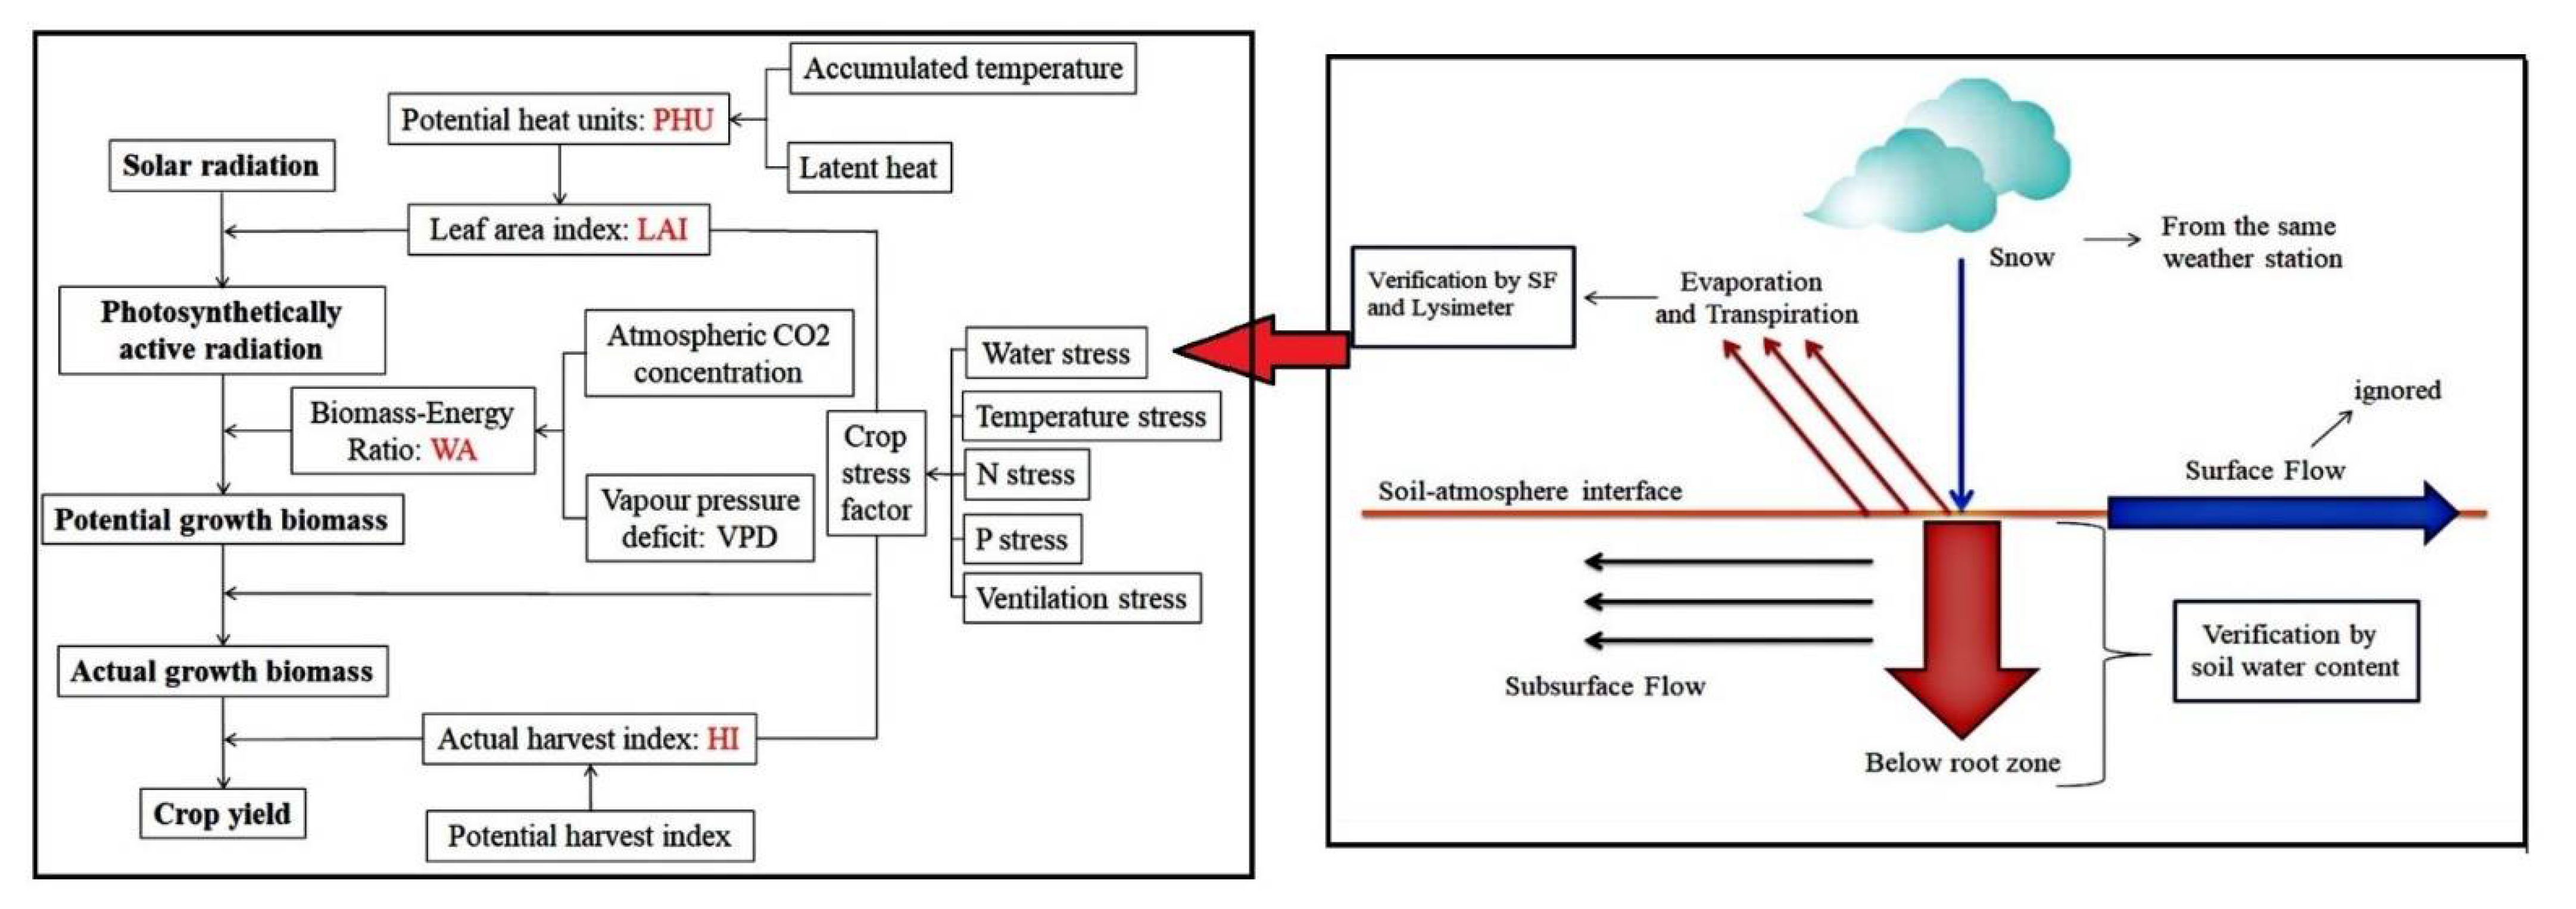
2.4. EPIC Model Description and Sensitivity Analysis

The Environmental Policy Integrated Climate model (EPIC) is a comprehensive model that solves ecological-environment problems. In this study, crop growth and hydrology module were mainly used (Figure 2). The specific calculation equation of the EPIC model was mentioned many times in previous studies, and the specific description can be referred to [41,42,45,46].
Sensitivity analysis of the EPIC model was mostly focused on field crops, while there were few studies on sensitivity analysis and parameter calibration of apple and alfalfa grassland [46,47,48]. In this study, one factor at a time analysis [45,49,50] was adopted and calculated the sensitivity of 13 parameters (Table 2) to yield and evapotranspiration of each crop.
S = | Y 1.1 X i Y X i | + | Y 0.9 X i Y X i | 0.2 Y X i  
where S is the sensitivity index of parameter Xi on output Y (Yield, ET, Soil moisture) in the EPIC model.

2.5. Model Calibration and Validation

The significance and correlation were analyzed using SPSS 21.0 (IBM, Armonk, NY, USA). Kolmogorov-Smirnov (K-S) was used to evaluate the data normality. When homogeneity and normality were satisfied, Turkey’s multiple analysis with p < 0.05 was adopted to test the significance (same number of samples between groups). Otherwise, Kruskal-Wallis test (p < 0.05) was performed for non-parametric testing.
The model was calibrated using 2013–2015 and validated with 2016–2017. Model validations were evaluated by the following criteria: coefficient of determination (R2), relative root-mean-square error (RRMSE, %), and percentage bias (PBIAS, %).
R 2 = [ ( S I M i S I M ¯ ) × ( O B S i O B S ¯ ) ] 2 ( S I M i S I M ¯ ) 2 ( O B S i O B S ¯ ¯ ) 2
P B I A S = [ i = 1 n ( O B S i S I M i ) × 100 i = 1 n O B S i ]
R R M S E = i = 1 n ( O B S i S I M i ) 2 n / I N i = 1 n O B S i
where OBSi is the observation value, SIMi is the simulation value, and n represents the number of samples.

3. Results

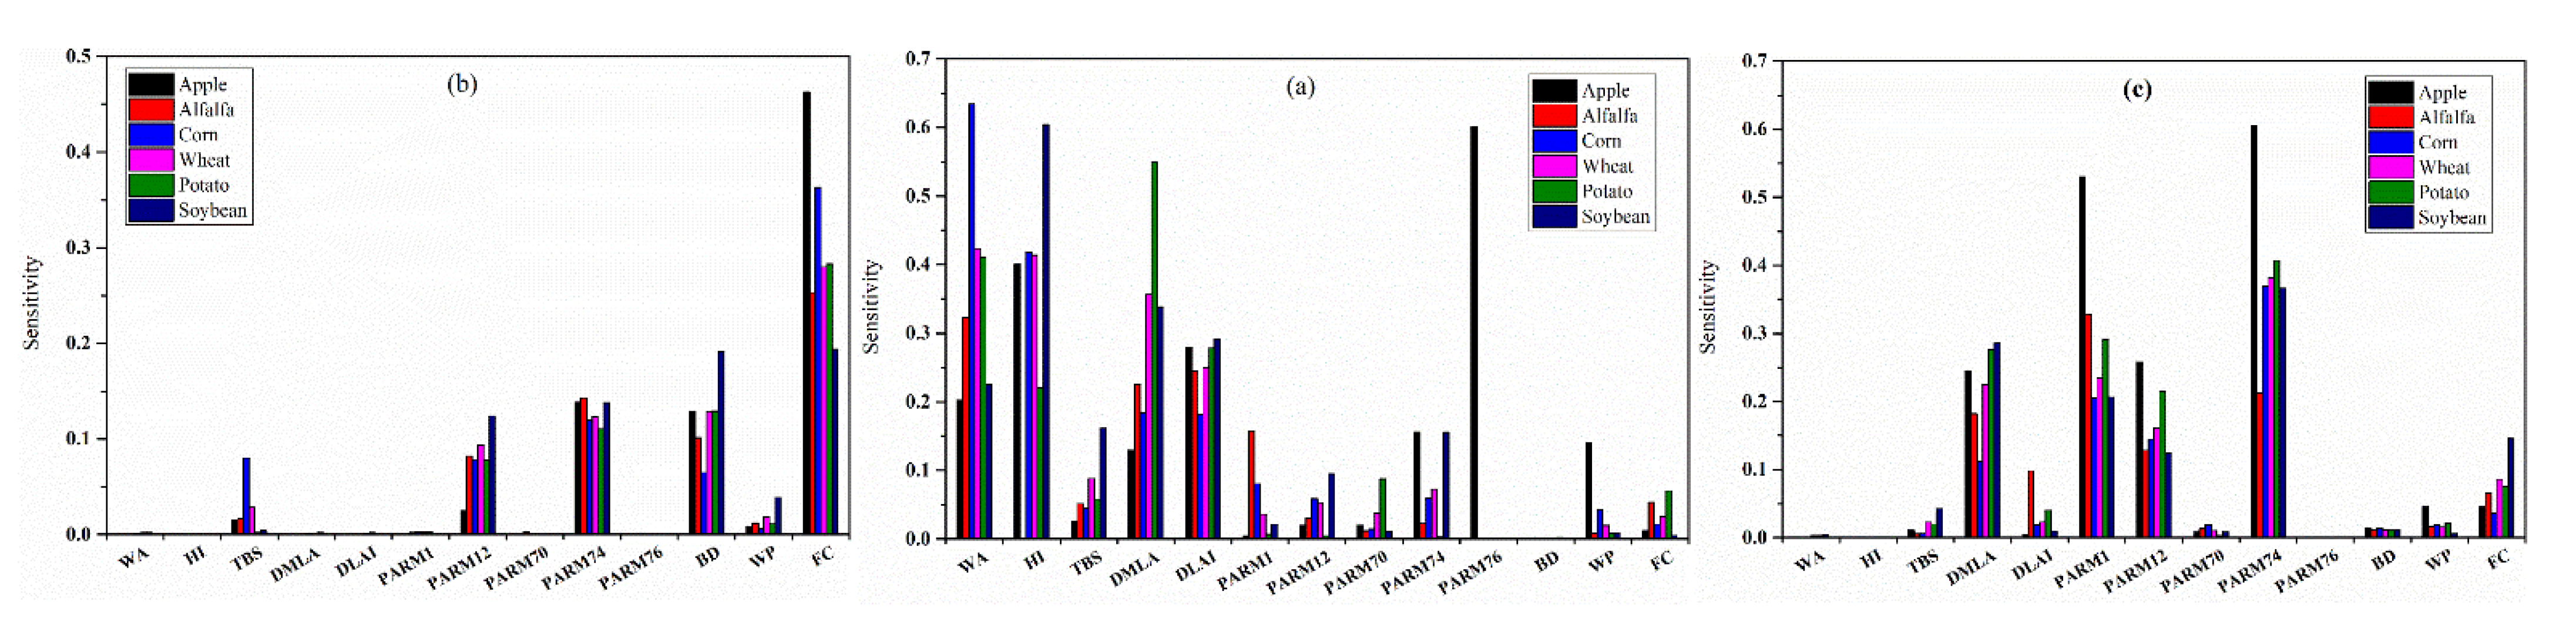
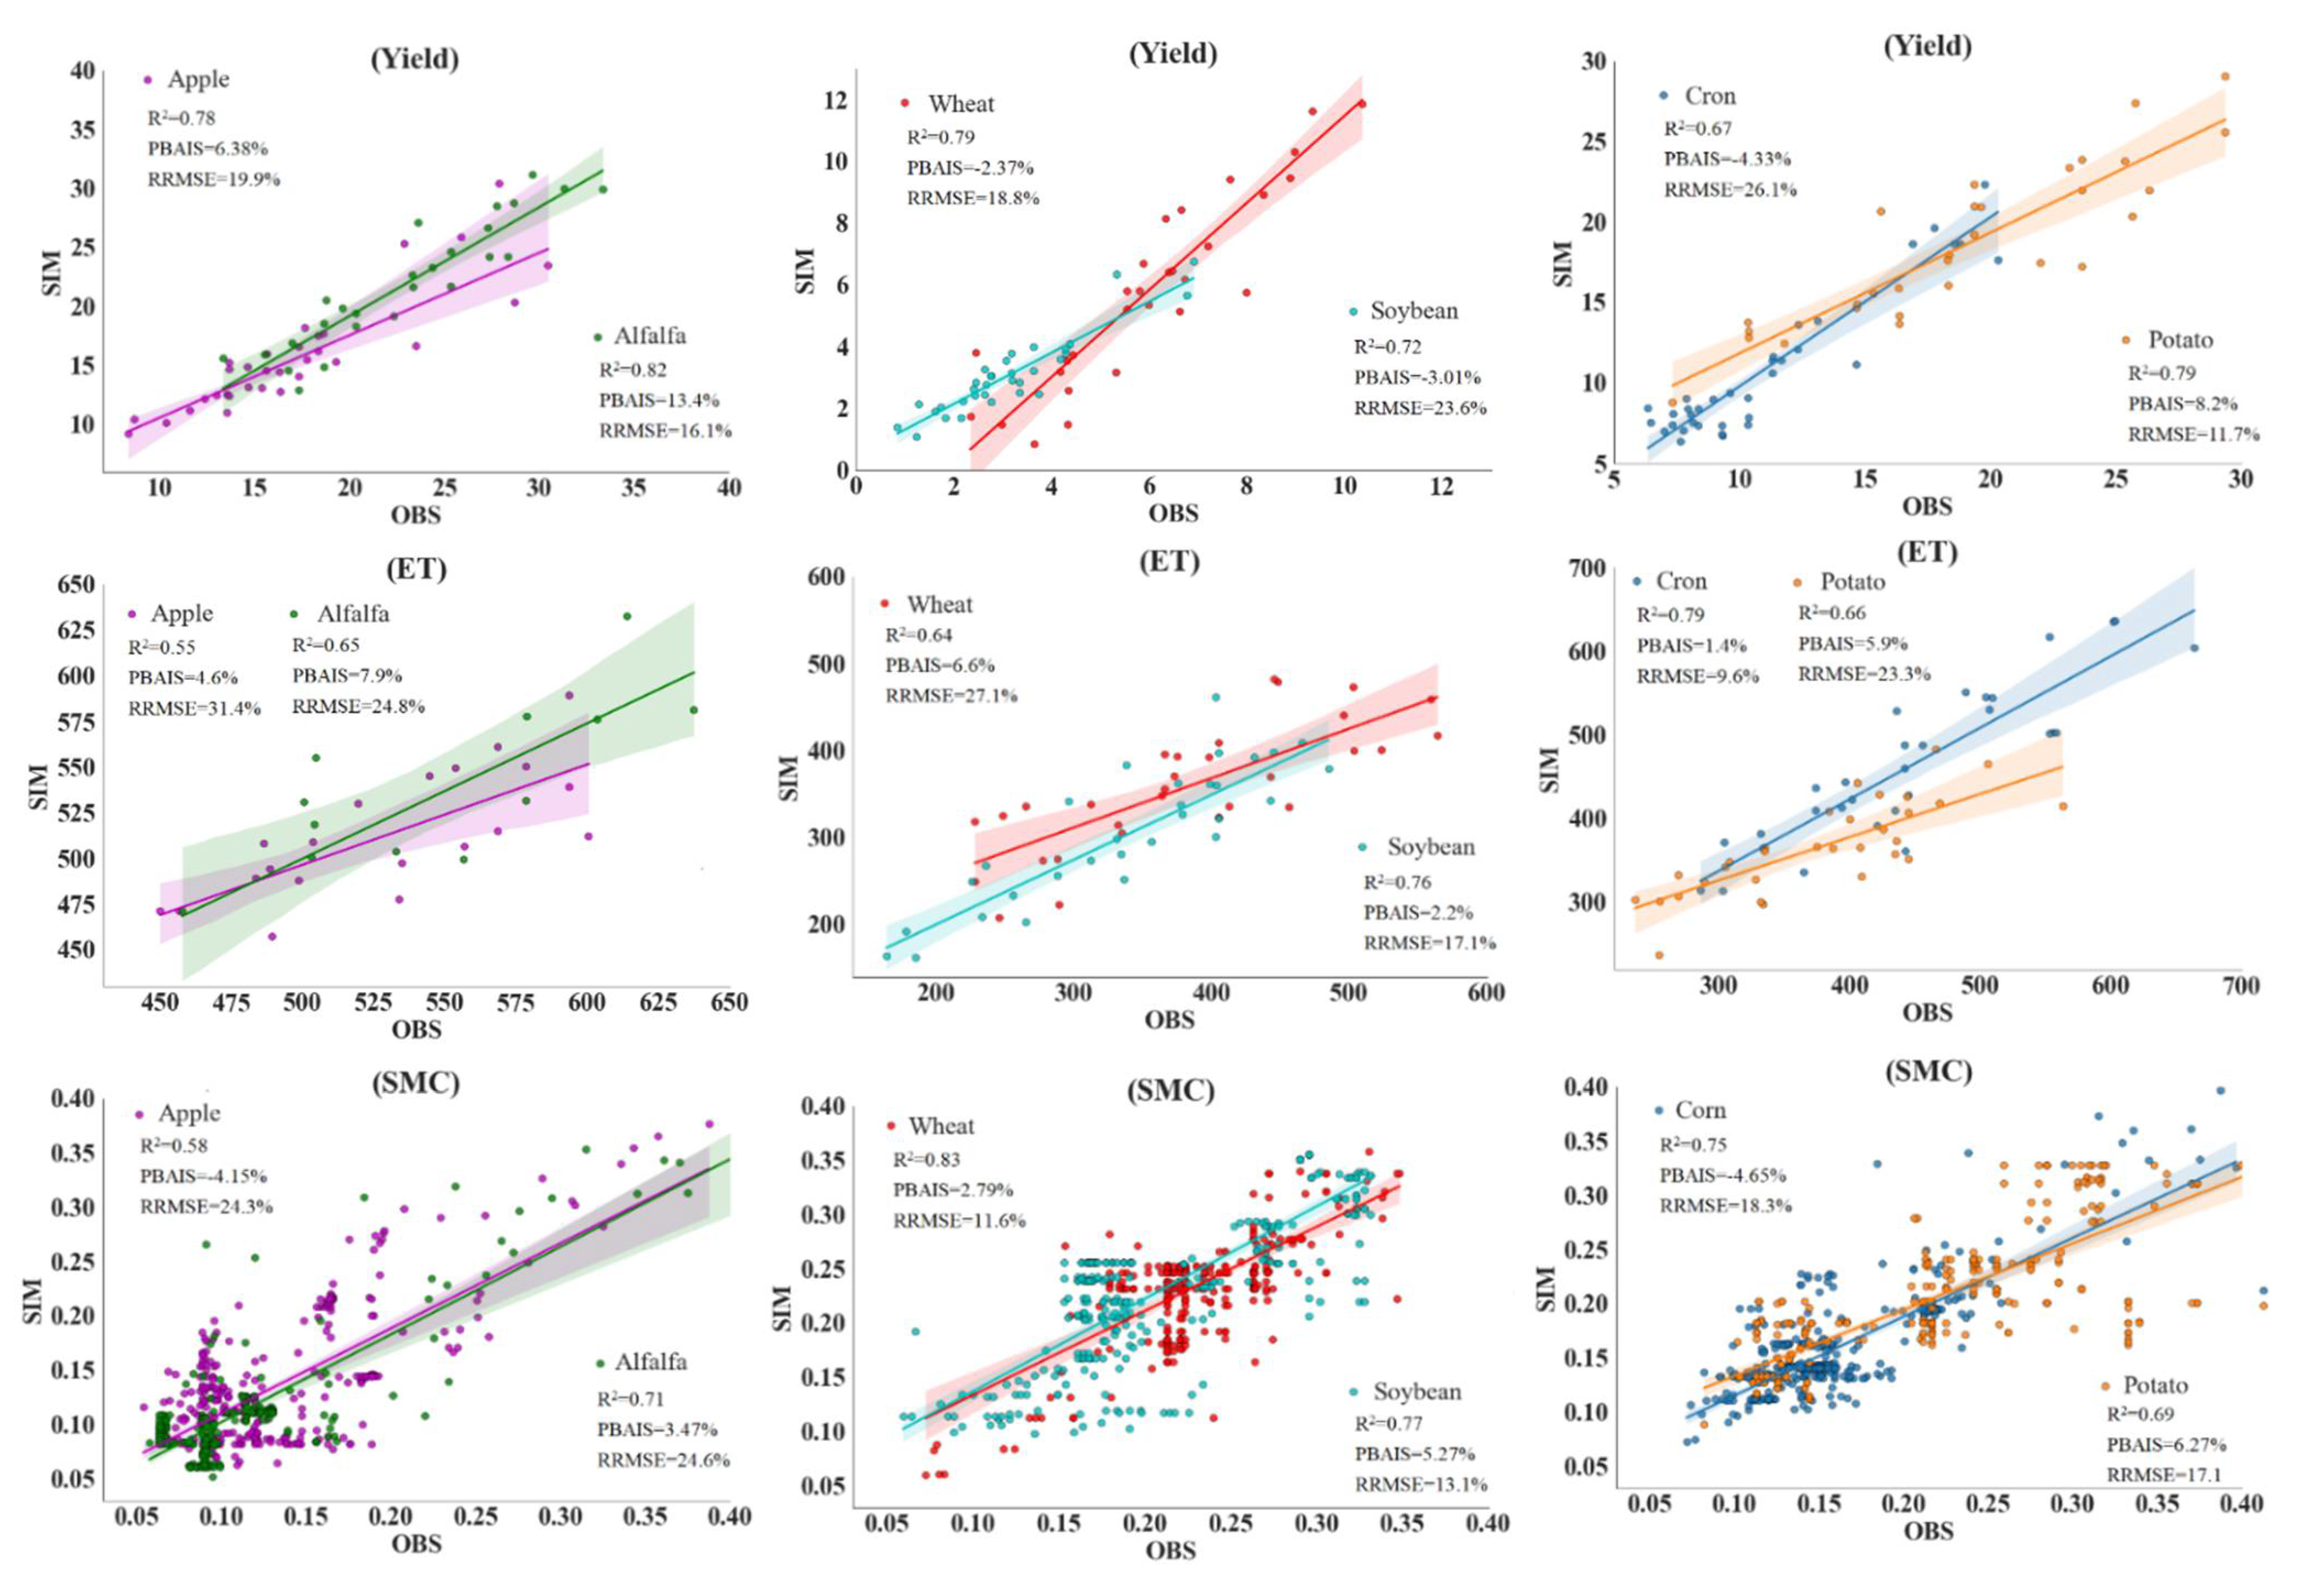
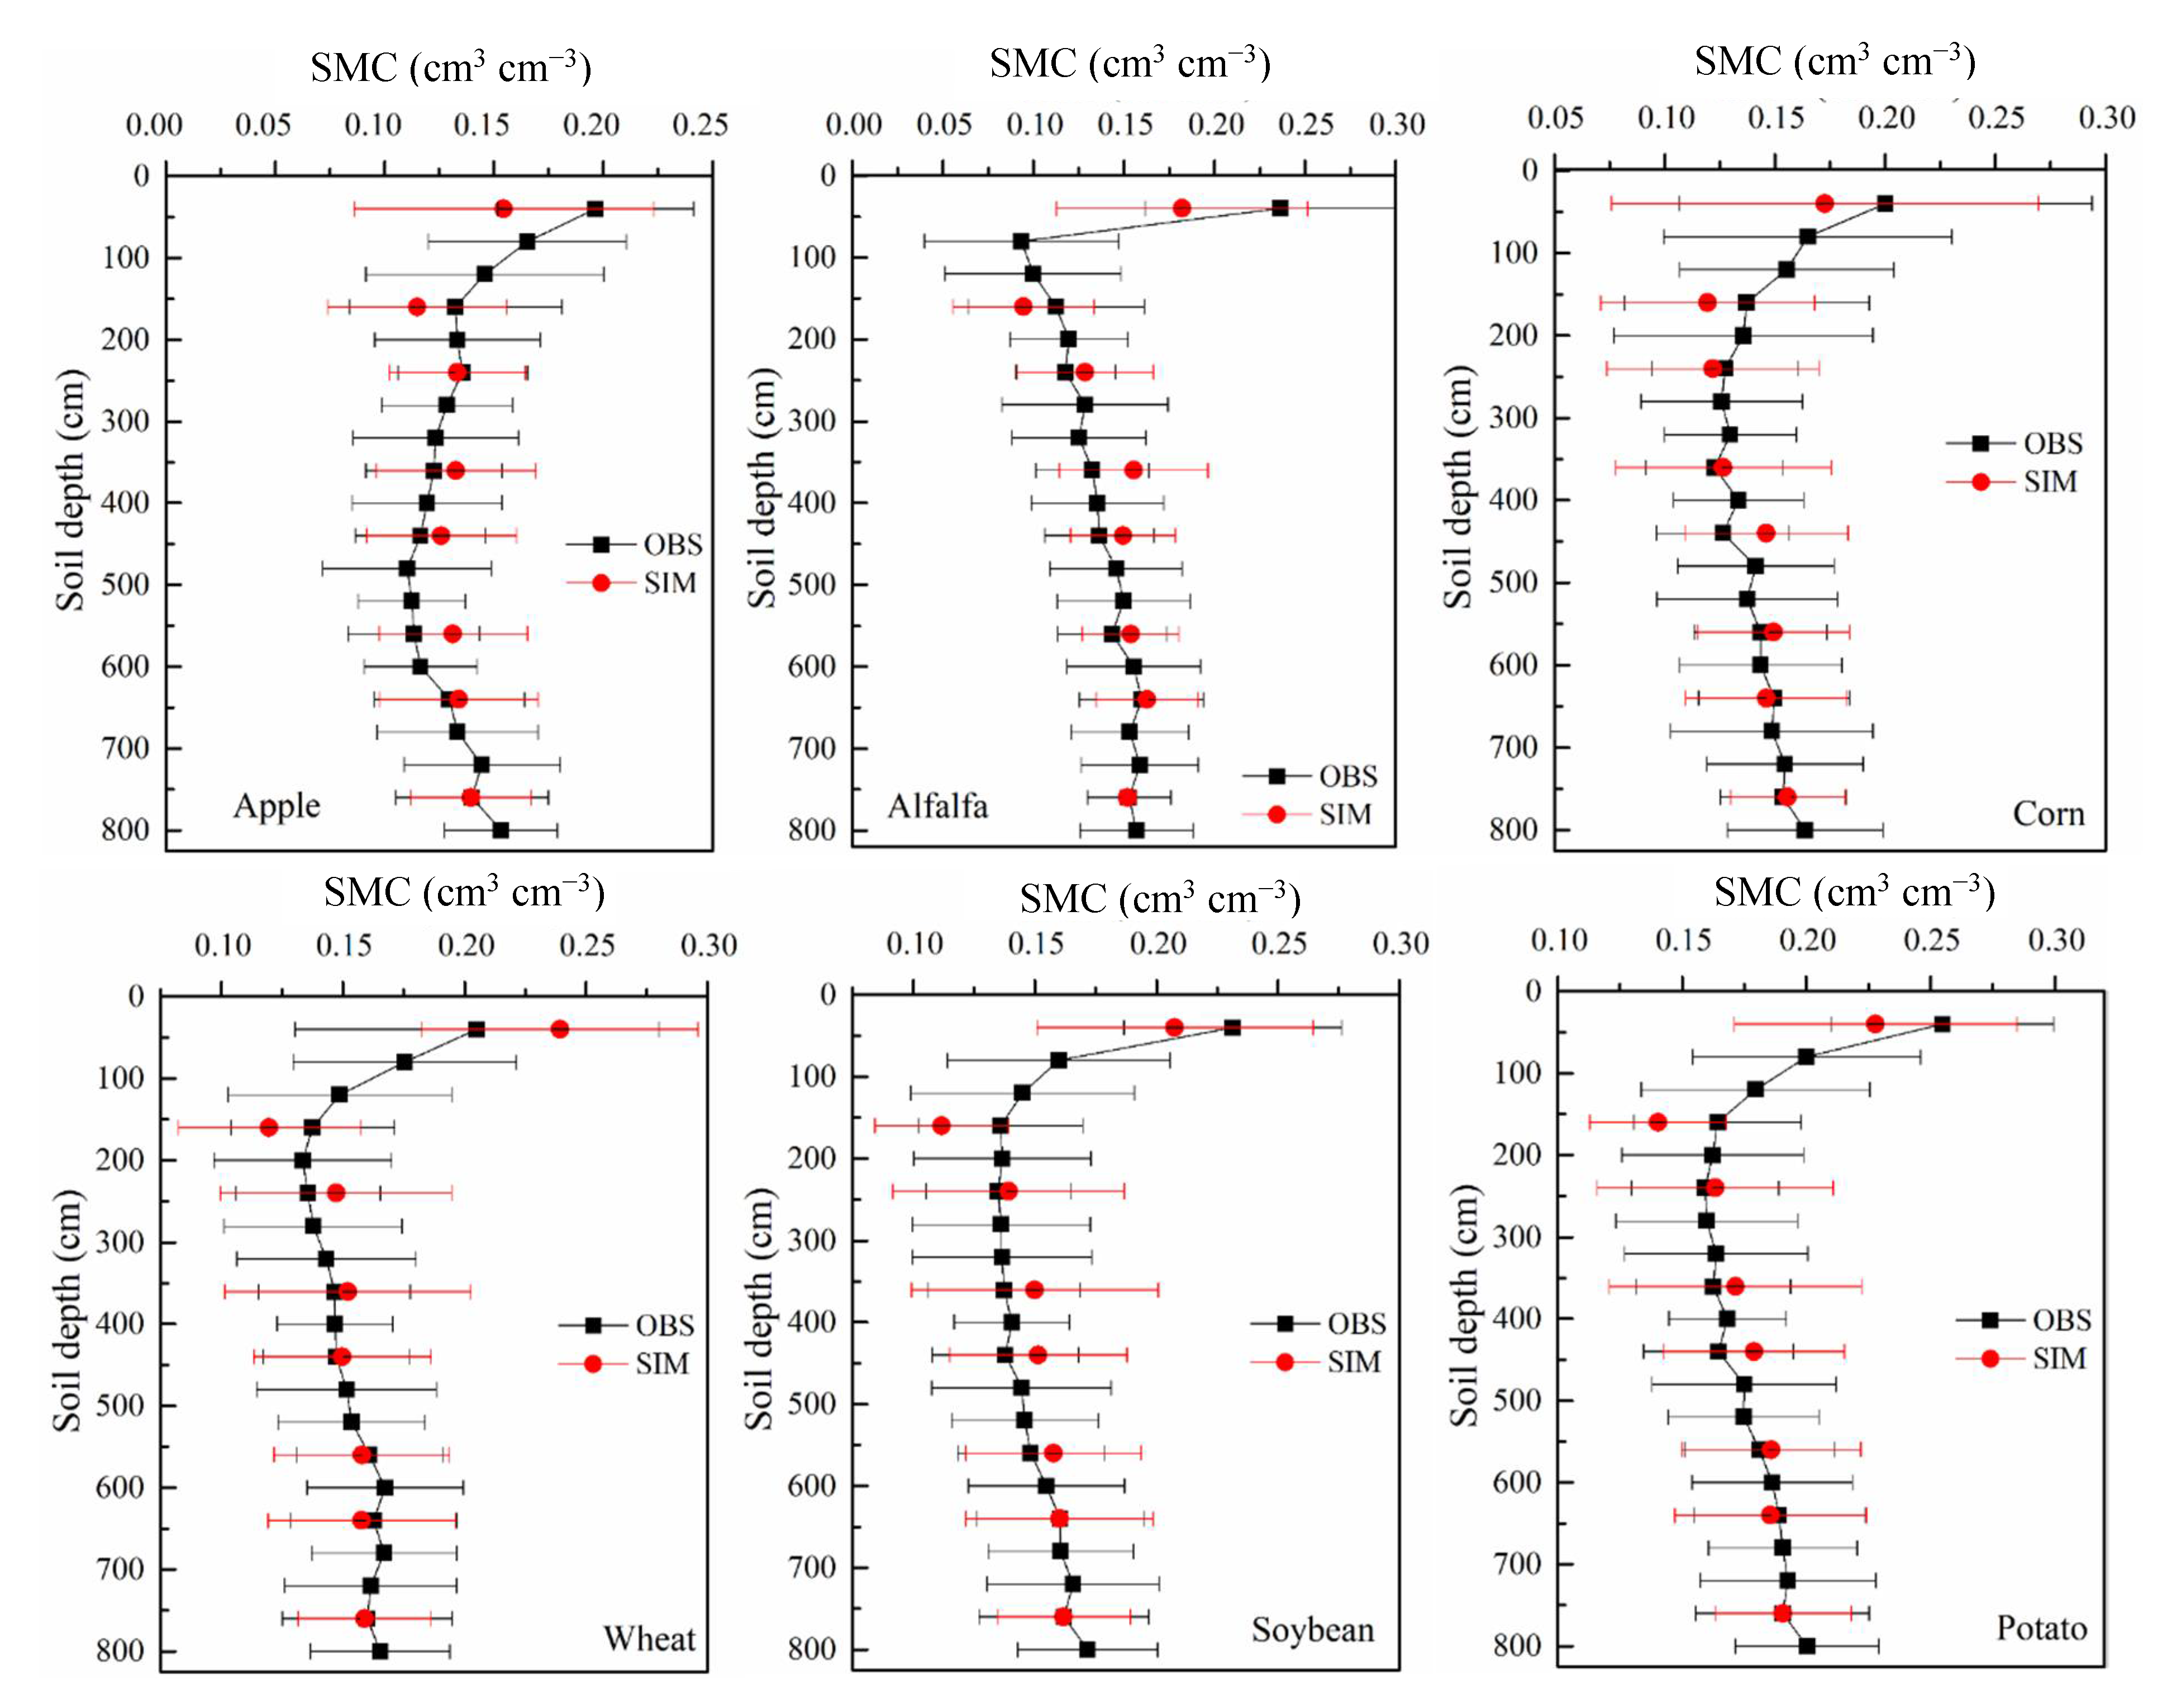
3.1. Sensitivity Analysis and Validation of the EPIC

The sensitivity analyses for each crop are shown in Figure 3; for apple, the parameter with the highest sensitivity of yield, ET and SMC were PARM (76), PARM74, and FC. In addition, HI and PARM1 were also highly sensitive. For alfalfa, the parameters with the greatest sensitivity were WA, PARM1, and FC for yield, ET, and SMC, respectively. Alfalfa HI sensitivity was relatively low. The main reason for this was that for alfalfa and other forages, the economic yield was biomass. The most sensitive parameters of yield for corn, wheat, potato, and soybean were WA, WA, DMLA, and HI, respectively. This result is similar to those observed in other research [45,48,49,50]. Moreover, the most sensitive parameters of ET and SMC for corn, wheat, soybean, and potato all were PARM74 and FC.
As could be seen from Figure 4, the accuracy of the EPIC simulation values showed a range whereby Yield > SMC > ET. The R2 of the simulated and observed yield values were between 0.67 and 0.82, RRMSE were all less than 23.6% and the absolute value of PBISA were all less than 13.4%. The simulation results for ET were also acceptable, with R2 ranging from 0.55 to 0.79. The PBISA and RRMSE were all less than 7.9% and 31.4%, respectively. The R2 of SMC was between 0.58–0.83, RRMSE were all less than 24.6%, and the absolute value of PBISA were all less than 6.3%. Evaluation results showed that corn and wheat had the highest R2 and RRMSE, while apple’s R2 and RRMSE were relatively low. The R2 of apple ET was 0.55, and RRMSE was 31.4%. To further evaluate the model performance on SMC in the vertical direction, the observed SMC and simulated SMC were compared in 0–800 cm soil layer (Figure 5). The results showed that with the increase of soil depth, the accuracy of SMC simulation increased gradually. This may be because many factors, such as tillage, irrigation, and topography, affect the measurement and calculation of surface soil moisture, which brings uncertainty to the simulation evaluation.

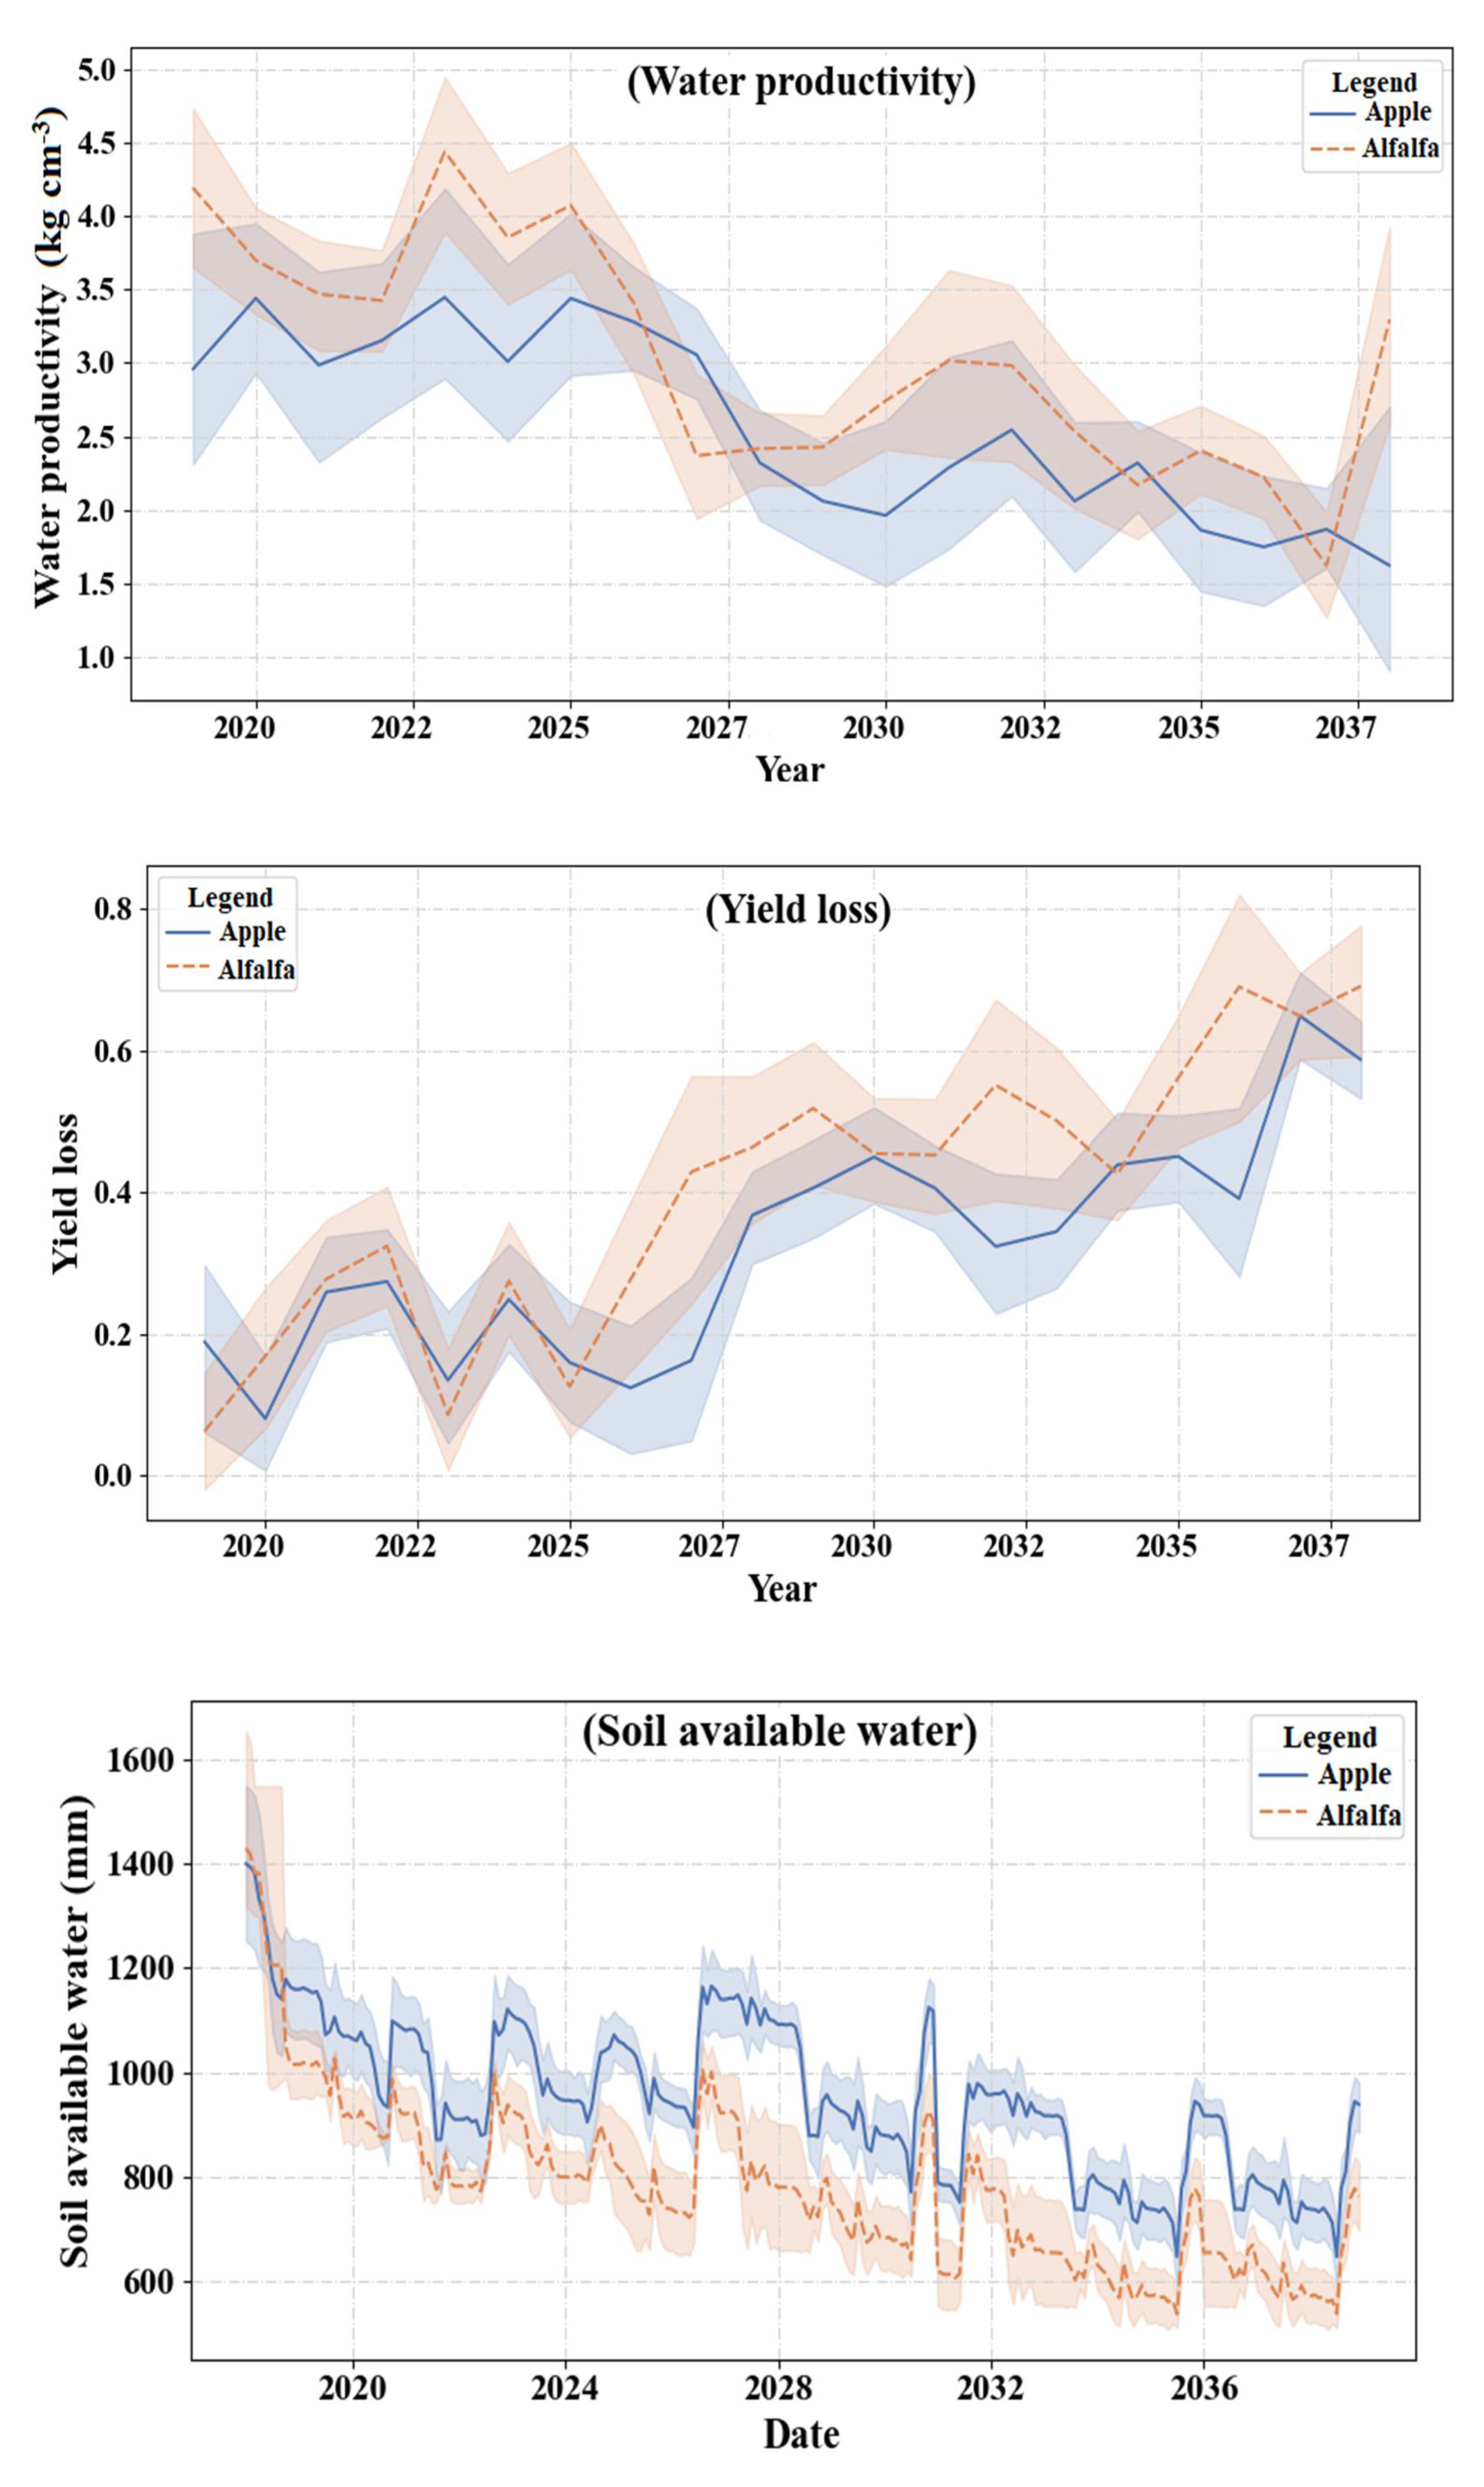
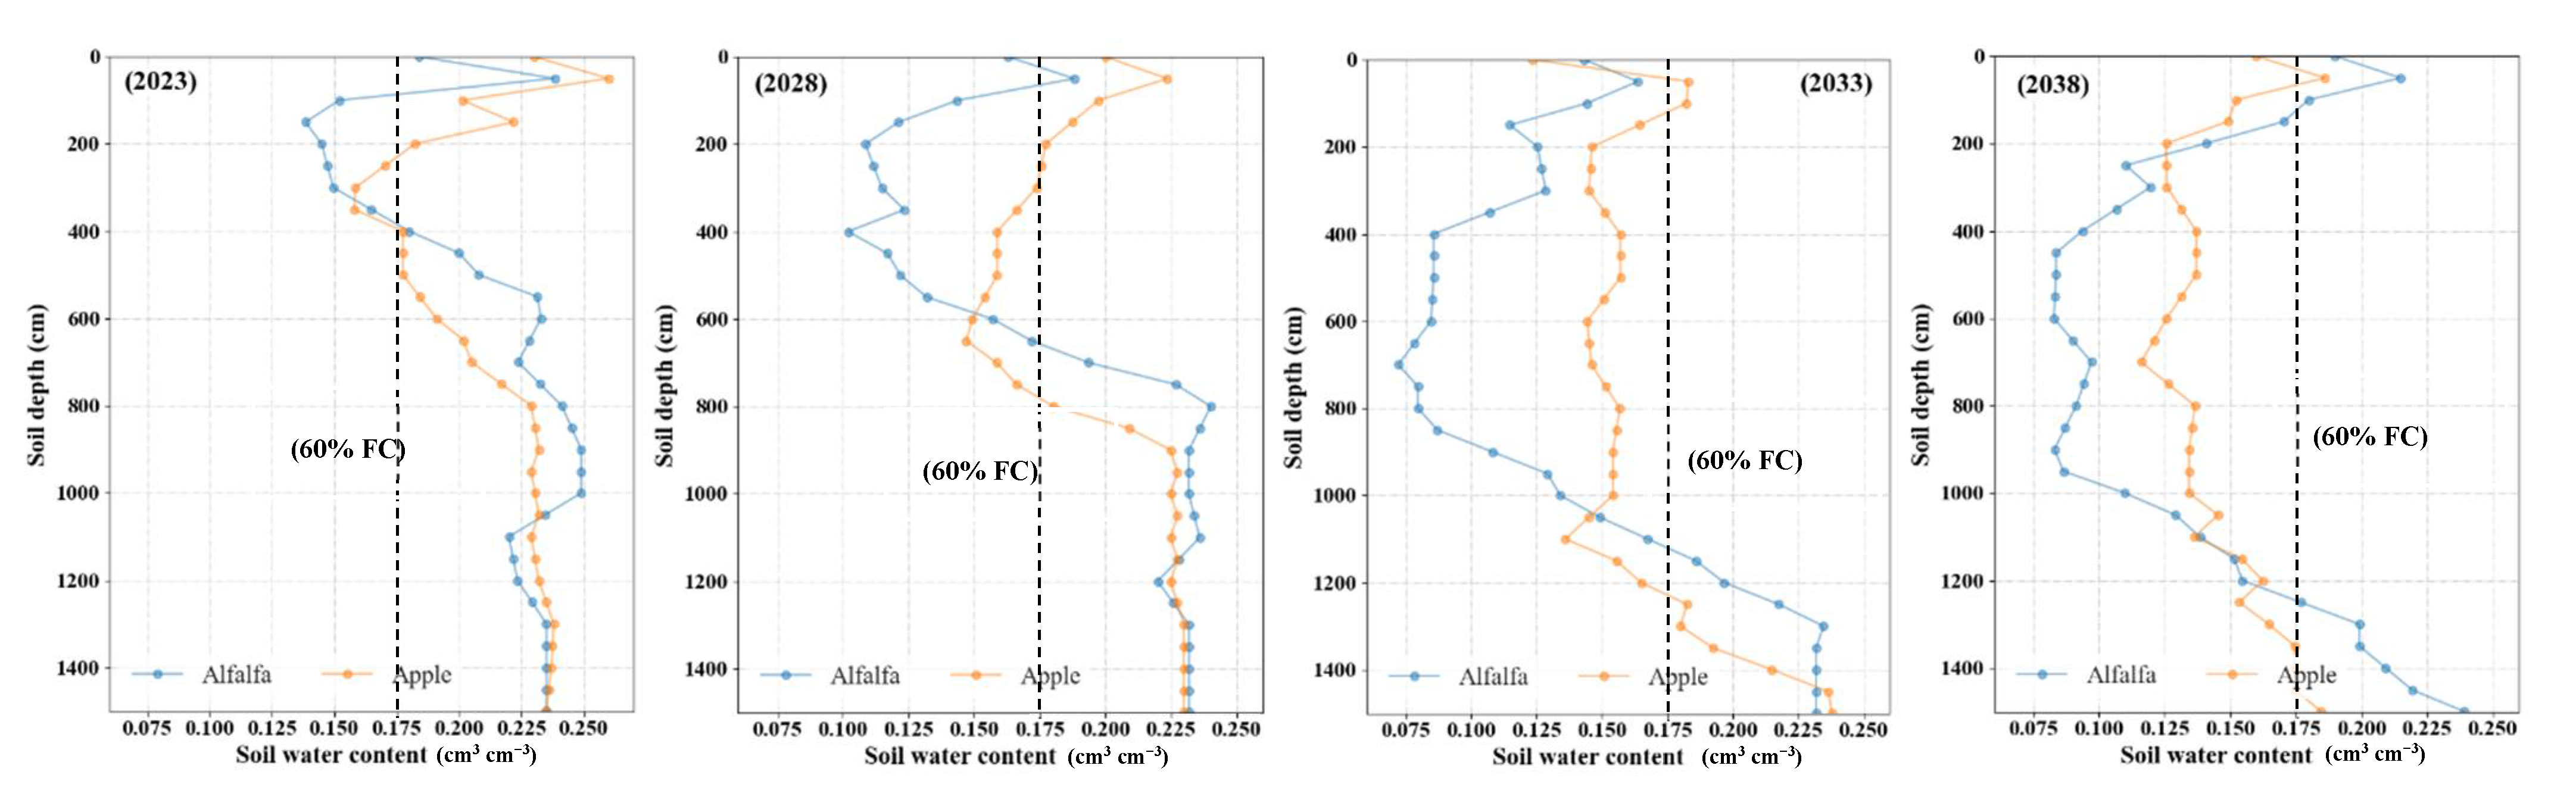
3.2. Drought Prediction in Apple Woodlands and Alfalfa Grasslands from 2018 to 2038

In this study, water productivity was the ratio of yield to evapotranspiration, and it is an important index to evaluate crop water use efficiency. Changes in water productivity, yield loss, and soil available water of apple alfalfa during 2019–2038 are shown in Figure 6 and Table 3. Water productivity of both crops showed a downward trend, and the mean water productivity of alfalfa was 5.43 kg cm−3, which was higher than that of apple 5.21 kg cm−3.
Yield loss is the ratio of yield loss with no irrigation compared to full irrigation, which reflected the degree of drought stress in crops. The yield loss of both apple and alfalfa showed an upward trend from 2019 to 2038. Alfalfa yield loss increased significantly after 2025 (p < 0.05), with an average yield loss of 0.40, while apple yield loss increased rapidly after 2027 with an average yield loss of 0.32. It was found that the drought stress of alfalfa was more severe than that of apple.
Soil available water (SAW) refers to the difference between current soil water content and wilting moisture content. The SAW of apple and alfalfa systems both showed a significant downward trend (p < 0.05) during 2019–2038. The SAW of alfalfa had the greatest decrease. Although the heavy rainfall in 2023, 2027, and 2031 increased SAW of alfalfa considerably, it did not amend the overall decline. Alfalfa’s annual rate of decrease in SAW was 27.31 mm year−1, and the total decrease of SAW over the entire predicted period was 652.76 mm. SAW of the apple system was a relatively slower decline than alfalfa. The annual average decrease rate of SAW for apple trees was 13.62 mm year−1, and the total decrease over the entire predicted period was 476 mm.
Both the rainy season and the crop growing season end at the end of October, therefore, the soil moisture profile of October reflects the soil water consumption at the end of crop growth for each year. In this study, the average soil moisture profile of October was used to assess the dry soil layer (Figure 7). The dried soil layer formation depth (DSLFD), thickness (DSLT), and mean soil water content of the dried soil layer (DSL–SWC) are important indicators of a dried soil layer. The predicted DSLFD of each system was similar and stable at about 1 m according to the seasonal rainfall. The DSLT of alfalfa in 5, 10, 15, and 20 years was 250, 550, 900, and 1050 cm, and the DSL-SWC was 0.149, 0.120, 0.105, and 0.101 cm3 cm−3, respectively. DSLT of apple in 5, 10, 15, and 20 years was 150, 500, 1100, and 1450 cm, and DSL-SWC was 0.162, 0.159, 0.152, and 0.141 cm3 cm−3, respectively. In general, the DSLT of apple’s system was thicker, but DSL-SWC was higher than alfalfa.

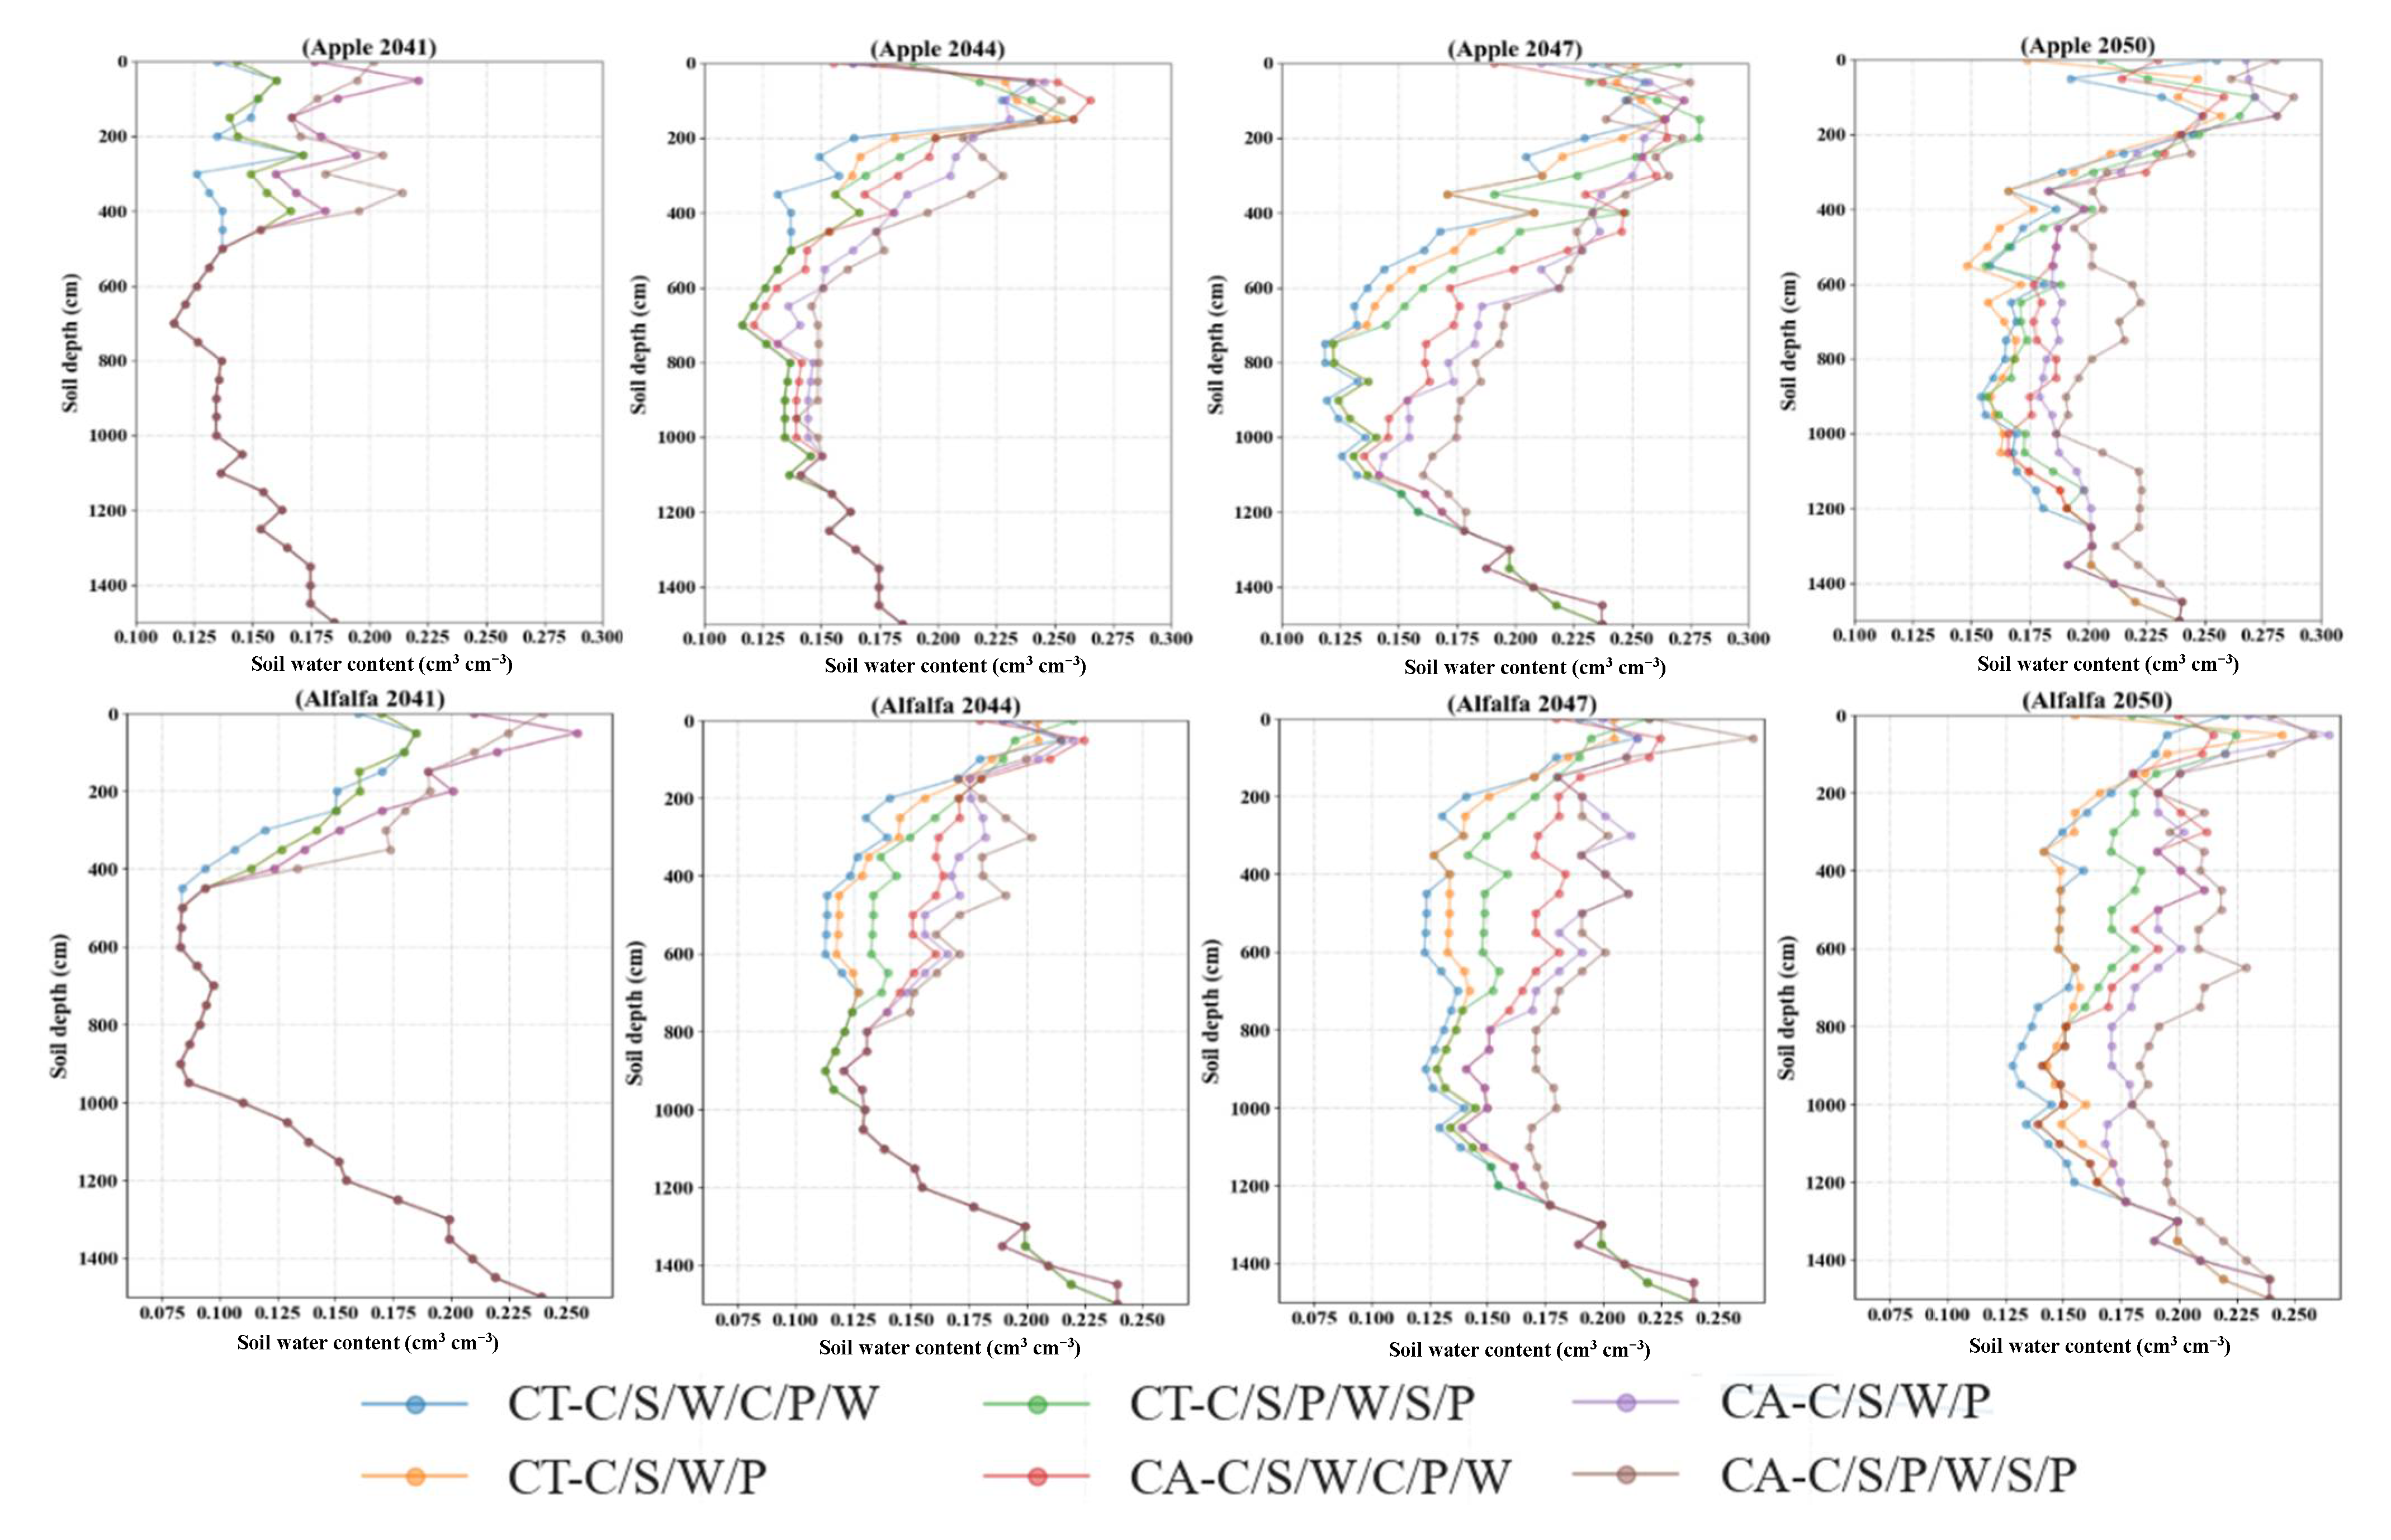
3.3. Restore the Dry Soil Layer (DSL) Based on Conservation Agriculture

Based on an apple orchard and alfalfa soil drought in 2038, the ability of six planting methods to repair the soil dry layer was evaluated. The results showed that conservation agriculture could significantly restore the DSL of alfalfa and apple orchards, especially the potato and soybean rotation with low root systems (Figure 8). During the restoration of DSL in apple orchards, the DSLT of three traditional agricultural systems, CT-C/S/W/C/P/W, CT-C/S/W/P, and CT-C/S/P/W/S/P last year was 769 ± 48.3, 708 ± 38.9, 550 ± 36.7 cm, the DSL-SWC was 0.164 ± 0.012, 0.162 ± 0.015, 0.167 ± 0.018 cm3 cm−3, respectively. The DSLT of three conservation agricultural systems, CA-C/S/W/C/P/W, CA-C/S/W/P, and CA-C/S/P/W/S/P last year was 334 ± 22.4, 125 ± 15.3, 35 ± 6.8 cm, the DSL-SWC was 0.169 ± 0.017, 0.168 ± 0.009, 0.177 ± 0.012 cm3 cm−3, respectively. During the restoration of DSL in alfalfa systems, the DSLT of three traditional agricultural systems, CT-C/S/W/C/P/W, CT-C/S/W/P, and CT-C/S/P/W/S/P last year was 947 ± 53.2, 866 ± 48.7, 717 ± 49.3 cm, the DSL-SWC was 0.145 ± 0.015, 0.146 ± 0.017, 0.145 ± 0.023 cm3 cm−3, respectively. The DSLT of three conservation agricultural systems, CA-C/S/W/C/P/W, CA-C/S/W/P, and CA-C/S/P/W/S/P in last year was 553 ± 43.7, 423 ± 34.6, 202 ± 28.3 cm, the DSL-SWC was 0.154 ± 0.017, 0.161 ± 0.013, 0.164 ± 0.008 cm3 cm−3, respectively.
During the process of DSL restoration, the change of soil available water (SAW) is shown in Figure 9. The recovery rate of SAW was similar to that of DSL. The recovery rate and total amount of conservation agriculture were significantly (p < 0.05) higher than traditional management. In apple orchards, the recovery rate of three traditional agricultural systems, CT-C/S/W/C/P/W, CT-C/S/W/P, and CT-C/S/P/W/S/P was 20.0 ± 1.3, 27.5 ± 1.7, 30.3 ± 1.7 mm year−1, the total recovery amount was 240 ± 15.7, 330 ± 18.4, 363 ± 22.2 mm, respectively. The recovery rate of three conservation agricultural systems, CA-C/S/W/C/P/W, CA-C/S/W/P, and CA-C/S/P/W/S/P was 46.7 ± 2.3, 53.8 ± 2.0, 56.9 ± 1.9 mm year−1, the total recovery amount was 560 ± 31.5, 646 ± 28.7, 683 ± 37.6 mm, respectively. In alfalfa systems, the recovery rate of three traditional agricultural systems, CT-C/S/W/C/P/W, CT-C/S/W/P, and CT-C/S/P/W/S/P was 22.8 ± 2.2, 30 ± 1.5, 31.5 ± 1.7 mm year−1, the total recovery amount was 273 ± 15.3, 356 ± 13.4, 378 ± 19.7 mm, respectively. The recovery rate of three conservation agricultural systems, CA-C/S/W/C/P/W, CA-C/S/W/P, and CA-C/S/P/W/S/P was 44.7 ± 2.8, 51.5 ± 1.9, 57.8 ± 2.1 mm year−1, the total recovery amount was 536 ± 23.5, 618 ± 32.1, 694 ± 28.4 mm, respectively.

4. Discussion

4.1. Performance of EPIC Model in Each System

The photosynthetic accumulation model converts solar radiation into cumulative biomass through WA and LAI-related parameters. This is the main reason for the high sensitivity of WA and related parameters of LAI [31,42]. Then, based on the accumulated biomass, the crop yield was estimated by HI. If there is no stress, crop yield has been found to be linearly correlated with HI using EPIC, which makes HI highly sensitive to the yield of apples and other crops [45]. As for perennial woody plants such as apple trees, their roots have developed drought resistance that is better than that of herbage and general field shallow-rooted crops. Therefore, correcting the value PAMA (76) is an important process when simulating yield. In ET simulation, compared with crop parameters, LAI-related parameters (DMLA), canopy interception index (PARM1), and Penman–Monteith adjustment factor (PARM74) have high sensitivities. SMC is mainly related to soil parameters (BD, FC), and the sensitivity of other parameters are low. It may be because although there are feedback regulations among the modules of the model, this indirect regulation only plays a supplementary role.
The yields of soybean, potato, corn, and alfalfa were slightly overestimated, with average values of 0.15, 0.85, 0.51, and 0.32 t·ha−1, respectively. Apple production was slightly underestimated, with an average estimate of 0.33 t·ha−1. This trend is consistent with Ko et al. [51], Niu et al. [52], Wang and Li [43], and Peng et al. [25]. Both ET and T were overestimated, and monthly T was overestimated 13.07, 4.92, 5.87, 2.85, and 2.09 mm in apple, alfalfa, corn, potato, and soybean, respectively. Higher ET was caused mainly by the overestimation of T, and the T of apples had the greatest overestimation. Penman–Monteith is a unit evapotranspiration model with a single underlying surface. When simulating forest land with uneven canopy distribution and low canopy density, the model will overestimate ET and T [53,54,55]. The results of this study are consistent with the above statements. Due to the overestimation of ET, the model is bound to overestimate the water stress in apple orchards, which may also be a reason for the underestimation of yield.

4.2. Comparison of Soil Drought between Apple and Alfalfa Systems

Soil desiccation exists widely in the woodlands and grasslands of the Loess Plateau. The formation of dry layers restricts the growth and development of crops [56,57]. The formation of DSL depends on the balance of soil water inputs and outputs [58,59]. The occurrence frequency of water-rich years and drought years in the Loess Plateau area with alternating occurrences of water-rich years and drought years has an important influence on the formation of dry layers [15,60]. During the predicted simulation for 2019–2038, the annual precipitation was low, and a dried soil layer in each system formed and tended to thicken and deepen over time. Compared with apple orchards, the soil desiccation and drought stress of alfalfa systems were more intense. The water productivity of alfalfa system was higher than that of the apple forest (Figure 6), especially in the early simulation period, which indicated that alfalfa had higher water use efficiency, could absorb more water, and had better growth conditions in the early simulation period. However, alfalfa systems have shallower roots than apple trees, and less soil water is directly available. Thus, when the topsoil water is consumed, drought stress and yield losses increase more rapidly. The soil available water consumption of alfalfa systems was significantly faster than that of apple orchards (p < 0.05), and the soil desiccation was more intense. Moreover, the DSL character of the alfalfa system was high in DSL-SWC and low in DSLT, which was closely related to the root distribution of crops.
In this study, apple and alfalfa systems both showed strong soil desiccation during the simulated 20 years. Alfalfa systems dropped by more than 50% in terms of SAM in 9–12 years and produced 10 m dry layers in 11–15 year, thus the alfalfa planting should be controlled within 10 years. In apple orchards, SAM decreased by more than 50% in 16–20 years, and the dry layer stabilized to below 10 m in 15–19 years. However, the water productivity and soil dry layer changes were only simulated in the peak fruiting period according to the corresponding parameters of apple trees in 12–15 years and ignored the young period of apple trees. Because EPIC uses a general crop growth S-type curve, this growth curve can simulate seasonal physiological changes in annual crops or perennial crops within one year, but it cannot effectively simulate the sapling, full fruit, and decline stages of perennial fruit trees [31,42]. Different types of apple trees have different times that they enter into peak fruiting period, and the number of years of decline is affected by many factors, which are difficult to represent in a model [61,62]. Therefore, given the sapling period, apple trees should be able to be planted longer.

4.3. Conservation Agriculture Has a Positive Effect on Soil Desiccation Restoration

Planting crops with high water consumption in low precipitation years should be restricted, and high-water demand crops should be alternated with shallow root crops with low water consumption as a way to reduce soil desiccation during large-scale vegetation restoration on the Loess Plateau [14,63]. In this study, the conservation agriculture management combined with shallow root crops could better restore soil desiccation. Conservation agriculture was a new agricultural system and technology system based on the sustainable development of agriculture. Its main objective was to achieve economically and ecologically sustainable agricultural production through the integrated management of available land, water, and biological resources [64]. Conservation agriculture cut off the connection between the evaporative surface and the soil capillary, effectively restraining soil evaporation and improving water availability [64,65]. Straw mulching reduced the direct impact of raindrops on the topsoil, penetrated a large amount of rainfall into the deep soil, increased soil permeability, reduced surface runoff, and improved the effective utilization of water [66,67].
Because the residues were burned after harvesting, conventional tillage caused air pollution and produced a lot of greenhouse gases. Frequent tillage also destroyed the surface soil structure and aggravated soil erosion. Thus, the fertility of the soil decreased, and more fertilizer was needed [68,69]. On the contrary, conservation agriculture did not affect the original structure, composition, and microbial diversity of the soil as much as possible [48,49]. Through biological coverage and no-tillage, more fertilizers were retained and prevented from being washed by rain [64]. Straw mulching formed a protective layer on the surface soil, which can increase the surface moisture, improved the soil organic matter and nutrient content [64,70]. Many studies [49,64,71,72] have shown that conservation agriculture is able to reduce input, increase production, reduce surface runoff, and prevent soil erosion. Moreover, conservation agriculture was also one of the important ways to enhance soil carbon sequestration [49,64,73]. Global conservation agriculture was estimated to maintain 0.5 to 5 billion tons CO2 year−1 in the farmland [73,74]. In this study, restoration of soil desiccation in conservation agriculture treatments was significantly higher than in conventional tillage treatments after planting 6 and 12 years (p < 0.05). In addition, the recovery effect increased with the increase of planting times of shallow root crops, such as potato and soybean. Consequently, it was suggested that conservation agricultural management should be used instead of traditional tillage in the process of soil desiccation restoration.

5. Conclusions

In this study, the Environment Policy Integrated Climate (EPIC) model was used to evaluate the drought degree of different returning farmland methods, and conservation agriculture and conventional tillage rotation systems were used to repair the soil dry layer in apple and alfalfa systems from 2039 to 2050 to explore the ecological potential. The result showed that EPIC simulations perform well but lack a perennial parameter variation mechanism. Soil desiccation of alfalfa was more serious than that of apple orchards, which was manifested in the lower DSL-SWC and the faster decreasing rate of soil available water. Under the same crop rotation, conservation agriculture contributed to restoring soil desiccation, and the rotation system with more shallow root crops such as potato and soybean has more recovery effect.

Supplementary Materials

The following are available online at https://www.mdpi.com/article/10.3390/f12091228/s1, Table S1: Crop parameter datasets in EPIC.

Author Contributions

Conceptualization, Y.W.; methodology, F.G.; software, F.G.; validation, F.G.; formal analysis, F.G.; writing—original draft preparation, F.G.; writing—review and editing, Y.W. and F.W.; visualization, F.G.; supervision, F.W.; project administration, Y.W.; funding acquisition, Y.W. All authors have read and agreed to the published version of the manuscript.

Funding

This research was funded by National Natural Science Foundation of China, grant number 41571218, 41401613 and Integrative Science-Technology Innovation Engineering Project of Shaanxi, grant number 2014KTCL02-06.

Institutional Review Board Statement

Not applicable.

Informed Consent Statement

Not applicable.

Data Availability Statement

Data sharing not applicable.

Acknowledgments

We are grateful for the support from the staff of the Mizhi, Ansai, and Luochan Experimental Station of Northwest A&F University.

Conflicts of Interest

The authors declare no conflict of interest.

References

  1. Verburg, P.H.; Crossman, N.; Ellis, E.C.; Heinimann, A.; Hostert, P.; Mertz, O.; Nagendra, H.; Sikor, T.; Erb, K.H.; Golubiewski, N.; et al. Land system science and sustainable development of the earth system: A global land project perspective. Anthropocene 2015, 12, 29–41. [Google Scholar] [CrossRef] [Green Version]
  2. Ren, Y.; Lü, Y.; Comber, A.; Fu, B.; Harris, P.; Wu, L. Spatially explicit simulation of land use/land cover changes: Current coverage and future prospects. Earth-Sci. Rev. 2019, 190, 398–415. [Google Scholar] [CrossRef]
  3. Shi, H.; Shao, M. Soil and water loss from the Loess Plateau in China. J. Arid Environ. 2000, 45, 9–20. [Google Scholar] [CrossRef] [Green Version]
  4. Liu, A.; Li, Y.; Zhang, F.; Xue, X. Study on the soil water dynamics of Kobresia Humilis Meadow in growing season. J. Arid Land Resour. Environ. 2008, 22, 130–135. [Google Scholar]
  5. Lv, Y.; Fu, B.; Feng, X.; Zeng, Y.; Chang, R.; Sun, G.; Wu, B. A Policy–Driven Large Scale Ecological Restoration: Quantifying Ecosystem Services Changes in the Loess Plateau of China. PLoS ONE 2012, 7, e31782. [Google Scholar]
  6. Chen, H.; Shao, M.; Li, Y. Soil desiccation in the Loess Plateau of China. Geoderma 2008, 143, 91–100. [Google Scholar] [CrossRef]
  7. Zhang, X.; Zhao, W.; Liu, Y.; Fang, X.; Feng, Q. The relationships between grasslands and soil moisture on the Loess Plateau of China: A review. Catena 2016, 145, 56–67. [Google Scholar] [CrossRef]
  8. Jia, X.; Shao, M.A.; Zhu, Y.; Luo, Y. Soil moisture decline due to afforestation across the Loess Plateau, China. J. Hydrol. 2017, 546, 113–122. [Google Scholar] [CrossRef]
  9. Wang, Y.; Shao, M.A.; Zhu, Y.; Sun, H.; Fang, L. A new index to quantify dried soil layers in water–limited ecosystems: A case study on the Chinese Loess Plateau. Geoderma 2018, 322, 1–11. [Google Scholar] [CrossRef]
  10. Jia, Y.; Li, T.; Shao, M.A.; Hao, J.; Wang, Y.; Jia, X.; Zeng, C.; Fu, X.; Liu, B.; Gan, M.; et al. Disentangling the formation and evolvement mechanism of plants–induced dried soil layers on China’s Loess Plateau. Agric. For. Meteorol. 2019, 269–270, 57–70. [Google Scholar] [CrossRef]
  11. Jia, X.X.; Zhao, C.; Wang, Y.; Zhu, Y.; Wei, X.; Shao, M.A. Traditional dry soil layer index method overestimates soil desiccation severity following conversion of cropland into forest and grassland on China’s Loess Plateau. Agric. Ecosyst. Environ. 2020, 291, 106794. [Google Scholar] [CrossRef]
  12. Querejeta, J.I.; Egerton-Warburton, L.M.; Allen, M.F. Hydraulic lift may buffer rhizosphere hyphae against the negative effects of severe soil drying in a California oak savanna. Soil Biol. Biochem. 2007, 39, 409–417. [Google Scholar] [CrossRef]
  13. Zhang, B.J.; Zhang, G.H.; Yang, H.Y.; Wang, H. Soil resistance to flowing water erosion of seven typical plant communities on steep gully slopes on the Loess Plateau of China. Catena 2019, 173, 375–383. [Google Scholar] [CrossRef]
  14. Robinson, N.; Harper, R.J.; Smettem, K.R.J. Soil water depletion by Eucalyptus spp. Integrated into dryland agricultural systems. Plant Soil 2006, 286, 141–151. [Google Scholar] [CrossRef]
  15. Jipp, P.H.; Nepstad, D.C.; Cassel, D.K.; Carvalho, C. Deep soil moisture storage and transpiration in forests and pastures of seasonally-dry Amazonia. Clim. Chang. 1998, 39, 395–412. [Google Scholar] [CrossRef]
  16. Yang, W.Z.; Yu, C.Z. Regional Control and Evaluation in Loess Plateau; Science Press: Beijing, China, 1992; pp. 190–297. [Google Scholar]
  17. Vörösmarty, C.J.; Green, P.; Salisbury, J.; Lammers, R.B. Global water resources: Vulnerability from climate change and population growth. Science 2000, 289, 284–288. [Google Scholar] [CrossRef] [Green Version]
  18. Li, Y.S. Effects of forest on water circle on the Loess Plateau. J. Nat. Resour. 2001, 16, 427–432. [Google Scholar]
  19. Wang, X.C.; Muhammad, T.N.; Hao, M.D.; Li, J. Sustainable recovery of soil desiccation in semi–humid region on the Loess Plateau. Agric. Water Manag. 2011, 98, 1262–1270. [Google Scholar] [CrossRef]
  20. Huang, Y.; Chen, L.; Fu, B.; Zhang, L.; Wang, Y. Evapotranspiration and soil moisture balance for vegetative restoration in a gully catchment on the Loess Plateau, China. Pedosphere 2005, 15, 509–517. [Google Scholar]
  21. Jia, Y.; Li, F.M.; Wang, X.L. Soil quality responses to alfalfa watered with a field micro–catchment technique in the Loess Plateau of China. Field Crops Res. 2006, 95, 64–74. [Google Scholar] [CrossRef]
  22. Jia, Y.; Li, F.M.; Zhang, Z.H.; Wang, X.L.; Guo, R.; Siddique, K.H.M. Productivity and water use of alfalfa and subsequent crops in the semiarid Loess Plateau with different stand ages of alfalfa and crop sequences. Field Crops Res. 2009, 114, 58–65. [Google Scholar] [CrossRef]
  23. Li, Y.S. Fluctuation of yield on high-yield field and desiccation of the soil on dryland. Acta Pedol. Sin. 2001, 38, 353–356. [Google Scholar]
  24. Liang, Y.M.; Li, D.Q.; Cong, X.H. A study on soil moisture and productivity of Astragalus assurgens pasture on Wuqi County. Bull. Soil Water Conserv. 1990, 10, 113–118. [Google Scholar]
  25. Peng, X.; Guo, Z.; Zhang, Y.; Li, J. Simulation of Long-term Yield and Soil Water Consumption in Apple Orchards on the Loess Plateau, China, in Response to Fertilization. Sci. Rep. 2017, 7, 5444. [Google Scholar] [CrossRef] [PubMed] [Green Version]
  26. Zhang, Z.Q.; Li, M.; Si, B.C.; Feng, H. Deep rooted apple trees decrease groundwater recharge in the highland region of the Loess Plateau, China. Sci. Total Environ. 2018, 622–623, 584–593. [Google Scholar] [CrossRef]
  27. Wang, Y.; Shao, M.A.; Zhu, Y.; Liu, Z. Impacts of land use and plant characteristics on dried soil layers in different climatic regions on the Loess Plateau of China. Agric. For. Meteorol. 2011, 151, 437–448. [Google Scholar] [CrossRef]
  28. Li, J.; Chen, B.; Li, X.F.; Zhao, Y.J.; Ciren, Y.J.; Jiang, B.; Hu, W.; Cheng, J.M.; Shao, M.A. Effects of deep soil desiccation on artificial forestlands in different vegetation zones on the Loess Plateau of China. Acta Ecol. Sin. 2008, 28, 1429–1445. [Google Scholar]
  29. Sonia, I.S.; Thierry, C.; Edouard, L.D. Investigating soil moisture–climate interactions in a changing climate: A review. Earth-Sci. Rev. 2010, 99, 125–161. [Google Scholar]
  30. Gilbert, M.E.; Hernandez, M.I. How should crop water–use efficiency be analyzed? A warning about spurious correlations. Field Crops Res. 2019, 235, 59–67. [Google Scholar] [CrossRef]
  31. Williams, J.R.; Jones, C.A.; Kiniry, J.R.; Spanel, D.A. The EPIC crop growth model. Trans. ASAE 1989, 32, 497–511. [Google Scholar] [CrossRef]
  32. IBSNAT. Decision Support System for Agrotechnology Transfer V2.10 (DSSAT V2.10); Department of Agronomy and Soil Science, College of Tropical Agriculture and Human Resources, University of Hawaii: Honolulu, HI, USA, 1989. [Google Scholar]
  33. Hijmans, R.J.; Guiking–Lens, I.M.; van Diepen, C.A. WOFOST 6.0. (User’s Guide for the WOFOST 6.0 Crop Growth Simulation Model); Technical Document 12; DLO Winand Staring Centre: Wageningen, The Netherlands, 1994. [Google Scholar]
  34. Stockle, C.O.; Martin, S.A.; Campbell, G.S. Cropsyst, a cropping systems simulation–model–water nitrogen budgets and crop yield. Agric. Syst. 1994, 46, 335–359. [Google Scholar] [CrossRef]
  35. Burt, J.E.; Hayes, J.T.; O’Rourke, P.A.; Terjung, W.H.; Tod–hunter, P.E. A parametric crop water use model. Water Resour. Res. 1981, 17, 1095–1108. [Google Scholar] [CrossRef]
  36. Clarke, D.; Smith, M.; El-Askari, K. CropWat for Windows: User Guide, Version 4.2; Food and Agriculture Organization of the United Nations: Rome, Italy, 1998. [Google Scholar]
  37. Parton, W.J.; McKeown, B.; Kirchner, V.; Ojima, D.S. CENTURY Users’ Manual; Colorado State University, NREL Publication: Fort Collins, CO, USA, 1992.
  38. Li, J.; Shao, M.A.; Zhang, X.C. Simulation equations for soil water transfer and use in the model. Agric. Res. Arid Areas 2004, 22, 72–75. [Google Scholar]
  39. Fan, L.; Lv, C.H.; Chen, C. A review of EPIC model and its applications. Prog. Geogr. 2012, 32, 584–592. [Google Scholar]
  40. Wang, X.C.; Li, J.; Tahir, M.N.; Fang, X.Y. Validation of the EPIC model and its utilization to research the sustainable recovery of soil desiccation after alfalfa (Medicago sativa L.) by grain crop rotation system in the semi–humid region of the Loess Plateau. Agric. Ecosyst. Environ. 2012, 161, 152–160. [Google Scholar] [CrossRef]
  41. Qiao, J.; Yu, D.; Wu, J. How do climatic and management factors affect agricultural ecosystem services? A case study in the agro–pastoral transitional zone of northern China. Sci. Total Environ. 2018, 613–614, 314–323. [Google Scholar] [CrossRef]
  42. Sharpley, A.N.; Williams, J.R. EPIC–Erosion/Productivity Impact Calculator: 1. Model Documentation; Technical Bulletin Number 1768; Department of Agriculture, United States: Washington, DC, USA, 1990.
  43. Wang, X.C.; Li, J. Evaluation of crop yield and soil water estimates using the EPIC model for the Loess Plateau of China. Math. Comput. Model. 2010, 51, 1390–1397. [Google Scholar] [CrossRef]
  44. Wang, Y.P.; Zhang, L.S.; Mu, Y.; Liu, W.H.; Guo, F.X.; Chang, T.R. Effect of a root-zone injection irrigation method on water productivity and apple production in a semi-arid region in northwestern China. Irrig. Drain. 2020, 69, 74–85. [Google Scholar] [CrossRef]
  45. Liu, J. A GIS–based tool for modelling large–scale crop–water relations. Environ. Model. Softw. 2009, 24, 411–422. [Google Scholar] [CrossRef]
  46. Gerik, T.J.; Harman, W.L.; Williams, J.R.; Francis, L.; Greiner, J.; Magre, M.; Meinardus, A.; Steglich, E.; Taylor, R. WinEPIC Interface Manual ver. 0810; Blackland Research and Extension Center: Temple, TX, USA, 2013; p. 101. [Google Scholar]
  47. Campolongo, F.; Cariboni, J.; Saltelli, A. An effective screening design for sensitivity analysis of large models. Environ. Model. Softw. 2007, 22, 1509–1518. [Google Scholar] [CrossRef]
  48. Wu, J.; Yu, F.S.; Chen, Z.X.; Chen, J. Global sensitivity analysis of growth simulation parameters of winter wheat based on EPIC model. Trans. CSAE 2009, 25, 136–142. [Google Scholar]
  49. Arunrat, N.; Pumijumnong, N.; Hatano, R. Predicting local–scale impact of climate change on rice yield and soil organic carbon sequestration: A case study in Roi Et Province, Northeast Thailand. Agric. Syst. 2018, 164, 58–70. [Google Scholar] [CrossRef]
  50. Qiao, J.; Cao, Q.; Liu, Y.; Wu, Q. Scale dependence and parameter sensitivity of the EPIC model in the agro–pastoral transitional zone of north China. Ecol. Model. 2018, 390, 51–61. [Google Scholar] [CrossRef]
  51. Ko, J.; Piccinni, G.; Steglich, E. Using EPIC model to manage irrigated cotton and maize. Agric. Water Manag. 2009, 96, 1323–1331. [Google Scholar] [CrossRef]
  52. Niu, X.; Easterling, W.; Hays, C.J.; Jacobs, A.; Mearns, L. Reliability and input–data induced uncertainty of the EPIC model to estimate climate change impact on sorghum yields in the U.S. Great Plains. Agric. Ecosyst. Environ. 2009, 129, 268–276. [Google Scholar] [CrossRef]
  53. Muzylo, A.; Llorens, P.; Valente, F.; Keizer, J.J.; Domingo, F.; Gash, J.H.C. A review of rainfall interception modelling. J. Hydrol. 2009, 370, 191–206. [Google Scholar] [CrossRef] [Green Version]
  54. Kool, D.; Agam, N.; Lazarovitch, N.; Heitman, J.L.; Sauer, T.J.; Ben-Gal, A. A review of approaches for evapotranspiration partitioning. Agric. For. Meteorol. 2014, 184, 56–70. [Google Scholar] [CrossRef]
  55. Pereira, L.S.; Allen, R.G.; Smith, M.; Raes, D. Crop evapotranspiration estimation with FAO56: Past and future. Agric. Water Manag. 2015, 147, 4–20. [Google Scholar] [CrossRef]
  56. Wang, L.; Shao, M.A.; Zhang, Q.F. Distribution and differentiation characteristics of dry soil layers in the Loess Plateau of Northern Shaanxi. Chin. J. Appl. Ecol. 2004, 15, 436–442. [Google Scholar]
  57. Balugani, E.; Lubczynski, M.W.; van der Tol, C.; Metselaar, K. Testing three approaches to estimate soil evaporation through a dry soil layer in a semi–arid area. J. Hydrol. 2018, 567, 405–419. [Google Scholar] [CrossRef]
  58. Li, Y.S. The properties of water cycle in soil and their effect on water cycle for land in the Loess Plateau. Acta Ecol. Sin. 1983, 3, 91–101. [Google Scholar]
  59. Sherwood, S.; Fu, Q. A Drier Future? Science 2014, 343, 737–739. [Google Scholar] [CrossRef]
  60. Li, J.; Wang, X.C.; Shao, M.A. Simulation of water–limiting biomass productivity of Chinese pine plantations and the soil desiccation effect in 3 sites with different annual precipitation on Loess Plateau. Sci. Silvae Sin. 2010, 46, 25–35. [Google Scholar]
  61. Guo, F.X.; Chang, T.R.; Lin, Y.Y.; Wang, Y.P.; Mu, Y. Simulation of soil water dynamics and water productivity of apple trees in different areas of Shaanxi Province, China. Chin. J. Appl. Ecol. 2019, 30, 379–390. [Google Scholar]
  62. Wang, X.; Williams, J.R.; Gassman, P.W.; Baffaut, C.; Izaurralde, R.C.; Jeong, J.; Kiniry, J.R. EPIC and APEX: Model use, calibration, and validation. Trans. ASABE 2012, 55, 1447–1462. [Google Scholar] [CrossRef]
  63. Tong, X.; Mu, Y.; Zhang, J.; Meng, P.; Li, J. Water stress controls on carbon flux and water use efficiency in a warm–temperate mixed plantation. J. Hydrol. 2019, 571, 669–678. [Google Scholar] [CrossRef]
  64. Le, K.N.; Jha, M.K.; Reyes, M.R.; Jeong, J.; Doro, L.; Gassman, P.W.; Hok, L.; de Moraes Sá, J.C.; Boulakia, S. Evaluating carbon sequestration for conservation agriculture and tillage systems in Cambodia using the EPIC model. Agric. Ecosyst. Environ. 2018, 251, 37–47. [Google Scholar] [CrossRef]
  65. Gao, J.; Yang, X.; Zheng, B.; Liu, Z.; Zhao, J.; Sun, S.; Li, K.; Dong, C. Effects of climate change on the extension of the potential double cropping region and crop water requirements in Northern China. Agric. For. Meteorol. 2019, 268, 146–155. [Google Scholar] [CrossRef]
  66. Ali, M.H.; Talukder, M.S.U. Increasing water productivity in crop production: A synthesis. Agric. Water Manag. 2008, 95, 1201–1213. [Google Scholar] [CrossRef]
  67. Banerjee, K.; Krishnan, P.; Mridha, N. Application of thermal imaging of wheat crop canopy to estimate leaf area index under different moisture stress conditions. Biosyst. Eng. 2018, 166, 13–27. [Google Scholar] [CrossRef]
  68. Abid, M.; Lal, R. Tillage and drainage impact on soil quality—I. Aggregate stability, carbon and nitrogen pools. Soil Tillage Res. 2008, 100, 89–98. [Google Scholar] [CrossRef]
  69. Alvarez, R.; Steinbach, H.S. A review of the effects of tillage systems on some soil physical properties, water content, nitrate availability and crops yield in the Argentine Pampas. Soil Tillage Res. 2009, 104, 1–15. [Google Scholar] [CrossRef]
  70. Priya, L.C.P.; Richard, W.B.; Edward, G.B.; Enamul, K. Straw mulch and irrigation affect solute potential and sunflower yield in a heavy textured soil in the Ganges Delta. Agric. Water Manag. 2020, 239, 106211. [Google Scholar]
  71. Baghel, J.K.; Das, T.K.; Raj, R.; Paul, S.; Mukherjee, I.; Bish, M. Effect of conservation agriculture and weed management on weeds, soil microbial activity and wheat (Triticum aestivum) productivity under a rice (Oryza sativa)-wheat cropping system. Indian J. Agric. Sci. 2018, 88, 61–68. [Google Scholar]
  72. Dusserre, J.; Chopart, J.L.; Douzet, J.M.; Rakotoarisoa, J.; Scopel, E. Upland rice production under conservation agriculture cropping systems in cold conditions of tropical highlands. Field Crops Res. 2012, 138, 33–41. [Google Scholar] [CrossRef]
  73. Hartmann, J.; Jansen, N.; Dürr, H.H. Global CO2-consumption by chemical weathering: What is the contribution of highly active weathering regions. Glob. Planet. Chang. 2009, 69, 185–194. [Google Scholar] [CrossRef] [Green Version]
  74. Beerling, D.J.; Kantzas, E.P.; Lomas, M.R. Potential for large-scale CO2 removal via enhanced rock weathering with croplands. Nature 2020, 583, 242–248. [Google Scholar] [CrossRef] [PubMed]
Figure 1. Location of weather station and observation sites in the studies zone of the Loess Plateau.
Forests 12 01228 g001
Figure 2. Calculation process of crop growth and hydrology cycle in EPIC model.
Forests 12 01228 g002
Figure 3. Sensitivity of yield, evapotranspiration and soil moisture for apple, alfalfa, corn, soybean and potato, (a) Yield, (b) evapotranspiration, (c) soil moisture.
Forests 12 01228 g003
Figure 4. Observed (OBS) yield (t ha−1), evapotranspiration (ET, mm), and soil moisture content (SMC, cm3 cm−3) vs. simulated (SIM).
Forests 12 01228 g004
Figure 5. Comparison of observed (OBS) soil moisture content (SMC) and simulated (SIM) SMC in 0–800 cm soil layer. Error bars represent the standard deviation (SD).
Forests 12 01228 g005
Figure 6. Prediction of water productivity, yield loss, and soil available water for apple and alfalfa from 2019 to 2038.
Forests 12 01228 g006
Figure 7. Soil water content (cm3 cm−3) profiles of the 0–15 m soil layer in apple and alfalfa systems.
Forests 12 01228 g007
Figure 8. Soil water content (cm3 cm−3) profiles of the 0–15 m in conventional tillage and conservation agriculture.
Forests 12 01228 g008
Figure 9. Prediction of soil available water for apple and alfalfa from 2039 to 2050.
Forests 12 01228 g009
Table 1. Crop rotation combination from 2039 to 2050.
CombinationAbbreviation
Conventional tillageCron-Soybean-Wheat-Cron-Potato-Wheat*2CT-C/S/W/C/P/W
Cron-Soybean-Wheat-Potato*3CT-C/S/W/P
Cron-Soybean-Potato-Wheat-Soybean-Potato*2CT-C/S/P/W/S/P
Conservation agricultureCron-Soybean-Wheat-Cron-Potato-Wheat*2CA-C/S/W/C/P/W
Cron-Soybean-Wheat-Potato*3CA-C/S/W/P
Cron-Soybean-Potato-Wheat-Soybean-Potato*2CA-C/S/P/W/S/P
Table 2. Related parameters of crop and hydrological cycle in EPIC model.
NOParameterSymbol
1Biomass-energy ratio (kg ha−1 MJ−1 m−2)WA
2Harvest indexHI
3Maximum potential leaf area index.DMLA
4Fraction of growing season when LAI starts to declineDLAI
5Nitrogen uptake—Nitrogen fraction at 0.5 maturityBN2
6Adjust crop canopy resistance in the Penman–Monteith EQPARM (1)
7Governs rate of soil evaporation from top 0.2 m of soilPARM (12)
8Power of change in day length component of LAI growth PARM (70)
9Penman–Monteith adjustment factorPARM (74)
10Harvest index adjustment for fruit and nut treesPARM (76)
11Bulk Density(moist) of soil layer (t cu. M−1)BD
12Wilting Point (m m−1)WP
13Field Capacity (m m−1)FC
Table 3. Statistical values of crop yield, ET, and CWP from 2019 to 2038.
IndexParameterAPPLEAlfalfa
Water productivity (kg cm−3)Maximum5.215.43
Minimum0.631.04
Average2.573.03
Standard deviation0.920.94
Coefficient of variation (%)35.930.86
Yield lossMaximum0.760.88
Minimum0.070.08
Average0.320.40
Standard deviation0.180.23
Coefficient of variation (%)57.157.4
Soil available water (mm)Maximum15801654
Minimum556.9509.6
Average949.6788.2
Standard deviation160.6192.0
Coefficient of variation (%)16.924.4
Publisher’s Note: MDPI stays neutral with regard to jurisdictional claims in published maps and institutional affiliations.

