Article

Sorption Characteristic of Thermally Modified Wood at Varying Relative Humidity

1
Co-Innovation Center of Efficient Processing and Utilization of Forest Resources, Nanjing Forestry University, Nanjing 210037, China
2
College of Furnishings and Industrial Design, Nanjing Forestry University, Nanjing 210037, China
3
College of Materials Science and Engineering, Nanjing Forestry University, Nanjing 210037, China
*
Author to whom correspondence should be addressed.
Forests 2022, 13(10), 1687; https://doi.org/10.3390/f13101687
Submission received: 17 September 2022 / Revised: 11 October 2022 / Accepted: 11 October 2022 / Published: 14 October 2022
(This article belongs to the Section Wood Science and Forest Products)

Abstract

:
Thermal modification (TM) is commonly used for improving the performance of wood under varying environmental conditions. The effect of TM on the hygroscopic properties of wood has been studied extensively; however, the sorption mechanism and the states of water of thermally modified wood (TMW) at varying relative humidity (RH) is limited. In this work, Douglas fir was modified at 180 °C, 200 °C and 220 °C for a duration of 2 h and the Hailwood–Horrobin model and NMR relaxometry were used after specimens were conditioned at eight different RHs. The results showed that TM inhibited monolayer and polylayer moisture sorption with increasing modification temperatures in all RHs. The lower slope of the sorption isotherms in TMW decreased compared with the control, indicating that the TM increased the hygroscopical stability of wood. The T2 distribution indicated that no free water was observed in the hygroscopic moisture range. The mobility of water molecules in the cell walls was decreased by TM intensity and increased by increasing RH.

1. Introduction

With the increasing consciousness of carbon emission and sustainable development, wood has been considered as an appropriate and beneficial solution for construction materials. However, wood is a hydrophilic material and experiences sorption when exposed to environments with varying moisture conditions. The moisture content (MC) of wood has a great effect on the physical and mechanical properties of wooden products. Thermal modification (TM), which is an effective and eco-friendly method to decrease the hygroscopicity and to increase the performance (e.g., dimensional stability and decay resistance) of wood during its service life, has been widely used in the wood industry [1,2,3,4,5,6].
During the last decade, many studies demonstrated the changes in the chemical components of thermally modified wood and the subsequent changes in the hygroscopicity and vapor sorption behavior of wood after TM. It was found that TM decreases the equilibrium moisture content (EMC) and the slope of the sorption isotherm due to the degradation of hydrophilic hemicelluloses, the increased crystallinity of cellulose and the crosslinked structure of lignin at an elevated temperature [7,8,9,10,11]. Water vapor sorption in wood is typically understood in terms of the sorption isotherm model, which could give a physical picture of the interactions between water molecules and wood polymers. The Hailwood–Horrobin model is often used to analyze the sorption behavior because of its good fit of the sigmoid to the EMC obtained in lignocellulose materials [12]. It can attribute the total water sorbed to mono- and polymolecular sorption without the need for any assumption regarding the nature of the geometry of the cell wall micropores [13,14]. It has been reported that TM decreases the content of both mono- and polylayer moisture clearly; however, the reduction in polylayer moisture is comparatively smaller than that of monolayer moisture [15]. Despite the traditional weighing method, NMR relaxometry is often applied as a non-destructive tool to determine the water state and to quantify the water content within wood [16,17]. Since the water confined in different pore sizes is subjected to interactions that change its T2 relaxation time, the NMR spectroscopy could distinguish and quantify the free water and the bound water in wood by different T2 distribution [18]. The changes in water content and pore size distribution of saturated wood samples before and after weathering has been reported by authors in previous articles [19,20].
Although the hygroscopicity and the sorption behavior of thermally modified wood (TMW) have been extensively studied, the sorption mechanism and the states of water in TMW at varying relative humidity (RH) have not been studied comprehensively. Much of the research on the hygroscopicity of TMW is mostly evaluated by comparing the decline of EMC of wood before and after TM. Therefore, studying the sorption isotherm model and the water state of TMW during a sorption process would be beneficial to understand the sorption mechanism and to predict the hygroscopicity performance of TMW for similar end-use conditions.
In this study, Douglas fir, a material widely used in construction and furniture products in China, was first modified with different temperatures and conditioned at different RHs. The Hailwood–Horrobin model was used for the isotherm fitting and the determination of the monolayer and polylayer moisture of the modified wood, and NMR spectroscopy was used for determining the amount of cell wall water and capillary water in the sorption range.

2. Materials and Methods

2.1. Materials

Douglas fir (Pseudotsuga menziesii (Mirb.) Franco) boards containing both heartwood and sapwood, purchased from a lumber store with dimensions of 900 mm × 100 mm × 20 mm (L × T × R), were used in this study. All boards were first pre-dried by a conventional kiln at the temperature of 80 °C until the moisture content of the wood decreased to 10%. Then, each board was split into 4 pieces, of which three pieces underwent thermal modification, while the remaining unmodified piece was used as the control. For the thermal modification process, the temperature was increased by 10 °C per hour and the target temperatures (i.e., 180, 200 and 220 °C) were maintained constant for 2 h. Steam was present during the entire thermal modification phase.

2.2. Vapour Sorption Test

Kiln dried specimens with dimensions of 20 mm × 6 mm × 6 mm (L × T × R) were further prepared from both the modified and the control boards. Ten replicates were prepared from each modification group. The sorption test was conducted in a chamber at 25 °C using the gravimetric saturated salt solutions method. The saturated salt solutions and their corresponding RH are shown in Table 1. The change of weight was recorded every 6 h. The equilibrium moisture content (EMC) was achieved when the difference between two consecutive measurements was less than 0.1%.

2.3. Hailwood–Horrobin Model and Data Fitting

The Hailwood–Horrobin Model was used to further analyze the effects of TM on the EMC and on the monolayer and polylayer moisture sorption of Douglas fir. The EMC of the specimen at various RH conditions can be expressed using the following Equation (1),
M = M mono + M poly = 18 K 1 K 2 H W ( 1 + K 1 K 2 H ) + 18 K 2 H W ( 1 K 2 H )
where M (%) is the MC of the specimen at a given relative humidity H (%), Mmono is the MC of the mono-molecular sorption (%), Mpoly is the MC of the poly-molecular sorption (%), W (g/mol) denotes the molecular weight of the substance required to associate one gram mole of water, K1 is the equilibrium constant between mono- and poly-molecular sorptions, K2 is the equilibrium constant between poly-molecular sorption and external vapor pressure.
Equation (1) can be transformed to represent a parabolic Equation (2) to statistically fit the sorption data,
H M = A + B H C H 2
where A, B and C are the regression coefficients that can be obtained from K1, K2 and W using Equations (3)–(5):
A = W 18 [ 1 K 2 ( K 1 + 1 ) ]
B = W 18 ( K 1 1 K 1 + 1 )
C = W 18 ( K 1 K 2 K 1 + 1 )
After substituting the isothermal sorption data at different RH conditions into Equation (2), the regression coefficients and the values of W, K1 and K2 for all specimens can be calculated. Then, the moisture content of the monolayer and the polylayer can be determined via Equation (1).

2.4. 1H NMR Experiments

To investigate the water state and to quantify the amount of water within the wood specimens at different RHs, the 1H NMR relaxometry was carried out using a Niumag MicroMR-10 spectrometer (Niumag Corporation, Shanghai, China; magnetic field strength: 0.5 T; resonance frequency: 24 MHz).
Sorption test specimens were used in this experiment. The T2 relaxation times were measured using a CPMG (Carr–Purcell–Meiboom–Gill) pulse sequence. To ensure that the signal from liquid water can be observed at room temperature, the echo time and the total number of echoes were 0.2 ms and 10,000, respectively. The relaxation delay and the number of accumulate scans were 3 s and 16, respectively. The T2 relaxation time distribution was then obtained by the Laplace inversion of echo amplitudes using the Contin program developed by Provencher.

3. Results

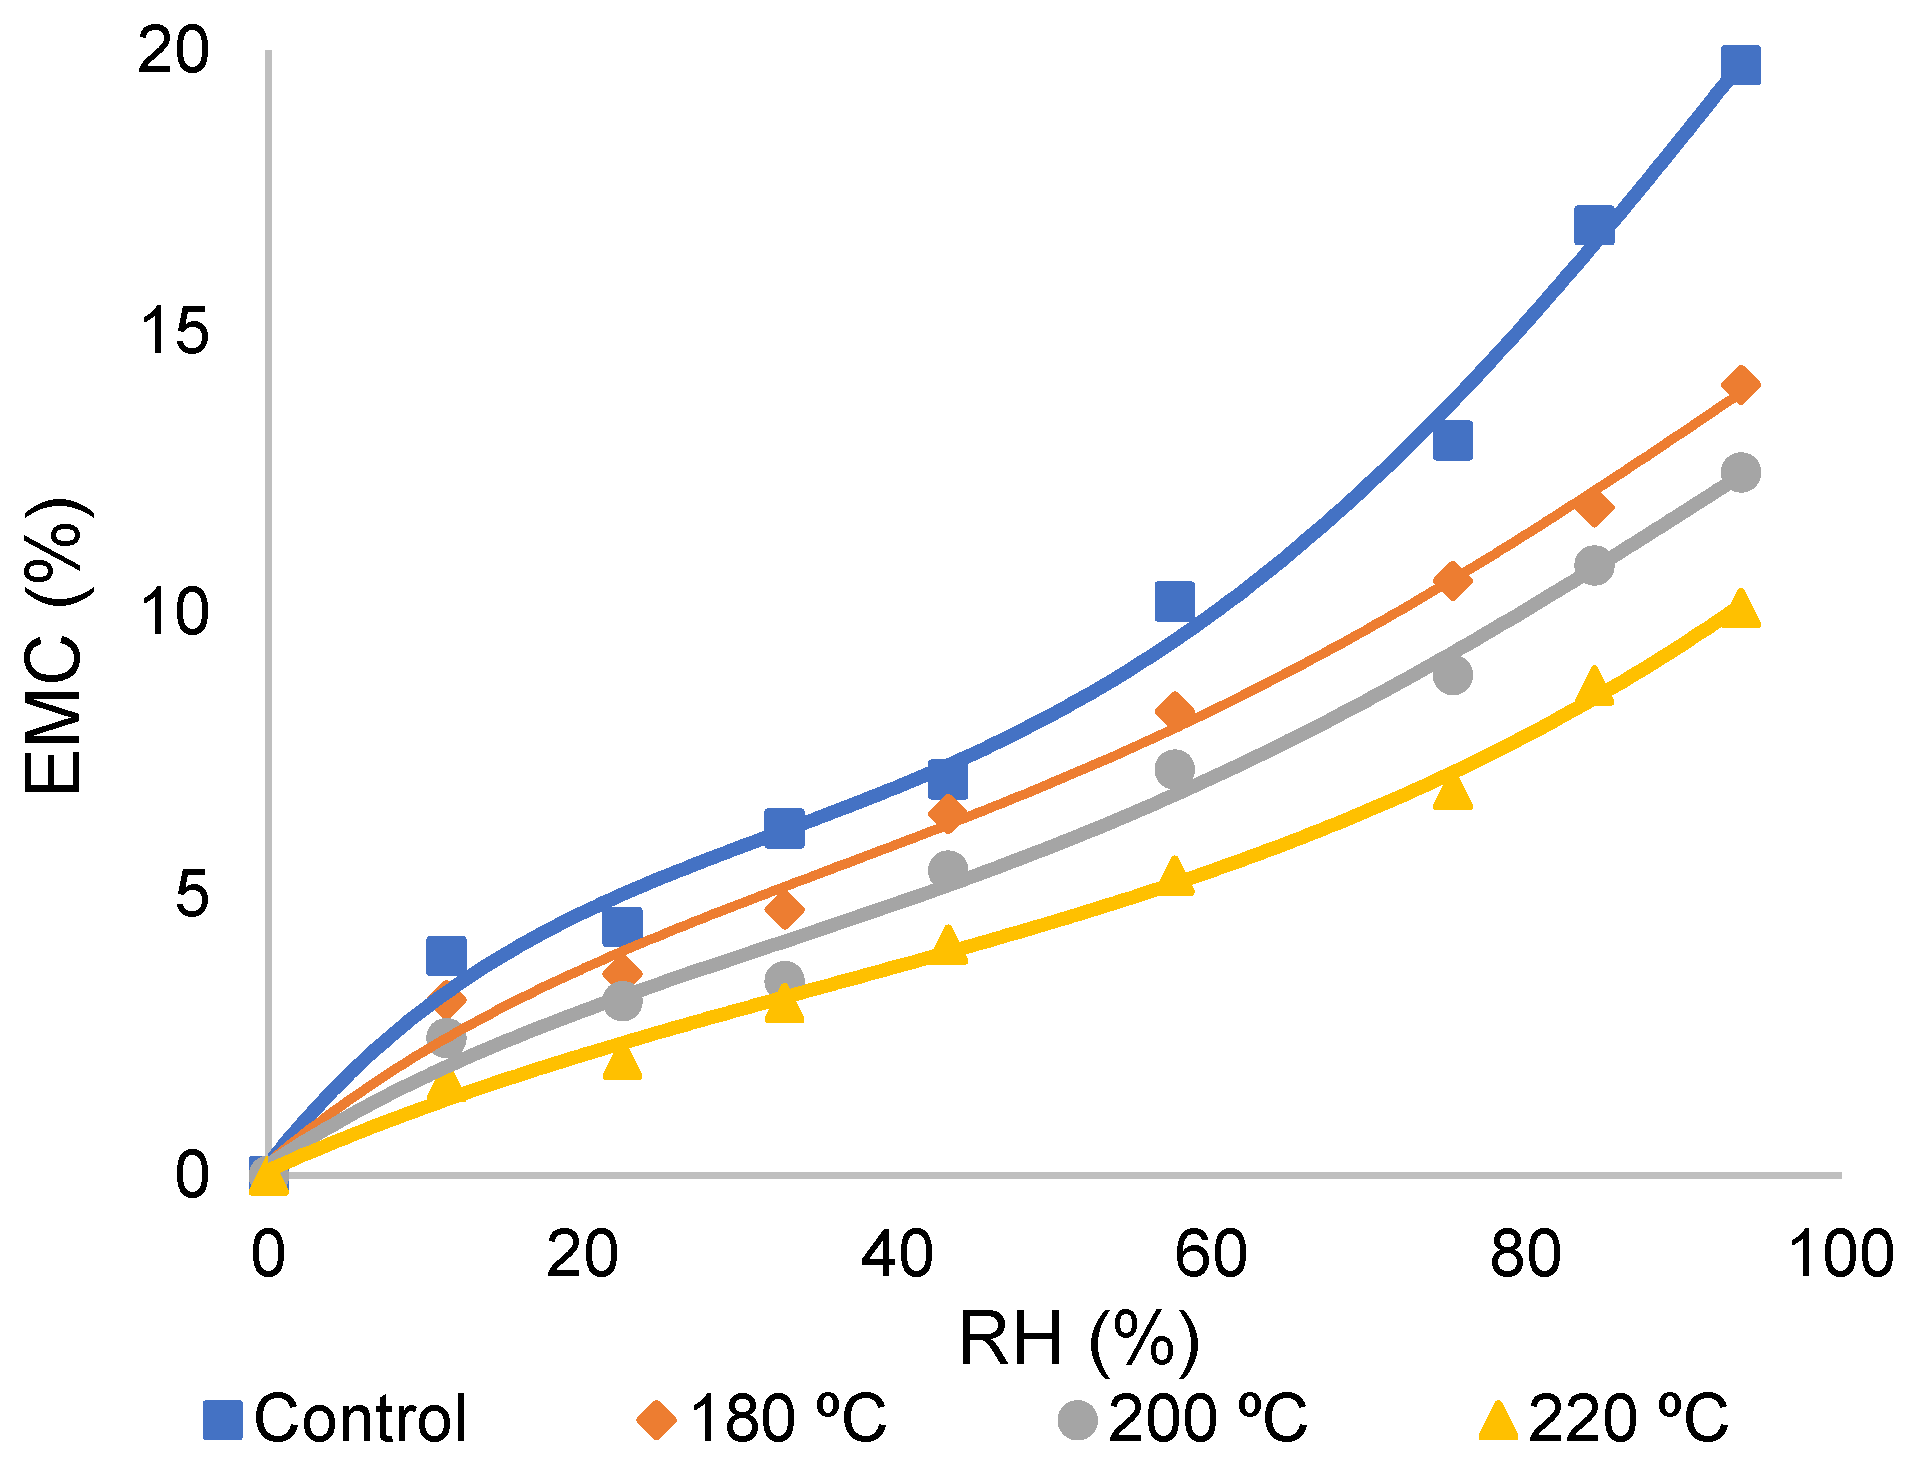
3.1. The Sorption Isotherms of TMW at Various RHs

The sorption isotherms of Douglas fir before and after TM are shown in Figure 1 and Table S1. Unsurprisingly, the EMC at different RHs was obviously lower for the TMW specimens than for the controls and the EMC decreased with increasing modification temperatures. In addition, the sorption isotherm of all groups presented a sigmoid shape and the slopes of the sorption isotherms are lower in TMW than that of control.

3.2. Isotherm Model Fit

After fitting the sorption isotherm by the Hailwood–Horrobin model, all coefficients corresponding to each group were expressed with only one set of the K1, K2 and W parameters and the numeric results are shown in Table 2. The results show that the Hailwood–Horrobin model was appropriate to represent the equilibrium data of the specimens. The K2 values presented a negligible difference varying from 0.791 to 0.716. The equilibrium constant K1 was obviously decreased by the more severe TM conditions, while the W value was greatly increased with increasing temperature. For example, the W value increased by about 58.1% after modification at 220 °C for 2 h.
The mono- and polylayer moisture contents were calculated according to the Hailwood–Horrobin model (Equation (1)) and are presented in Figure 2. Although both mono- and polylayer moisture contents showed an increasing trend with the increasing RH, their moisture contents were still decreased by the increasing modification temperature. For example, at 93.6% RH condition, TM at 180, 200 and 220 °C decreased the monolayer moisture content by 9.6, 21.2 and 39.8%, respectively. Similarly (at 93.6% RH condition), TM at 180, 200 and 220 °C decreased the polylayer moisture content by 20.2, 39.5 and 55.5%, respectively.

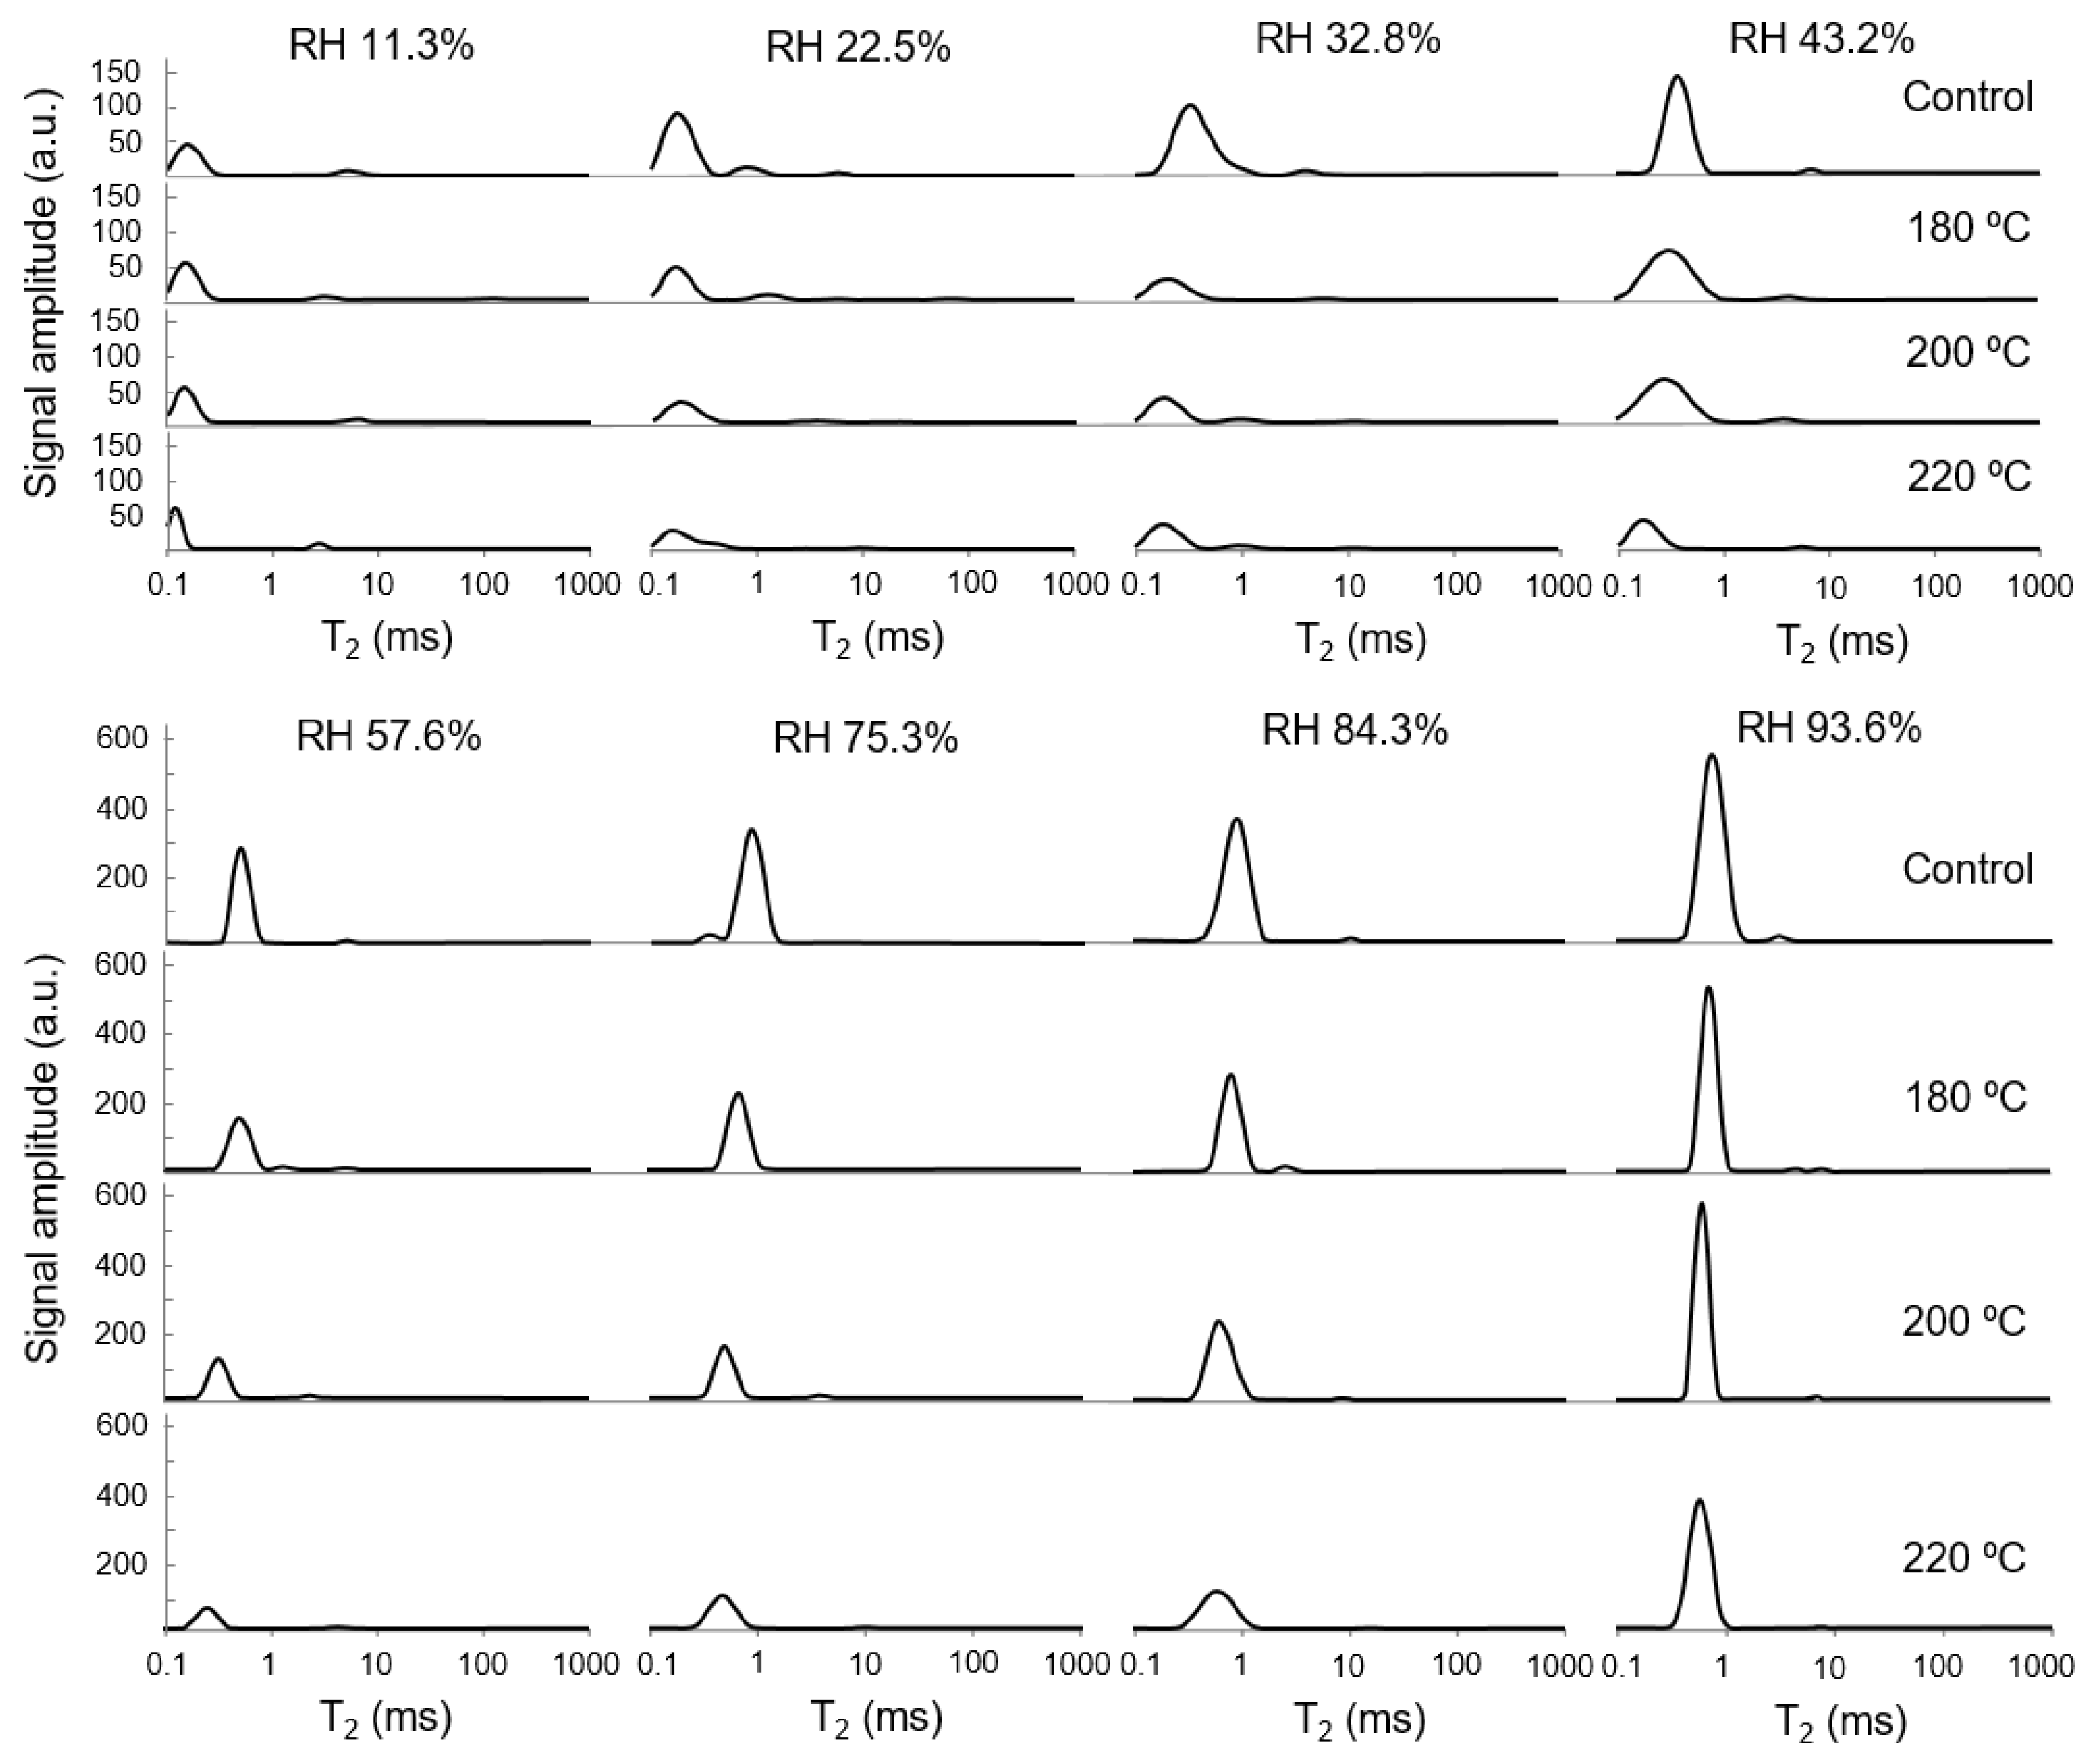
3.3. T2 and Moisture Distribution of Specimens under Different RHs

The T2 relaxation time distribution of heated and treated Douglas fir after conditions at various RHs are shown in Figure 3. The results show that two signals were observed in different RH conditions at room temperature, including one strong signal from 0.1 to 1 ms and a weak signal between 1 and 10 ms. According to Figure 3 and Table 3, the T2 peak time of the bound water (T2P) increased apparently with increasing RH, but it decreased with the increasing TM temperature.
The water content of the specimens can be reflected by the peak integrals at different conditions from Figure 3. Table 4 presents the integral of total water (IP), the integral of bound water (IPbw) and the proportion of bound water (Pbw) at different RHs. The results show that increasing the TM intensity significantly reduced the total water content and the bound water content in all specimens at different RHs. In addition, the integral of the other peak (T2: 1–10 ms) seemed to be around 70 ± 22 (a.u.) at all tested RHs, independently with the change of MC.

4. Discussion

4.1. The Sorption Isotherms of TMW

The decreased EMC with increased TM temperature at different RHs indicated reduced hygroscopicity with increasing TM intensity. Similar results for the influence of TM on EMC have been confirmed by other researchers [8,21,22,23]. The reduction of EMC, indicating the removal of accessible sorption sites and decreased hygroscopicity, which could be due to the decreased accessible OH groups, increased crystallinity and/or potential cross-linking reactions by TM [1,24]. Those changes in the chemical components might have increased the stiffness of the cell wall matrix and subsequently limited the expansion of the cell wall microvoids [9]. In addition, previous research has indicated that TM reduced the number of nanopores (1.5–5 nm) in cell walls, which could also be the reason for the decreased sorption capacity [19].
The slopes of the sorption isotherms are lower in TMW than that of the control, indicating that the TM increased the hygroscopical stability of the wood [9]. Below 60% RH, the slope of the isotherms was flat, while above 60% RH the sorption isotherm exhibited an upward bend. This is because voids and pores were essentially absent from the cell walls when the wood started to adsorb moisture from the dry state, making it difficult for the water molecules to enter the microfibrils [25]. Above 60% RH, the slope increased rapidly for all groups. This might be explained by the capillary sorption of free water. However, some researchers found that the capillary condensation makes only a small contribution to the EMC during adsorption [26,27]. Therefore, the upward bend of the sorption isotherms was probably attributed to the softening of amorphous polymers at high RH, which decreased the viscosity and rigidity of the polymeric network and increased the capacity to accommodate water molecules in cell walls [25]. Since TM decreased the hygroscopicity and swelling and shrinkage efficiency of the wood, TMW presented a flatter slope than that of the control during the entire RH range.

4.2. Isotherm Model Fit and Adsorption Properties

The lower K1 implied a reduction in the activities of the wood and the dissolved water in the hydrated wood. The increase in the W value revealed a decreased number of active adsorption sites. The results from Table 2 indicate that both the activity and the capacity of adsorption decreased after TM, and consequently the TMW became less hygroscopic. This result was consistent with previous research [1,8,15,28].
The decreased mono- and polylayer moisture content confirmed the decreased number of sorption sites and the reduced hygroscopicity of the wood matrix, which was consist with the changes of the K1 and W values in Table 2.

4.3. T2 and Moisture Distribution of Specimens under Different RHs

At the experimental temperature (i.e., 25 °C), moisture within the wood was all in a liquid phase and could be observed. Since the T2 distribution of water in porous media is considered approximately proportional to the pore diameter [17,19], the peak with shorter T2 (<1 ms) observed in Figure 3 resulted from the bound water confined in the cell wall pores. Generally, peaks with T2 longer than 10 ms represent free water from other voids (i.e., ray cell lumen, pits, and tracheid lumen) [17,19,29]. However, the additional peak in Figure 3 was observed between 1 and 10 ms, indicating this signal might not arise from free water. Kekkonen et al., [17] studied the saturated TMW and claimed this signal might be a consequence of the fast exchange between the cell wall bound water and some free water, whereas Gezici-Koc et al., [29], who obtained the similar result in teak, interpreted this signal as low-molecular-weight extractives. According to the previous literature, despite most of the original extractives degrading and evaporating during TM, new extractives can be generated due to the degradation of carbohydrate [1,2]. Because the free water was not observed from the T2 distribution, the exchange between bound water and free water seemed to be inappropriate in this case. Furthermore, since the integral of this peak was constant regardless of changes in RH, it is reasonable to believe this T2 component (1–10 ms) resulted from low-molecular-weight extractives.
It was obvious to see that the T2 peak time of the bound water (T2P) decreased with the increasing TM temperature (Figure 3 and Table 3), which could be explained by the decreased mobility of the water molecules and the increased limitation of water movement in the cell walls after TM [20,29]. Furthermore, the T2P of bound water increased apparently with the increasing RHs. It is probably due to the softening of the cell wall structure at high RH [25], which increased the capacity to accommodate water molecules and subsequently increased the mobility of water molecules in the cell walls.
In accordance with previous studies [19,20,30], a reduction in IP with the increasing TM temperature indicated the reduced hygroscopicity of TMW, which is in agreement with the EMC results reported before. The reduced amount of bound water of all TMW implied that the wood cell wall became more hydrophobic after TM due to partial elimination of the hydrophilic hydroxyl groups of hemicelluloses [31]. Free water was absent at RHs below 93.6% (Figure 3), which is consistent with previous research that lumens are empty during adsorption in hygroscopic moisture ranges [25,29].

5. Conclusions

This study investigated the sorption characteristic of thermally modified Douglas fir at varying RH conditions. The results showed that only bound water was observed during adsorption in the hygroscopic moisture ranges. TM inhibited the moisture sorption of the wood matrix and showed lower sorption isotherms in both mono- and polylayer moisture, resulting in lower hygroscopicity with increasing modification temperature in all RHs. The mobility of water molecules in the cell walls decreased after TM, while the increased IP and T2 values with the increasing RH implied the increased water molecules’ capacity and the mobility of water molecules in the cell walls.

Supplementary Materials

The following supporting information can be downloaded at: https://www.mdpi.com/article/10.3390/f13101687/s1, Table S1: The EMC of specimens at various RHs (%).

Author Contributions

Conceptualization, C.C.; methodology, F.Z.; software, F.Z.; validation and analysis, F.Z.; resources, C.C.; data curation, F.Z. and C.C.; writing—original draft preparation, C.C.; writing—review and editing, C.C.; supervision, C.C.; project administration, C.C. All authors have read and agreed to the published version of the manuscript.

Funding

This research was funded by Jiangsu Province Science and Technology Project (CN) (SZ-SQ2019023).

Data Availability Statement

Not applicable.

Acknowledgments

The authors thank Cai Jiabin and Gao Xin for their suggestions in methodology, software and data analysis.

Conflicts of Interest

The authors declare no conflict of interest.

References

  1. Hill, C.A.S. Wood Modification-Chemical, Thermal and Other Processes; John Wiley & Sons: Chichester, UK, 2006. [Google Scholar]
  2. Esteves, B.; Pereira, H. Wood modification by heat treatment: A review. BioResources 2009, 4, 370–404. [Google Scholar] [CrossRef]
  3. Hu, W.; Liu, N.; Guan, H. Optimal design of a furniture frame by reducing the volume of wood. Drewno 2019, 62, 85–97. [Google Scholar]
  4. Hu, W.; Wan, H.; Guan, H. Size effect on the elastic mechanical properties of beech and its application in finite element analysis of wood structures. Forests 2019, 10, 783. [Google Scholar] [CrossRef] [Green Version]
  5. Yang, L.; Jin, H.H. Effect of Heat Treatment on the Physic-Mechanical Characteristics of Eucalyptus urophylla ST Blake. Materials 2021, 14, 6643. [Google Scholar] [CrossRef]
  6. Wang, X.H.; Ma, J.W.; Xu, W.; Fei, B.H.; Lian, C.P.; Sun, F.B. Effect of bending on radial distribution density, MFA and MOE of bent bamboo. Sci. Rep. 2022, 12, 8610. [Google Scholar] [CrossRef]
  7. Yang, L.; Liu, H.H. Effect of a Combination of Moderate-Temperature Heat Treatment and Subsequent Wax Impregnation on Wood Hygroscopicity, Dimensional Stability, and Mechanical Properties. Forests 2020, 11, 920. [Google Scholar] [CrossRef]
  8. Zhou, F.; Fu, Z.; Gao, X.; Zhou, Y. Changes in the wood-water interactions of mahogany wood due to heat treatment. Holzforschung 2020, 74, 853–863. [Google Scholar] [CrossRef]
  9. García-Iruela, A.; Esteban, L.G.; García, F.F.; de Palacios, P.; Rodriguez-Navarro, A.B.; Martín-Sampedro, R.; Eugenio, M.E. Changes in cell wall components and hygroscopic properties of Pinus radiata caused by heat treatment. Eur. J. Wood Wood Prod. 2021, 79, 851–861. [Google Scholar] [CrossRef]
  10. Wu, J.Y.; Zhong, T.H.; Zhang, W.F.; Shi, J.J.; Fei, B.H.; Chen, H. Comparison of colors, microstructure, chemical composition and thermal properties of bamboo fibers and parenchyma cells with heat treatment. J. Wood Sci. 2021, 67, 56. [Google Scholar] [CrossRef]
  11. Wang, P.Y.; Cheng, S.; Cao, S.; Cai, J.B. Evaluation of Color Changes, Wettability, and Moisture Sorption of Heat-Treated Blue-Stained Radiata Pine Lumber. BioResoures 2022, 17, 4952–4961. [Google Scholar] [CrossRef]
  12. Hailwood, A.J.; Horrobin, S. Absorption of water by polymers: Analysis in terms of a simple model. Trans. Faraday Soc. 1946, 42, B084–B092. [Google Scholar] [CrossRef]
  13. Simpson, W. Sorption theories applied to wood. Wood Fiber Sci 1980, 12, 183–195. [Google Scholar]
  14. Papadopoulos, A.N.; Hill, C.A.S. The sorption of water vapour by anhydride modified softwood. Wood Sci. Technol. 2003, 37, 221–231. [Google Scholar] [CrossRef]
  15. Patcharawijit, A.; Choodum, N.; Yamsaengsung, R. Effects of superheated steam treatment on moisture adsorption and mechanical properties of pre-dried rubberwood. Drying Techno. 2019, 37, 1647–1655. [Google Scholar] [CrossRef]
  16. Bucur, V. Nondestructive Characterization and Imaging of Wood; Springer: Berlin Heidelberg, Germany, 2003. [Google Scholar]
  17. Kekkonen, P.M.; Ylisassi, A.; Telkki, V.V. Absorption of water in thermally modified pine wood as studied by NMR. J. Phys. Chem. C 2014, 118, 2146–2153. [Google Scholar] [CrossRef]
  18. Brownstein, K.R.; Tarr, C.E. Importance of Classical Diffusion in NMR Studies of Water in Biological Cells. Phys. Rev. A 1979, 19, 2446. [Google Scholar] [CrossRef]
  19. Cai, C.Y.; Javed, M.A.; Komulainen, S.; Telkki, V.-V.; Haapala, A.; Heräjärvi, H. Effect of natural weathering on water absorption and pore size distribution in thermally modified wood determined by nuclear magnetic resonance. Cellulose 2020, 27, 4235–4247. [Google Scholar] [CrossRef] [Green Version]
  20. Cai, C.Y.; Zhou, F.D.; Cai, J.B. Bound Water Content and Pore Size Distribution of Heat-treated Wood Studied by NMR. Forests 2020, 11, 1279. [Google Scholar] [CrossRef]
  21. Hill, C.A.S.; Keating, B.A.; Jalaludin, Z.; Mahrdt, E. A rheological description of the water vapour sorption kinetics behaviour of wood invoking a model using a canonical assembly of Kelvin-Voigt elements and a possible link with sorption hysteresis. Holzforschung 2012, 66, 35–47. [Google Scholar] [CrossRef]
  22. Cao, S.; Cheng, S.; Cai, J. Research progress and prospects of wood high-temperature heat treatment technology. BioResources 2022, 17, 3702–3717. [Google Scholar] [CrossRef]
  23. Li, R.R.; Fang, L.; Xu, W.; Xiong, X.Q.; Wang, X.D. Effect of Laser Irradiation on the Surface Wettability of Poplar Wood. Sci. Adv. Mater. 2019, 11, 655–660. [Google Scholar] [CrossRef]
  24. Zhou, T.; Liu, H.H. Research Progress of Wood Cell Wall Modification and Functional Improvement: A Review. Materials 2022, 15, 1598. [Google Scholar] [CrossRef] [PubMed]
  25. Fredriksson, M.; Thybring, E.E. On sorption hysteresis in wood: Separating hysteresis in cell wall water and capillary water in the full moisture range. PLoS ONE 2019, 14, e0225111. [Google Scholar] [CrossRef]
  26. Thygesen, L.G.; Engelund, E.T.; Hoffmeyer, P. Water sorption in wood and modified wood at high values of relative humidity—Part 1: Results for untreated, acetylated, and furfurylated Norway spruce. Holzforschung 2010, 64, 315–323. [Google Scholar] [CrossRef]
  27. Engelund, E.T.; Thygesen, L.G.; Hoffmeyer, P. Water sorption in wood and modified wood at high values of relative humidity—Part 2. Theoretical assessment of the amount of capillary water in wood microvoids. Holzforschung 2010, 64, 325–330. [Google Scholar] [CrossRef]
  28. Murata, K.; Watanabe, Y.; Nakano, T. Effect of Thermal Treatment on Fracture Properties and Adsorption Properties of Spruce Wood. Materials 2013, 6, 4186–4197. [Google Scholar] [CrossRef] [Green Version]
  29. Gezici-Koç, Ö.; Erich, S.; Huinink, H.; Ven, L.; Adan, O. Bound and free water distribution in wood during water uptake and drying as measured by 1D magnetic resonance imaging. Cellulose 2017, 24, 535–553. [Google Scholar] [CrossRef] [Green Version]
  30. Zauer, M.; Kretzschmar, J.; Grossmann, L.; Pfriem, A.; Wagenfuhr, A. Analysis of the pore-size distribution and fiber saturation point of native and thermally modified wood using differential scanning calorimetry. Wood Sci. Technol. 2014, 48, 177–193. [Google Scholar] [CrossRef]
  31. Cai, C.Y.; Haapala, A.; Rahman, M.H.; Tiitta, M.; Tiitta, V.; Tomppo, L.; Lappalainen, R.; Herajarvi, H. Effect of two-year Natural Weathering on Chemical and Physical Properties of Thermally Modified Picea abies, Pinus sylvestris and Fraxinus Excelsior Wood. Can. J. Forest. Res. 2020, 50, 1160–1171. [Google Scholar] [CrossRef]
Figure 1. Sorption isotherms of specimens.
Forests 13 01687 g001
Figure 2. Monomolecular (left) and polymolecular (right) adsorption isotherms.
Forests 13 01687 g002
Figure 3. The T2 relaxation time distribution of Douglas fir (Pseudotsuga menziesii) after conditions at various RHs.
Forests 13 01687 g003
Table 1. Saturated salt solutions and the registered relative humidity at 25 °C.
Salt SolutionsLiClCH3COOKMgCl2K2CO3NaBrNaClKClKNO3
RH (%)11.322.532.843.257.675.384.393.6
Table 2. Fitting coefficients for the Hailwood–Horrobin isotherms adsorption.
ABCK1K2WR2
Control0.8622.9118.6734.640.791436.90.98
180 °C1.0425.0819.8332.320.766480.20.97
200 °C1.5727.9421.3025.360.732544.30.98
220 °C3.0833.9725.9116.390.716690.90.96
Table 3. The T2 value of bound water peak after conditions at various RHs (unit: ms).
RHsControl180 °C200 °C220 °C
11.3%0.2150.1680.1640.149
22.5%0.2930.1730.1710.162
32.8%0.4770.3160.3020.253
43.2%0.5250.5030.4970.178
57.6%0.6920.6070.4940.352
75.3%0.8130.6110.6410.639
84.3%0.8760.7250.6570.644
93.6%0.8830.7380.6840.679
Table 4. The integral of all peaks (IP) and bound water peak (IPbw) and the proportion of bound water (Pbw) at different RHs.
RHControl180 °C200 °C220 °C
(%)EMC (%)IP (a.u.)IPbw (a.u.)Pbw (%)EMC (%)IP (a.u.)IPbw (a.u.)Pbw (%)EMC (%)IP (a.u.)IPbw (a.u.)Pbw (%)EMC (%)IP (a.u.)IPbw (a.u.)Pbw (%)
11.33.9088481692.33.1287175987.22.4446039986.81.6631026585.6
22.54.421600150193.83.581381128192.83.1077070291.22.0667860989.9
32.86.172422232395.94.731752164093.63.461196112894.33.0785078091.8
43.27.042540247297.36.432122201394.95.421202112993.94.1194588893.9
57.610.213452340798.78.252435235296.67.221595150094.15.531287120393.5
75.313.074883482998.910.573013296298.38.902330223595.96.851862182297.9
84.316.896073600698.911.883845377998.310.853341329498.68.712671263798.7
93.619.748609854999.314.065821577499.212.505086503098.910.094221418799.2
Publisher’s Note: MDPI stays neutral with regard to jurisdictional claims in published maps and institutional affiliations.

