Article

Relative Importance of Landscape and Climate Factors to the Species Diversity of Plant Growth Forms along an East Asian Archipelago

1
Department of Forestry Resources, Kookmin University, 77 Jeongneung Rd., Seongbukgu, Seoul 02707, Korea
2
Warm Temperate and Subtropical Forest Research Center, National Institute of Forest Science, 22 Donnaeko Rd., Seogwipo-si 63582, Korea
3
Department of Forestry, Environment, and System, Kookmin University, 77 Jeongneung Rd., Seongbukgu, Seoul 02707, Korea
*
Author to whom correspondence should be addressed.
Forests 2022, 13(2), 218; https://doi.org/10.3390/f13020218
Submission received: 27 December 2021 / Revised: 25 January 2022 / Accepted: 28 January 2022 / Published: 31 January 2022
(This article belongs to the Section Forest Biodiversity)

Abstract

:
Previous studies on island biogeography theory have limitations in that they are mostly focused on total plant species and the landscape factors of the islands. Our study was conducted to overcome these limitations by dividing the plants into five growth forms and analyzing climate and landscape factors on inhabited islands, uninhabited islands, and overall. This was achieved using plant data from 578 islands of an archipelago in South Korea. To test the relationship between the species richness of each growth form and environmental factors, we performed ordinary least squares regressions and multi-model inference tests. The results showed that the island area had the largest influence on species richness of all growth forms in overall and uninhabited islands. Moreover, climate factors, in addition to island area, significantly affected species richness of all growth forms on inhabited islands. However, the effect and of isolation-related landscape factors (i.e., distance from the mainland and structural connectivity) were different among growth forms and island categories. Our study reveals that there are differences in the effects of environmental factors on the growth forms of plants among island categories. This suggests that biodiversity management and conservation strategies should be applied separately to different growth forms and islands.

1. Introduction

An island is land that is surrounded by the sea and is formed on the surface of the water at high tide [1]. Owing to these unique environmental conditions, compared to terrestrial ecosystems, island ecosystems provide a limited area of habitat for the survival and reproduction of organisms [2,3]. An island represents an isolated ecosystem with poor species immigration and turnover because the mainland and surrounding islands are disconnected [4]. These characteristics of island ecosystems have become the key background for the theory of evolution and ecology. This includes natural selection and community assembly, and island biogeography based on the biogeographical process (e.g., migration, extinction, and speciation) of the island ecosystem [2,5,6].
The theory of island biogeography (TIB) is a field of ecology that analyzes and interprets the effects of environmental factors related to biodiversity in island ecosystems [2]. This theory predicts that species richness in an island is determined by the island area and distance from the mainland, which determine the colonization and extinction of species. Many previous studies have reported that island area and species richness have a positive relationship, whereas the distance from the mainland has a negative relationship with species richness [7,8]. In recent research, various landscape factors are used for TIB analysis. This includes the structural connectivity to determine the degree of isolation (by quantifying the connectivity between surrounding islands) and habitat heterogeneity (by analyzing the diversity of land cover) [9,10]. Many studies have also emphasized that landscape factors are crucial aspects in determining the species richness of islands [11].
However, from a few recent studies [12,13], it has been suggested that the major factors affecting the colonization of plants in island ecosystems are not only landscape factors, but also climate factors such as the mean annual temperature (MAT) and mean annual precipitation (MAP). These are the factors that affect plant growth and distribution [14]. However, most of the previous studies analyzed the relative importance of area, distance from the mainland, and other landscape factors (e.g., habitat heterogeneity and structural connectivity) for species richness on islands. Research that simultaneously considers climatic and landscape factors is very rare [15,16]. It is therefore necessary to study the effects of climate factors on species richness in island ecosystems with landscape factors.
The functional traits of plants are effective tools for investigating the effects of abiotic filtering, biotic interactions, and processes at various levels across species, communities, and ecosystems. Consequently, in recent years, interest in investigating the functional traits of plants in island ecosystems has increased [17,18,19]. Functional traits are defined as physiological, anatomical, morphological, or phenotypic features measured at an individual or species level and which inform about various functions in a plant [14]. In particular, plant growth forms (e.g., trees, shrubs, herbs), one of the most representative and classical functional traits, are simple but powerful proxies for representing various ecological abilities such as life history strategies, dispersal abilities, ecological adaptations, and habitat requirements [20]. For example, on small islands, woody species (shrubs and trees) are more adaptable to environmental disturbances caused by climate than herbaceous species [12,21].
Inhabited and uninhabited islands show obvious differences in ecological processes because of different island characteristics, including area and isolation [22]. An inhabited island is a place where people live year-round, and which is exposed to anthropogenic disturbances. In addition, inhabited islands have a larger area and are closer to the mainland than uninhabited islands [1]. Uninhabited islands without registered inhabitants living on them are generally smaller and more isolated than inhabited islands [22]. Moreover, uninhabited islands are mainly affected by natural disturbances rather than anthropogenic disturbances [22,23]. Furthermore, uninhabited islands play an important role in increasing biodiversity in island ecosystems, providing significant habitats for rare species as a result of isolation and limited human impacts [24]. Previous studies on the biodiversity of islands have been conducted mainly on uninhabited islands, or studies have analyzed combined data from inhabited and uninhabited islands [10,22]. In other words, there are few studies on the effect of differences in the characteristics of inhabited and uninhabited islands on species diversity and distribution.
To date, many studies have been conducted on island biogeography. However, there are some limitations in the previous studies: (1) there is still insufficient research on whether species richness patterns between inhabited and uninhabited islands are similar; (2) although the responses of plant species to environmental or habitat factors are different among growth forms, most of the previous studies focused on the patterns of overall species richness regardless of plant growth forms or focused on the richness patterns between woody and herbaceous plants; and, finally, (3) the explanatory factors used in previous studies are limited to landscape factors. To overcome these limitations in the present study, we analyzed the relative contributions of landscape and climate factors to the species richness of plant growth forms of an archipelago in South Korea. At the same time, we investigated whether there are differences in abiotic factors that affect plant species richness between inhabited and uninhabited islands. In addition, we evaluated whether the richness patterns and the drivers differ among plant growth forms such as trees, shrubs, forbs, graminoids, and ferns.

2. Materials and Methods

2.1. Study Area

There are 3358 islands in South Korea’s territorial waters, of which 2876 are uninhabited and 482 are inhabited. In addition, the islands are predominantly distributed on the west and south coasts of South Korea [25]. These islands are widely distributed between 33°07′ N 124°47′ E and 37°57′ N 128°34′ E. Owing to the geographical characteristics of the Korean Peninsula and the marine climate, the islands have a variety of climatic and vegetation zones [26]. The major vegetation on the islands includes (1) coniferous forests, dominated by Pinus thunbergii Parl.; (2) temperate deciduous and broad-leaved forests, dominated by Carpinus turczaninowii Maxim., Kalopanax septemlobus (Thunb.) Koidz., Quercus serrata Thunb., and Zelkova serrata (Thunb.) Makino; (3) temperate evergreen and broad-leaved forests, dominated by Castanopsis sieboldii (Makino) Hatus., Machilus thunbergii Siebold and Zucc., Eurya japonica Thunb., and Camellia japonica L.; and (4) herbaceous and dune plants such as Carex boottiana Hook. and Arn., Pteridium aquilinum (L.) Kuhn, Vitex rotundifolia L.f., and Zoysia sinica Hance [27,28].
The islands along the west and south coastline of South Korea were designated as a reserve (the Shinan Dadohae Biosphere Reserve) by the United Nations Educational, Scientific and Cultural Organization in 2009. This includes the Dadohae National Marine Park, Hallyeo National Marine Park, and Taeanhaean National Park. This is regarded as an ecologically important region, with many endemic Korean species and various marine organisms and plants, also playing the role of a stopover point for migratory birds [27]. In order to systematically manage and conserve the landscape, ecology, and biological resources of these islands, the Ministry of Environment (MOE) conducted the Natural Environment Survey of National Island from 1973 to 2016. In the present study, we analyzed the vegetation data of 619 islands, obtained from these national surveys. The MOE selected these 619 islands that were judged to be important for conservation and sustainable management in terms of biological resources (plants, mammals, birds, marine organisms, etc.) and landscape values [29]. The islands with no plant species were excluded from the analysis and the same applied where it was not possible to extract independent factors (i.e., landscape and climate factors). In the end, we used 578 islands—86 inhabited and 492 uninhabited—for analysis (Figure 1). The sizes of islands ranged from 0.008 ha to 37,611.33 ha.

2.2. Plant Diversity and Environmental Variables

We used island vegetation data from the Korean government and research institutes (Table S1). A total of 2018 vascular plant species (188 families and 808 genera) were recorded on 578 islands, with an average of 97 species per island (Tables S1 and S2). We used species richness as a proxy for plant diversity on each island. In the study, we divided the recorded plant species into five growth forms—trees, shrubs, forbs, graminoids, and ferns—based on the Korea Biodiversity Information System (http://www.nature.go.kr, accessed on 13 November 2021), provided by the Korea National Arboretum, Korea Forest Service. To simplify the process, we defined grasses, sedges, and rushes as graminoids. The species richness for each growth form on an island was calculated.
In order to analyze the relative importance of landscape and climate factors to plant richness of the growth forms, the area, distance from the mainland, and structural connectivity of each island as landscape factors were calculated. We used MAT and MAP as climate factors, which are known as elements that directly affect the distribution and physiological adaptability of plants [30].
The island area (ha) was calculated using national basic spatial data provided by the National Geographic Information Institute. Distance from the mainland (km) was measured, using ArcGIS 10.5 (Esri, Redlands, CA, USA) as the shortest distance between the island edge and the boundary of the mainland. In this study, the closest distance to the Korean peninsula was measured as the distance from the mainland for islands around the Korean peninsula. However, for islands distributed around Jeju Island, the biggest island in South Korea at 1849 km2, the closest distance to Jeju Island (and not the Korean peninsula) was measured as the distance from the mainland. To quantify structural connectivity, we followed the methodology of Aggemyr et al. [9], which incorporates island area and the degree of isolation. Because there is information on size and distance of all potential sources of a species, this method is appropriate for highly fragmented habitats [9,31]. We used five buffer distances (i.e., 500, 1000, 2000, 3000, and 4000 m) to assess the effect of structural connectivity on the plant richness of each island. Consequently, all islands within a buffer were involved in the calculation. Structural connectivity was calculated as follows:
C i = i = 1 n W A j W d j A j   w h e r e   W A j = A j A l   a n d   W D j = k d i j r ,
where A j and A l are the area of island j and the area of all surrounding islands within the buffer radius r (500 m, 1000 m, 2000 m, 3000 m, 4000 m), respectively. The dij is the Euclidean distance between islands i and j, and k is a constant set to 0.01 [9].
The MAT and MAP for each island were calculated using the national digital climate maps (DCM) produced by the National Center of Agro-Meteorology at the Korea Meteorological Administration [32]. DCM are spatial data with a resolution of 30 m for each grid. Using DCM, the polygon spatial data of each island were reduced to a point, and then the value of the intersecting grid was extracted. For small islands that cannot be divided into grids, the values of grids nearest to the islands are used.
All landscape and climate factors were quantified using ArcGIS 10.5. Summary statistics of species richness of plant growth forms, and landscape and climate factors are provided in Figure S1 and Tables S3 and S4.

2.3. Statistical Analysis

To determine the multicollinearity between explanatory factors, we performed a Pearson correlation analysis for landscape and climate factors (Table S5). We removed the other connectivity indices except for the connectivity of the 2000 m radius. This was because of strong correlations between the structural connectivity values of the 500 m, 1000 m, 2000 m, 3000 m, and 4000 m radius.
We performed a simple OLS regression analysis to test the relationship between the species richness of each growth form and individual environmental factors. To assess the relative importance of landscape and climate factors to plant richness of growth forms, we used the model averaging approach with all possible subsets of regression models from a multi-model inference test [33]. The model averaging method generates parameter estimates and estimates derived from weighted averages of values across multiple models, rather than conditional estimates of one model [34]. Furthermore, we performed a variance inflation factor (VIF) for the evaluation of multicollinearity in the best multiple regression models. When the VIF value is over 10, multicollinearity can reduce explanatory power, cause inaccurate model parameters, and omit significant factors [35]. However, we found that all values of VIF were lower than 3 in all cases, indicating that multicollinearity among landscape and climate factors did not affect the results of the models. We used MuMIn packages for multi-model inference tests with R version 3.6.3 (R Core Team, Vienna, Austria). Before the statistical analysis, we implemented a log transformation for island area, and square root transformations for distance from the mainland and structural connectivity. The MAP and MAT were not transformed because the original data were close to normal distribution. Finally, all the factors were standardized to improve the linearity and normality.

3. Results

3.1. Plant Species Composition

The plant species richness on 578 islands ranged from 1 to 877 species, with a total of 2018 species. Of the 2018 plant species, woody plants accounted for 22.3% of all plant species, a total of 449 species (101 families and 206 genera). Tree and shrub species recorded totaled 173 (43 families and 84 genera) and 276 (58 families and 112 genera) species, respectively (Figure 2). Herbaceous plants accounted for 77.7% of all the plant species (188 families, 808 genera, and 2018 species; Table S1). This category included 1569 species (139 families and 629 genera). Herbaceous plants consisted of 1122 forb species (111 families and 470 genera), 307 graminoid species (three families and 101 genera), and 140 fern species (25 families and 58 genera). Detailed statistics for species richness patterns of plant growth forms on inhabited and uninhabited islands are shown in Figures S2 and S3 of the Supplementary Materials.

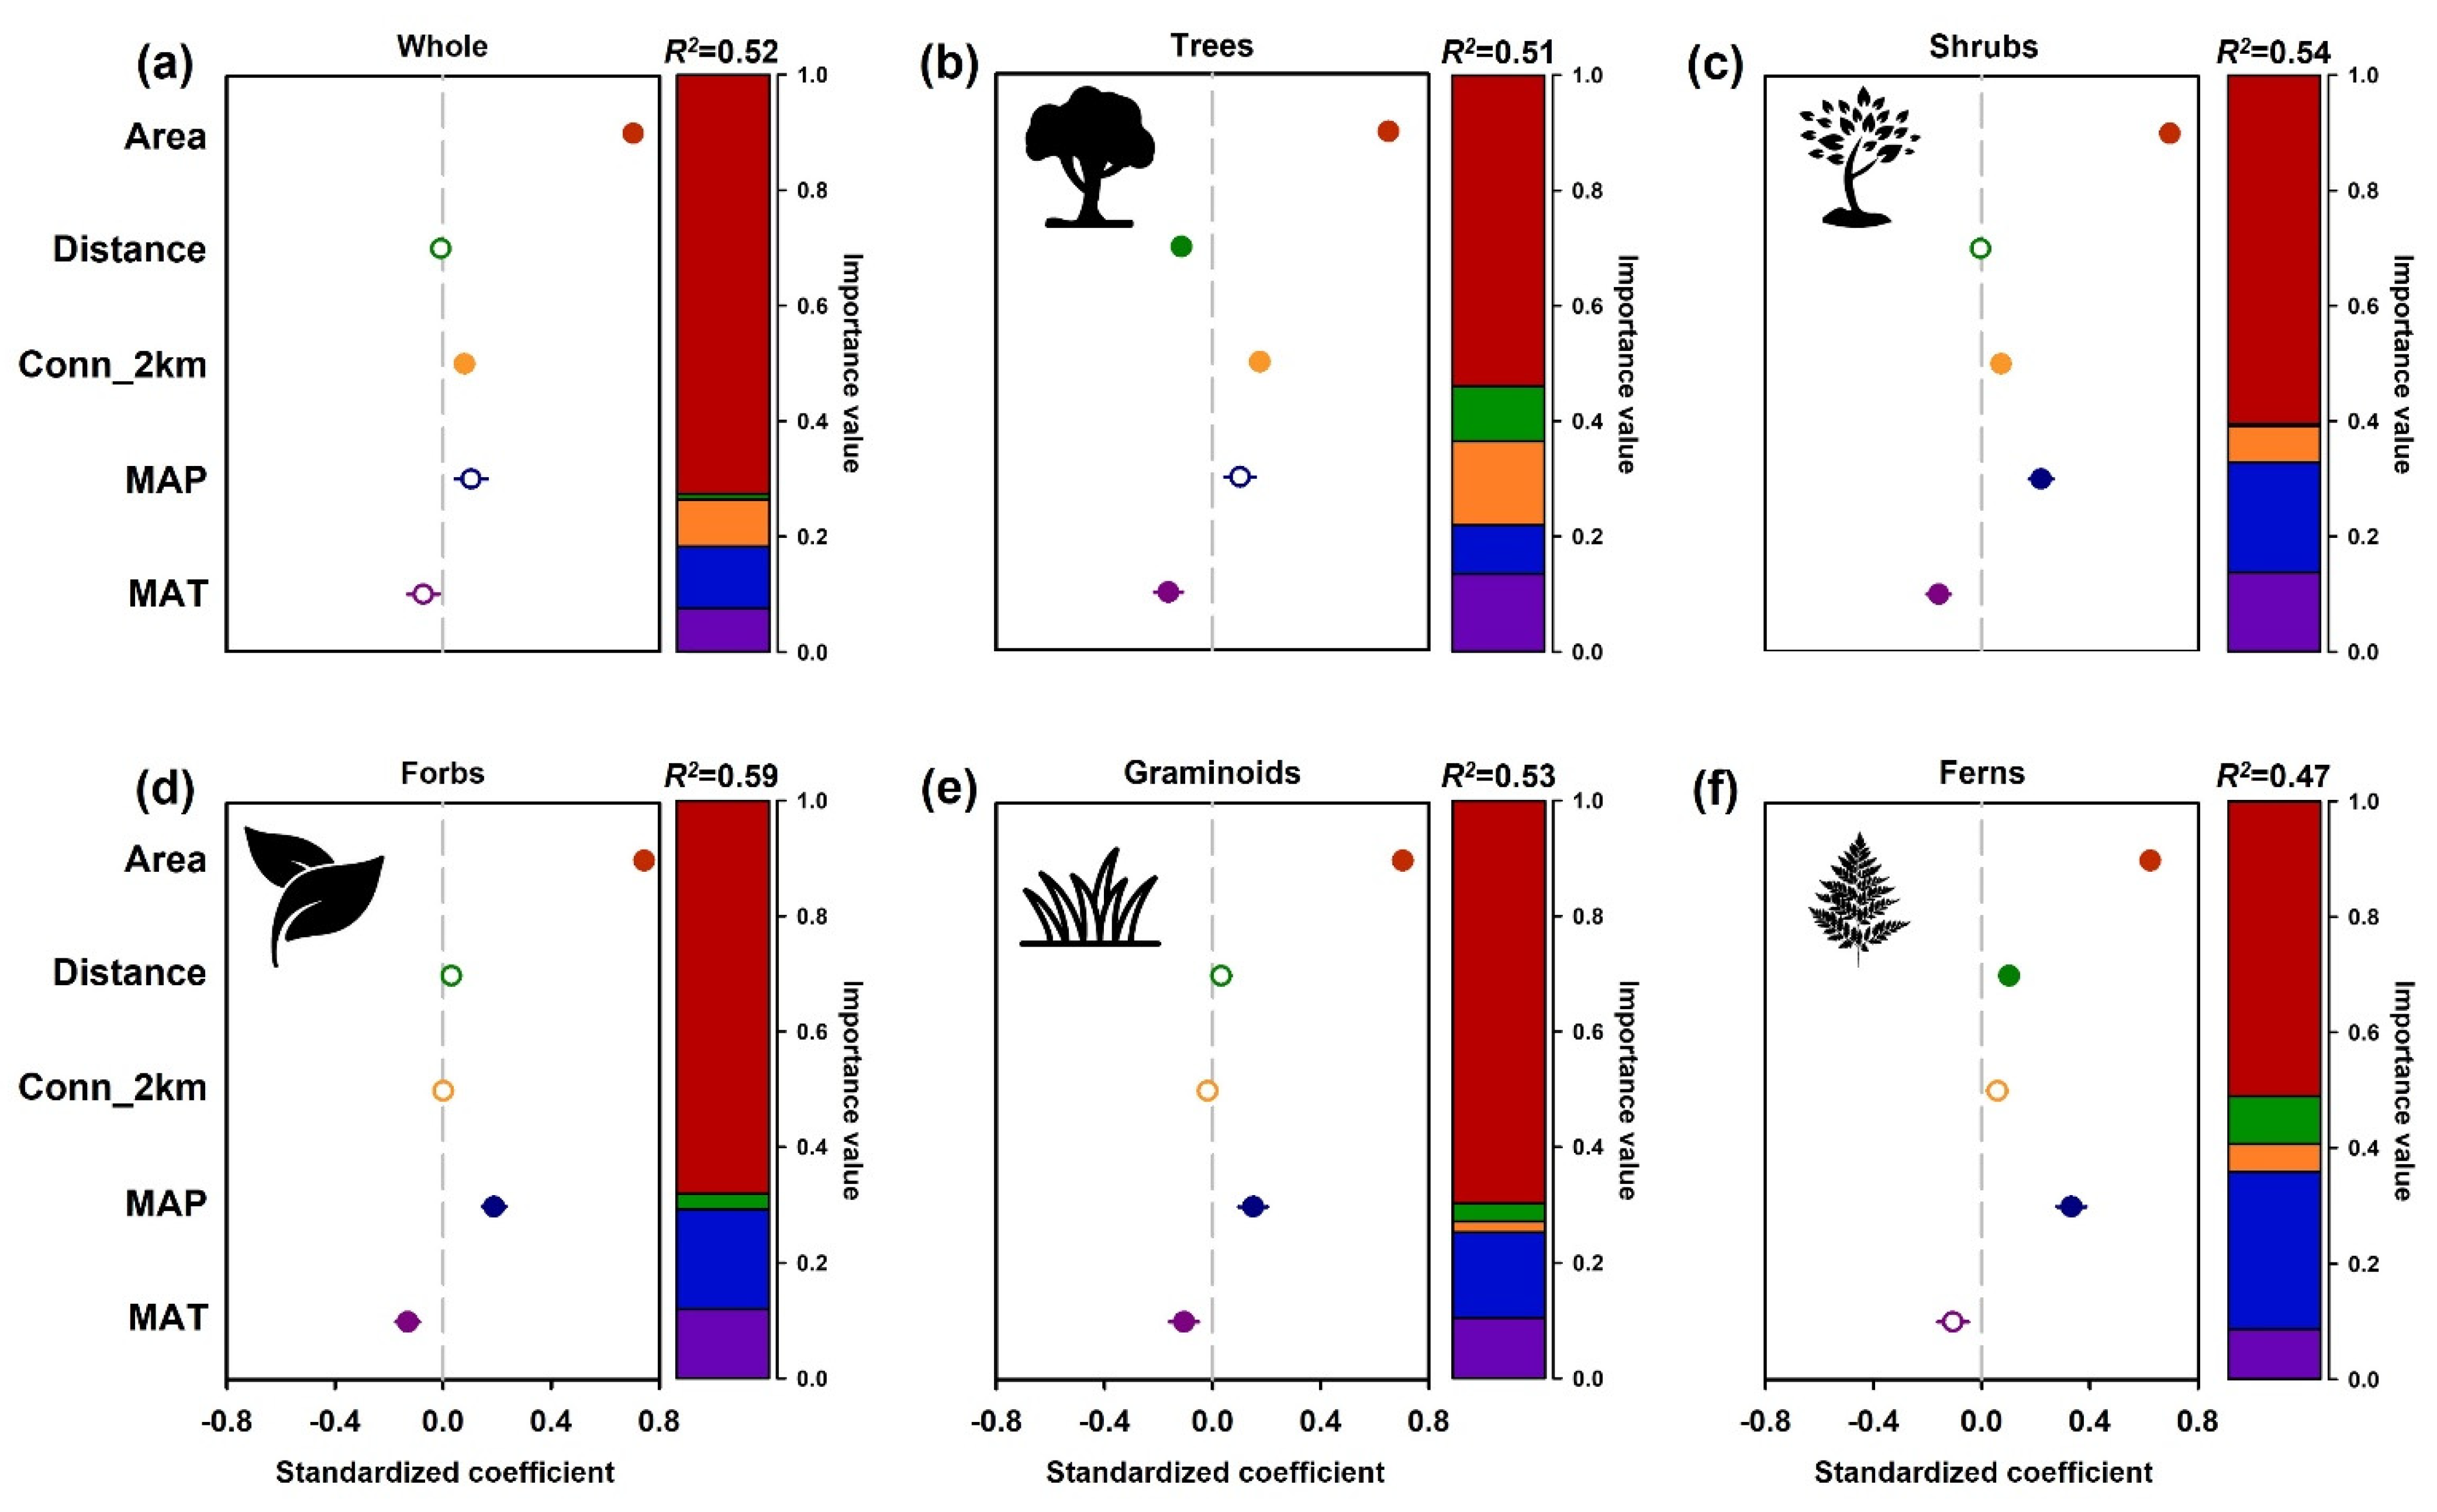
3.2. Species Richness Patterns of Plant Growth Forms with Environmental Variables in Overall Islands

In the overall islands, the species richness of all growth forms was strongly correlated with island area from simple OLS models (Figure 3 and Table S6). The distance from the mainland had a negative effect on the species richness of trees in the overall islands. Structural connectivity had a positive relationship with the species richness of trees and ferns. The MAT showed negative relationships in all growth forms except for ferns. The MAP, meanwhile, had a positive relationship with ferns, but insignificant relationships for the other growth forms. From the results of the model averaging approach, island area (positive effect) and structural connectivity (positive effect) had significant effects for whole plants (Figure 4 and Table S7). For tree species, island area (positive effect), distance from the mainland (negative effect), structural connectivity (positive effect), and MAT (negative effect) had significant effects. For shrubs, all factors except distance from the mainland were significant. For forbs and graminoids, the significant factors were island area (positive effect), MAP (positive effect), and MAT (negative effect). For ferns, island area (positive effect), distance from the mainland (negative effect), and MAP (positive effect) were significant.

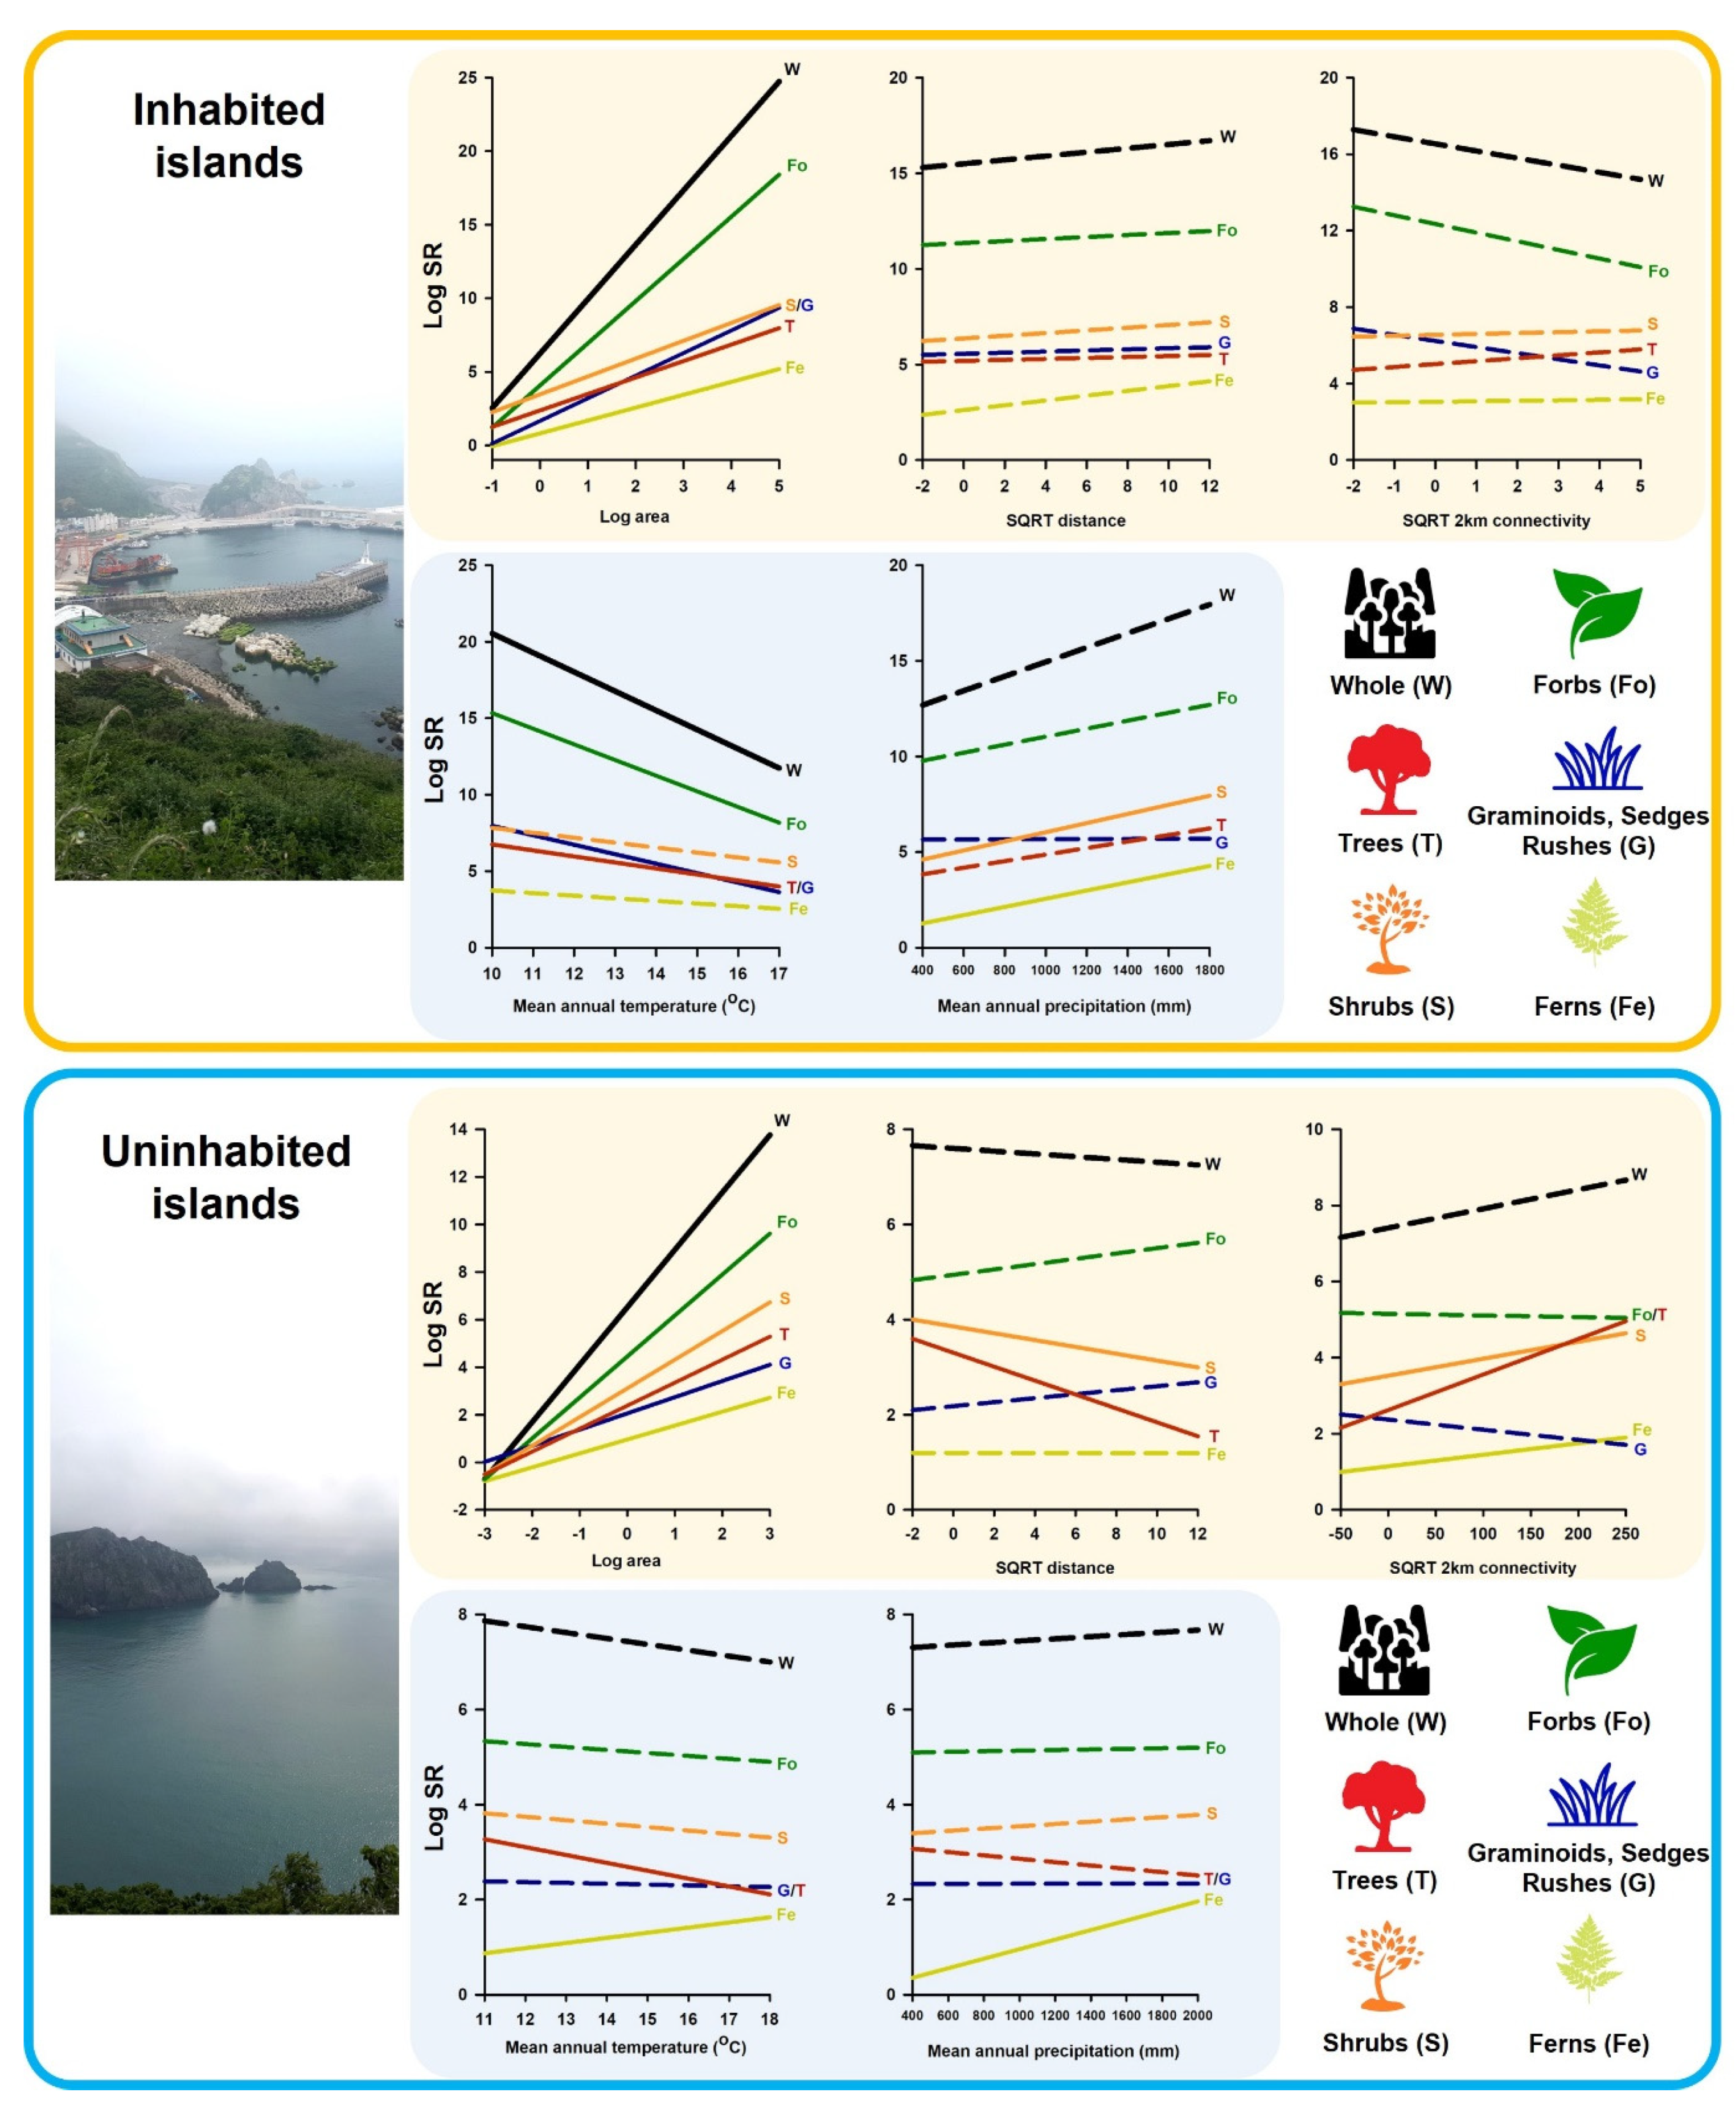
3.3. Species Richness Patterns of Plant Growth Forms with Environmental Variables between Inhabited and Uninhabited Islands

The simple OLS results revealed that on the inhabited islands, distance from the mainland and structural connectivity showed no relationships for all growth forms (Figure 5 and Table S8). The MAT showed a negative relationship in all growth forms except shrubs and ferns, whereas MAP showed no relationships in all growth forms apart from shrubs and ferns. In the results of the model averaging approach, island area (positive effect), MAP (positive effect), and MAT (negative effect) had significant effects for whole plants, trees, and forbs (Figure 6 and Table S9). For shrubs and ferns, island area (positive effect), distance from the mainland (positive effect), MAP (positive effect), and MAT (negative effect) had significant effects. Graminoids showed a significant positive relationship only with island area. On uninhabited islands, trees and shrubs showed negative relationships with the distance from the mainland (Figure 5 and Table S10). Structural connectivity had positive relationships with shrubs, trees, and ferns. The MAT showed negative and positive relationships with trees and ferns, respectively. In the results of the model averaging approach, MAP showed no relationships in all growth forms except ferns (Figure 7 and Table S11). Island area was positively correlated with species richness for whole plants, forbs, and graminoids. For shrubs and trees, island area (positive effect), distance from the mainland (negative effect), and structural connectivity (positive effect) were significant variables. Island area (positive effect) and MAP (positive effect) were important predictors for fern species.

4. Discussion

This study analyzed the effects of landscape and climate factors on the species richness of plant growth forms on 578 islands (86 inhabited and 492 uninhabited) along the western and southern coasts of South Korea. In order to overcome the limitations of previous studies, plants were divided into growth forms reflecting the functional characteristics of plant species—such as plant dispersal ability and ecological adaptation—rather than plant species themselves [20,36]. Moreover, most of the previous studies were conducted on uninhabited islands to exclude anthropogenic factors or by analyzing inhabited and uninhabited islands together. Therefore, comparative analyses between inhabited and uninhabited islands, where environmental conditions are clearly different, have been insufficient [22,37,38]. In the current study, we simultaneously compared and analyzed inhabited and uninhabited islands. In addition, we analyzed the effects of climate factors such as MAP and temperature as well as landscape factors including island area, distance from the mainland, and structural connectivity (which are often used in studies on TIB). We found that the predictors for species richness in the islands’ ecosystems were different depending on plant growth forms. We also found that the relative importance of environmental factors that control species richness differed between inhabited and uninhabited islands. We explain the different ecological mechanisms related to species richness patterns and the drivers between inhabited and uninhabited islands below.
We found differences in the relative importance of landscape factors that control the richness patterns of plant growth forms. The island area showed positive relationships with the species richness of all growth forms; this was the most important predictor in overall and uninhabited islands (Figure 3 and Figure 4). This is consistent with traditional TIB—that the larger the island area, the more species richness will be present on the island [2]. The positive effect of island area on species richness can be interpreted as follows: (1) according to the sampling effect hypothesis, a larger area can harbor more species because of their ability to support more individuals [39]; (2) equilibrium hypothesis predicts that as the island area increases, colonization such as species speciation and migration occurs more strongly than extinction [8]; and, finally, (3) it can be also explained as the habitat heterogeneity hypothesis that a larger area can contain more diverse habitats and therefore support more diverse species assemblages [40,41].
In TIB, distance from the mainland is also an important factor that controls species richness, along with island area. Consequently, it is known that species richness decreases with distance between an island and the mainland due to isolation from the species source [2]. However, in this study, distance from the mainland had different effects, depending on the growth pattern of plants; the effect and significance was much lower than the island area. This can be interpreted in two ways. First, most of the islands in the study are distributed close to the mainland (Table S3), indicating relatively strong accessibility and species dispersal possibility from the mainland to most of the islands. This means that, except for some extremely isolated islands, distance from the mainland may not be a limiting factor for species migration and dispersal in the islands used in the research. Second, several previous studies have suggested the stepping-stone effect because many islands in South Korea are clustered [42,43]. The stepping-stone effect refers to the effect of increasing connectivity caused by forming a point network between an island and the mainland [2]. This is known to increase the efficiency of species movement by creating a stopover point between the islands and the mainland as a species source [44]. Moreover, recent studies have shown that the effect of distance from the mainland on species richness is not always significant [43].
Structural connectivity is determined by the area of islands surrounding an island within a certain distance [9]. In other words, one could say that an island surrounded by more islands with a larger area has higher structural connectivity. In the current research, the effect on the structural connectivity controlling species richness was significantly different between woody (i.e., trees and shrubs) and herbaceous plants (i.e., forbs, graminoids, and ferns). In herbaceous plants, structural connectivity did not affect herbaceous plant richness, and the relative importance was much lower than the island area. However, structural connectivity has a positive effect on woody plants. This can be interpreted as a result of the difference in the functional characteristics between woody and herbaceous species. The distribution of plant populations is determined by seed dispersal and colonization ability [45]. That is, herbaceous plants have small seed dispersal ranges, which causes small-scale dispersal limitation, with colonies in a limited range [46]. As a result, herbaceous plants may not be affected by structural connectivity. Nevertheless, woody plants can have wider dispersal ranges than herbaceous plants. This is because the seeds or fruits of woody plants are used as food for animals with excellent mobility, such as bats, birds, and even fish [47,48]. Therefore, one can conclude that higher structural connectivity can lead to higher species richness in woody plants.
Climate features are one of the most important environmental factors in determining the distribution and diversity of plant species [49]. In this study in particular, climate factors as well as island area were found to be the most important factors in determining the species richness of inhabited islands (Figure 6). The fact that climate factors were more important than landscape factors on inhabited islands can be interpreted as a decrease in the relative importance of the landscape factor. In this research study, the mean area of the inhabited islands was 2249.96 ha, much larger than the uninhabited islands (a mean area of 6.56 ha). It can be interpreted that, over a certain area, species richness is controlled by other types of factors, such as climate factors or soil factors, rather than island area only [16]. Contrary to inhabited islands, the most important factor controlling species richness on uninhabited islands is island area (across all growth forms). This result can be attributed to the small area of uninhabited islands. In our study, the mean area of the uninhabited islands was 6.56 ha, which is much smaller than that of the inhabited islands (Figure S1 and Table S4). Accordingly, the sensitivity to species extinction and population decline on uninhabited islands is much higher than those of inhabited islands, which is expected to increase the importance of landscape factors compared to climate factors [50].
Landscape and climate factors were quantified and analyzed to determine the relative importance of environmental factors. This was performed in order to identify species richness among plant growth forms of an archipelago in South Korea. We used landscape factors related to island size and isolation, but did not include habitat heterogeneity. However, habitat heterogeneity is recognized as being one of the crucial landscape factors that affect species richness [51]. The habitat heterogeneity hypothesis implies that an increase in the number of habitats leads to an expansion of the available niche dimensionality, which in turn can lead to an increase in species diversity [40]. Therefore, further research needs to reflect factors relevant to habitat heterogeneity such as topography, soil physical and chemical properties, and land cover diversity [9,46]. In addition, the current study compared the relative importance of environmental factors to the species richness of each island group by dividing inhabited and uninhabited islands. The ecosystems of inhabited and uninhabited islands are vulnerable to extinction and a decline in species richness due to anthropogenic and natural disturbances [22]. As a result, it is essential to understand the effect of these disturbances on diversity patterns to conserve and manage island ecosystems [52,53]. Moreover, unfortunately, we could not accurately reflect the extent and magnitude of human impact between inhabited and uninhabited islands because there were no directly measurable data on the different levels of human impact. Therefore, further studies need to reflect the measurable human impacts on biodiversity [10].
In our study, we used species richness as a proxy for plant diversity. However, species richness has a clear limitation in that it cannot explain the evolutionary relationships between species in the community structure and the functional dimensions, which is the most essential element for the coexistence of species [15,54]. Consequently, species-centric approaches might not sufficiently explain the fundamental mechanisms related to evolutionary and functional differences in the plant communities of islands. Therefore, in order to better understand the community assembly processes of the island ecosystem in the future, the phylogenetic and functional diversity of island plant communities should be used together with various environmental factors (e.g., habitat heterogeneity) and the degree of disturbance (e.g., natural and anthropogenic impacts) [15,41].

5. Conclusions

Previous research on TIB has been limited to the species richness of whole or woody and herbaceous plants as target plant groups. This has been realized in order to use mainly landscape factors as predictors of biodiversity, and to deal with islands as being subject to an equal degree of disturbance—that is, simultaneously combining inhabited and uninhabited islands without considering anthropogenic effects. Uninhabited islands excluding anthropogenic effects could also be included [2]. In the present study, we divided plants into five growth forms and then comprehensively analyzed the relationship of species richness of each with the landscape (i.e., island area, distance from the mainland, and structural connectivity) and climate factors (i.e., MAT and MAP) in both inhabited and uninhabited islands. We found that (1) the island area has significant influences on the species richness of all growth forms, regardless of the island category; (2) the effects of isolation-related landscape factors (i.e., distance from the mainland and structural connectivity) depend on growth forms and the island category; (3) climate factors as well as landscape factors are important predictors of plant diversity in island ecosystems, and therefore, climate factors need to be considered in island ecosystem biodiversity research; and (4) the relative importance of landscape factors was higher for uninhabited islands, whereas climate factors were more important for inhabited islands. Consequently, we suggest that the management and conservation strategies of the island ecosystems should be applied differently among plant growth forms and between island categories.

Supplementary Materials

The following supporting information can be downloaded at: https://www.mdpi.com/article/10.3390/f13020218/s1, Supporting Tables: Table S1. List of plant species recorded on 578 islands, South Korea. Scientific names follow The Plant List (www.theplantlist.org, accessed on 12 December 2021). Abbreviations: GF, growth form; T, trees; S, shrubs; Fo, forbs; G, graminoids; Fe, ferns; i, island; I, inhabited island; U, uninhabited island. * Note: Table S1 was prepared in a different file (i.e., Excel file) with Table S2. The tables could not be included in this Supplementary Materials file due to the large file size. Table S2. The data set used in this study. Abbreviations: Area, island area; Distance, distance from mainland; Conn_500, connectivity 500 m; Conn_1000, connectivity 1000 m; Conn_2000, connectivity 2000 m; Conn_3000, connectivity 3000 m; Conn_4000, connectivity 4000 m; MAP, mean annual precipitation; MAT, mean annual temperature; SR, species richness; W, whole; T, trees; S, shrubs; Fo, forbs; G, graminoids; Fe, ferns; i, island; I, inhabited island; U, uninhabited island. * Note: Table S2 was prepared in a different file (i.e., Excel file) with Table S1. The tables could not be included in this Supplementary Materials file due to the large file size. Table S3. Summary statistics of all factors for 578 islands in this study. Abbreviations: Min, minimum; Max, maximum; SE, standard error; Connectivity, structural connectivity. Table S4. Summary statistics of all factors for 86 inhabited islands and 492 uninhabited islands investigated in this study. Abbreviations: Min, minimum; Max, maximum; SE, standard error; Connectivity, structural connectivity. Table S5. Pearson product–moment correlation coefficient for the seven landscape and two climate factors. Significance levels are * p < 0.05, ** p < 0.01, and *** p < 0.001. Abbreviations: Distance, distance from mainland; Conn, structural connectivity; MAT, mean annual temperature; MAP, mean annual precipitation. Table S6. Summary of the bivariate relationships of three landscape and two climate factors with species richness of plant growth forms in overall islands, based on simple OLS regression models. Significant factors (p < 0.05) are shown in bold. Abbreviations for the factors are shown in Table S5. Table S7. Summary of the bivariate relationships of three landscape and two climate factors on species richness of plant growth forms in overall islands, based on model-averaging approach in the multi-model inference test. Significant relationships are shown in bold (p < 0.05). Abbreviations for the factors are shown in Table S5. Table S8. Summary of the bivariate relationships of three landscape and two climate factors with species richness of plant growth forms on inhabited islands, based on simple ordinary least-squares regression models. Significant factors (p < 0.05) are shown in bold. Abbreviations for the factors are shown in Table S5. Table S9. Summary of the bivariate relationships of three landscape and two climate factors on species richness of plant growth forms on inhabited islands, based on model-averaging approach in the multi-model inference test. Significant relationships are shown in bold (p < 0.05). Abbreviations for the factors are shown in Table S5. Table S10. Summary of the bivariate relationships of three landscape and two climate factors with species richness of plant growth forms on uninhabited islands, based on simple ordinary least-squares regression models. Significant factors (p < 0.05) are shown in bold. Abbreviations for the factors are shown in Table S5. Table S11. Summary of the bivariate relationships of three landscape and two climate factors on the plant growth forms on uninhabited islands, based on model-averaging approach in the multi-model inference test. Significant relationships are shown in bold (p < 0.05). Abbreviations for the factors are shown in Table S5. Supporting Figures: Figure S1. Boxplots for the environmental factors of (a) island area, (b) distance from mainland, (c) structural connectivity 2000 m, (d) mean annual temperature, and (e) mean annual precipitation for 578 overall, 86 inhabited, and 492 uninhabited islands. Abbreviations: Distance, distance from mainland; Conn, structural connectivity; Log, log transformation; SQRT, square root transformation. Figure S2. Boxplots of (a) whole, (b) shrubs, (c) trees, (d) forbs, (e) graminoids, and (f) ferns species richness for 578 overall, 86 inhabited, and 492 uninhabited islands. Abbreviations: SR, species richness. Figure S3. The number of species for woody (trees, shrubs) and herbaceous (ferns, forbs, graminoids) plants recorded on inhabited and uninhabited islands. The graminoids were defined as grasses, sedges, and rushes.

Author Contributions

Conceptualization, C.-B.L., M.-K.L. and H.-S.L.; formal analysis, M.-K.L., H.-I.L., S.-W.L. and Y.-J.L.; project administration, C.-B.L. and H.-S.L.; supervision, C.-B.L.; writing—original draft, M.-K.L.; writing—review and editing, C.-B.L. All authors have read and agreed to the published version of the manuscript.

Funding

This study was conducted with the support of the R&D program for Forest Science Technology (project no. 2019150C10-2123-0301 and project no. 2021346A00-2123-CD01) provided by Korea Forest Service (Korea Forestry Promotion Institute).

Data Availability Statement

The data used in this study are included in Tables S1 and S2.

Acknowledgments

We would like to acknowledge Eun-Sol Park and Yu-Jin Kim who helped us during the data analysis in this study.

Conflicts of Interest

The authors declare no conflict of interest.

References

  1. Lee, S.D. Studies of Avian species in the islands of Korea based on the theory of island biogeography. Environ. Impact Assess. 2010, 19, 547–552. [Google Scholar]
  2. MacArthur, R.H.; Wilson, E.O. The Theory of Island Biogeography; Princeton University Press: Princeton, NJ, USA, 1967. [Google Scholar]
  3. Whittaker, R.J.; Fernández-Palacios, J.M. Island Biogeography: Ecology, Evolution, and Conservation; Oxford University Press: Oxford, UK, 2007. [Google Scholar]
  4. Dale, S. Islands in the forest: Effects of patch size and isolation on farmland bird species richness and community composition of farmland patches in forest landscapes. Landsc. Ecol. 2019, 34, 2823–2836. [Google Scholar] [CrossRef]
  5. Wallace, A.R. The Malay Archipelago: The Land of the Orang-Utan and the Bird of Paradise; a Narrative of Travel, with Studies of Man and Nature; Courier Corporation: North Chelmsford, MA, USA, 1962. [Google Scholar]
  6. Whittaker, R.H.; Niering, W.A. Vegetation of the Santa Catalina Mountains, Arizona. V. Biomass, production, and diversity along the elevation gradient. Ecology 1975, 56, 771–790. [Google Scholar] [CrossRef] [Green Version]
  7. Connor, E.F.; McCoy, E.D. The statistics and biology of the species-area relationship. Am. Nat. 1979, 113, 791–833. [Google Scholar] [CrossRef]
  8. Lomolino, M.V. Ecology’s most general, yet protean pattern: The species-area relationship. J. Biogeogr. 2000, 27, 17–26. [Google Scholar] [CrossRef]
  9. Aggemyr, E.; Auffret, A.G.; Jädergård, L.; Cousins, S.A. Species richness and composition differ in response to landscape and biogeography. Landsc. Ecol. 2018, 33, 2273–2284. [Google Scholar] [CrossRef] [Green Version]
  10. Kim, H.H.; Lee, C.B. On the relative importance of landscape variables to plant diversity and phylogenetic community structure on uninhabited islands, South Korea. Landsc. Ecol. 2021, 36, 209–221. [Google Scholar] [CrossRef]
  11. Lindgren, J.P.; Cousins, S.A. Island biogeography theory outweighs habitat amount hypothesis in predicting plant species richness in small grassland remnants. Landsc. Ecol. 2017, 32, 1895–1906. [Google Scholar] [CrossRef]
  12. Schrader, J.; Moeljono, S.; Keppel, G.; Kreft, H. Plants on small islands revisited: The effects of spatial scale and habitat quality on the species–area relationship. Ecography 2019, 42, 1405–1414. [Google Scholar] [CrossRef] [Green Version]
  13. De Kort, H.; Prunier, J.G.; Ducatez, S.; Honnay, O.; Baguette, M.; Stevens, V.M.; Blanchet, S. Life history, climate and biogeography interactively affect worldwide genetic diversity of plant and animal populations. Nat. Commun. 2021, 12, 516. [Google Scholar] [CrossRef]
  14. Ottaviani, G.; Keppel, G.; Götzenberger, L.; Harrison, S.; Opedal, Ø.H.; Conti, L.; Liancourt, P.; Klimešová, J.; Silveira, F.A.; Jiménez-Alfaro, B. Linking plant functional ecology to island biogeography. Trends Plant Sci. 2020, 25, 329–339. [Google Scholar] [CrossRef]
  15. Ross, S.R.J.; Friedman, N.R.; Janicki, J.; Economo, E.P. A test of trophic and functional island biogeography theory with the avifauna of a continental archipelago. J. Anim. Ecol. 2019, 88, 1392–1405. [Google Scholar] [CrossRef]
  16. Li, S.P.; Wang, P.; Chen, Y.; Wilson, M.C.; Yang, X.; Ma, C.; Lu, J.; Chen, X.Y.; Wu, J.; Shu, W.S. Island biogeography of soil bacteria and fungi: Similar patterns, but different mechanisms. ISME J. 2020, 14, 1886–1896. [Google Scholar] [CrossRef] [PubMed]
  17. Negoita, L.; Fridley, J.D.; Lomolino, M.V.; Mittelhauser, G.; Craine, J.M.; Weiher, E. Isolation-driven functional assembly of plant communities on islands. Ecography 2016, 39, 1066–1077. [Google Scholar] [CrossRef]
  18. Auffret, A.G.; Aggemyr, E.; Plue, J.; Cousins, S.A. Spatial scale and specialization affect how biogeography and functional traits predict long-term patterns of community turnover. Funct. Ecol. 2017, 31, 436–443. [Google Scholar] [CrossRef]
  19. Ottaviani, G.; Keppel, G.; Marcantonio, M.; Mucina, L.; Wardell-Johnson, G. Woody species in resource-rich microrefugia of granite outcrops display unique functional signatures. Austral. Ecol. 2019, 44, 575–580. [Google Scholar] [CrossRef]
  20. Wullschleger, S.D.; Epstein, H.E.; Box, E.O.; Euskirchen, E.S.; Goswami, S.; Iversen, C.M.; Kattge, J.; Norby, R.J.; van Bodegom, P.M.; Xu, X. Plant functional types in Earth system models: Past experiences and future directions for application of dynamic vegetation models in high-latitude ecosystems. Ann. Bot. 2014, 114, 1–16. [Google Scholar] [CrossRef] [Green Version]
  21. Šímová, I.; Violle, C.; Svenning, J.C.; Kattge, J.; Engemann, K.; Sandel, B.; Peet, R.K.; Wiser, S.K.; Blonder, B.; McGill, B.J. Spatial patterns and climate relationships of major plant traits in the New World differ between woody and herbaceous species. J. Biogeogr. 2018, 45, 895–916. [Google Scholar] [CrossRef] [Green Version]
  22. Chi, Y.; Sun, J.; Fu, Z.; Xie, Z. Spatial pattern of plant diversity in a group of uninhabited islands from the perspectives of island and site scales. Sci. Total Environ. 2019, 664, 334–346. [Google Scholar] [CrossRef]
  23. Russell, J.C.; Abrahão, C.R.; Silva, J.C.; Dias, R.A. Management of cats and rodents on inhabited islands: An overview and case study of Fernando de Noronha, Brazil. Perspect. Ecol. Conserv. 2018, 16, 193–200. [Google Scholar] [CrossRef]
  24. Nogué, S.; de Nascimento, L.; Froyd, C.A.; Wilmshurst, J.M.; de Boer, E.J.; Coffey, E.E.; Whittaker, R.J.; Fernández-Palacios, J.M.; Willis, K.J. Island biodiversity conservation needs palaeoecology. Nat. Ecol. Evol. 2017, 1, 0181. [Google Scholar] [CrossRef] [PubMed]
  25. Cho, Y.H.; Kim, Y.J.; Lim, H.M.; Han, Y.G.; Choi, M.J.; Nam, S.H. A faunistic study of insects of uninhabited islands in the Docho-myeon, Sinan-gun, Jeollanam-do, Korea. Korean J. Environ. Ecol. 2011, 25, 673–684. [Google Scholar]
  26. Jung, S.H.; Cho, Y.C. Redefining floristic zones in the Korean Peninsula using high-resolution georeferenced specimen data and self-organizing maps. Ecol. Evol. 2020, 10, 11549–11564. [Google Scholar] [CrossRef] [PubMed]
  27. Lee, H.J.; Cho, K.M.; Hong, S.K.; Kim, J.E.; Kim, K.W.; Lee, K.A.; Moon, K.O. Management plan for UNESCO Shinan Dadohae Biosphere Reserve (SDBR), Republic of Korea: Integrative perspective on ecosystem and human resources. J. Ecol. Environ. 2010, 33, 95–103. [Google Scholar] [CrossRef] [Green Version]
  28. Kim, E.M.; Kang, C.W.; Jeon, C.H.; Oh, M.R. A Study on the Distribution of Fairy Pitta (Pitta nympha) and the Forest Type on Inhabited Islands in the Southern Coast of Jeollanamdo Province, Republic of Korea. J. Korean Isl. 2016, 28, 259–271. [Google Scholar]
  29. National Institute of Environmental Research. National Natural Environment Survey of Uninhabited Islands: Yeosu II.; National Institute of Environmental Research: Incheon, Korea, 2003. [Google Scholar]
  30. Lee, C.B.; Kim, H.H. Elevational patterns of plant species richness and relative importance of climatic and topographic factors on the mt. seorak, South Korea. J. Agricult. Life Sci. 2018, 52, 702. [Google Scholar] [CrossRef]
  31. Spanowicz, A.G.; Jaeger, J.A. Measuring landscape connectivity: On the importance of within-patch connectivity. Landsc. Ecol. 2019, 34, 2261–2278. [Google Scholar] [CrossRef]
  32. Yun, J.I. Agroclimatic maps augmented by a GIS technology. Korean J. Agric. For. Meteorol. 2010, 12, 63–73. [Google Scholar] [CrossRef] [Green Version]
  33. Bumham, K.P.; Anderson, D.R. Model Selection and Multimodel Inference: A Practical Information-Theoretic Approach; Springer: New York, NY, USA, 2002. [Google Scholar]
  34. Symonds, M.R.; Moussalli, A. A brief guide to model selection, multimodel inference and model averaging in behavioural ecology using Akaike’s information criterion. Behav. Ecol. Sociobiol. 2011, 65, 13–21. [Google Scholar] [CrossRef]
  35. Graham, M.H. Confronting multicollinearity in ecological multiple regression. Ecology 2003, 84, 2809–2815. [Google Scholar] [CrossRef] [Green Version]
  36. Mason, N.W.; Mouillot, D.; Lee, W.G.; Wilson, J.B. Functional richness, functional evenness and functional divergence: The primary components of functional diversity. Oikos 2005, 111, 112–118. [Google Scholar] [CrossRef]
  37. Schrader, J.; König, C.; Triantis, K.A.; Trigas, P.; Kreft, H.; Weigelt, P. Species–area relationships on small islands differ among plant growth forms. Global Ecol. Biogeogr. 2020, 29, 814–829. [Google Scholar] [CrossRef] [Green Version]
  38. Lee, M.K.; Chun, J.H.; Lee, C.B. Prediction of distribution changes of Carpinus laxiflora and C. tschonoskii based on climate change scenarios using MaxEnt model. Korean J. Agric. For. Meteorol. 2021, 23, 55–67. [Google Scholar]
  39. Chase, J.M.; Knight, T.M. Scale-dependent effect sizes of ecological drivers on biodiversity: Why standardised sampling is not enough. Ecol. Lett. 2013, 16, 17–26. [Google Scholar] [CrossRef]
  40. Marx, H.E.; Dentant, C.; Renaud, J.; Delunel, R.; Tank, D.C.; Lavergne, S. Riders in the sky (islands): Using a mega-phylogenetic approach to understand plant species distribution and coexistence at the altitudinal limits of angiosperm plant life. J. Biogeogr. 2017, 44, 2618–2630. [Google Scholar] [CrossRef]
  41. Portillo, J.T.d.M.; Ouchi-Melo, L.S.; Crivellari, L.B.; de Oliveira, T.A.L.; Sawaya, R.J.; Duarte, L.d.S. Area and distance from mainland affect in different ways richness and phylogenetic diversity of snakes in Atlantic Forest coastal islands. Ecol. Evol. 2019, 9, 3909–3917. [Google Scholar] [CrossRef]
  42. An, J.S.; Choi, S.W. Study on the pattern and ecological variables of butterfly species diversity on 19 uninhabited islands around Imja-myeon, Shinan-gun, Jeonnam, Korea. Korean J. Environ. Biol. 2012, 30, 185–192. [Google Scholar]
  43. Choi, S.W.; An, J.S.; Yang, H.S. Effect of island geography on plant species on uninhabited islands in southeastern South Korea. J. Ecol. Environ. 2015, 38, 451–459. [Google Scholar] [CrossRef] [Green Version]
  44. Baum, K.A.; Haynes, K.J.; Dillemuth, F.P.; Cronin, J.T. The matrix enhances the effectiveness of corridors and stepping stones. Ecology 2004, 85, 2671–2676. [Google Scholar] [CrossRef]
  45. Auffret, A.G.; Rico, Y.; Bullock, J.M.; Hooftman, D.A.; Pakeman, R.J.; Soons, M.B.; Suárez-Esteban, A.; Traveset, A.; Wagner, H.H.; Cousins, S.A. Plant functional connectivity—integrating landscape structure and effective dispersal. J. Ecol. 2017, 105, 1648–1656. [Google Scholar] [CrossRef]
  46. Lee, C.B.; Chun, J.H.; Ahn, H.H. Elevational patterns of plant richness and their drivers on an Asian mountain. Nord. J. Bot. 2014, 32, 347–357. [Google Scholar] [CrossRef]
  47. Levey, D.J.; Moermond, T.C.; Denslow, J.S. Frugivory: An overview. In La Selva: Ecology and Natural History of a Neotropical Rain Forest; University of Chicago Press: Chicago, IL, USA, 1994; pp. 282–294. [Google Scholar]
  48. Muller-Landau, H.C.; Hardesty, D. Seed dispersal of woody plants in tropical forests: Concepts, examples and future directions. In Biotic Interactions in the Tropics: Their Role in the Maintenance of Species Diversity; Cambridge University Press: Cambridge, UK, 2005. [Google Scholar]
  49. Harrison, S.; Spasojevic, M.J.; Li, D. Climate and plant community diversity in space and time. Proc. Nat. Acad. Sci. 2020, 117, 4464–4470. [Google Scholar] [CrossRef] [PubMed]
  50. Vranckx, G.; Jacquemyn, H.; Muys, B.; Honnay, O. Meta-analysis of susceptibility of woody plants to loss of genetic diversity through habitat fragmentation. Conserv. Biol. 2012, 26, 228–237. [Google Scholar] [CrossRef] [PubMed]
  51. MacArthur, R.H.; MacArthur, J.W. On bird species diversity. Ecology 1961, 42, 594–598. [Google Scholar] [CrossRef]
  52. Chi, Y.; Shi, H.; Wang, X.; Li, J.; Feng, A. The spatial distribution and impact factors of net primary productivity in island ecosystem of five Southern Islands of Miaodao archipelago. Acta Ecol. Sin. 2015, 35, 8094–8106. [Google Scholar]
  53. Chen, S.; Wang, W.; Xu, W.; Wang, Y.; Wan, H.; Chen, D.; Tang, Z.; Tang, X.; Zhou, G.; Xie, Z. Plant diversity enhances productivity and soil carbon storage. Proc. Nat. Acad. Sci. 2018, 115, 4027–4032. [Google Scholar] [CrossRef] [Green Version]
  54. Chun, J.H.; Lee, C.B. Temporal changes in species, phylogenetic, and functional diversity of temperate tree communities: Insights from assembly patterns. Front. Plant Sci. 2019, 10, 294. [Google Scholar] [CrossRef]
Figure 1. The location of the study islands on the western, southern, and Jeju Island seas, South Korea.
Forests 13 00218 g001
Figure 2. The number of species for woody (trees, shrubs) and herbaceous (ferns, forbs, graminoids) plants recorded on 578 islands. The graminoids were defined as grasses, sedges, and rushes.
Forests 13 00218 g002
Figure 3. Bivariate relationships between plant growth forms and environmental factors in the overall islands combining inhabited and uninhabited islands, South Korea. Solid and dashed lines represent significant and non-significant effects, respectively. The slopes of lines indicate the strength of correlation. Abbreviations: SR—species richness, area—island area, distance—distance from the mainland, 2 km connectivity—structural connectivity 2000 m, MAT—mean annual temperature, MAP—mean annual precipitation, log—log transformation, SQRT—square root transformation.
Forests 13 00218 g003
Figure 4. Standardized parameter estimates represent the effects size (circle) with standard error (bar) of five environmental factors for the species richness of (a) whole, (b) trees, (c) shrubs, (d) forbs, (e) graminoids (sedges, grades, and rushes), and (f) ferns in overall islands. The closed and open circles indicate significant and non-significant relationships between species richness and environmental factors, respectively. The relative importance of each factor was calculated as the ratio between the parameter estimate of the factor and the sum of all parameter estimates and then described as a percentage. In the left and right subgraphs of a graph, the same color represents the same variable. Abbreviations for the factors are shown in Figure 3.
Forests 13 00218 g004
Figure 5. Bivariate relationships between plant growth forms and environmental factors on the inhabited and uninhabited islands, South Korea. Solid and dashed lines represent significant and non-significant effects, respectively. Abbreviations for the factors are shown in Figure 3.
Forests 13 00218 g005
Figure 6. Standardized parameter estimates represent the effects size (circle) and standard error (bar) of five environmental factors for (a) whole, (b) trees, (c) shrubs, (d) forbs, (e) graminoids (sedges, grades, and rushes), and (f) ferns species richness on inhabited islands, South Korea. The closed and open circles indicate significant and non-significant relationships between species richness and environmental factors, respectively. The relative importance of each factor was calculated as the ratio between the parameter estimate of the factor and the sum of all parameter estimates and then described as a percentage. In the left and right subgraphs of a graph, the same color represents the same variable. Abbreviations for the factors are shown in Figure 3.
Forests 13 00218 g006
Figure 7. Standardized parameter estimates represent the effects size (circle) and standard error (bar) of five environmental factors for (a) whole, (b) trees, (c) shrubs, (d) forbs, (e) graminoids (sedges, grades, and rushes), and (f) ferns species richness on uninhabited islands, South Korea. The closed and open circles indicate significant and non-significant relationships between species richness and environmental factors, respectively. The relative importance of each factor was calculated as the ratio between the parameter estimate of the factor and the sum of all parameter estimates and then described as a percentage. In the left and right subgraphs of a graph, the same color represents the same variable. Abbreviations for the factors are shown in Figure 3.
Forests 13 00218 g007
Publisher’s Note: MDPI stays neutral with regard to jurisdictional claims in published maps and institutional affiliations.

