Abstract
In autumn 2021, the largest volcanic eruption on the island of La Palma in historic records took place. The Canary Islands are of volcanic origin and eruptions have always constituted part of their natural disturbance regime. Until recently, their impacts could not be directly observed and studied. Influence of the emission of phytotoxic gases on biodiversity and ecosystem dynamics was hitherto unknown. The recent eruption is still being intensely monitored. We used Sentinel-2 remote sensing data to analyze the spatial extent and intensity of the impact related to sulfuric emissions, aiming to understand the damage patterns in Canary pine forest. The emissions damaged 10% of that forest and affected 5.3% of the Natura 2000 protected areas. We concluded that this is largely due to the toxic effects of the enormous emissions of SO2. We found a clear correlation between the change in the normalized difference vegetation index (NDVI) and distance from the eruption. This pattern was weakly anisotropic, with stronger damage in southern directions. Counteracting effects, such as ash deposition, were largely excluded by combining NDVI change detection with tree cover density. We expect that vegetation damage will be transient. P. canariensis can resprout after forest fires, where most leaves are lost. Consequently, our assessment can serve as a reference for future ecosystem regeneration.
1. Introduction
Oceanic islands generally receive great attention in terms of nature conservation. Threats to their ecosystems are mostly linked to human impacts, climate change, and invasive introduced species [1,2]. Natural impacts such as volcanic eruptions, landslides, or earthquakes, are known to be important, often resulting in compound disturbances including cascading effects [3], but are widely ignored due to their low frequency and mainly for the fact that they can rarely be monitored directly.
The legacy of volcanic activity has made the Canary Islands an iconic place for volcanology and geology. The term “caldera” (cauldron), for instance, dates back to the description of La Palma and the “Caldera de Taburiente” by Leopold von Buch in 1825 [4], even though he did not correctly understand the local processes. The archipelago has been shaped for more than 20 million years (Ma) by volcanic eruptions. Soil formation, nutrient availability, aquifers and groundwater formation, and surface structures are directly linked to these events and to the duration of weathering processes after volcanic activity ceased. However, transient geochemical processes in the past, such as sulfuric emissions and their historic impact, cannot be traced backwards. Additionally, the linkages between geological processes and ecosystems are often restricted to elevation [5,6,7] or to the age of historic lava flows [8].
The southern part of the island of La Palma was the arena for a series of volcanic eruptions in historic time periods, with the latest ones in 1949 and 1971. Most of these eruptions and lava flows were on the western slope of the Cumbre Vieja mountain ridge, which is historically the most active volcano on the Canary Islands (eight eruptions between 1500 and 2020) [9]. This 2021 eruption was notably the largest in the historic record in terms of area directly affected by lava flows and the longest in duration. Volcanic unrest began in 2017, with alternating periods of calm and unrest [10,11]. Volcanic unrest increased in magnitude and severity only 8 days before the eruption [12]. Occurring at a location formerly called “Hoya de Tajogaite”, it produced huge amounts of lava (covering 1241 ha) and ash (covering 65 km²). Settlements (2988 buildings) and roads (92.1 km) disappeared under the eruptive materials [13]. Natural and seminatural vegetation, such as pine forest, succulent shrubs, palm groves and coastal vegetation were wiped out. However, the negative impact ranges far beyond the area now directly covered by new volcanic rock. The area affected by deposition of large amounts of volcanic ash (tephra and lapilli) is even larger, but not clearly delineated.
The effects of volcanic gases were the most severe and extensive. Besides CO2, substantial amounts of SO2 were released (Figure 1). SO2 reacts in the atmosphere with water vapor and oxygen to form a toxic haze called “vog” with dispersed sulfuric acid and sulfate aerosols. The effect of SO2 has been extensively researched, mostly in the context of anthropogenic industrial pollution [14,15,16], as it has a major influence on the global climate [17]. Effects on plants are complex, as they occur at both an individual and community scale [18], and can act as a general toxin on several levels of plant functioning [19]. While low doses of SO2 may benefit plants due to its role as an essential nutrient, higher doses can cause extensive damage. SO2 uptake can hinder the ability of plants to close their stomata, leading to water loss [19]. SO2 also hinders other plant processes, such as respiration, enzyme activity, and protein synthesis [18], affecting the uptake of CO2 during photosynthesis [20]. Overall, high SO2 concentrations can lead to both acute injury of plant parts and chronic injuries, such as chlorosis [19]. Acute damage to pine trees is often visible as brown necrosis, clearly separated from the healthy part of the needles [21]. Both intensities of damage often lead to permanent defoliation [21,22]. In addition to the direct, phototoxic effects of sulfur deposition, there are also indirect effects on forests, such as soil acidification [23,24], water contamination [25], increased availability of heavy metals, and damage to mycorrhizal roots [26].
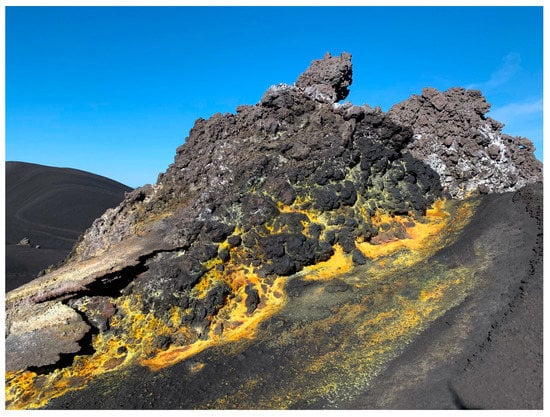
Figure 1.
Solfatar elementary sulfur deposits close to the volcanic cone. (Photo: Jorge Parra).
Volcanic eruptions contribute significantly to global SO2 emissions. While they account for 7% of global sulfur, they are the source of 18% of sulfur in the atmospheric column [27]. The eruption of Pinatubo in 1991 reached the stratosphere [28], allowing the long-range spread of aerosols. Volcanic emissions from Africa have been measured above the Amazon rain forest [29], and SO2 from southern Chile reached South Africa [30]. However, due to the mix of anthropogenic, biotic, and volcanic sulfur in the atmosphere, to our knowledge there are few studies on the exact impact of volcanic SO2 on forests. The same is true for persistent volcanic degassing [31].
The spread of SO2 from all sources can be monitored by satellite instruments, such as TROPOMI, which is onboard Sentinel-5P (European Earth Observation program Copernicus) [32]. The TROPOMI measurements indicated total emissions of SO2 assessed to an amount of approximately 1 Tg of SO2 [33]. This ranks the eruption within the top 50 SO2 emissions since satellite measurements yielded quantitative values (1978).
In this study, we scrutinize and trace the impact of sulfuric gases on the unique Canary pine forest. We hypothesize that the huge amount of emitted sulfuric compounds would be reflected in chlorotic changes to the pine canopy and that such impacts may be detected from Earth observations. We furthermore predicted that the predominant wind directions during the individual days of volcanic activity will explain the spatial pattern of vegetation damage related to volcanic gases. As gases are rapidly distributed in different layers of the atmosphere depending on the intensity of volcanic activity, it is evident that the recorded emissions cannot be directly translated into effects on the ground, but rather serve as a rough orientation. However, the amount of emitted sulfur is so high that an influence on terrestrial ecosystems is likely to occur.
2. Study Area
The island of La Palma is one of the westernmost islands of the Canary archipelago (Figure 2), with an area of 708 km2. Its highest elevation of 2426 m a.s.l. is reached at Roque de los Muchachos. The island is subdivided into an older part with higher elevation in the north, and a younger part in the south. In the northern half of the island, volcanic activity stopped hundreds of thousands of years ago. However, the southern half of the island has continued to be active until today. A total of eight eruptions have taken place in historic times and more than 80 volcanic cones have been perfectly identified. Here, the current volcanic activity also took place. The volcanic eruption on the western slope of Cumbre Vieja (at a location called Hoya de Tajogaite or Cabeza de Vaca) on La Palma began on 19 September and lasted until 13 December 2021. With this duration, the eruption became the longest on this island, based on historical chronicles dating back to the 15th century.
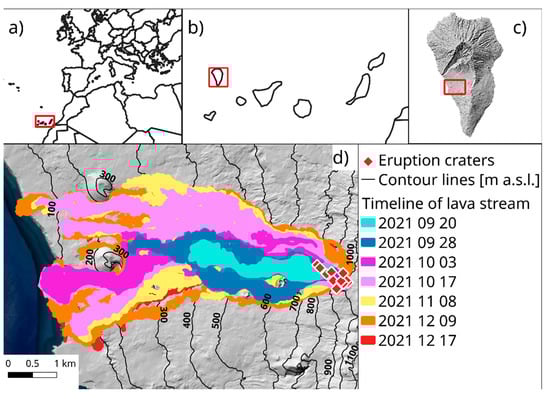
Figure 2.
Lava stream resulting from the volcanic eruptions on the island of La Palma, Spain. Location of (a) the Canary Islands, (b) the island of La Palma, (c) location of the eruption and lava flows on the western flank of Cumbre Vieja, (d) extent and sequence of lava flows between 19 September and 14 December 2021. Data source for the lava stream is the grading products created by the Copernicus Emergency Management System. The background map in (c,d) is a hillshade created from a 2 m-resolution digital elevation model provided by the Cabildo Insular de La Palma.
The climate of La Palma is generally subtropical and oceanic with warm temperatures and less pronounced seasonality. Besides the climatic gradients along elevation, the most pronounced differences are evidently related to elevation and aspect [34,35]. The northeast-facing slopes are exposed to trade winds and are regularly covered by clouds condensing on these high mountains. In contrast, the southwest-facing slopes, such as the one with this volcano, are characterized by low cloudiness, arid to semi-arid conditions, and high temperatures, particularly on the bare ground of young volcanic rocks and lapilli (tephra) fields.
La Palma is known as “La Isla Bonita” or “La Isla Verde”, which addresses the lush vegetation that covers its steep slopes due to the favorable moist climate. As accessibility is limited, and human population density is low, a large extent of the island is still covered by natural and semi-natural vegetation, e.g., laurel forest and Morello-Erica thickets, particularly in the isolated valleys along the northern coast, and legume shrub vegetation in the alpine zone. Native trees cannot thrive only in the alpine zone above the treeline and in the most arid parts at lower elevations. As human influences related to land use are minor, most of the woodland is mainly characterized by natural disturbance regimes [36,37].
Due to the geographic isolation of individual islands of the Canary archipelago and of their respective ecosystems, all islands host rare, endemic, and endangered plant species [38]. Canary pine forest on La Palma covers 250 km2, of which 208 km2 (83%) is within protected areas with restrictions for management and land use. A total of 238 plant species have been recorded for this ecosystem, among which 127 plant species are endemic to the Canaries and the other 44 to only La Palma. Most plant species in this ecosystem (90%) are native. Only a few invasive species are established in this ecosystem characterized by extreme natural disturbances [39]. This high degree of endemicity and naturalness in terms of human impact and diverse species assemblages attributes a high value to the Canary pine forest [40]
The Canary pine forest is a major ecosystem in the archipelago [40], which has provided a wide range of ecosystem services, including slope stabilization, timber and pitch production, shedding of needle-litter usable as packing material, maintenance of ground freshwater by cloud condensation (horizontal precipitation), and an attraction for tourists and leisure activities. On La Palma, managed plantations are very scarce. Most of its pine forests are dominated by the endemic species Pinus canariensis C. Sm., showing natural conifer dynamics. Large parts of these ecosystems are protected as Natura 2000 nature reserves. Canary pine is the largest Old World pine species, reaching up to 60 m in height and more than 2.5 m in diameter at breast height (DBH) [41]. However, such impressive trees are rare due to the massive historical felling and exploitation of pine forests [42]
Canary pine forests are frequently exposed to severe disturbances such as large wildfires, both natural and anthropogenic in origin [43]. Besides the direct impact of fires, nutrient availability in Canary pine forest soils is also affected [44]. However, P. canariensis is highly adapted to fire impact [45,46,47,48]; it can recover after fire by resprouting from epicormic and root collar buds, shaping a peculiar morphology of fire-impacted trees. The trees survive even intense crown fires. Within a few years, the previous canopy cover can be reached again [49]. The species additionally has very thick bark and a high concentration of carbohydrates in the sapwood parenchyma cells [47,50]. The extremely long needles of this pine aid substantially in freshwater provision [51], by contributing to condensation during the frequent fog (clouds touching the ground). In addition, this ecosystem is naturally rather species-poor. The forest structure and canopy are dominated by P. canariensis, while the understory is composed of herb and shrub species. In consequence, damage to the pine tree canopy has a negative influence on the entire ecosystem. In addition, such damage can be seen as an indicator of pollution impact, which may also affect other species that cannot be detected by remote sensing information.
3. Materials and Methods
3.1. Data Collection
To assess chlorotic damage to the Canary pine forest after the recent eruption in 2021, we chose Sentinel-2 satellite images, which are well-suited for detecting different types of forest damage, e.g., fire damage [37,52], drought [53], bark beetle infestations [54], and defoliation [55]. To compare forest conditions before and after the eruption, all Sentinel-2 images between 19 September 2021 and 14 December 2021 were processed. Overall, 30 images from Sentinel-2 military grid reference system (MGRS) tiles T27RYM and T28RBS were evaluated. However, both smoke from the eruption and cloud formation due to aerosols left very few images clear enough to be usable. Therefore, two images were selected for a before-and-after comparison: 30 November 2019, a near-cloud-free image representing conditions before the eruption, and an image from 14 December 2021, which was the first Sentinel-2 image available with cloud cover low enough to analyze chlorotic damage to the forest. All images were downloaded at processing Level 2A and pre-processed with the R package “sen2r” version 1.5 [56]. All pixels with the levels “No data”, “Saturated and defective”, and “Cloud (high and medium probability)” in the included scene classification layer (SCL) were masked out, with a 200 m buffer around the clouds masked out as well. We also attempted to mask other pixel values, such as those containing thin cirrus clouds. The high aerosol concentration in the atmosphere resulting from volcanic activity (Figure 3) led to us masking most parts of the island. While these aerosols negatively affect image quality if not masked out, the observed chlorosis of the pine forest was severe enough to render these introduced errors negligible. Masking only the mentioned high to medium cloud probability with a 200 m buffer was therefore chosen as a trade–off between data availability and quality.
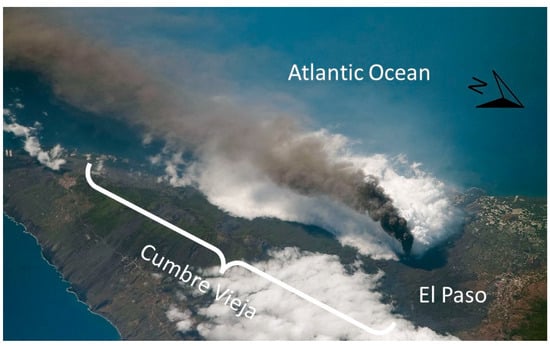
Figure 3.
View of the southern part of La Palma from space on 4 October 2021. This picture reflects the characteristic wind direction in the troposphere from NNE. The dark plume of ashes at the higher altitude is clearly distinguished from the cloud formation below, enhanced by volcanic aerosols. The most common cloud formation caused by the prevailing NE tradewinds (lower rim of the picture) usually dissolves when passing over the ridge (Foto NASA).
The normalized difference vegetation index (NDVI) was calculated for all images. Distance from the eruption craters was calculated from the Copernicus EMS data [13] from 9 December. The position of each forest pixel in relation to the eruption was also calculated from this dataset.
The NDVI was calculated for both scenes (30 November 2019 and 14 December 2021) using the following Equation (1):
An NDVI difference map (from here denoted “ΔNDVI”) was created by subtracting the NDVI before the volcanic eruption from the NDVI afterwards. We used the ΔNDVI as a proxy for vegetation damage. The ΔNDVI was extracted using the packages “rgdal” 1.5–23 [57] and “raster” version 3.4–5 [58] in R version 3.6.3 [59].
An expert-based land cover classification provided by the Cabildo Insular de La Palma (island council) was used as a forest mask for the Canary pine forest. Since the official land cover classification contains some forest gaps and areas with very low forest cover, which negatively influence the pixel-based analysis, it was combined with the Copernicus tree cover density product [60]. A threshold of 50% minimum tree cover was selected, based on visual inspection of problematic areas. We used a combination of both products to extract the pine forest from the Sentinel-2 images. These natural forests exhibit mono-dominant stands of P. canariensis in the canopy. For this reason, no interference with other tree species needs to be considered. Ash deposits also influence vegetation changes detected with the NDVI. Bare ground of volcanic origin in the study area covered with fresh ash showed lower NDVI values than before. This also influenced the decline in NDVI detected in forest pixels with little canopy cover. The combined forest mask starkly reduced this problem, as it only kept forest pixels with reasonably high canopy cover. Additionally, visual inspection of the true-color images created from the Sentinel-2 scenes and compared to the ΔNDVI showed a strong decline in NDVI in trees with visible chlorosis and no or little decline in NDVI in nearby healthy trees. Therefore, ash deposits on needles had little effect on the calculated ΔNDVI values in this study.
Data on sulfur emissions were acquired from the Sentinel-5P TROPOMI product focused on atmospheric concentrations (Figure 4). Sentinel-5P is contributing to the Copernicus Atmospheric Monitoring Services (CAMS). These services inform us about air quality and pollution, with SO2 as a main data product (see Table 1). The total amount of SO2 emitted from the eruption per day was retrieved from the Instituto Geológico y Minero de España (IGME) [33]
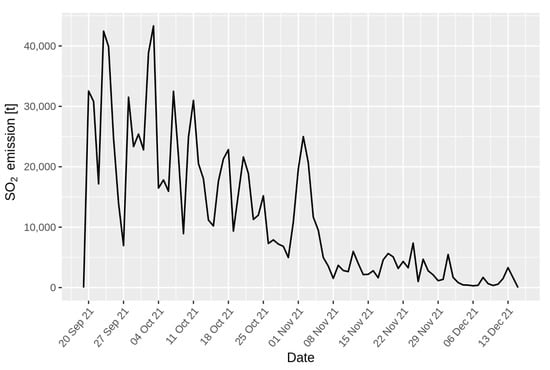
Figure 4.
Time series of the daily sulfur emissions during the volcanic eruptions at Cumbre Vieja, La Palma, between 19 September and 14 December 2021. These were concluded from the Sentinel-5P TROPOMI measurements of SO2 concentrations in the atmosphere. Series based on measurements by Sentinel-5P and NASA Suomi-NPP/OMPS. Data source: “© Geological Survey of Spain (IGME)”.

Table 1.
Remote sensing products and data sources used in this study.
To estimate sulfur deposition in the study area, the weather data during the eruption were acquired from the Cabildo Insular de La Palma weather station at Cumbre Nueva (28°38′49″ N 17°49′30″ W), situated 5.5 km northeast of the eruption. Due to a technical failure of the radio transmitter at the weather station, only data before 22 November 2021 were available. This station measured wind speed, direction, and other meteorological variables every 10 min. Very few data gaps were present, but one day (30 September 2021) was removed from the dataset due to more than two hours of data being missing. Daily SO2 emissions were divided by the number of daily wind observations (Figure 5). This combination was plotted using the R package “openair” version 2.8-6 [61].
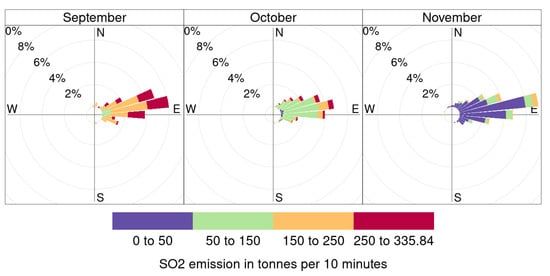
Figure 5.
Windroses indicating the frequency of wind directions during the volcanic activity phase on La Palma. The weather station is located 5.5 km northeast of the new volcano on the ridge of Cumbre Nueva (28°38′49″ N 17°49′30″ W). Data extend from 19 September 2021 to only 21 November 2021, due to technical failure. Wind data were recorded every 10 min with occasional data gaps. One day (30 September) was deleted from the dataset due to more than 2 h of missing data. Daily sulfur dioxide emissions were divided by all wind measurements on the same day. The length of each wedge shows the percentage of wind from that direction, color indicates the amount of SO2 emissions in metric tons per 10 min. Data sources: wind – Cabildo Insular de La Palma (wind), SO2 – “© Geological Survey of Spain (IGME)”.
3.2. Data Analysis
Connecting the changes in the NDVI in direct comparison before and after the event allowed us to quantify the spatial patterns of vegetation damage. Here, we link these patterns of NDVI change with the probability of deposition of sulfur compounds, derived respectively from the recorded daily emissions and from the recorded main wind directions during these days.
Sentinel-2 sensors deliver appropriate remote sensing information due to their spatial resolution (up to 10 m) and revisit time of 5 days [62]. However, it was difficult to find cloud-free areas during the volcanic eruption because the emitted ashes, smoke, and gases resulted in dense cloudiness during this period.
ΔNDVI was extracted for all Canary pine forest pixels from the combined forest mask. The distance and direction relative to the eruption were also extracted for all forest pixels. We then analyzed the relationship of ΔNDVI to the distance from the eruption, as well as the importance of the relative position regarding the eruption. The dataset was split into three parts: north (315° to 45°), east (45° to 135°) and south of the eruption (135° to 225°). In the western direction (225° to 315°), due to the lava stream only two very small tree stands remained and were therefore excluded. Additionally, we split the ΔNDVI for the southern half of the island (south of the mid-point of Cumbre Nueva ridge) into two parts: east and west of the complete ridge of Cumbre Vieja and Nueva. We then tested if there was a significant difference between forest patches on the wind- or leeward sides of Cumbre Vieja/Nueva. We used the R package “raster” [58] to combine the acquired remote sensing data for analysis.
As a measure of the area of damaged forest, the overall area of forest pixels in our forest mask was calculated. We also calculated the area of pixels with a 10% or stronger decline in NDVI and also with a 20% or stronger decline, then cropped it to the area of Cumbre Vieja and Nueva ridge to exclude pixels with declining NDVI from different unrelated causes on the northwestern coast. We used this area to calculate the percentage of Canary pine forest damaged by sulfur dioxide emissions.
To analyze the relationship between the distance from the eruption and ΔNDVI, generalized linear models (GLMs) were fit to the data. Several data transformations (linear, quadratic, and log) were tried out. We selected the best transformation based on AIC and general model fit, and therefore selected GLMs with the formula ΔNDVI ~ distance + log(distance). Function “pseudoR2” from the package “DescTools” version 0.99.40 [63] was used to calculate Nagelkerke’s pseudo-R² value for all GLMs.
4. Results
A clear spatial pattern emerged from Earth observation of NDVI change when comparing the greenness of the pine forest before and just after the volcanic activity. A large proportion of natural Canary pine forest stands on the western slope of Cumbre Vieja showed chlorotic responses to the eruption. True-color images created from Sentinel-2 revealed that the discoloration of the canopy, which can be seen in the field (Figure 6), is also clearly visible in Sentinel-2 images and can be detected for many parts of the Canary pine forest in the surroundings of the eruption.
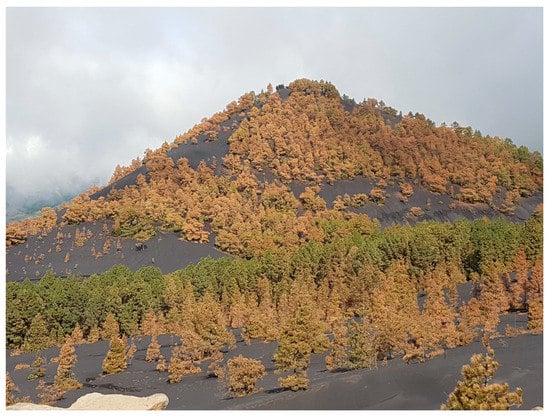
Figure 6.
Chlorotic discoloration of Canary pine forest in the vicinity of the volcanic eruptions. Image taken on 10 November 2021. (Photo: Félix M. Medina).
ΔNDVI revealed a clear spatial pattern of the damage to the forest canopy—most trees on the western slope of Cumbre Vieja exhibited a strong decline in greenness. This decline is visible for at least 7 km south of the eruption crater, while forest patches on the outer slopes of the Caldera de Taburiente and Cumbre Vieja to the north of the eruption craters exhibited a weaker decline in NDVI (Figure 7). The decrease in greenness in the vicinity of the eruption crater showed a clear relation to distance; forest patches closer to the crater had a stronger decline in NDVI compared to those further away (Figure 7). Overall, the NDVI decrease due to visible chlorosis was clearly located mostly in the area around the eruption and fits visual field observations of such damage. Pine forests in other areas of the island exhibit similar NDVI values in 2021 when compared to 2019. The few small spots of visible NDVI decline elsewhere on the island cannot be linked to visible chlorosis and most likely had different sources, e.g., atmospheric effects, declining vegetation health for other reasons or image artifacts. Of the 183 km² of forest in our forest mask, 18.8 km² (10.3%) showed an NDVI decline of 10% or more, while 13.4 km² ( 7.2%) underwent a decline of 20% or more. The damaged area lies almost completely within the area protected under Natura 2000.
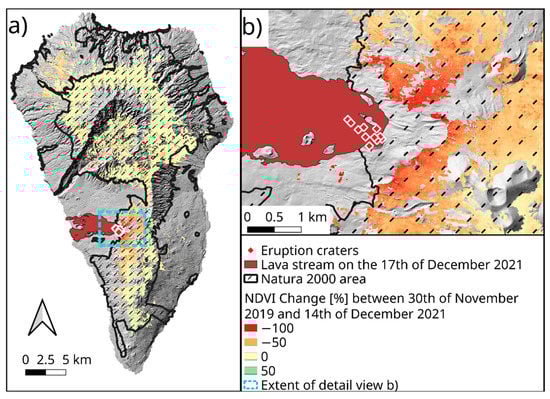
Figure 7.
Impact of the 2021 eruption on La Palma’s endemic pine forest. Red diamonds indicate eruption sites, and the lava stream is shown in brown–red. The area outlined and shaded in black marks terrestrial Natura 2000 areas. Green, yellow, orange, and red show the NDVI change, in percent, within the pine forest area before (30 November 2019) and after the eruption (14 December 2021). The turquoise frame in the overview map (a) marks the extent of the detailed view (b). Some minor parts of the forest are not shown in the NDVI product due to cloud cover. Yellow coloration indicates no change, orange and red a decrease in greenness as an effect of the eruption, and green an increase in greenness. Background map: Hillshade generated from a digital elevation model.
Figure 8 shows the relationship between ΔNDVI and the distance from the eruption craters for 100,000 random points within the pine forest. A clear pattern is visible, with the highest decline in NDVI, up to 100%, closest to the crater and smaller declines further away. At roughly 7 km, the majority of forest pixels show only limited or no NDVI change due to the eruption. Nonetheless, there are several groups with a strong (30–50%) decline in NDVI at larger distances, e.g., at 8 and 10 km. A GLM with the formula ΔNDVI ~ distance + log(distance) showed a significant relationship between ΔNDVI and distance, and had a Nagelkerke’s pseudo-R² of 0.41.
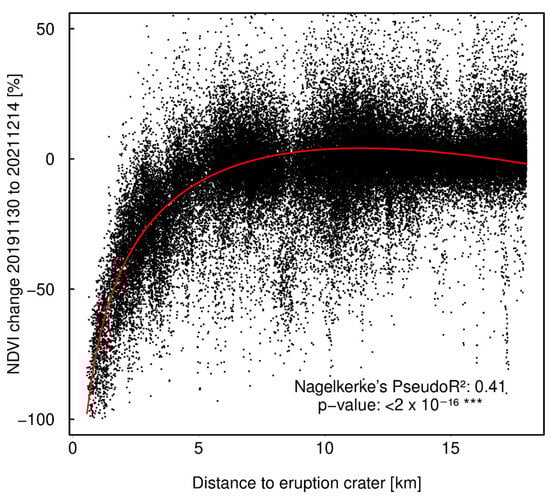
Figure 8.
Relative change in the normalized difference vegetation index (NDVI) between 30 November 2019 and 14 December 2021, against the distance to the eruption craters (based on data from Copernicus EMS from 9 December 2021) for 100,000 random data points within the Canary pine forest. The distances shown were limited to the first 18 km, with forests at larger distances (up to 25 km) excluded. The red line represents a highly significant (***) GLM of the formula ΔNDVI ~ distance + log(distance) with a Nagelkerke’s pseudo-R² value of 0.41.
The three subsets representing forests north, east, and south of the eruption show only slightly different relationships between NDVI decline and distance from the eruption (Figure 9). Forests south of the eruption had more affected forest patches closer to the crater compared to the areas northward, at least for the nearest 5 km. This is expressed by the fitted curve for the southward direction, which runs consistently below the curves for northward and eastward for distances between 2 and 5 km, indicating more severely damaged forest patches for those distances. The eastern dataset shows a steeper increase, with most forest pixels roughly 4 km away from the eruption already exhibiting only little to no decline in NDVI. The corresponding GLMs are all highly significant and have pseudo-R² values of 0.54, 0.61, and 0.48, respectively.
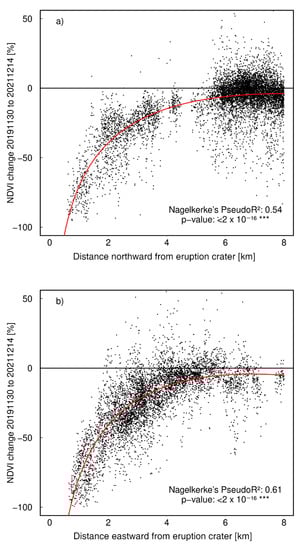
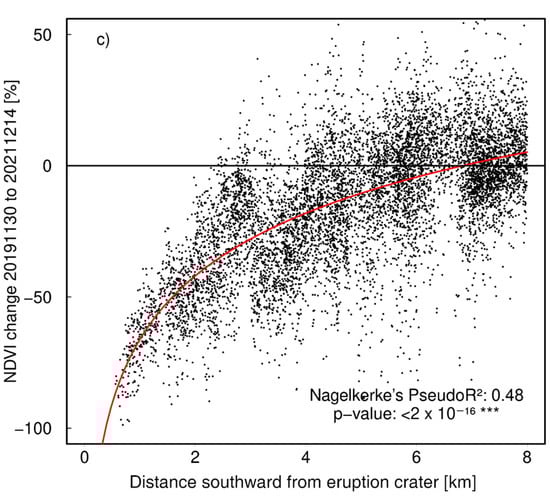
Figure 9.
Relative change in the normalized difference vegetation index (NDVI) between 30 November 2019 and 14 December 2021, against the distance to the eruption craters (based on data from Copernicus EMS from 9 December 2021). The 100,000 random data points extracted from both rasters were split into three subsets: (a) north of the eruption (225° to 315°), (b) east of the eruption (135° to 225°), and (c) south of the eruption (45° to 135°). Apart from two very small tree stands situated west of the eruption, most trees in this direction were covered by lava. This direction was, therefore excluded from the analysis. The red lines represent a hghly significant (***) GLMs of the formula ΔNDVI ~ distance + log(distance) with Nagelkerke’s pseudo-R² values of 0.54, 0.61, and 0.48, respectively.
5. Discussion
The strong impact of the volcanic eruption on the Canary pine forest is difficult to explain by heat, even if fluid lava was hotter than 1000 °C. Heat impact would only be effective in close proximity to the lava. Other impacts related to the volcanic activity, such as emission of CO2 and volcanic ashes, are also unlikely to result in chlorotic discoloration of pine needles. Ash initially covered a large amount of pine trees, but was removed by wind and rain. The evergreen pine forest did not show substantial seasonal variation in spectral traits of the canopy. Seasonal patterns as a response to precipitation, however, can only be expected for the herbaceous vegetation in the understory. As a consequence, canopy density needs consideration to avoid a strong influence from the phenology of field layer vegetation. This was performed in this study, based on a digital tree cover product, we considered only forest surfaces where tree cover was >50%.
In addition to the distance related decay in plant damage, we also found a weak anisotropic distribution with stronger impact southward from the volcano. Indeed, the western lowlands downslope are mainly covered by land use and settlements. The eastern slopes were protected from the eruption by the Cumbre Vieja ridge and, more so, the then prevailing wind direction. The major wind directions during the eruptive phase were ENE and E, which explains this asymmetric pattern of damage. However, overall, the anisotropic relationship was weak, indicating that most of the SO2 emission reaching the pine forest was omnidirectional. This is supported by the wind direction data. Especially during the early days of the eruption, the wind blew nearly exclusively from the east and northeast, distributing SO2 towards the west. On many days, wind speeds were also low, causing volcanic gases to rise into higher atmospheric layers before being spread. The 2021 La Palma volcanic eruption was intensely monitored, both in the field and by Earth observation [64]. Many scientists and institutions, such as the Spanish National Geographic Institute (IGN), Canary Islands Volcanology Institute (Involcan), Spanish National Research Council (CSIC), Univerisity of la Laguna (ULL), University of Las Palmas de Gran Canaria (LPGC), Cabildo Insular de La Palma, and the Canary Islands Government were involved, among others. This intense survey is providing invaluable data resources that will improve our understanding of volcanic impacts. In addition, worldwide attention and the European Copernicus Earth Observation program have yielded Big Data and geospatial information. Here, we focus only on a small section of this treasure, to point out the direct ecosystem responses during and immediately after the eruption. We are convinced that many other studies will follow.
Through Earth observations, negative impacts on the endemic Canary pine forest ecosystems—among which the volcanic cones emerged—can be precisely documented, as in in this study. Evidence suggests that gaseous emissions are the main driver of these responses. Such natural pollution events took place frequently in the Earth’s history, but cannot easily be traced back due to their elusive and ephemeral properties [65,66]. Nevertheless, as shown in this study, the effects of such cases of natural pollution can be substantial. In the case of La Palma, 10.3% of the island’s pine forests and 5.2% of its protected areas have been affected, and they host many unique endemic species. Currently, it is too early to say whether the small populations of endemic plant species located in the southern half of the island have been severely affected. However, according to field observations, they have not been driven to extinction yet. Only a wild chickpea Cicer canariense A. Santos & G.P. Lewis and a new species currently named Parolinia aridanae, description pending [67], are potentially threatened plants, but to date their conservation is not compromised [68].
The island of La Palma can be seen as a natural laboratory to study ecological, geomorphological, and biogeochemical processes [69,70]. The high degree of naturalness of ecosystems reduces confounding anthropogenic influences. The volcanic eruption at Hoya de Tajogaite in 2021 was the largest such event within historical times on La Palma. Records of previous eruptions date back to 1450, which are still visible as uniquely distinct lava flows. However, the vast lapilli fields on Cumbre Vieja ridge cannot be attributed directly to individual volcanic cones or events. Furthermore, likely chemical impacts in the past are not reflected, protocolled, or preserved. Volcanic gases are transient, but have a strong impact on vegetation near eruptions, which is surprisingly little studied (e.g., [71,72,73]). In 2021, the amount of sulfuric compounds released was precisely protocolled on a diurnal basis. In combination with recorded wind directions, it allows us to assess the spatial influence of sulfuric gases on the ground. No other hampering impacts, such as fire or drought, occurred in this short period. Thus, it is most likely that the NDVI change was caused by the enormous amounts of sulfuric emissions.
In contrast to the widespread literature dealing with fire impact on Canary pine and on the dynamics of its forest ecosystems (e.g., [37,43,44,48,74], research was lacking until now on the impact of volcanic gases on these trees and forests. However, such events occurred frequently during the existence of the archipelago. The impact of pollutants, including sulfuric compounds, on this pine were hitherto only studied in connection with anthropogenic environmental pollution related to car traffic [75]. Exposure to such types of pollution, however, is many orders of magnitude lower than the toxic compounds released from this recent eruption. The total amount of SO2 emissions during the active phase of the volcano was enormous, even if the real sulfur emissions cannot be measured precisely while released during that phase. Estimates range up to 1 Tg (1,000,000 tons) of SO2 [33], which makes this event important at a global level.
Atmospheric measurements from space deliver good proxies and estimates for the order of magnitude. Local measurements of air pollution in settlements that aim at health care are less representative of landscape-scale pollution impacts. In this study, we decided to use data from satellite sensors due to their spatial cover, methodological standardization, and daily availability. Data from different sensors deviate due to technological factors (e.g., Sentinel-5P TROPOMI vs. Nasa Suomi-NPP/OMPS). In this study, this is less relevant as we are interested in the spatial patterns of the impact on the ground. A substantial proportion of the emitted sulfur compounds are projected into the high strata of the atmosphere and transported over long distances, without contact with land surfaces and ecosystems. Nevertheless, satellite sensors can inform on the quantitative development of emissions for every single day. This helps to understand the role of prevalent wind directions and to identify processes leading to the anisotropic distribution of pine damage on La Palma, in addition to the mere distance from the source of emission. On a global scale, sensors from the Copernicus program can be combined to monitor the distribution of emitted SO2 and to investigate forest responses to such events.
The general importance of volcanic eruptions and gas input in atmospheric chemistry has been highlighted [76,77]. Particularly, emissions of CO2 and SO2 are seen as substantial contributions to changes in atmospheric chemistry. However, there is little knowledge about the effects of such gaseous emissions on terrestrial ecosystems. The chlorotic and necrotic responses of pine needles are documented as related to atmospheric sulfur exposure [78], but the ecological literature on atmospheric sulfur impacts is mostly focused on industrial pollution and acid rain (e.g., [79]). As a consequence, these studies are strongly biased towards northern-hemisphere conifer forests. However, it is crucial to better understand the role of such temporarily limited events in ecosystem and biodiversity dynamics [66].
Andres and Kasgnoc [80] compiled the first global inventory of subaerial volcanic sulfur emissions, based on SO2 measurements en situ. Using data from the second half of the 20th century, they estimated an annual average of 13 Tg SO2 emissions from volcanoes. This worldwide quantity illustrates the importance of the 2021 eruption on La Palma, with approximately 1 Tg SO2 emissions. Recently, several groups studied volcanic SO2 emissions with the support of remote sensing [81,82,83] and modeling [84]. However, there are few studies on the impact of volcanic gases on vegetation [31]. The recent volcanic eruption on La Palma provided a chance to study this fundamental process that happened so frequently in the Earth’s history. Highly precise monitoring of the volcano during its active phase, together with Earth observation data, quantification of sulfur emissions from space, and detection of vegetation responses has offered an unprecedented opportunity. The pattern identified will also serve as a reference for future changes in the drivers of ecosystem changes and responses in the biodiversity [85,86].
6. Conclusions
The eruption on the west slope of Cumbre Vieja (La Palma, Canary Islands, Spain) gained global attention. This event developed into the strongest and longest-lasting eruption in the island’s historical records. The emission of ashes and gases had a far-reaching impact, besides the large lava field that now covers former settlements, agricultural fields, and semi-natural vegetation, along with two new volcanic deltas (fajanas) on the coast. Here, we focused on the effects of gaseous emissions, in particular SO2 and its derivate compounds such as sulfuric acid, on the endemic pine forest of the island. This forest is largely protected through Natura 2000 and is of decisive importance for ecosystem services, such as the provision of freshwater and carbon sequestration.
We successfully used remote sensing-based analyses to find a clear spatial pattern that can be explained by distance decay towards the source of eruption. Chlorotic damage to the pine forest canopy was clearly visible in the Sentinel-2 earth observation data. Due to the lack of large forests to leeward of the eruption, we were not able to prove nor disprove the importance of wind direction and only found a weak anisotropic pattern. Stands of P. canariensis are known to exhibit high resilience towards disturbances, providing a unique study ground for testing an emerging theory on pulse dynamics in ecosystems [66]. This tree species re-sprouts after fire impact and total defoliation. For this reason, we expect this forest ecosystem to recover in the following years. This study also serves as comparison for future monitoring of ecosystem recovery. The specific conditions during the active phase released a large amount of acid aerosols that caused cloud formation in addition to the frequent plume or fan of ashes and smoke from the volcano. Nevertheless, this location on the less humid leeward side of the island will provide many cloud-free days in the future to monitor how the affected pine forests recover.
Author Contributions
Conceptualization, C.B. and F.W.; methodology, F.W., E.B. and C.B.; validation, F.W.; formal analysis, F.W.; investigation, F.W., E.B. and C.B.; resources, C.B. and A.J.; data curation, F.W.; writing—original draft preparation, C.B. and F.W.; writing—review and editing, C.B., F.W., E.B., F.M.M., M.N., A.J. and M.L.; visualization, F.W. and E.B.; supervision, C.B.; project administration, C.B.; funding acquisition, C.B. All authors have read and agreed to the published version of the manuscript.
Funding
This research was funded by the EU Horizon 2020 project e-shape under the grant agreement 820852. Funded by the Deutsche Forschungsgemeinschaft (DFG, German Research Foundation)–491183248. Funded by the Open Access Publishing Fund of the University of Bayreuth. The manuscript was proof-read by G. Jones, under project OTR02900 (SOLAUT_00026129) funded by the Cabildo de Tenerife TFinnova Program, supported by MEDI and FDCAN.
Institutional Review Board Statement
Not applicable.
Informed Consent Statement
Not applicable.
Data Availability Statement
The data presented in this study are available on request from the corresponding author.
Acknowledgments
We acknowledge the support of the BayWISS graduate school. This publication was funded by the University of Bayreuth Open Access Publishing Fund. This manuscript has been edited by Guido Jones, currently funded by The Cabildo de Tenerife, under the TFinnova Programme supported by MEDI and FDCAN funds.
Conflicts of Interest
The authors declare they had no conflict of interest.
References
- Reyes-Betancort, J.A.; Santos-Guerra, A.; Guma, I.R.; Humphries, C.J.; Carine, M.A. Diversity, rarity and the evolution and conservation of the Canary Islands endemic flora. An. Jardín Botánico Madr. 2008, 65, 25–45. [Google Scholar] [CrossRef]
- Caujapé-Castells, J.; Tye, A.; Crawford, D.J.; Santos-Guerra, A.; Sakai, A.; Beaver, K.; Lobin, W.; Vincent, F.F.B.; Moura, M.; Jardim, R.; et al. Conservation of oceanic island floras: Present and future global challenges. Perspect. Plant Ecol. Evol. Syst. 2010, 12, 107–130. [Google Scholar] [CrossRef]
- Burton, P.J.; Jentsch, A.; Walker, L.R. The Ecology of Disturbance Interactions: Characterization, prediction and the potential of cascading effects. Bioscience 2020, 70, 854–870. [Google Scholar] [CrossRef]
- Von Buch, L. Physicalische Beschreibung der Canarischen Inseln; Königliche Akademie der Wissenschaften: Berlin, Germany, 1825. [Google Scholar]
- Irl, S.D.H.; Anthelme, F.; Harter, D.E.V.; Jentsch, A.; Lotter, E.; Steinbauer, M.J.; Beierkuhnlein, C. Patterns of island treeline elevation—A global perspective. Ecography 2015, 39, 427–436. [Google Scholar] [CrossRef]
- Steinbauer, M.J.; Otto, R.; Naranjo-Cigala, A.; Beierkuhnlein, C.; Fernández-Palacios, J.M. Increase of island endemism with altitude–speciation processes on oceanic islands. Ecography 2012, 35, 23–32. [Google Scholar] [CrossRef]
- Nürk, N.M.; Linder, H.P.; Onstein, R.E.; Larcombe, M.J.; Hughes, C.E.; Fernández, L.P.; Schlüter, P.M.; Valente, L.; Beierkuhnlein, C.; Cutts, V.; et al. Diversification in evolutionary arenas—Assessment and synthesis. Ecol. Evol. 2020, 10, 6163–6182. [Google Scholar] [CrossRef]
- Irl, S.D.H.; Schweiger, A.; Hoffmann, S.; Beierkuhnlein, C.; Hartmann, H.; Pickel, T.; Jentsch, A. Spatiotemporal dynamics of plant diversity and endemism during primary succession on an oceanic-volcanic island. J. Veg. Sci. 2019, 30, 587–598. [Google Scholar] [CrossRef]
- Longpré, M.A.; Felpeto, A. Historical volcanism in the Canary Islands; part 1: A review of precursory and eruptive activity, eruption parameter estimates, and implications for hazard assessment. J. Volcanol. Geotherm. Res. 2021, 419, 107363. [Google Scholar] [CrossRef]
- Torres-González, P.A.; Luengo-Oroz, N.; Lamolda, H.; D’Alessandro, W.; Albert, H.; Iribarren, I.; Moure-García, D.; Soler, V. Unrest signals after 46 years of quiescence at Cumbre Vieja, La Palma, Canary Islands. J. Volcanol. Geotherm. Res. 2020, 392, 106757. [Google Scholar] [CrossRef]
- Fernández, J.; Escayo, J.; Hu, Z.; Camacho, A.G.; Samsonov, S.V.; Prieto, J.F.; Tiampo, K.F.; Palano, M.; Mallorqui, J.J.; Ancochea, E. Detection of volcanic unrest onset in La Palma, Canary Islands, evolution and implications. Sci. Rep. 2021, 11, 1–15. [Google Scholar]
- Longpré, M.A. Reactivation of Cumbre Vieja volcano. Science 2021, 374, 1197–1198. [Google Scholar] [CrossRef]
- Copernicus Emergency Management Service (© 2021 European Union), EMSR546. Available online: https://emergency.copernicus.eu/mapping/list-of-components/EMSR546 (accessed on 22 December 2021).
- Smith, S.J.; Pitcher, H.; Wigley, T.M. Global and regional anthropogenic sulfur dioxide emissions. Glob. Planet. Chang. 2001, 29, 99–119. [Google Scholar] [CrossRef]
- Smith, S.J.; Pitcher, H.; Wigley, T.M.L. Future sulfur dioxide emissions. Clim. Chang. 2005, 73, 267–318. [Google Scholar] [CrossRef]
- Smith, S.J.; Aardenne, J.V.; Klimont, Z.; Andres, R.J.; Volke, A.; Delgado Arias, S. Anthropogenic sulfur dioxide emissions: 1850–2005. Atmos. Chem. Phys. 2011, 11, 1101–1116. [Google Scholar] [CrossRef]
- Ward, P.L. Sulfur dioxide initiates global climate change in four ways. Thin Solid Film. 2009, 517, 3188–3203. [Google Scholar] [CrossRef]
- Varshney, C.K.; Garg, J.K.; Lauenroth, W.K.; Heitschmidt, R.K. Plant responses to sulfur dioxide pollution. Crit. Rev. Environ. Sci. Technol. 1979, 9, 27–49. [Google Scholar] [CrossRef]
- Knabe, W. Effects of sulfur dioxide on terrestrial vegetation. Ambio 1976, 5, 213–218. [Google Scholar]
- Chung, C.Y.; Chung, P.L.; Liao, S.W. Carbon fixation efficiency of plants influenced by sulfur dioxide. Environ. Monit. Assess. 2011, 173, 701–707. [Google Scholar] [CrossRef]
- Baciak, M.; Warmiński, K.; Bęś, A. The effect of selected gaseous air pollutants on woody plants. For. Res. Pap. 2015, 76, 401–409. [Google Scholar] [CrossRef][Green Version]
- Likus-Cieślik, J.; Socha, J.; Gruba, P.; Pietrzykowski, M. The current state of environmental pollution with sulfur dioxide (SO2) in Poland (Central Europe) based on sulfur concentration in Scots pine (Pinus sylvestris L.) needles. Environ. Pollut. 2020, 258, 113559. [Google Scholar] [CrossRef]
- Prietzel, J.; Mayer, B.; Legge, A.H. Cumulative impact of 40 years of industrial sulfur emissions on a forest soil in west-central Alberta (Canada). Environ. Pollut. 2004, 132, 129–144. [Google Scholar] [CrossRef]
- Huang, J.; Zhou, K.; Zhang, W.; Liu, J.; Ding, X.; Cai, X.A.; Mo, J. Sulfur deposition still contributes to forest soil acidification in the Pearl River Delta, South China, despite the control of sulfur dioxide emission since 2001. Environ. Sci. Pollut. Res. 2019, 26, 12928–12939. [Google Scholar] [CrossRef]
- Fenn, M.E.; De Bauer, L.I.; Quevedo-Nolasco, A.; Rodriguez-Frausto, C. Nitrogen and sulfur deposition and forest nutrient status in the Valley of Mexico. Water Air Soil Pollut. 1999, 113, 155–174. [Google Scholar] [CrossRef]
- Gbondo-Tugbawa, S.S.; Driscoll, C.T. Evaluation of the effects of future controls on sulfur dioxide and nitrogen oxide emissions on the acid–base status of a northern forest ecosystem. Atmos. Environ. 2002, 36, 1631–1643. [Google Scholar] [CrossRef]
- Chin, M.; Jacob, D.J. Anthropogenic and natural contributions to tropospheric sulfate: A global model analysis. J. Geophys. Res. 1996, 101, 18691–18699. [Google Scholar] [CrossRef]
- Kirchner, I.; Stenchikov, G.L.; Graf, H.F.; Robock, A.; Antuña, J.C. Climate model simulation of winter warming and summer cooling following the 1991 Mount Pinatubo volcanic eruption. J. Geophys. Res. Atmos. 1999, 104, 19039–19055. [Google Scholar] [CrossRef]
- Saturno, J.; Ditas, F.; de Vries, M.P.; Holanda, B.A.; Pöhlker, M.L.; Carbone, S.; Walter, D.; Bobrowski, N.; Brito, J.; Chi, X.; et al. African volcanic emissions influencing atmospheric aerosol particles over the Amazon rain forest. Atmos. Chem. Phys. Discuss. 2017. [Google Scholar] [CrossRef]
- Sangeetha, S.K.; Sivakumar, V.; Gebreslasie, M. Long-range transport of SO2 over South Africa: A case study of the Calbuco volcanic eruption in April 2015. Atmos. Environ. 2018, 185, 78–90. [Google Scholar] [CrossRef]
- Tortini, R.; van Manen, S.M.; Parkes, B.R.B.; Carn, S.A. The impact of persistent volcanic degassing on vegetation: A case study at Turrialba volcano, Costa Rica. Int. J. Appl. Earth Obs. Geoinf. 2017, 59, 92–103. [Google Scholar] [CrossRef]
- Theys, N.; Hedelt, P.; De Smedt, I.; Lerot, C.; Yu, H.; Vlietinck, J.; Pedergnana, M.; Arellano, S.; Galle, B.; Fernandez, D.; et al. Global monitoring of volcanic SO2 degassing with unprecedented resolution from TROPOMI onboard Sentinel-5 Precursor. Sci. Rep. 2019, 9, 2643. [Google Scholar] [CrossRef]
- IGME Dióxido de Azufre (SO2) en la Atmósfera. Available online: https://info.igme.es/eventos/Erupcion-volcanica-la-palma/seguimiento-erupcion (accessed on 22 December 2021).
- Garzón-Machado, V.; Otto, R.; del Arco Aguilar, M.J. Bioclimatic and vegetation mapping of a topographically complex oceanic island applying different interpolation techniques. Int. J. Biometeorol. 2014, 58, 887–899. [Google Scholar] [CrossRef] [PubMed]
- Steinbauer, M.J.; Irl, S.; González, J.M.; Breiner, F.; Hernández Hernández, R.M.; Hopfenmüller, S.; Kidane, Y.; Jentsch, A.; Beierkuhnlein, C. Plant invasion and speciation along elevational gradients on the oceanic island La Palma, Canary Islands. Ecol. Evol. 2017, 7, 771–779. [Google Scholar] [CrossRef] [PubMed]
- Devkota, R.S.; Field, R.; Walentowitz, A.; Medina, F.M.; Vetaas, O.; Chiarucci, A.; Weiser, F.; Jentsch, A.; Beierkuhnlein, C. Assessing the potential replacement of Laurel Forest by a novel ecosystem in the steep terrain of an oceanic island. Remote Sens. 2020, 12, 4013. [Google Scholar] [CrossRef]
- Weiser, F.; Sauer, A.; Gettueva, D.; Field, R.; Irl, S.D.H.; Vetaas, O.; Chiarucci, A.; Hoffmann, S.; Fernández-Palacios, J.M.; Otto, R.; et al. Impacts of forest fire on understory species diversity in Canary pine ecosystems on the island of La Palma. Forests 2021, 12, 1638. [Google Scholar] [CrossRef]
- Beierkuhnlein, C.; Walentowitz, A.; Welss, W. FloCan—A revised checklist for the flora of the Canary Islands. Diversity 2021, 13, 480. [Google Scholar] [CrossRef]
- Bacaro, G.; Maccherini, S.; Chiarucci, A.; Jentsch, A.; Rocchini, D.; Torri, D.; Gioria, M.; Tordoni, E.; Martellos, S.; Altobelli, A.; et al. Distributional patterns of endemic, native and alien species along a roadside elevation gradient in Tenerife, Canary Islands. Comm. Ecol. 2015, 16, 223–234. [Google Scholar] [CrossRef]
- del Arco Aguilar, M.J.; González-González, R.; Garzón-Marchado, V.; Pizarro-Hernández, B. Actual and potential natural vegetation on the Canary Islands and its conservation status. Biodivers. Conserv. 2010, 19, 3089–3140. [Google Scholar] [CrossRef]
- The Gymnosperm Database. Available online: https://www.conifers.org/pi/Pinus_canariensis.php (accessed on 10 December 2021).
- Parsons, J.J. Human influences on the pine and Laurel Forests of the Canary Islands. Geogr. Rev. 1981, 71, 253–271. [Google Scholar] [CrossRef]
- Höllermann, P. The impact of fire in the Canarian ecosystems 1983–1998. (Auswirkungen des Feuers in Ökosystemen der Kanarischen Inseln 1983–1998). Erdkunde 2000, 54, 70–75. [Google Scholar] [CrossRef]
- Durán, J.; Rodríguez, A.; Fernández-Palacios, J.M.; Gallardo, A. Changes in soil N and P availability in a Pinus canariensis fire chronosequence. For. Ecol. Manag. 2008, 256, 384–387. [Google Scholar] [CrossRef]
- Page, C.N. Morphology and affinities of Pinus canariensis. Notes R. Bot. Gard. Edinb. 1974, 33, 317–323. [Google Scholar]
- Richardson, D.M. Ecology and Biogeography of Pinus; Cambridge University Press: Cambridge, UK, 2000; ISBN 9780521789103. [Google Scholar]
- Fernandes, P.M.; Vega, J.A.; Jimenez, E.; Rigolot, E. Fire resistance of European pines. For. Ecol. Manag. 2008, 256, 246–255. [Google Scholar] [CrossRef]
- Molina-Terrén, D.M.; Fry, D.L.; Grillo, F.F.; Cardil, A.; Stephens, S.L. Fire history and management of Pinus canariensis forests on the western Canary Islands Archipelago, Spain. For. Ecol. Manag. 2016, 382, 184–192. [Google Scholar] [CrossRef]
- Arévalo, J.R.; Fernández-Palacios, J.M.; Jiménez, M.J.; Gil, P. The effect of fire intensity on the understory species composition of two Pinus canariensis reforested stands in Tenerife (Canary Islands). For. Ecol. Manag. 2001, 148, 21–29. [Google Scholar] [CrossRef]
- Climent, J.; Tapias, R.; Pardos, J.A.; Gil, L. Fire adaptations in the Canary Islands pine (Pinus canariensis). Plant Ecol. 2004, 171, 185–196. [Google Scholar] [CrossRef]
- Marzol-Jaén, M.V.; Sànchez-Megía, J.; García-Santos, G. Effects of fog on climate conditions at a subtropical montane cloud forest site in northern Tenerife (Canary Islands, Spain). In Tropical Montane Cloud Forests: Science for Conservation and Management; Bruijnzeel, L.A., Scatena, F.N., Hamilton, L.S., Eds.; Cambridge University Press: Cambridge, UK, 2010; pp. 359–364. [Google Scholar]
- Pádua, L.; Guimarães, N.; Adão, T.; Sousa, A.; Peres, E.; Sousa, J.J. Effectiveness of sentinel-2 in multi-temporal post-fire monitoring when compared with UAV imagery. ISPRS Int. J. Geoinf. 2020, 9, 225. [Google Scholar] [CrossRef]
- Brun, P.; Psomas, A.; Ginzler, C.; Thuiller, W.; Zappa, M.; Zimmermann, N.E. Large-scale early-wilting response of Central European forests to the 2018 extreme drought. Glob. Chang. Biol. 2020, 26, 7021–7035. [Google Scholar] [CrossRef] [PubMed]
- Barta, V.; Lukes, P.; Homolova, L. Early detection of bark beetle infestation in Norway spruce forests of Central Europe using Sentinel-2. Int. J. Appl. Earth Obs. Geoinf. 2021, 100, 102335. [Google Scholar] [CrossRef]
- Hawryło, P.; Bednarz, B.; Wężyk, P.; Szostak, M. Estimating defoliation of Scots pine stands using machine learning methods and vegetation indices of Sentinel-2. Eur. J. Remote Sens. 2018, 51, 194–204. [Google Scholar] [CrossRef]
- Ranghetti, L.; Boschetti, M.; Nutini, F.; Busetto, L. Sen2r: An R Toolbox for Automatically Downloading and Preprocessing Sentinel-2 Satellite Data, R Package Version 1.5. Available online: https://mran.microsoft.com/web/packages/sen2r/ (accessed on 22 December 2021).
- Bivand, R.; Keitt, T.; Rowlingson, B. rgdal: Bindings for the ’Geospatial’ Data Abstraction Library, R Package Version 1.5–23. Available online: https://cran.r-project.org/web/packages/rgdal/ (accessed on 22 December 2021).
- Hijmans, R.J. Raster: Geographic Data Analysis and Modeling, R Package Version 3.4–5. Available online: https://cran.r-project.org/web/packages/raster/ (accessed on 22 December 2021).
- R Core Team. R: A Language and Environment for Statistical Computing. R Foundation for Statistical Computing: Vienna, Austria. Available online: https://www.r-project.org/ (accessed on 22 December 2021).
- Tree Cover Density 2018—Copernicus Land Monitoring Service. Available online: https://land.copernicus.eu/pan-european/high-resolution-layers/forests/tree-cover-density/status-maps/tree-cover-density-2018 (accessed on 22 December 2021).
- Carslaw, D.C.; Ropkins, K. Openair — an R Package for Air Quality Data Analysis, R Package Version 2.8–6. Available online: https://cran.r-project.org/web/packages/openair/ (accessed on 22 December 2021).
- Gascon, F.; Cadau, E.; Colin, O.; Hoersch, B.; Isola, C.; Fernández, B.L.; Martimort, P. Copernicus Sentinel-2 Mission: Products, Algorithms and Cal/Val. Earth Obs. Syst. XIX 2014, 9218, 92181E. [Google Scholar]
- Signorell, A.; Aho, K.; Alfons, A.; Anderegg, N.; Aragon, T.; Arppe, A. DescTools: Tools for Descriptive Statistics, R package version 0.99. Available online: https://cran.r-project.org/web/packages/DescTools/ (accessed on 22 December 2021).
- Lekkas, E.; Meletlidis, S.; Kyriakopoulos, K.; Manousaki, M.; Mavroulis, S.; Kostaki, E.; Michailidis, A.; Gogou, M.; Mavrouli, M.; Castro-Melgar, I.; et al. The 2021 Cumbre Vieja volcano eruption in La Palma (Canary Islands). Newsl. Environ. Disaster Cris. Manag. Strateg. 2021, 26. [Google Scholar]
- Walker, L.R.; Sikes, D.S.; Degange, A.R.; Jewett, S.C.; Michaelson, G.; Talbot, S.L.; Talbot, S.S.; Wang, B.; Williams, J.C. Biological legacies: Direct early ecosystem recovery and food web reorganization after a volcanic eruption in Alaska. Écoscience 2013, 20, 240–251. [Google Scholar] [CrossRef]
- Jentsch, A.; White, P.S. A theory of pulse dynamics and disturbance in ecology. Ecology 2019, 100, e02734. [Google Scholar] [CrossRef] [PubMed]
- Santos, A. (Instituto Canario de Investigaciones Agrarias en el Jardín Botánico de La Orotava, Tenerife, Spain). Personal communication, 2021.
- Medina, F.M.; Acevedo, A.; Nogales, M. Notas preliminares sobre la afección del volcán a la flora y vegetación de La Palma (octubre 2021). Conserv. Veg. 2021, 25, 54–55. [Google Scholar]
- Irl, S.D.; Harter, D.E.; Steinbauer, M.J.; Gallego Puyol, D.; Fernández-Palacios, J.M.; Jentsch, A.; Beierkuhnlein, C. Climate vs. topography–spatial patterns of plant species diversity and endemism on a high-elevation island. J. Ecol. 2015, 103, 1621–1633. [Google Scholar] [CrossRef]
- Irl, S.D.H.; Schweiger, A.H.; Medina, F.M.; Fernández-Palacios, J.M.; Harter, D.E.; Jentsch, A.; Beierkuhnlein, C. An island view of endemic rarity—Environmental drivers and consequences for nature conservation. Divers. Distrib. 2017, 23, 1132–1142. [Google Scholar] [CrossRef]
- van der Meer, F.; Hecker, C.; van Ruitenbeek, F.; van der Werff, H.; de Wijkerslooth, C.; Wechsler, C. Geologic remote sensing for geothermal exploration: A review. Int. J. Appl. Earth Obs. Geoinf. 2014, 33, 255–269. [Google Scholar] [CrossRef]
- Burns, B. Vegetation change along a geothermal stress gradient at the Te Kopia steamfield. J. R. Soc. N. Z. 1997, 27, 279–293. [Google Scholar] [CrossRef]
- Boothroyd, I.K. Ecological characteristics and management of geothermal systems of the Taupo Volcanic Zone, New Zealand. Geothermics 2009, 38, 200–209. [Google Scholar] [CrossRef]
- Irl, S.D.; Steinbauer, M.J.; Messinger, J.; Blume-Werry, G.; Palomares-Martínez, Á.; Beierkuhnlein, C.; Jentsch, A. Burned and devoured—Introduced herbivores, fire, and the endemic flora of the high-elevation ecosystem on La Palma, Canary Islands. Arct. Antarc. Alp. Res. 2014, 46, 859–869. [Google Scholar] [CrossRef]
- Tausz, M.; Trummer, W.; Goessler, W.; Wonisch, A.; Grill, D.; Naumann, S.; Jimenez, M.S.; Morales, D. Accumulating pollutants in conifer needles on an Atlantic island—A case study with Pinus canariensis on Tenerife, Canary Islands. Environ. Pollut. 2005, 136, 397–407. [Google Scholar] [CrossRef] [PubMed]
- Halmer, M.M.; Schmincke, H.U.; Graf, H.F. The annual volcanic gas input into the atmosphere, in particular into the stratosphere: A global data set for the past 100 years. J. Volcanol. Geotherm. Res. 2002, 115, 511–528. [Google Scholar] [CrossRef]
- Von Glasow, R.; Bobrowski, N.; Kern, C. The effects of volcanic eruptions on atmospheric chemistry. Chem. Geol. 2009, 263, 131–142. [Google Scholar] [CrossRef]
- Manninen, S.; Huttunen, S.; Rautio, P.; Perämäki, P. Assessing the critical level of SO2 for Scots pine in situ. Environ. Pollut. 1996, 93, 27–38. [Google Scholar] [CrossRef]
- Saastamoinen, T.; Holopainen, T. Needle and Root Responses of Small Pinus sylvestris Seedlings Exposed to Sulphur Dioxide and Simulated Acid Rain. Scand. J. For. Res. 1989, 4, 273–283. [Google Scholar] [CrossRef]
- Andres, R.J.; Kasgnoc, A.D. A time averaged inventory of subaerial volcanic sulphur emissions. J. Geophys. Res. Atmos. 1998, 103, 25251–25261. [Google Scholar] [CrossRef]
- Cofano, A.; Cigna, F.; Amato, L.S.; de Cumis, M.S.; Tapete, D. Exploiting Sentinel-5P TROPOMI and ground sensor data for the detection of volcanic SO2 plumes and activity in 2018–2021 at Stromboli, Italy. Sensors 2021, 21, 6991. [Google Scholar] [CrossRef]
- Guermazi, H.; Sellitto, P.; Cuesta, J.; Eremenko, M.; Lachatre, M.; Mailler, S.; Carboni, E.; Salerno, G.; Caltabiano, T.; Menut, L.; et al. Quantitative Retrieval of Volcanic Sulphate Aerosols from IASI Observations. Remote Sens. 2021, 13, 1808. [Google Scholar] [CrossRef]
- Li, C.; Cohen, R.C. Space-borne estimation of volcanic sulfate aerosol lifetime. J. Geophys. Res. Atmos. 2021, 126, e2020JD033883. [Google Scholar] [CrossRef]
- Lamotte, C.; Guth, J.; Marecal, V.; Cussac, M.; Hamer, P.D.; Theys, N.; Schneider, P. Modeling study of the impact of SO2 volcanic passive emissions on the tropospheric sulphur budget. Atmos. Chem. Phys. 2021, 21, 11379–11404. [Google Scholar] [CrossRef]
- Hoffmann, S.; Schmitt, T.M.; Chiarucci, A.; Irl, S.D.; Rocchini, D.; Vetaas, O.R.; Tanase, M.A.; Mermoz, S.; Bouvet, A.; Beierkuhnlein, C. Remote sensing of β-diversity: Evidence from plant communities in a semi-natural system. Appl. Veg. Sci. 2019, 22, 13–26. [Google Scholar] [CrossRef]
- Rocchini, D.; Salvatori, N.; Beierkuhnlein, C.; Chiarucci, A.; de Boissieu, F.; Förster, M.; Garzon-Lopezh, C.; Gillespie, T.; Hauffe, H.C.; He, K.S.; et al. From local spectral species to global spectral communities: A benchmark for ecosystem diversity estimate by remote sensing. Ecol. Inform. 2021, 61, 101195. [Google Scholar] [CrossRef]


Publisher’s Note: MDPI stays neutral with regard to jurisdictional claims in published maps and institutional affiliations. |
© 2022 by the authors. Licensee MDPI, Basel, Switzerland. This article is an open access article distributed under the terms and conditions of the Creative Commons Attribution (CC BY) license (https://creativecommons.org/licenses/by/4.0/).