Article

Effects of Litter Decomposition on Soil N in Picea mongolica Forest at Different Forest Ages

1
College of Forestry, Northeast Forestry University, Harbin 150040, China
2
School of Resource and Environmental Sciences, Chifeng University, Chifeng 024000, China
3
Baiyinaobao National Nature Reserve Management Administration, Baiyinaobao, Chifeng 025350, China
*
Author to whom correspondence should be addressed.
Forests 2022, 13(4), 520; https://doi.org/10.3390/f13040520
Submission received: 27 January 2022 / Revised: 23 March 2022 / Accepted: 24 March 2022 / Published: 28 March 2022
(This article belongs to the Special Issue The Effect of Vegetation Restoration on Forest Soil Nutrients)

Abstract

:
In order to study the effects of litter decomposition on soil nitrogen of Picea mongolica in different forest ages, young forest (0–5a), middle-aged forest (5–30a), and near-mature forest (30–40a) stands were selected in the Baiyinaobao National Nature Reserve. Litter decomposition was assessed using the decomposition bag method. The seasonal and vertical spatial variation characteristics of total N, NH4+—N, and NO3—N caused by litter decomposition in P. mongolica forest soil were studied for different stand ages. Results showed that: (1) There was a positive correlation between litter N content and soil organic matter, total N content, and NO3—N content across different forest ages (p < 0.05). There was a negative correlation between litter N and NH4+—N contents. A negative correlation between litter C content and soil organic matter, total N, and NO3—N contents was also observed. (2) In this study, the total N and NO3—N increased with the increase in N content during litter decomposition.NH4+—N in the soil was positively correlated with sample date, soil NO3—N, and forest age (p < 0.05), and negatively correlated with soil depth (p < 0.01). NO3—N in the soil was negatively correlated with sample date and forest age (p < 0.05), and significantly negatively correlated with soil depth (p < 0.01). (3) the NH4+—N content is greater than that of NO3—N in each soil layer for the three forest ages. The correlation analysis indicated which factors influenced NH4+—N and NO3—N in the soil. The content decreased during February and November and increased in May and August. (4) The total N, NH4+—N, and NO3—N in the forest soils across the three forest ages increased with the depth of the soil layer (0–50 cm) and showed an overall downward trend. The contents of NH4+—N in the soil layer from the young forest (0–10 cm, 10–20 cm and 20–30 cm, 30–40 cm, and 40–50 cm) differed significantly (p < 0.05), as did the NO3—N results (p < 0.05), while results from the middle-aged forest and near-mature forest increased with soil layer depth. There was no significant difference in the NH4+—N soil content. (5) The NH4+—N in the forest soils showed a trend from mature forest > middle-aged forest > young forest. This trend for soil NO3—N content is consistent with that of the NH4+—N content in the Picea mongolica forest soil.

1. Introduction

N is a major macronutrient necessary for plant growth and development, as well as the main limiting factor for forest ecosystem productivity [1,2]. NH4+—N and NO3—N are available N that can be directly absorbed and utilized by plants. Changes in their content in the soil directly affect the migration and transformation of soil N and plant productivity [3]. The N, NH4+—N, and NO3—N contents in the soil of different forest types and surfaces have been found to differ significantly. Many studies have been undertaken on the chemometric characteristics of soil N in forest ecosystems in China and other countries. These include different forest ages [4,5], land use modes [6,7], succession stages [8] altitudes [9,10], tree species [11,12], and more. In recent years, several studies have been conducted on different tree species, as different species have different habitats with different soil physical and chemical properties, soil nutrient composition and distribution within the ecosystem [13,14]. Picea mongolica forest is a rare temperate coniferous species in China, which is mainly distributed in Keshketeng county on the eastern edge of Hunshandak Sandy Land in China. This area has the characteristics of horizontal spatial richness and vertical spatial heterogeneity of grassland in the farming–pastoral transitional zone in north China. However, few studies have been conducted in the P. mongolica forest at the North China forest ecotone. Therefore, it is of great significance to study the characteristics of seasonal variation in soil N in this forest.
P. mongolica is a tree species native to the northern agropastoral ecotone. This species mainly grows on sunny slopes in the mountains at an altitude of 1300–1500 m. To date, few studies have been conducted on the quantitative characteristics of soil N in this ecosystem with a focus on forest age, soil depth, and seasonality. In this study, analyses of variations in forest age, soil depth, and seasonal dynamic changes are combined. We compared and analyzed seasonal dynamic changes in soils at different levels of P. mongolica forest and examined the migration and transformation tendency for total and available N to provide a scientific basis for the management of the P. mongolica forests. The results from this study can provide a reference for use in the management and cultivation of artificial forests.

2. Materials and Methods

2.1. Site Description

The study area is located in the BaiyinOboo Nature Reserve (43°30′–43°36′ N, 117°03′–117°16′ E) in Keshketeng county on the eastern edge of Hunshandak Sandy Land in China, with an area of approximately 1947 km2. The region has a temperate grassland climate, with an average annual temperature of −1.4 °C, an average temperature of −23.4 °C in January, and 17.4 °C in July. The average annual frost-free period is 78 days, with an annual precipitation of 360–440 mm, an average annual evaporation of 1035.6 mm, and an altitude of 1300–1500 m. The soil type is gray forest soil, and the flora belongs to the plant distribution area of Mongolia. In terms of plant species composition, common taxa that are present include P. mongolica, Larix decidua Mill., Juniperussabina var. davurica (Pallas) Farjon, Spiraea aquilegifolia, S. dahurica (Rupr.) Maxim., and Pinus tabuliformis Carr.

2.2. Sample Plot Setting and Collection and Pre-Treatment of Litter

Based on the initial field investigations conducted in early August 2016,three forest areas with young (0–5a), middle-aged (5–30a), and near-mature (30–40a) P. mongolica forest were selected in the Baiyinaobao National Nature Reserve. In each forest stand, three 10 × 10 m2 sampling plots that were in full sun, uniformly distributed, and with good vegetation growth were selected. Five 1 × 1 m2 small quadrats were chosen in an “s” shape within each sample plot. There were 15 small plots in each forest stand. The key vegetation parameters of the sampling plots are shown in Table 1 and monthly average temperature and monthly precipitation in different months is shown in Table 2.
During the period of maximum litter (mainly leaf litter) of P. mongolia in late October 2016, freshly fallen needles (hereafter referred to as “litter”) were collected, placed in airtight bags, and immediately transported to the laboratory. Needles collected from 45 small quadrats of nine plots in three stands were dried at 80 °C until a constant weight was obtained. The litter of three stands having the same mass (1000 g) was completely mixed. Some litter was crushed and screened through a 60 mesh to analyze the initial C, and N contents in the litter of P. mongolia forests.
After drying, the mixed litter (20 g, error less than 0.01 g) was placed into a 15 cm × 15 cm decomposition bag made of 0.15 mm nylon gauze. In November 2016, after removing the surface litter from the sample plots, the decomposition bags containing the litter were returned to the nine sample plots of the three stands. The decomposition bags were placed parallel to the sample plots without overlapping. The litter was kept flat in the net bags to ensure complete contact with the humus layer and as close to the natural decomposition state as possible. Nine litter bags were placed in each sample plot; thus, in total, 27 litter bags were placed in each stand. Samples were collected regularly in March, May, July, September, and November 2017 (as some areas were still covered by snow before March, sample collection prior to March was not conducted). During these months, a litter decomposition bag was retrieved from each of the three plots in each stand, nine bags were collected at a time, and gravel, roots, and plant and animal debris were removed. The litter from the bags in each stand was thoroughly mixed and transported back to the laboratory for further analysis. Subsequently, the litter was continuously dried at 80 °C to obtain constant weight and litter retention. Meanwhile, the litter samples were collected from the three forest types, and the soil under the litter bags of 0~10 cm, 10~20 cm, 20~30 cm, 30~40 cm, and 40~50 cm was collected for indoor treatment and analysis.

2.3. Sample Analysis and Data Statistics

The litter samples retrieved from the same field in each stand were dried to a constant weight at 80 °C, then mixed evenly, crushed, sifted through 60 mesh, and put into ziplocked bags for testing. The litter measurement indexes were total C and total N. Total C of litter was determined using an SSM-TOC analyzer (Shanghai Meta-analysis, Shanghai, China, TOC-L). Total nitrogen (TN) was determined by sulfuric acid-perchloric acid elimination cooking and the Kjeldahl method (Kjeldahl nitrogen meter, Beijing, China, Sanpinkechuang, Spd60). Following air drying of the samples indoors, impurity removal, and grinding through a 100-mesh screen, the soilpH value, total N, NH4+—N, and NO3—N were determined. The pH value of the soil was determined by acidity meter after aqueous solution extraction (soil–water ratio: 1:2.5) (Kcidity meter, Thunder magnetic, Shanghai, China, PHS-2F), total N was determined using H2SO4-H2O2 digestion indophenol blue colorimetry. NH4+—N was determined using indophenol blue colorimetry (UV-Vis Spectrophotometer, Beijing, China, TU-1950) [15]. NO3—N was determined using phenol disulfonic acid colorimetry in China National Standard (determination of NO3—Nin the forest soils) (ly/y1233-1999).
Excel 2017 and SPSS 22.0 software were used for statistical analysis of data. One-way analysis of variance (ANOVA) and least significant difference (LSD) were used for analysis of variance and multiple comparisons (α = 0.05). The Pearson method was used for correlation analysis. Amos 22.0 software was used to establish a structural equation model. The data in Table 3 is the mean ± standard deviation.

3. Results and Analysis

3.1. Chemical Composition of P. mongolica Forest Litter in Different Stands

The nutrient content of litter can be used to measure its quality [16].
As shown in Table 3, during the decomposition of P. mongolica litter, the C and C/N contents in leaf litter of the young, middle-aged, and near-mature forests showed a decreasing trend with time. The C content of leaf litter of the three forest types was from March to November 2017. It decreased by 9.79%, 8.29%, and 7.04%, respectively. In March, there was no significant difference in the C content of litterfall among the three forest ages (p > 0.05), while in May, July, and September, there was significant difference in the C content of litterfall among the three forest ages (p < 0.05). The C/N of the three forest types were from March to November 2017, it decreased by 4.86%, 3.94%, and 3.84%, respectively. In 2017, the C/N contents of litterfall of three forest ages were significantly different between young forest, middle forest age, and near mature forest (p < 0.05), but not between middle forest age and near mature forest (p > 0.05). However, the N content of leaf litter in the young, middle-aged, and near-mature forests increased by 17.99%, 19.34%, and 16.21% from March to November in 2017, respectively. In March, there was no significant difference in N content of litterfall among the three forest ages (p > 0.05), while in May and September, there was a significant difference in N content between young forest, middle forest age, and near mature forest (p < 0.05), and in July, middle forest age, near mature forest, and young forest (p < 0.05). There were significant differences in the age of middle forest, young forest, and near mature forest in November.

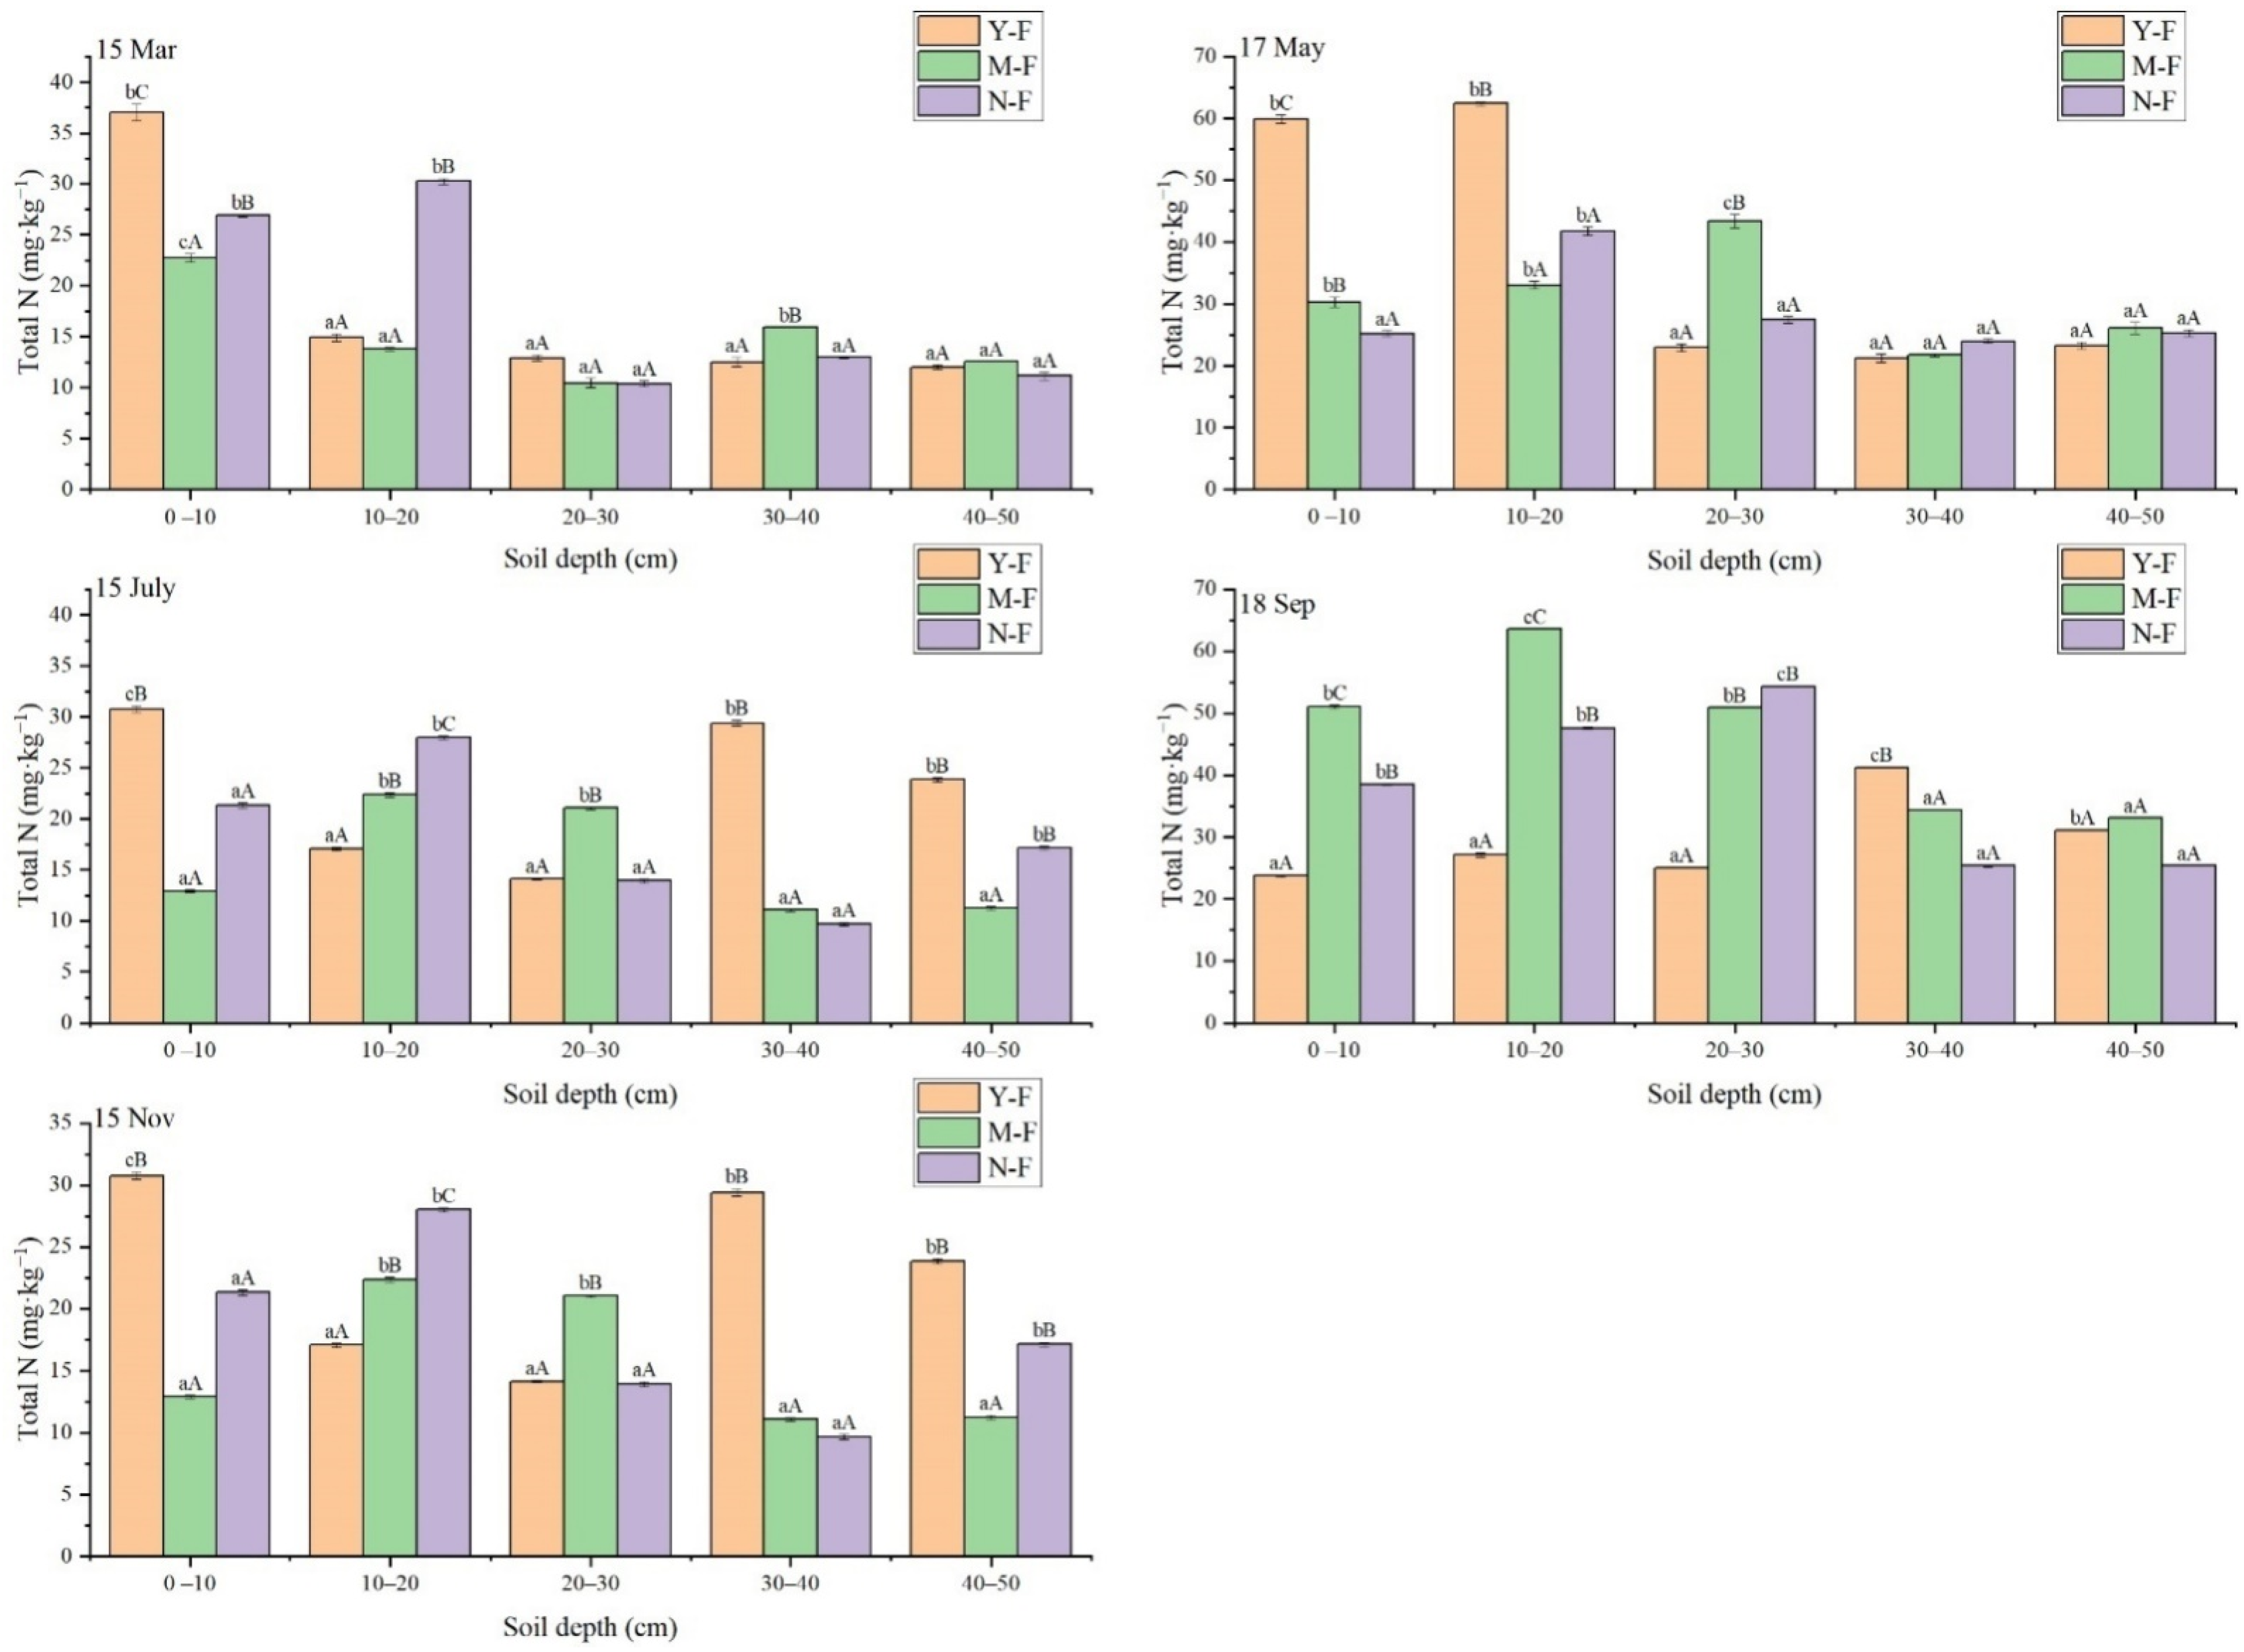
3.2. Seasonal Variation of Soil Total N Content with Soil Depth and Stand Age

During March and November, the total N content of the soils from P. mongolica forest stands across the three age groups showed a downward trend with increasing soil depth (Table 4, Figure 1). There were significant differences in the total N content between 0–10 cm, 10–20 cm, 20–30 cm, 30–40 cm, and 40–50 cm soil layers (p < 0.05). During March and November, the maximum values of total N across the three stand ages were recorded from the 0–20 cm soil layer. The minimum values were recorded from the 30–50 cm soil layer. The average soil total N contents recorded in near-mature, young, and middle-aged forests were 18.32 mg/kg, 17.87 mg/kg, and 15.96 mg/kg, respectively. During November, the average soil total N contents recorded in young, near-mature, and middle-aged forests in this period were 23.04 mg/kg, 18.01 mg/kg, and 15.72 mg/kg, respectively.
By recording the month, soil depth, forest type, pH value, soil temperature, soil humidity, soil organic matter, litter N content, litter carbon content, and litter C/N content as independent variables, a fitted linear regression model for all N was constructed. From the fitted linear results in Table 5, there was a good linear fit for the model with a significant p value of 0.001. The results are shown in Table 4. The total N content across the three forest ages from May, July, and September first increased and then decreased with increasing soil depth. There was a significant difference in the total N content between 0–10 cm, 10–20 cm, 20–30 cm, 30–40 cm, and 40–50 cm (p ˂ 0.05) during May. The maximum age total N contents for young and near-mature forests were recorded from the 10–20 cm soil layer. The maximum age total N content from the middle-aged forest was recorded from the 20–30 cm soil layer. The minimum forest age was recorded from the 30–50 cm soil layer. The average soil total N contents in the young, middle-aged, and near-mature forests were 37.95 mg/kg, 30.96 mg/kg, and 28.73 mg/kg, respectively. In July, the maximum value of total N in young and near-mature forests was recorded from the 10–20 cm soil layer. The maximum total N content from the middle-aged forests was recorded from the 20–30 cm soil layer. The minimum value of total N from three forest age groups was recorded from the 30–50 cm soil layer. The average soil total N contents in the young, middle-aged, and near-mature forests were 38.37 mg/kg, 31.61 mg/kg, and 28.82 mg/kg, respectively. In September, the maximum values of total N from the young and the middle-aged forests were recorded from the 10–20 cm soil layer. The maximum value of total N from the near-mature forest was recorded from the 20–30 cm soil layer. The minimum value across the three forest age groups was recorded in the 30–50 cm soil layer. The average soil total N content recorded in the middle-aged, near-mature, and young forests were 46.62 mg/kg, 38.24 mg/kg, and 29.66 mg/kg, respectively. In 2017, the total N content across the three forest age groups first increased and then decreased over time. In May and July, the highest total N content was recorded across all three forest age groups.
By recording the sampling time, soil depth, forest type, pH value, soil temperature, soil humidity, soil organic matter, litter N content, litter carbon content, and litter C/N content as independent variables, the fitted linear regression model for all n was constructed. From the fitted linear results in Table 5, the regression value hasa significant p-value of 0.013. The results are shown in Table 6.
From the fitted linear results in Table 6, humidity, temperature, and CN ratio of litter and organic matter have had a considerable impact on the level of total N, and the highest contribution rate. Although, the impact of litter N content and pH value is slightly lower, the p-values for all the other influencing factors, except for the above factors, were greater than 0.05, and the results were not significant.

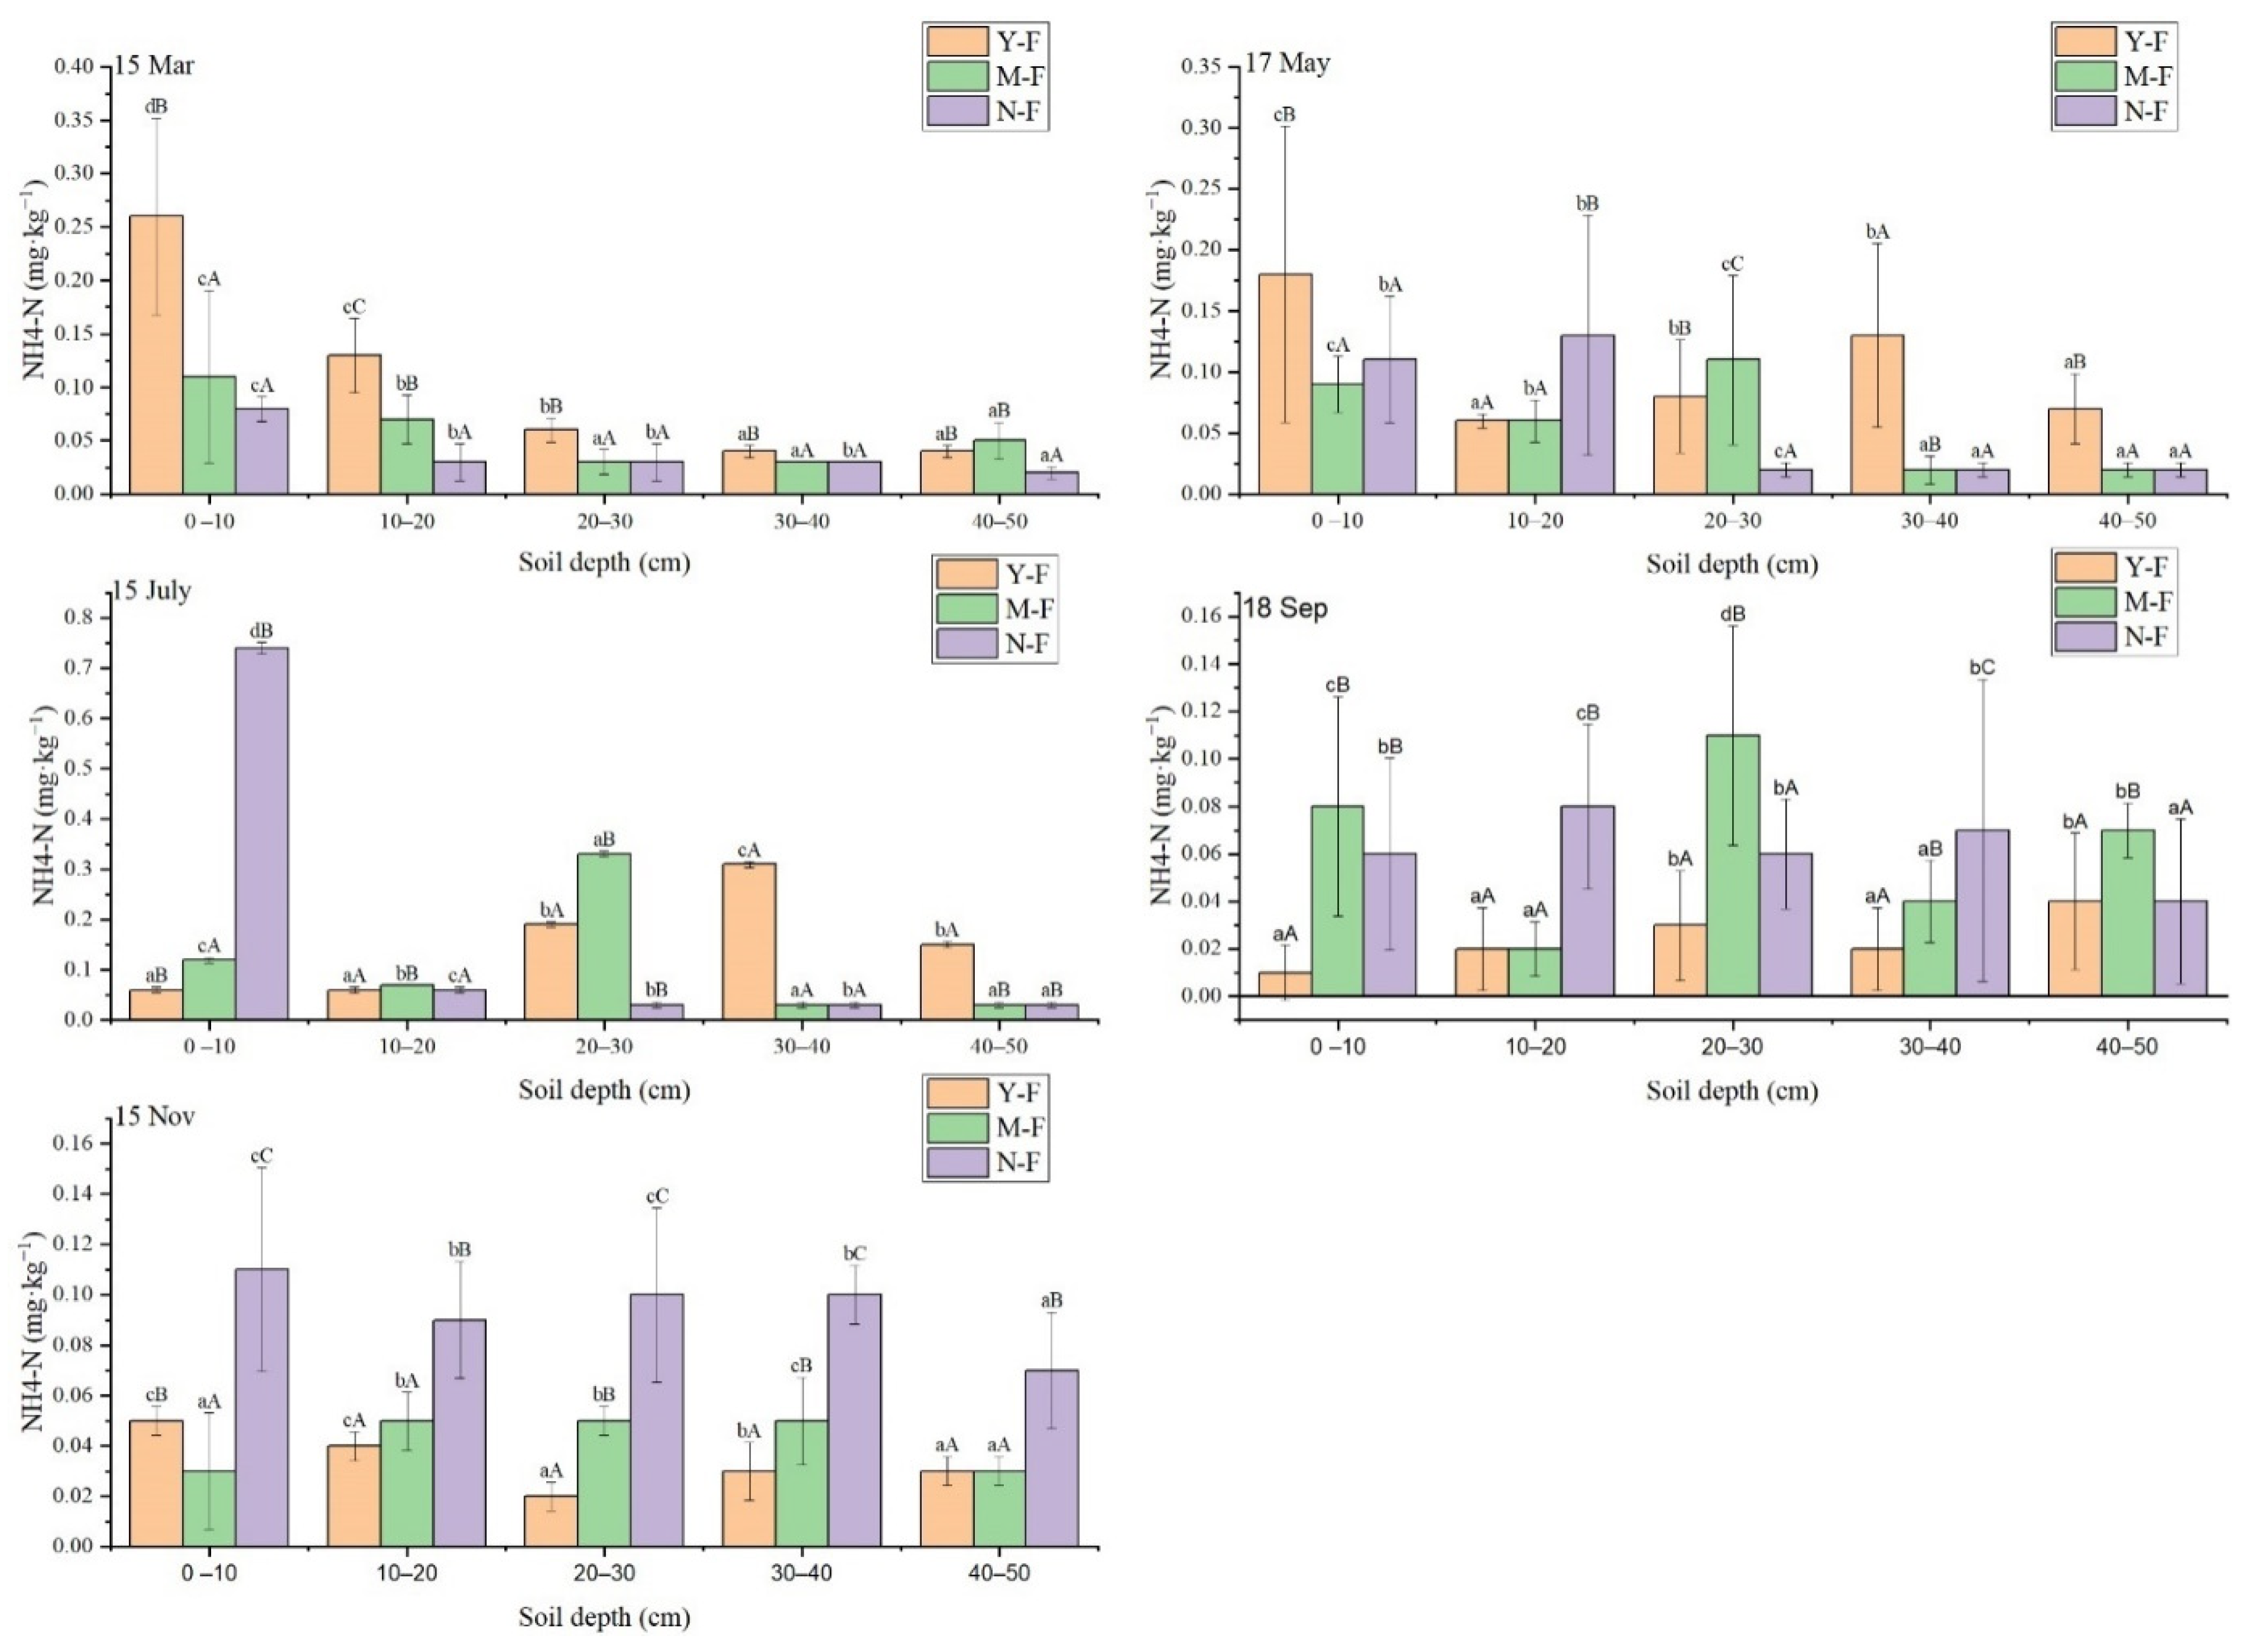
3.3. Characteristics of Seasonal Variation of Soil NH4+—N Content with Soil Depth and Stand Age

In March and November, the content of NH4+—N in soil for the three forest standages showed an overall downward trend with increasing soil depth (Table 4 and Figure 2). There were significant differences in the NH4+—N content in the 0–10 cm, 10–20 cm, 20–30 cm, 30–40 cm, and the 40–50 cm soil layers (p˂0.05).In March, the maximum values of NH4+—N across the three forest ages were recorded from the 0–10 cm soil layer, and the minimum values were recorded in the 30–50 cm soil layer. The average soil NH4+ —N contents of young, middle-aged, and near-mature forests were 0.11 mg/kg, 0.07 mg/kg, and 0.04 mg/kg, respectively. In November, the maximum values of NH4+—N across the three forest ages were recorded from the 0–20 cm soil layer, and the minimum values were recorded from the 30–50 cm soil layer. The average soil NH4+—N content recorded from near-mature, middle-aged, and young forests was0.09 mg/kg, 0.04 mg/kg, and 0.03 mg/kg, respectively. The NH4+—N content across the three forest ages in May, July, and September first increased and then decreased with increasing soil depth. The soil total N contents between the 0–10 cm, 10–20 cm, 20–30 cm, 30–40 cm, and 40–50 cm soil layers differed significantly (p˂0.05). In May, the maximum value of NH4+—N for young and near-mature forests was recorded from the 10–20 cm soil layer. The maximum value of total N for middle-aged forest was recorded from the 20–30 cm soil layer. The minimum value of NH4+—N for the three forest age groups was recorded from the 30–50 cm soil layer. The average soil NH4+—N content recorded from young, middle-aged, and near-mature forests were 0.10 mg/kg, 0.06 mg/kg, and 0.06 mg/kg, respectively. In July, the maximum values of NH4+—N for young and near-mature forests were recorded from the 10–20 cm soil layer. The maximum value of NH4+—N from the middle-aged forest was recorded from the 20–30 cm soil layer. The minimum value of NH4+—N for the three forest age groups was recorded from the 30–50 cm soil layer. The average soil NH4+—N contents recorded for near-mature, young, and middle-aged forests were 0.18 mg/kg, 0.15 mg/kg, and 0.12 mg/kg, respectively. In September, the maximum values of NH4+—N for young and near-mature forests were recorded from the 10–20 cm soil layer. The maximum value of NH4+—N from the middle-aged forest was recorded from the 20–30 cm soil layer. The minimum value of NH4+—N for the three forest age groups was recorded from the 30–50 cm soil layer. The average soil total N contents recorded for middle-aged, near-mature, and young forests were 0.06 mg/kg, 0.06 mg/kg, and 0.04 mg/kg, respectively.
By recording sampling time, soil depth, forest type, pH value, soil temperature, soil humidity, soil organic matter, litter N content, litter carbon content, and litter C/N content as independent variables, the fitted linear regression model for all n was constructed. From the fitted linear results in Table 7, the fitted linear results were good. There was a significant p-value of 0.001.The results are shown in Table 8.
The fitted linear results in Table 8, including humidity, temperature, and CN ratio of litter and organic matter have a considerable impact on total N, and the highest contribution rate. The impact of litter N content and pH value is slightly lower, but the p-values for all other influencing factors, with the exception of litter N content, are less than 0.05, indicating a significant result.

3.4. Characteristics in Seasonal Dynamic Variation of Soil NO3—N Content with Soil Depth and Stand Age

During March and November, the soil NO3—N content across the three forest stand ages first decreased and then increased with increasing soil depth (Table 4 and Figure 3). There were significant differences in NO3—N content between the 0–10 cm, 10–20 cm, and 20–30 cm, 30–40 cm, and 40–50 cm soil layers (p ˂ 0.05).In March, the maximum values for NO3—N across the three forest ages were recorded from the 0–10 cm soil layer. The minimum values were recorded from the 30–40 cm soil layer. The average soil NO3—N contents recorded in the near-mature, middle-aged, and young forests were 14.23 mg/kg, 13.58 mg/kg, and 12.64 mg/kg, respectively. In November, the maximum values of NO3—N across all three forest age groups were recorded from the 0–20 cm soil layer, and the minimum values were recorded from the 30–50 cm soil layer. The average soil NO3—N contents recorded from the near-mature, middle-aged, and young forests were 22.86 mg/kg, 14.83 mg/kg, and 14.23 mg/kg, respectively.
The soil NO3—N content across the three forest ages during May, July, and September first increased and then decreased with increasing soil depth. There was a significant difference in the total N content between the 0–10 cm, 10–20 cm, 20–30 cm, 30–40 cm, and 40–50 cm soil layers (p ˂ 0.05). During May, the maximum values of NO3—N from young and near-mature forests were recorded from the 10–20 cm soil layer. The maximum value of NO3—N from the middle-aged forest was recorded from the 20–30 cm soil layer. The minimum value of NO3—N from the three forest age groups was recorded from the 30–50 cm soil layer.The average soil NO3N contents recorded from near-mature, middle-aged, and young forests were 34.99 mg/kg, 29.14 mg/kg, and 27.04 mg/kg, respectively. In July, the maximum values of NO3—N from young and near-mature forests were recorded from the 10–20 cm soil layer. The maximum value of NO3—N from the middle-aged forest was recorded from the 20–30 cm soil layer. The minimum value of NO3—N fromthe three forest age groups was recorded from the 30–50 cm soil layer. The average soil NO3—N content recorded for young, middle-aged, and near-mature forests was 35.20 mg/kg, 29.83 mg/kg, and 25.18 mg/kg, respectively. In September, the maximum values for NO3—N in young and middle-aged forests were recorded from the 0–20 cm soil layer. The maximum value for NO3—N in near-mature forests was recorded from the 20–30 cm soil layer. The minimum value of NO3—N from the three forest age groups was recorded from the 30–50 cm soil layer. The average soil NO3—N content recorded for middle-aged, near-mature, and young forests was 36.85 mg/kg, 29.37 mg/kg, and 24.83 mg/kg, respectively.
In 2017, the soil NO3—N increased first and then decreased over time. In May and July, the total N content for the three forest age groups was the highest recorded during the study.
By recording the sampling time, soil depth, forest type, pH value, soil temperature, soil humidity, soil organic matter, litter N content, litter carbon content, and litter C/N content as independent variables, the fitted linear regression model for all N was constructed. From the fitted linear results in Table 9, the p-value was significant at 0.001. The results are shown in Table 10.
From the fitted linear results in Table 10, humidity, temperature, and CN ratio of litter and organic matter have a considerable impact on the total N, and the highest contribution rate. The impact of litter N content and pH value is slightly lower, but the p-values for all other influencing factors, with the exception of litter N content, are less than 0.05, indicating a significant result.

3.5. Correlation between Soil Total N, NH4+—N, NO3—N Content and Month, Soil Depth, and Forest Age

The total soil N in the P. mongolica forest has a positive correlation with the sampling time, with a correlation coefficient of 0.394, a significant negative correlation with litter C content and litter CN ratio, with correlation coefficients of −0.120 and −0.129, respectively, and a positive correlation with ammonium N, temperature, humidity, litter N content, and soil organic matter content (Table 11). However, there is no significant correlationwith soil depth, nitrate N and pH value also show a negative correlation. NH4+—N had a significant negative correlation with soil depth and pH value, and the correlation coefficients were 0.228 and −0.222, respectively. There was a significant positive correlation with forest type, temperature, humidity, and soil organic matter content, and the correlation coefficients were 0.47, 0.236, 0.388, and 0.264, respectively. There was little positive correlation with years, but with nitrate N, litter C content, and litter N content, the litter CN rate showed a negative correlation. NO3—N had a positive correlation with year, temperature, and humidity, with clear significance. The correlation coefficients were 0.44, 0.157, and 0.265, respectively. There was a significant negative correlation with pH, with a correlation coefficient of −0.140. There was a weak positive correlation with soil depth, forest stand, and litter N content, and a weak negative correlation with total N, ammonium N, litter C content and litter CN rate.

4. Discussion

4.1. Effects of Litter Addition on the Contents of Total N, NH4+—N, and NO3—N in the Soil of P. mongolica Forest

Forest litter is the main source of soil nutrients, and nutrients are returned to the soil following decomposition [3]. This study found that there was a positive correlation between litter N content and soil organic matter, total N content, and NO3—N content across different forest ages. High N content in the litter and high soil organic matter, total N, and NO3—N contents were observed. There was a negative correlation between litter N and NH4+—N contents. A negative correlation between litter C content and soil organic matter, total N, and NO3—N contents was also observed. In this study, the total N and NO3—N increased with the increase in N content during litter decomposition. The results are similar to those of the Harvard Forest pine plantation in Petersham, Massachusetts, USA [15] and the Masson pine plantation in Hengxian Town, Nanning, Guangxi, China [4]. It is possible that N input increases the content of mineral N in the soil and litter layers, buffering the competition between plant absorption and nitrobacteria, as well as denitrifying bacteria for N, increasing nitrification and denitrification, and then increasing soil-available N [17]. The results showed that P. mongolica forest soil nitrification originated from ammoniated NH4+-N, and the change of nitrification rate was directly affected by ammoniation. The nitrification rate was usually lower than the ammoniation rate, and the promotion effect of nitrogen addition excitation effect on NH4+-N was higher than that of NO3-N. The effect of nitrogen addition on net nitrification rate was not obvious [18].This may also be related to the mineralization and fixation of N. The addition of N improves the soil nitrification process, resulting in more N in the form of NO3—N [19]. As the increased N is absorbed by soil organic matter, C/N decreases, which improves the release rate of N during decomposition [20]. It is also possible that the added inorganic N is fixed by microorganisms, which promotes the mineralization and release of the original organic N [21].

4.2. Effects of Environmental Factors on the Contents of Total N, NH4+—N, and NO3—N the Soil of P. mongolica Forest

The change in soil N content is affected by various environmental factors such as soil temperature, moisture, and pH. Differences in temperature, humidity, and litter supply in different niches affect N mineralization by influencing the number, species, and vitality of different microbial groups in the forest [20].
In this study, a positive correlation was observed between temperature and soil total N, NH4+—N, and NO3—N. The contents of total N, NH4+—N, and NO3—N increased with increasing temperature. This was similar to the research results of soil nitrogen mineralization in karst native tree forest studied by Zhao et al. [18]. The monthly dynamic change of soil available nitrogen is the result of P. mongolica growth and soil microbial activity, because both are controlled by temperature and moisture. With the increase in temperature and humidity within a certain threshold, the microbial and enzyme activities were higher, and the decomposition of litters was faster, which accelerated the nitrogen mineralization process and increased the soil available nitrogen contents [18]. The contents of total N, NH4+—N, and NO3—N on the soil surface of young, middle-aged, and near-mature forests were all the highest in July, and the lowest in November. This may be because the increase in temperature increases the availability of soil ammonia N and nitrate N, as the NH4+—N of forest soil ammonification is the source of nitrification, with ammonification directly affecting the change in nitrification rate. The nitrification rate is often lower than the ammoniation rate [22]. The increase in temperature promotes the denitrification of the surface soil. In addition, when the temperature increases, the microbial growth and metabolism activity is enhanced and a large amount of organic matter is decomposed. This improves the mineralization rate of soil N and significantly increases the content of N in the soil [23]. Temperature change can also change the mineralization rate of N in the soil by affecting soil water content [24].
Soil moisture content is an important factor in the process of soil N transformation. In this study, the soil total N, NH4+—N, and NO3—N were positively correlated with soil moisture, and the contents of NH4+—N and NO3—N were significantly correlated with soil moisture. This may be because the joint action of soil water content and other soil physical and chemical properties can significantly alter the porosity and pore distribution of soil. This affects the circulation of oxygen in soil, which in turn affects the activity of microorganisms [24]. The region has a short summer (July–August) with high temperature and high humidity. The short-term increase in temperature and water can significantly improve the activity of soil microorganisms, which is conducive to their growth and reproduction. This can change the contents of soil total N, NH4+—N, and NO3—N. As drought and low temperatures weaken biological activities, the litter decomposition rate decreases to a certain extent with low temperatures during winter (November) and during low precipitation (May).
Soil pH and other pH can directly or indirectly affect other properties and are the main variables affecting soils [25,26]. In this study, soil pH was negatively correlated with soil total N, NH4+—N, and NO3—N, as well as with NH4+—N and NO3—N. This is similar to the research results of a moist evergreen broad-leaved forest of WawuMountain by Chen et al. [27]. Lower pH will limit the growth of soil denitrifying microorganisms. However, lower pH may reduce the availability of organic carbon and mineral N available to denitrifying microorganisms [28].

4.3. Effects of Seasonal Variation on the Contents of total N, NH4+—N, and NO3—N in the Soil of P. mongolica Forest

In the current study, the total N content of P. mongolica forest across three different stand ages increased first and then decreased over time during 2017. The total N content for the three forest ages was the highest during May and July. The content of NH4+—N across the three forest ages and in each soil layer is greater than that of NO3—N, which is consistent with the research results of decomposition of leaf litter of Picea crassifolia Forest in the Qilian Mountains [11]. This is because the N element mainly exists in the form of organic matter, and its release needs to be decomposed by microorganisms. In summer, microbial activity begins to increase, which promotes the decomposition of the N element [29]. This indicates that NH4+—N is the main form of soil available N. Correlation analysis showed that seasonal dynamic changes had an effect on the NH4+—N and NO3—N in the P. mongolica soil layer. The content was lower than in March and November, and higher during May and July [3]. This may be because the weather warmed up during May, the snow melted, the soil temperature and humidity increased at the same time, the soil microbial activity began to increase, and the N mineralization, especially the ammoniation, increased [17]. This resulted in a large amount of decomposition of the N in the litter, and the contents of NH4+—N and NO3—N in P. mongolica forest soil for each forest age would have increased. The P. mongolica then entered the growing season, and with the continuous increase in temperature, it needs to absorb a large amount of NH4+—N [30,31]. Part of the NH4+—N is transformed into NO3—N through the action of nitrifying microorganisms. With the increase in rainfall, NH4+—N and NO3—N entered the deep soil layer through the leaching of rainwater. The NH4+—N content then decreases to a certain extent. The high content during July was due to the slow growth of P. mongolica during autumn. The reduction in NH4+—N absorption and its relative accumulation, is consistent with the results of NH4+—N and NO3—N in temperate forest soils studied by Xu et al. [3]. Zhao et al. [18] showed that soil with a low temperature in winter still had an obvious nitrogen mineralization process. In November, the contents of NH4+—N and NO3—N in P. mongolica soils were 0–20 cm. The contents of the soil surface layer were greater than that at depths of 30–50 cm. The main reason for this is that the northern temperate zone enters winter in October, the weather is cold, and the soil is covered with ice and snow. Low temperatures will inhibit the activities of soil microorganisms, weaken the humic effect and slow decomposition rates, which hinders the mineralization of soil [30]. In addition, winter is the non-growing season, and the P. mongolica needs less nitrogen, and the available nitrogen is abundant in the soil.

4.4. Effect of Soil Depth on the Contents of Total N, NH4+—N, and NO3—N in the Soil of P. mongolica Forest

Results showed that the total N, NH4+—N, and NO3—N in P. mongolica soils decreased with increasing soil depth (0–50 cm), There were significant differences between 0–10 cm, 10–20 cm, 20–30 cm, 30–40 cm, and 40–50 cm soil layers (p ˂ 0.05). This is consistent with trends in soil N content with increasing soil depth in forests in the Qinghai Province as well as the alpine forests in western Sichuan [31,32]. This is because the process of decomposition and synthesis of litter returns N to the soil. On the soil surface, the N content mainly comes from litter decomposition. While litter is mainly concentrated on the soil surface, nutrients also accumulate there. Good ventilation and hydrothermal conditions on the soil surface provide a better environment for microbial activities, therefore promoting the accumulation of N content at the soil surface. Then the N migrates and diffuses down to the mineral soil layer with water or other media. In the deeper soil layers, the N content is mainly derived from roots, root exudates, soil microorganisms, and N leaching from some of the upper layers. Compared with the soil surface layer, the exchange with the outside world is weak [33]. In addition, with the deepening of the soil layer, plant roots, soil animals, and microorganisms absorb and utilize nutrients. As a result, the total N, NH4+—N, and NO3—N in P. mongolica soils decreased with the increase in soil depth (0–50 cm). This is consistent with the results of Qin et al. [34] on soil nutrients in different forest types with Masson pine (Pinus massoniana Siebold and Zucc.).

4.5. Effects of Forest Age on the Contents of Total N, NH4+—N, and NO3—N in the Soil of P. mongolica Forest

This study has shown that the content of soil NH4+—N during March and November was significantly different from that of May and August (p ˂ 0.05).The NH4+—N content in the soil of the P. mongolica forest generally showed a trend of near-mature forest > middle-aged forest > young forest. The trend in soil NO3—N content is consistent with that of P. mongolica soil NH4+—N content. This is similar to the resultson Larch plantation [35] and P. massoniana plantation [36] in different years. Itmay be that during the growth of the P. mongolica forest, the P. massoniana at different growth stages have different nutrient needs, which can lead to differences in nutrient content in their own organs and litter. At the stage of P. mongolica young forest to middle-aged forest, there was agradual increase in biomass and canopy density of P. mongolica forest, decrease in understory vegetation and water and deficiency in understory light. As the P. mongolica entered into the mature stage, all the conditions became better by self-thinning, natural pruning, etc. The light conditions under the forest were improved. The vegetation under the forest developed rapidly. The soil surface litter and animal and plant residues gradually increased, the soil texture has been greatly improved, and the number and variety of microorganisms are various and active. They decompose the soil surface litter and animal and plant residues, resulting in an increase in soil nutrients NH4+—N and NO3—N [4,37,38]. Due to the demand for N in different growth stages of P. mongolica, the demand for soil N in young and middle-aged forest stages is high. After the forest has reached maturity, due to the slow and stable growth of P. mongolica, the utilization rate of soil N may be lower. In addition, the deeper the soil has roots growing in the near-mature forest of P. mongolica, the more conducive it is to the absorption of deep-seated soil nutrients. This also leads to the highest contents of NH4+—N and NO3—N at the soil surface when the forest reaches maturity [35].

5. Conclusions

The nutrient release of P. mongolica litter was affected by decomposition time in three forest ages (young, middle-aged, and near-mature forest). The content of C and C/N in litters of young, middle-aged, and near-mature forests decreased with the increase in decomposition time. There was significantly different C content of litters at different ages (p < 0.05). N content in litters increased with time. There was significantly different N content of litter at different ages (except March) (p < 0.05). The effects of litter addition on total N, NH4+—N, and NO3—N in P. mongolica soil were positively correlated. The changes of total N and NH4+—N contents in P. mongolica forest were as follows: near-mature forest > middle-age forest > young forest. The contents of NH4+—N and NO3—N in P. mongolica forest were affected by seasonal dynamics and soil temperature and humidity. The content was lower in March and November, and higher in May and September. NH4+—N in all soil layers of P. mongolica was greater thanNO3—N in the same month. Total N, NH4+—N, and NO3—N decreased with the increase in soil depth (0–50 cm). There was significantly different NO3—N content (p < 0.05), while there was no significantly different in NH4+—N content between middle-age forest and near mature forest with the increase in soil depth.
In this study, we focus on the decomposition of fresh leaf litter and the release of some nutrient elements in P. mongolica soil within one year, and the effects of fresh leaf litter decomposition on N elements in P. mongolica soil of different forest ages has been analyzed. Due to the environment in the agro-pastoral ecotone in northern China and the interaction between the environment and litter-soil of different ages of P. mongolica forest, soil nutrients are the key factors of the decomposition environment of P. mongolica litter-soil. The interaction between soil nutrients and the decomposition characteristics of P. mongolica litter-soil is diverse and complex. The changes of leaf structure and the relationship between quantification and habitat factors of P. mongolica leaf litter need further study in the later stage.

Author Contributions

Conceptualization, L.C. and Y.L.; methodology, Y.L.; validation, Y.L., L.C. and W.D.; formal analysis, X.L.; investigation, Y.B. and Y.L.; resources, Y.L., L.C., W.D. and Y.B.; data curation, Y.L. and X.L.; writing—original draft preparation, Y.L.; writing—review and editing, Y.L., L.C. and W.D.; visualization, Y.L., L.C. and W.D.; supervision, W.D.; project administration, Y.L. and Y.B. All authors have read and agreed to the published version of the manuscript.

Funding

This research was funded by The Natural Science Foundation of Inner Mongolia (Project 2017MS0327),and The Inner Mongolia autonomous region of institutions of higher learning scientific research projects (Project NJZZ22176).

Data Availability Statement

Not applicable.

Acknowledgments

We are grateful to friends who assisted with fieldwork, especially Yichao Wang. We thank the Baiyinaobao National Nature Reserve Management Administration staff for enabling this research.

Conflicts of Interest

The authors declare no conflict of interest.

References

  1. Grant, R.F. Nitrogen Mineralization Drives the Response of Forest Productivity to Soil Warming: Modelling in Ecosys vs. Measurements from the Harvard Soil Heating Experiment. Ecol. Model. 2014, 288, 38–46. [Google Scholar] [CrossRef]
  2. Ma, H.F.; Xie, M.Y.; Hu, H.; Guo, Y.X.; Ren, C.J.; Zhao, F.Z. Effects of Stoichiometric Characteristics of Soil-plant-litter on soil nitrogen components in different forests along an elevational gradient of Qinling Mountains. Chin. J. Ecol. 2020, 39, 749–757. Available online: http://www.cje.net.cn/CN/Y2020/V39/I3/749 (accessed on 25 December 2021).
  3. Xu, C.Q.; Chen, L.X.; Yan, Y.Q.; Ji, X. Seasonal dynamic characteristics of ammonium-nitrogen and nitrate nitrogen contents in soil in temperate forests. J. Northeast For. Univ. 2008, 10, 19–21. [Google Scholar]
  4. Pan, F.J.; Liang, Y.M.; Ma, J.M.; Yang, Z.Q.; Ling, T.W.; Li, M.J.; Lu, S.H.; Zhong, F.Y. Stand Age and Density Affected Litter Nutrient Changes in Planted Pinus Massoniana Forests. Guihaia 2020, 40, 237–246. [Google Scholar] [CrossRef]
  5. Yang, X.; Chen, L.H.; Zheng, X.L. Ecological Stoichiometry Characterization of Soil Carbon, Nitrogen, and Phosphorus of Pinus tabuliformis Plantations at Different Stand Ages. Sci. Soil Water Conserv. 2021, 19, 108–116. [Google Scholar] [CrossRef]
  6. Fang, L.N.; Yang, X.D.; Du, J. Effects of Land Use Pattern on Soil Microbial Biomass Carbon in Xishuangbanna. Chin. J. Appl. Ecol. 2011, 22, 837–844. [Google Scholar] [CrossRef]
  7. Xu, J.F.; Zhao, J.H.; Yuan, Z.X.; Jin, X.M.; Chen, B.; Guan, Q.W.; Gao, Y. Effects of Tree Species and Land use Patterns on Soil Microbial Biomass Carbon & Nitrogen. J. Cent. South Univ. For. Technol. 2018, 38, 95–100. [Google Scholar] [CrossRef]
  8. Hu, Y.S.; Yao, X.Y.; Liu, Y.H. N and P Stoichiometric Traits of Plant and Soil in Different Forest Succession Stages in Changbai Mountains. Chin. J. Appl. Ecol. 2014, 25, 632–638. Available online: http://www.cjae.net/CN/Y2014/V25/I3/632 (accessed on 25 December 2021).
  9. Wang, X.M.; Yan, B.G.; Zhao, G.; Shi, L.T.; Liu, G.C.; Fang, H.D. Effects of Microorganism on Carbon, Nitrogen and Phosphorus of Dodonaea viscosa and the Soils from Different Elevations in Yuanmou, Yunnan, China. Chin. J. Plant Ecol. 2017, 41, 311–324. [Google Scholar] [CrossRef]
  10. Zhang, S.S.; Li, A.Q.; Wang, H.R.; Wang, J.J.; Xu, X.N. Ecological Stoichiometry of Soil Carbon, Nitrogen and Phosphorus in Cunninghamia lanceolata Plantation Across an Elevation Gradient. Ecol. Environ. Sci. 2020, 29, 97–104. [Google Scholar] [CrossRef]
  11. Zhao, W.J.; Liu, X.D.; Jing, M.; Zhang, X.L.; Che, Z.X.; Jing, W.M.; Wang, S.L.; Niu, Y.; Qi, P.; Li, W.J. Ecological Stoichiometric Characteristics of Carbon, Nitrogen and Phosphorus in Leaf-Litter-Soil System of Picea crassifolia Forest in the Qilian Mountains. Acta Pedol. Sin. 2016, 53, 477–489. [Google Scholar] [CrossRef]
  12. Meng, Y.; Xue, J.Y.; Sha, L.Q.; Tang, J.W. Variations of Soil NH4-N, NO3—Nand N Mineralization under Different Forests in Xishuang-banna, Southwest China. Chin. J. Plant Ecol. 2001, 25, 99–104. Available online: https://www.plant-ecology.com/CN/Y2001/V25/I1/99 (accessed on 25 December 2021).
  13. Castro, H.F.; Classen, A.T.; Austin, E.E.; Norby, R.J.; Schadt, C.W. Soil Microbial Community Responses to Multiple Experimental Climate Change Drivers. Appl. Environ. Microbiol. 2010, 76, 999–1007. [Google Scholar] [CrossRef] [PubMed] [Green Version]
  14. Bai, X.F.; Xu, F.L.; Wang, W.L.; Zhao, Y.F.; Wang, L.L.; Sun, P.Y. Ecological Stoichiometry of Soil Carbon, Nitrogen and Phosphorus in a Larix Principis Rupprechtii Plantation. Sci. Soil Water Conserv. 2015, 13, 68–75. [Google Scholar] [CrossRef]
  15. Magill, A.H.; Aber, J.D.; Berntson, G.M.; McDowell, W.H.; Nadelhoffer, K.J.; Melillo, J.M.; Steudler, P. Long-Term Nitrogen Additions and Nitrogen Saturation in Two Temperate Forests. Ecosystems 2000, 3, 238–253. [Google Scholar] [CrossRef]
  16. Lv, R.H.; Li, G.L.; Liu, Y.; Jia, L.M.; Jiang, P.; Lin, N. Decomposition Characteristics of coniferous Litter under Different Site Conditions in a Larix principis-rupprechtii Plantation. Sci. Silvae Sin. 2012, 48, 31–37. [Google Scholar] [CrossRef]
  17. Liu, Z.J.; Lin, W.S.; Yang, Z.R.; Lin, T.W.; Liu, X.F.; Chen, Y.M.; Yang, Y.S. Effects of Soil Warming and Nitrogen Deposition on Available Nitrogen in a Young Cunninghamia lanceolata Stand in Mid-Subtropical China. Acta Ecol. Sin. 2017, 37, 44–53. [Google Scholar] [CrossRef]
  18. Zhao, W.J.; Liu, Y.T.; Tan, C.J.; Cui, Y.C.; Wu, P.; Hou, Y.J.; Liu, Y.H.; Ding, J.J. Effects of simulated nitrogen deposition on soil nitrogen mineralization in karst primary forest. J. Cent. South Univ. For. Technol. 2021, 41, 124–133. [Google Scholar] [CrossRef]
  19. Zhang, G.S.; Deng, H.J.; Du, K.; Lin, Y.M.; Ma, R.F.; Yu, W.; Wang, D.J.; Wu, C.Z.; Hong, W. Soil Stoichiometry Characteristics at Different Elevation Gradients of a Mountain in an Area with High Frequency Debris Flow: A Case Study in Xiaojiang Watershed, Yunnan. Acta Ecol. Sin. 2016, 36, 675–687. [Google Scholar] [CrossRef]
  20. Chen, L.X.; Huang, L.Y.; Qiao, L.; Duan, W.B.; Ji, X.; Yu, Y.C. Influence of Simulated Nitrogen Deposition Mineralization Rate under Different Temperate Forest Stands. J. Soil Water Conserv. 2012, 26, 139–146. [Google Scholar] [CrossRef]
  21. Zhang, L.; Huang, J.H.; Bai, Y.F.; Han, X.G. Effects of Nitrogen Addition on Net Nitrogen Mineralization in LeymuschinensisGraassland, Inner Mongolia, China. Chin. J. Plant Ecol. 2009, 33, 563–569. Available online: https://www.plant-ecology.com/CN/Y2009/V33/I3/56 (accessed on 25 December 2021). [CrossRef]
  22. Fang, Y.T.; Mo, J.M.; Zhou, G.Y.; Per Gundersen, L.D.J.; Jiang, Y.Q. The Short-Term Responses of Soil Available Nitrogen of Dinghushan Forests to Simulated N Deposition in Subtropical China. Acta Ecol. Sin. 2004, 24, 73–80. Available online: https://www.ecologica.cn/stxb/article/abstract/040730?st=search (accessed on 25 December 2021).
  23. Hester, E.R.; Harpenslager, S.F.; van Diggelen, J.M.H.; Lamers, L.L.; Jetten, M.S.M.; Lüke, C.; Lücker, S.; Welte, C.U. Linking Nitrogen Load to the Structure and Function of Wetland Soil and Rhizosphere Microbial Communities. mSystems 2018, 3, e00214-17. [Google Scholar] [CrossRef] [PubMed] [Green Version]
  24. Barton, L.; Murphy, D.V.; Butterbach-Bahl, K. Influence of Crop Rotation and Liming on Greenhouse Gas Emissions from a Semi-Arid Soil. Agric. Ecosyst. Environ. 2013, 167, 23–32. [Google Scholar] [CrossRef]
  25. ŠImek, M.; Cooper, J.E. The Influence of Soil pH on Denitrification: Progress Towards the Understanding of This Interaction over the Last 50 Years. Eur. J. Soil Sci. 2002, 53, 345–354. [Google Scholar] [CrossRef]
  26. Deng, X.H.; Cai, X.; Tian, F.; Cai, Y.F.; Tian, M.H.; Zhang, L.M.; Zhang, M.F. pH and Main Nutrients of Tobacco-Growing Soils and Their Relations in Western Hunan. Soils 2017, 49, 49–56. [Google Scholar] [CrossRef]
  27. Chen, G.T.; Li, S.; Peng, T.C.; Qiu, X.R.; Chen, Y.Q.; Ma, H.Y.; Tu, L.H. Effect of Root Isolation and Nitrogen Addition on Soil Carbon and Nitrogen Component in a Moist Evergreen Broad-Leaved Forest. Chin. J. Appl. Environ. Biol. 2018, 24, 125–131. [Google Scholar] [CrossRef]
  28. Xu, Y.B.; Xu, Z.H.; Cai, Z.C. Progresses in Research on Denitrification in Tropical and Subtropical Soils of Terrestrial Ecosystems. Ecol. Environ. Sci. 2014, 23, 1557–1566. Available online: http://www.jeesci.com/CN/Y2014/V23/I9/1557 (accessed on 25 December 2021).
  29. Wang, X.; Gao, M.D.; Yang, F.; Guo, Y.P.; Ma, C.M. Litter Decomposition and Nutrient Dynamics of LarixPrincipis-Rupprechtii Plantations of Different Ages. J. Northeast For. Univ. 2012, 40, 56–60, 66. [Google Scholar] [CrossRef]
  30. Glass, A.D.M.; Siddiqi, M.Y. Nitrogen Absorption by Plant Roots; Srivastava, H.S., Singh, R.P., Eds.; Nitrogen Nutrition in Higher Plants; Associated Publishing Co.: New Delhi, India, 1995; pp. 21–56. [Google Scholar]
  31. Li, X.Y.; Zhang, W.Y.; Liu, F.; Zhang, Z.M.; He, T.B.; Lin, C.H. The Distribution Characteristics of Soil Carbon, Nitrogen and Phosphorus at Different Altitudes in Fanjing Mountain. Res. Soil Water Conserv. 2016, 23, 19–24. [Google Scholar] [CrossRef]
  32. Wang, Y.L.; Zi, H.B.; Cheng, R.X.; Tang, L.T.; Suoer Azhi, L.X.P.; Li, J.; Wang, C.T. Forest Soil Organic Carbon and Nitrogen Storage and Characteristics of Vertical Distribution in Qinghai Province. Acta Ecol. Sin. 2019, 39, 4096–4105. [Google Scholar] [CrossRef]
  33. Wang, S.P.; Zhou, G.S.; Lu, Y.C.; Zou, J.J. Distribution of Soil Carbon, Nitrogen and Phosphorus Along Northeast China Transect (NECT) and Their Relationships with Climatic Factors. Chin. J. Plant Ecol. 2002, 26, 513–517. Available online: https://www.plant-ecology.com/CN/Y2002/V26/I5/513 (accessed on 25 December 2021).
  34. Qin, J.; Kong, H.Y.; Liu, H. Stoichiometric Characteristics of Soil C, N, P and K in Different Pinus Massoniana Forests. J. Northwest. Agric. For. Univ. 2016, 44, 68–76. [Google Scholar] [CrossRef]
  35. Wang, P.A.; Ren, X.M.; Bo, F.J.; Zhang, Y.X.; Guo, J.P. Analysis on Soil Stoichiometric Characteristics and Soil Physico Chemical Properties of Larix principis-rupprechtii Plantations in Different Forest Ages in Guandi Mountain. J. Shanxi Agric. Sci. 2020, 48, 956–963. Available online: https://sxlx.cbpt.cnki.net/WKB3/WebPublication/paperDigest.aspx?paperID=ff65f658-9c16-4de5-aa05-11d0093ce5e3 (accessed on 25 December 2021).
  36. Cui, N.J.; Zhang, D.J.; Liu, Y.; Zhang, J.; Ou, J.; Zhang, J.; Deng, C.; Ji, T.W. Plant Diversity and Soil Physicochemical Properties under Different Aged Pinus Massoniana Plantations. Chin. J. Ecol. 2014, 33, 2610–2617. Available online: http://www.cje.net.cn/CN/Y2014/V33/I10/2610 (accessed on 25 December 2021).
  37. Wang, D.; Dai, W.; Wang, B.; Li, P.; Deng, Z.F.; Zhao, C. Changes of Soil Properties at Different Developmental Stages of Chinese Fir Plantations. J. Beijing For. Univ. 2010, 32, 59–63. [Google Scholar] [CrossRef]
  38. Peng, Y.H.; Tan, C.Q.; Shen, W.H.; Zheng, W.; He, Q.F.; He, F.; Chen, S.G. Effects of Differt Forest Age on Soil Physical and Chemical Properties of Cunninghamia lanceolata Plantations. Guangxi For. Sci. 2020, 49, 361–367. [Google Scholar] [CrossRef]
Figure 1. Plot of soil total nitrogen variation with soil depth. Lowercase letters represent the significant difference of different soil layers in the same forest age, and uppercase letters represent the significant difference of different forest ages in the same soil layer.
Forests 13 00520 g001
Figure 2. Plot of soil NH4+—N variation with soil depth. Lowercase letters represent the significant difference of different soil layers in the same forest age, and uppercase letters represent the significant difference of different forest ages in the same soil layer.
Forests 13 00520 g002
Figure 3. Plot of soil NO3—N variation with soil depth. Lowercase letters represent the significant difference of different soil layers in the same forest age, and uppercase letters represent the significant difference of different forest ages in the same soil layer.
Forests 13 00520 g003
Table 1. Key vegetation parameters of the sampling plots. The data presented here were collected during March 2017. Values presented are the mean ± standard error. Soil sample numbers were similar to 15(There are three plots for each forest age, and five samples are taken from each plot according to the s-shape).
Forest TypeSoil Layer (0–30 cm)
Age of StandElevation GradientAverage DBHAverage HeightSoil pHSoil Moisture/Soil Temperature
(a)mcmm %°C
Young forest
(0–5a)
13441.79 ± 2.152.06 ± 0.717.01 ± 0.1235.95 ± 0.45−15.78 ± 2.49
Middle-aged forest
(5–30a)
13528.03 ± 4.818.15 ± 1.866.67 ± 0.0342.45 ± 4.13−14.59 ± 2.61
Near-mature forest
(30–40a)
134214.26 ± 4.1213.94 ± 2.156.69 ± 0.0117.28 ± 2.61−15.33 ± 2.42
Table 2. Monthly average temperature, monthly precipitation in different months, and soil pH value in young forest (Y-F); middle-aged forest (M-F); and near-mature forest (N-F).
MonthsMonthly Average Temperature (°C)Monthly Precipitation (mm)Soil pH Value
Y-FM-FN-F
17 March−10.41.387.286.726.97
17 May14.539.917.066.726.79
17 July22.6295.126.375.896.49
17 September13.1659.116.956.546.63
17 November−6.483.937.146.266.54
Table 3. Nutrient content of P. mongolica forest in different stand ages and sampling times in young forest (Y-F); middle-aged forest (M-F); and near-mature forest (N-F). Different uppercase letters in the same column represent the same factor and significant difference between different ages of different stands (p < 0.05), and different lowercase letters in the same line represent significant difference between different factors of the same index (p < 0.05). The same below.
Sampling TimeForest TypeTotal C (mg·kg−1)Total N (mg·kg−1)C/N
15 November 2016Litters262.744.2961.21
15 March 2017Y-F261.96 ± 0.06aA4.33 ± 0.01aB60.49 ± 0.3aA
M-F257.69 ± 0.35aA4.37 ± 0.02aA58.97 ± 0.1aA
N-F254.88 ± 0.13aB4.43 ± 0.01aB57.55 ± 0.10aA
17 May 2017Y-F246.99 ± 0.02bA4.55 ± 0.02bA54.27 ± 0.01bA
M-F239.13 ± 0.06bB4.68 ± 0.01bA51.10 ± 0.02bA
N-F236.01 ± 0.42bB4.69 ± 0.05bA50.32 ± 0.47ba
15 July 2017Y-F233.49 ± 4.09bA4.77 ± 0.01bA48.95 ± 0.13bA
M-F226.46 ± 5.53bA4.84 ± 0.01bA46.79 ± 0.74bA
N-F224.35 ± 16.09bA4.98 ± 0.01bA45.05 ± 1.11ba
18 September 2017Y-F228.59 ± 1.86bA5.09 ± 0.01bA44.91 ± 3.25cA
M-F204.22 ± 1.86bA5.37 ± 0.04bA38.03 ± 0.34ca
N-F198.81 ± 1.36bA5.35 ± 0.04bA37.16 ± 0.54ca
15 November 2017Y-F203.12 ± 0.79aA5.28 ± 0.01aA38.47 ± 0.15cA
M-F193.43 ± 2.59aA5.42 ± 0.02aA35.69 ± 0.42cA
N-F187.28 ± 1.89aA5.28 ± 0.07aA35.47 ± 0.16cA
Table 4. Soil ammonium nitrogen and nitrate nitrogen contents and their vertical distribution in different stand ages and times in young forest (Y-F); middle-aged forest (M-F); and near-mature forest (N-F). The sampling time is 2017. Different lowercase letters in the same column denote significant differences between soil layers. Different capital letters in the same row denote significant differences across altitudes at the 0.05 level.
TimesSoil Layer (cm)Total N (mg·kg−1)NNH4N (mg·kg−1)NNO3N (mg·kg−1)
Y-FM-FN-FY-FM-FN-FY-FM-FN-F
15 March0–1037.01 ± 1.43bC22.73 ± 0.66cA26.88 ± 0.23bB0.26 ± 0.16dB0.11 ± 0.14cA0.08 ± 0.02cA21.93 ± 11.75cA24.03 ± 10.39cA25.19 ± 3.29cA
10–2014.92 ± 0.64aA13.82 ± 0.29aA30.25 ± 0.47bB0.13 ± 0.06cC0.07 ± 0.04bB0.03 ± 0.03bA12.81 ± 3.01bA11.87 ± 1.63bA15.47 ± 10.85bB
20–3012.91 ± 0.52aA10.46 ± 0.83aA10.38 ± 0.55aA0.06 ± 0.02bB0.03 ± 0.02aA0.03 ± 0.03bA9.41 ± 0.58aA8.91 ± 0.56aA9.98 ± 1.80aA
30–4012.52 ± 0.81aA15.96 ± 0.00bB12.96 ± 0.06aA0.04 ± 0.01aB0.03 ± 0.00aA0.03 ± 0.00bA8.69 ± 0.54aA12.86 ± 1.54bB9.89 ± 1.12aA
40–5012.02 ± 0.41aA12.55 ± 0.00aA11.13 ± 0.64aA0.04 ± 0.01aB0.05 ± 0.03aB0.02 ± 0.01aA10.37 ± 1.08aA10.25 ± 1.33aA10.61 ± 3.04aA
17 May0–1059.95 ± 1.21bC30.32 ± 1.44bB25.19 ± 0.76aA0.18 ± 0.21cB0.09 ± 0.04cA0.11 ± 0.09bA33.57 ± 14.81bB22.59 ± 6.16aA36.09 ± 12.77cB
10–2062.42 ± 0.64bB33.03 ± 1.11bA41.75 ± 1.21bA0.06 ± 0.01aA0.06 ± 0.03bA0.13 ± 0.17bB38.12 ± 16.38bB34.47 ± 15.62bA42.67 ± 24.25dC
20–3022.92 ± 1.01aA43.37 ± 1.96cB27.42 ± 0.92aA0.08 ± 0.08bB0.11 ± 0.12cC0.02 ± 0.01cA21.01 ± 1.64aA36.09 ± 9.98bB40.24 ± 15.46dB
30–4021.23 ± 1.25aA21.75 ± 0.35aA23.97 ± 0.62aA0.13 ± 0.13bA0.02 ± 0.02aB0.02 ± 0.01aA22.47 ± 2.84aA30.61 ± 18.72bB31.86 ± 14.58bB
40–5023.25 ± 0.87aA26.08 ± 1.67aA25.32 ± 0.98aA0.07 ± 0.05aB0.02 ± 0.01aA0.02 ± 0.01aA20.05 ± 0.54aA21.96 ± 2.85aA24.12 ± 1.77aA
15 July0 –1059.55 ± 0.52bC31.42 ± 0.46bB25.79 ± 0.27aA0.06 ± 0.01aB0.12 ± 0.01cA0.74 ± 0.02dB54.39 ± 0.01bC31.25 ± 0.01bB22.42 ± 0.01aA
10–2062.45 ± 0.69bC33.34 ± 0.58cA41.16 ± 0.20bB0.06 ± 0.01aA0.07 ± 0.00bB0.06 ± 0.01cA59.95 ± 0.01bB33.41 ± 0.02bA36.19 ± 0.01bA
20–3023.82 ± 0.55aA44.43 ± 0.12dB26.99 ± 0.17aA0.19 ± 0.01bA0.33 ± 0.01aB0.03 ± 0.01bB21.15 ± 0.02aA42.59 ± 0.01cB23.49 ± 0.03aA
30–4022.15 ± 0.35aA21.57 ± 0.04aA24.6 ± 0.48aA0.31 ± 0.01cA0.03 ± 0.01aA0.03 ± 0.01bA20.55 ± 0.01aA21.19 ± 0.00aA22.31 ± 0.01aA
40–5023.90 ± 0.27aA27.28 ± 0.40bA25.60 ± 0.50aA0.15 ± 0.01bA0.03 ± 0.01aB0.03 ± 0.01aB19.99 ± 0.01aA20.66 ± 0.01aA21.49 ± 0.01aA
18 September0 –1023.75 ± 0.35aA51.03 ± 0.52bC38.51 ± 0.28bB0.01 ± 0.02aA0.08 ± 0.08cB0.06 ± 0.07bB25.97 ± 5.34aA42.31 ± 16.01cB27.90 ± 8.46aA
10–2027.13 ± 0.65aA63.61 ± 0.01cC47.61 ± 0.30bB0.02 ± 0.03aA0.02 ± 0.02aA0.08 ± 0.06cB33.05 ± 9.34bA39.16 ± 17.72cB37.72 ± 12.24cB
20–3025.06 ± 0.10aA50.955 ± 0.02bB54.35 ± 0.13cB0.03 ± 0.04bA0.11 ± 0.08dB0.06 ± 0.04bA22.92 ± 1.90aA36.99 ± 12.81bB38.53 ± 18.15cB
30–4041.26 ± 0.15cB34.39 ± 0.01aA25.35 ± 0.29aA0.02 ± 0.03aA0.04 ± 0.03aB0.07 ± 0.11bC31.85 ± 7.71bA31.59 ± 8.13aA33.12 ± 8.73bA
40–5031.13 ± 0.11bA33.14 ± 0.03aA25.43 ± 0.05aA0.04 ± 0.05bA0.07 ± 0.02bB0.04 ± 0.06aA33.08 ± 3.51bB34.20 ± 6.24cB24.84 ± 9.97aA
15 November0 –1030.76 ± 0.56cB12.91 ± 0.22aA21.34 ± 0.42aA0.05 ± 0.01cB0.03 ± 0.04aA0.11 ± 0.07cC17.25 ± 10.92bA20.69 ± 9.41bB26.82 ± 5.85bC
10–2017.08 ± 0.30aA22.36 ± 0.37bB28.00 ± 0.29bC0.04 ± 0.01cA0.05 ± 0.02bA0.09 ± 0.04bB9.62 ± 4.24aA15.11 ± 4.80aA35.73 ± 9.73cB
20–3014.14 ± 0.15aA21.05 ± 0.17bB13.94 ± 0.36aA0.02 ± 0.01aA0.05 ± 0.01bB0.10 ± 0.06cC11.90 ± 1.79aA14.55 ± 5.40aA11.24 ± 1.95aA
30–4029.39 ± 0.54bB11.07 ± 0.24aA9.68 ± 0.32aA0.03 ± 0.02bA0.05 ± 0.03cB0.10 ± 0.02bC16.79 ± 10.23bA11.51 ± 6.26aA13.31 ± 4.25aA
40–5023.84 ± 0.33bB11.23 ± 0.28aA17.13 ± 0.26bB0.03 ± 0.01aA0.03 ± 0.01aA0.07 ± 0.04aB15.59 ± 5.06bA12.32 ± 1.65aA27.18 ± 25.29bB
Table 5. Variance analysis of soil total nitrogen in P. mongolica forest (F-test). The dependent variable was total N.
Model Sum of SquaresFreedomMean SquareFSignificance
1Regression632,256,6411063,225,6642.3190.013
Residual7,062,498,13525927,268,333
Total7,694,754,776269
Table 6. Multivariate analysis of variance of soil total nitrogen of P. mongolica forest (t-test).
ModelNonstandard CoefficientStandardization CoefficienttSignificance
(Constant)52,347.1627,613.11 1.900.06
Particular year−3899.581154.61−1.25−3.380.01
Forest type−1327.88550.65−0.20−2.410.02
Soil depth5.1224.720.010.210.08
pH value−118.221006.91−0.01−0.120.19
Humidity−367.86390.42−0.11−0.940.03
Temperature−24.0278.97−0.05−0.300.04
Litter N content−3047.913006.83−0.22−1.010.31
Litter C content255.93165.931.211.540.12
Litter CN ratio−1617.78569.09−2.82−2.840.01
Soil organic matter content8.196.660.091.230.02
Table 7. Variance analysis of soil ammonium nitrogen in P. mongolica forest (F-test).
Model Sum of SquaresFreedomMean SquareFSignificance
1Regression0.681100.0688.4880.001
Residual2.0792590.008
Total2.761269
Table 8. Multivariate analysis of variance of soil ammonium nitrogen in P. mongolica forest (t-test).
ModelNonstandard Coefficient Beta Standardized Number BetatSignificance
Particular year0.040.020.592.750.05
Forest type0.020.010.122.540.02
Soil depth0.010.01−0.11−2.820.07
pH value0.020.020.091.110.27
Humidity0.030.010.534.810.01
Temperature0.000.00−0.03−1.230.02
Litter N content0.010.050.050.250.80
Litter C content−0.010.00−1.65−2.320.02
Litter CN ratio0.030.012.392.660.01
Soil organic matter content0.000.000.162.330.02
Table 9. Fittedlinear table for soil nitrate nitrogen in P. mongolica forest (F-test). The dependent variable was nitrate (N).
Model Sum of SquaresFreedomMean SquareFSignificance
1Regression1,348,848.9110134,884.892.980.001
Residual11,727,318.0225945,279.22
Total13,076,166.93269
Table 10. Multivariate analysis of variance of soil nitrate nitrogen in the P. mongolica forest (t-Test).
ModelNonstandard Coefficient BetaStandardized Number BetatSignificance
Sampling time13.2447.050.100.280.08
Forest type4.7922.440.020.210.08
Soil depth1.741.010.111.720.08
pH value−39.9741.03−0.08−0.970.33
Humidity54.7915.910.413.440.01
Temperature−2.953.22−0.14−0.920.03
Litter N content−30.05122.53−0.05−0.250.08
Litter C content−3.926.76−0.45−0.580.06
Litter CN ratio12.7123.190.540.550.05
Soil organic matter content−0.290.27−0.08−1.060.02
Table 11. Correlation coefficient between nitrogen stoichiometry in the soil of P. mongolica forest and influencing factors * at level 0.05 (two-tailed) with a significant correlation. ** At the 0.01 level (two-tailed), the correlation was significant.
Sampling TimeSoil DepthForest TypeTotal NNNH4NNNO3NpHTemperatureHumidityLitter C ContentLitter N ContentLitter C/NSoil Organic Matter Content
Sampling time1000.394 **0.110.44 **−0.164 **0.251 **0.258 **−0.957 **0.919 **−0.973 **0.052
Soil depth 10−0.001−0.228 **0.060.248 **−0.057−0.165 **−0.76−0.62−0.71−0.359 **
Forest type 10.210.47 **0.006−0.285 **0−0.047−0.196 **0.124 *−0.158 **0.166 **
Total N 10.037−0.005−0.0290.0780.008−0.120 *0.093−0.129 *0.066
NNH4N 1−0.037−0.222 **0.236 **0.388 **−0.002−0.013−0.0050.264 **
NNO3N 1−0.140 *0.157 **0.265 **−0.0380.024−0.044−0.012
pH value 1−0.246 **−0.413 **0.237 **−0.280 **0.229 **−0.531 **
Temperature 10.819 **−0.185 **0.072−0.266 **0.205 **
Humidity 1−0.197 **0.130 *−0.255 **0.233 **
Litter C content 1−0.941 **0.993 **−0.086
Litter N content 1−0.934 **0.119
Litter C/N 1−0.085
Soil organic matter content 1
Publisher’s Note: MDPI stays neutral with regard to jurisdictional claims in published maps and institutional affiliations.

