Article

Effects of Precipitation and Soil Moisture on the Characteristics of the Seedling Bank under Quercus acutissima Forest Plantation in Mount Tai, China

1
Taishan Mountain Forest Ecosystem Research Station, Key Laboratory of State Forestry Administration for Silviculture of the Lower Yellow River, Shandong Agricultural University, Tai’an 271018, China
2
Mount Taishan Management Committee, Tai’an 271000, China
*
Author to whom correspondence should be addressed.
Forests 2022, 13(4), 545; https://doi.org/10.3390/f13040545
Submission received: 17 February 2022 / Revised: 19 March 2022 / Accepted: 29 March 2022 / Published: 31 March 2022
(This article belongs to the Special Issue Maintenance of Forest Biodiversity)

Abstract

:
Natural regeneration is crucial for the development of sustainable forestry practices in light of the current global climate changes. In this paper, we compared the size distributions of Quercus acutissima seedlings in the understory of Q. acutissima forest plantations in Mount Tai in 2010 and 2017, studied the physiological and morphological responses of seedlings to the microenvironment, and explored the maintenance mechanisms of the seedling bank. The results showed that the density of understory seedlings in 2017 was only 61.63% of that in 2010, especially in the 20–40 cm height class. Between 2011 and 2016, the precipitation and soil water content were the highest in 2011, followed by 2013. The 2–4-year seedlings (height < 40 cm) were not significantly different in seedling biomass, biomass allocation, and root morphology (root total surface area, root volume, and root average diameter), and were significantly different in total root length, specific root length, specific root surface area, and nonstructural carbohydrate content of root, stem, and leaves. However, 5–6-year seedlings (height > 40 cm) showed the largest biomass. Principal component analysis indicated that altering root morphology, nonstructural carbohydrate, and biomass allocation played significant roles in the drought adaptation of seedlings in the understory. In conclusion, drought stress together with seedling adaptation influenced the dynamics of seedling bank in the understory of Q. acutissima plantations.

1. Introduction

Forest plantation has increased rapidly from 1990 to 2015 at the global scale, with a percentage increase from 4.06 to 6.95% of the total forest area between 1990 and 2015 [1]. The forest plantation plays an increasingly crucial role in timber production, environmental improvement, landscape rehabilitation, and climate change mitigation [2]. Natural regeneration is vital for sustainable forest management. Naturally regenerated forests have the advantages of better plant establishment, self-regenerated material, and high seedling densities [3,4]. However, improper management has made the planted forests unable to complete natural regeneration [5,6]. Stand structure [7], litter density and grass cover [8], seedling adaptation [9,10,11], stand management [12,13], and year-to-year variation in stand conditions [14] are considered to be vital factors affecting forest natural regeneration. The natural regeneration of plantations is a long-term and complex process affected by many factors. At present, the regeneration mechanisms of plantations are still poorly understood.
Sufficient seedling bank is the foundation of the success of natural forest regeneration [15,16,17,18]. The structure and composition of natural regeneration are closely related to environmental conditions under forest stands [8,19], including precipitation [20], air temperature [21], soil moisture [22], and soil temperature [14], which significantly affect the establishment and survival of tree seedlings. Long-term monitoring of tree seedlings revealed that the fraction of seedlings eventually reaching the sapling class is quite small due to high seedling mortality [14,23,24]. Therefore, Rey and Alcántara [24] suggested that seedling survival is a critical process for tree species recruitment. Abiotic factors, especially drought, are considered to be the main factors causing seedling death [24]. With the increase of seedling size, the proportion of non-photosynthetic tissues to total sapling biomass increases, as well as respiration costs [25,26,27]. The minimum light demands of tree species increased with increasing seedling size, which led to the decrease of shade tolerance [28,29]. Thus, the transformation from seedlings to saplings requires higher light intensity [29,30], which is one of the most important limiting factors under forest stands. In addition, Soto et al. [31] suggested that light and nitrogen interact to influence regeneration in old-growth Nothofagus-dominated forests in South-Central Chile. Therefore, the current understanding of the dynamics of seedling banks under forest remains very limited.
Nonstructural carbohydrates (NSC) storage is a fundamental process that allows organisms to meet variable demands for resources during their development and buffer environmental fluctuations in resource supply. NSC is mainly stored in the roots and stems of tree seedlings [32], and starch is its main component [25,33]. Under short-term drought stress, the NSC content of Pinus massoniana Lamb. seedlings increased rapidly, and the variation in NSC partitioning among organs was more highly significant than the variation in biomass partitioning [34]. However, the change of NSC in the roots of Manihot esculenta Crantz. was not significant [35]. In shaded forest understories, NSC in tree seedlings acts as a buffer during the periods of negative net carbon balance against herbivores and diseases [32], defoliation [36], and suddenly shade increases [37], etc. Under severe shading conditions, NSC in seedlings is greatly consumed [34,38], or little remains [38]. Similarly, reduced NSC reserve in the root system of Populus tremuloides Michx. and P. balsamifera L. seedlings during severe drought contributed to the root death of seedlings during the dormant season by compromising the frost tolerance of the root system [39]. Ivanov et al. [40] also found that critical exhaustion of the NSC reserves in the roots under water stress led to the greatest mortality of Pinus sylvestris L. seedlings. After the relief of drought stress, Tomasella et al. [41] suggested that preserving higher NSC content at the end of a drought can be important for the hydraulic resilience of trees. The survival of tree seedlings under the forest is a long-term process. With the continuous growth of tree seedlings, their NSC content gradually increases [28,42], which is considered conducive to their survival in the forest [36]. However, some studies have suggested that carbohydrate storage is not related to low-light survival for tree seedlings [42,43]. Myers and Kitajima [32] proposed that tree seedlings rely on NSC reserves to survive short-term periods of negative carbon balance under forest, thereby enabling net carbon gain over the long term. Therefore, the relationship between NSC and the survival of tree seedlings under forest has not yet achieved a unified understanding.
China has the largest forest plantation area in the world. For a long time, forest plantation management has paid much attention to short-term productivity and economic benefits but had ignored natural regeneration [2]. Quercus acutissima Carruth., a deciduous tree species belonging to Quercus in the Fagaceae family, is the main component tree of forest vegetation in warm temperate and subtropical regions of China. Q. acutissima is a pioneer tree in barren mountains and barren land, and an excellent tree species for soil and water conservation, with high ecological, economic, and landscape values. At present, there are few studies on the natural regeneration of Q. acutissima plantation, and the limiting mechanism is unclear. Q. acutissima has certain shade tolerance, and its seedlings rarely die under more than 12% full light [44]. Xue et al. [45] found there were a large number of seedlings in the secondary forest of Q. acutissima, but few saplings. To further explain the restriction mechanism of the natural regeneration of Q. acutissima plantations, we studied the pure forest plantation of Q. acutissima, the main forest type of Mount Tai, and with the following aims: (1) to describe changes of the regeneration structure of Q. acutissima seedlings under the forest across a long-term period; (2) to explore the effects of the environmental factors on regeneration structure and seedling establishment; (3) to clarify the morphological and physiological adaptation with the increase of seedling age.

2. Materials and Methods

2.1. Study Area

The study area of Mount Tai lies in the middle of Shandong province, China, between Jinan City and Tai’an City. The climate is classified as the warm temperate continental monsoon zone, the average annual temperature is 12.6 °C, the frost-free period is 196 days, and the accumulated temperature greater than or equal to 10 °C is 3821 °C. The average annual precipitation is 758 mm and is concentrated from June to September. The soil type is mainly brown loam with a pH value of about 6.0 and a soil depth of 15~60 cm. Most of the vegetation in Mount Tai was planted in the 1950s and 1960s, with a total forest area of about 9490 hm2 and a forest coverage rate of 81.5%. The main tree species include Platycladus orientalis (L.) Franco, Q. acutissima, Robinia pseudoacacia L., Pinus thunbergii Parl., Pinus densiflora Sieb. et Zucc., Pinus tabuliformis Carr., etc. [46,47].

2.2. Investigation of Q. acutissima Plantation

The investigation of Q. acutissima plantation was conducted in the Mountain Tai Forest Ecosystem Research Station of State Forestry and Grassland Administration (117°06′48.2″ N, 36°20′05.3″ E). The forest was planted in 1960 using 1-year-old seedlings. The plantation is a pure forest with an age of 60 years and an average altitude of 730 m. The permanent monitoring plot was established in 2010 with an area of 0.48 hm2 (60 m × 80 m). Twelve 20 m × 20 m quadrats were set up in the plot. In each quadrat, we measured the diameter at breast height (DBH) for all trees with heights ≥1.5 m, which were defined as adult trees. Saplings and seedlings below 1.5 m in height were divided into eight height classes: <20 cm, 20–40 cm, 40–60 cm, 60–80 cm, 80–100 cm, 100–120 cm, 120–140 cm, and 140–150 cm. Adult trees were classified into DBH sizes, with one diameter class for every 5 cm. The permanent monitoring plot was reviewed in May 2017. The sampling and investigation methods in this paper referred to the forestry industry standard of the People’s Republic of China issued by the State Forestry Administration (State Forestry Administration, 2011).

2.3. Measurement of Seedling Traits of Q. acutissima

On May 10, 2016, 19 seedlings with heights between 9 and 46 cm were selected in the Q. acutissima plantation. The height, diameter, and number of leaves of the seedlings were measured and collected. Then, each seedling was carefully excavated from the soil, and all the seedlings were sealed and stored in a fresh-keeping bag and brought back to the laboratory.
The age of seedlings was determined by counting the number of annual rings. These seedlings were divided into four groups according to their age: 2-year (I), 3-year (II), 4-year (III), and 5–6-year (IV). There were 3–9 seedlings in each group.
In the laboratory, the seedlings were divided into leaves, stems, and roots. The area of each leaf of each seedling was measured with a CI-202 portable laser leaf area meter (CID Inc., Washington, USA). After rinsing with clean water, these roots were scanned by HP Scanjet 8200 scanner, and the scanned images were analyzed by root parameter analysis software (Delta-T Area Meter Type AMB2) to obtain the length and surface area of roots. The roots, stems, and leaves of seedlings were dried at 80 °C until maintaining a constant weight. Then, the dry weight was weighed and recorded. After the dried samples of roots, stems, and leaves were pulverized, their concentrations of soluble sugar and starch were determined by anthranone–H2SO4 colorimetry, respectively [48]. Starch and soluble sugars in each plant organ were added together to determine nonstructural carbohydrate concentration (NSC). All the seedling indices are shown in Table 1.

2.4. Monitoring Environmental Parameters under Q. acutissima Plantation

The environmental factors in the forest plot were measured from July 2011 to December 2016. The precipitation at 1.5 m in the forest was measured. The relative soil water content (RSWC) was measured at 10, 20, 30, and 40 cm depth of soil, respectively. The indices above were determined using a CR3000 automatic weather station (Campbell Scientific, Logan, UT, USA), which automatically recorded daily data every 10 min. Data were collected every month.

2.5. Statistical Analysis

The precipitation effect was tested by a two-way ANOVA, with year and month as the sources of variations. The relative soil water content was tested by a three-way ANOVA, with year, month, and depth as the sources of variations. Seedling indices were analyzed by a one-way ANOVA. The responses of functional traits to height were compared, and multiple comparisons were made. The linear regression analysis of height and age was carried out using the excavated 19 seedlings. At the same time, the correlation analysis of each index was carried out. All the seedling indices were analyzed by principal component analysis (PCA). The test level was p = 0.05. All statistical analyses were conducted using R 4.1.2 for Windows.

3. Results

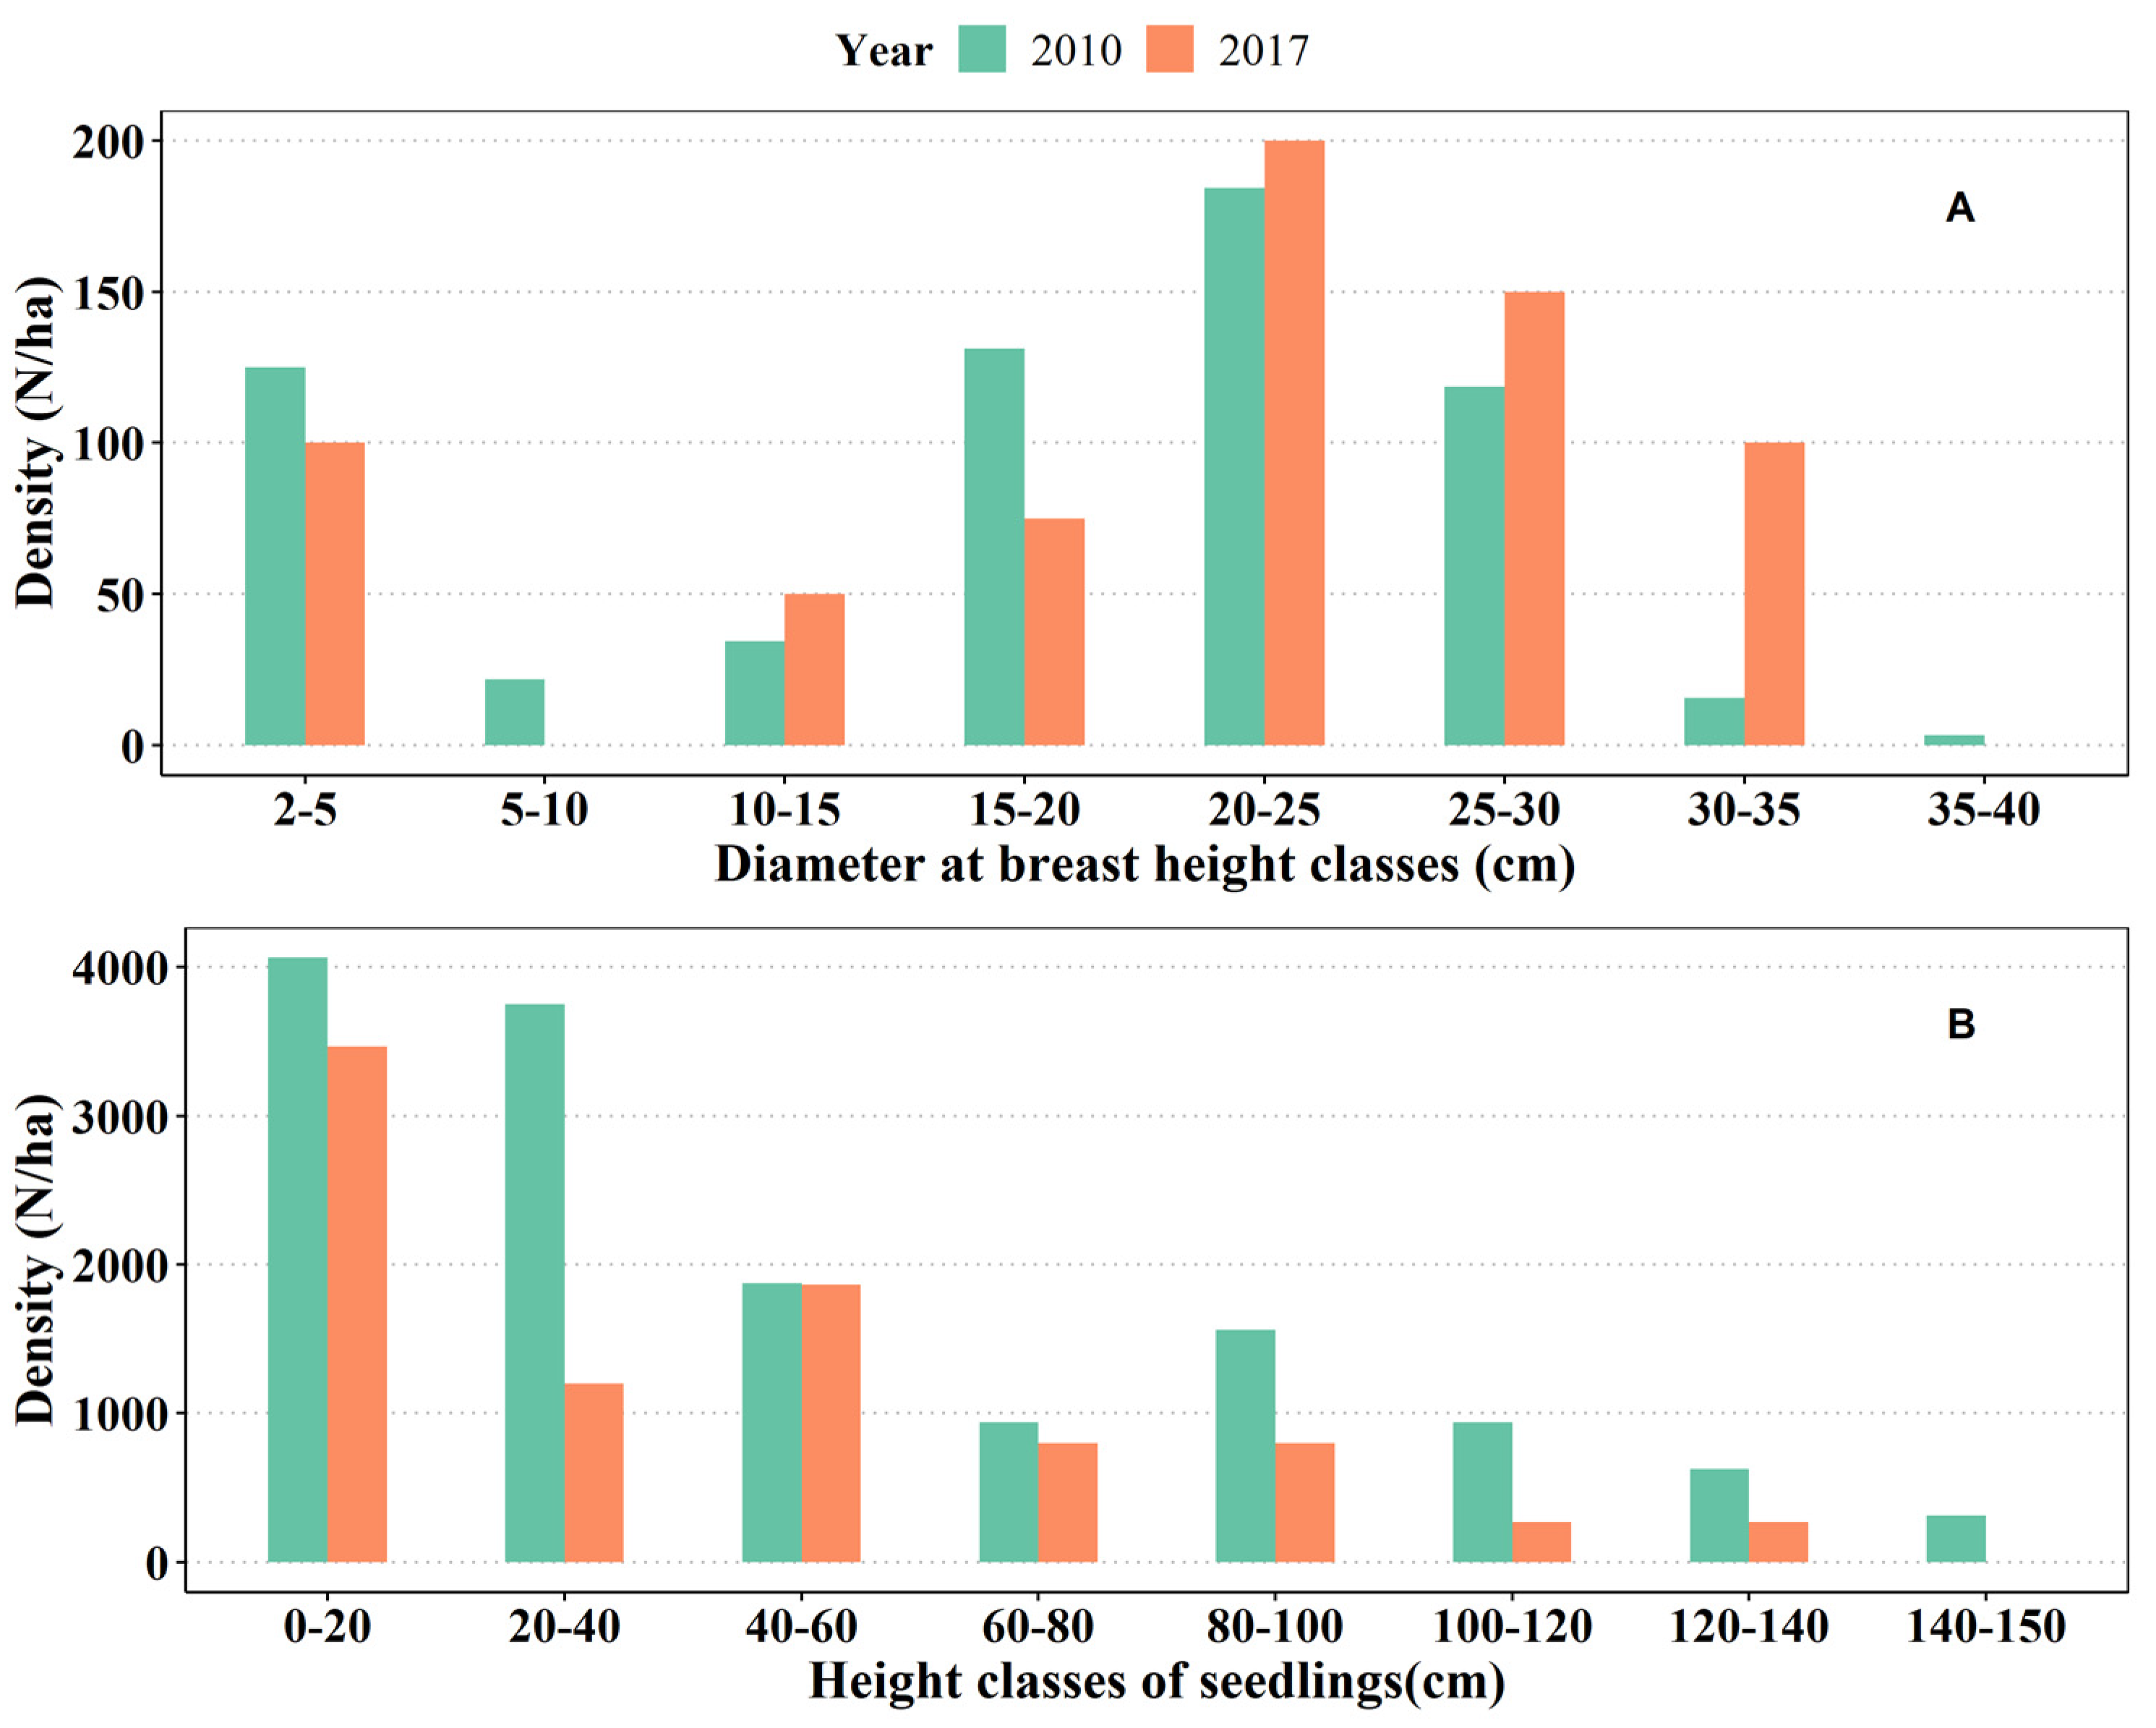
3.1. The Diameter Structure of Q. acutissima Plantation

The density of Q. acutissima adult trees in 2010 stands was 634 N ha−1, with trees in the DBH class 2–5 cm accounting for 19.70%, 5–10 cm for only 3.44%, and 15–35 cm for 70.94%. In 2017, the density of adult trees was 675 N ha−1, with trees in the DBH class 2–5 cm accounting for 14.81%, 5–10 cm for 0, and 15–35 cm for 77.78%. In 2017, compared with 2010, the density of trees in the DBH 2–5 cm decreased by 4.89%, 5–10 cm trees disappeared, and the density of 15–35 cm trees increased by 6.84% (Figure 1A).
The height distribution of seedlings in 2010 and 2017 was pyramid-shaped (Figure 1B). The tree number reached a maximum in the height class 0–20 cm and 20–40 cm, and then gradually decreased as the height increased. Compared with 2010, the density of seedlings in 2017 was only 61.63% of that in 2010, showing a significant decrease. Moreover, seedlings of all height levels were reduced, especially at the height of 20–40 cm, which was only 32% of that in 2010. All seedlings at 140–150 cm disappeared in 2017. Regression analysis showed that there was a very significant linear relationship between height and age for seedlings with heights less than 46 cm (F = 35.85, p < 0.01, Figure 2).

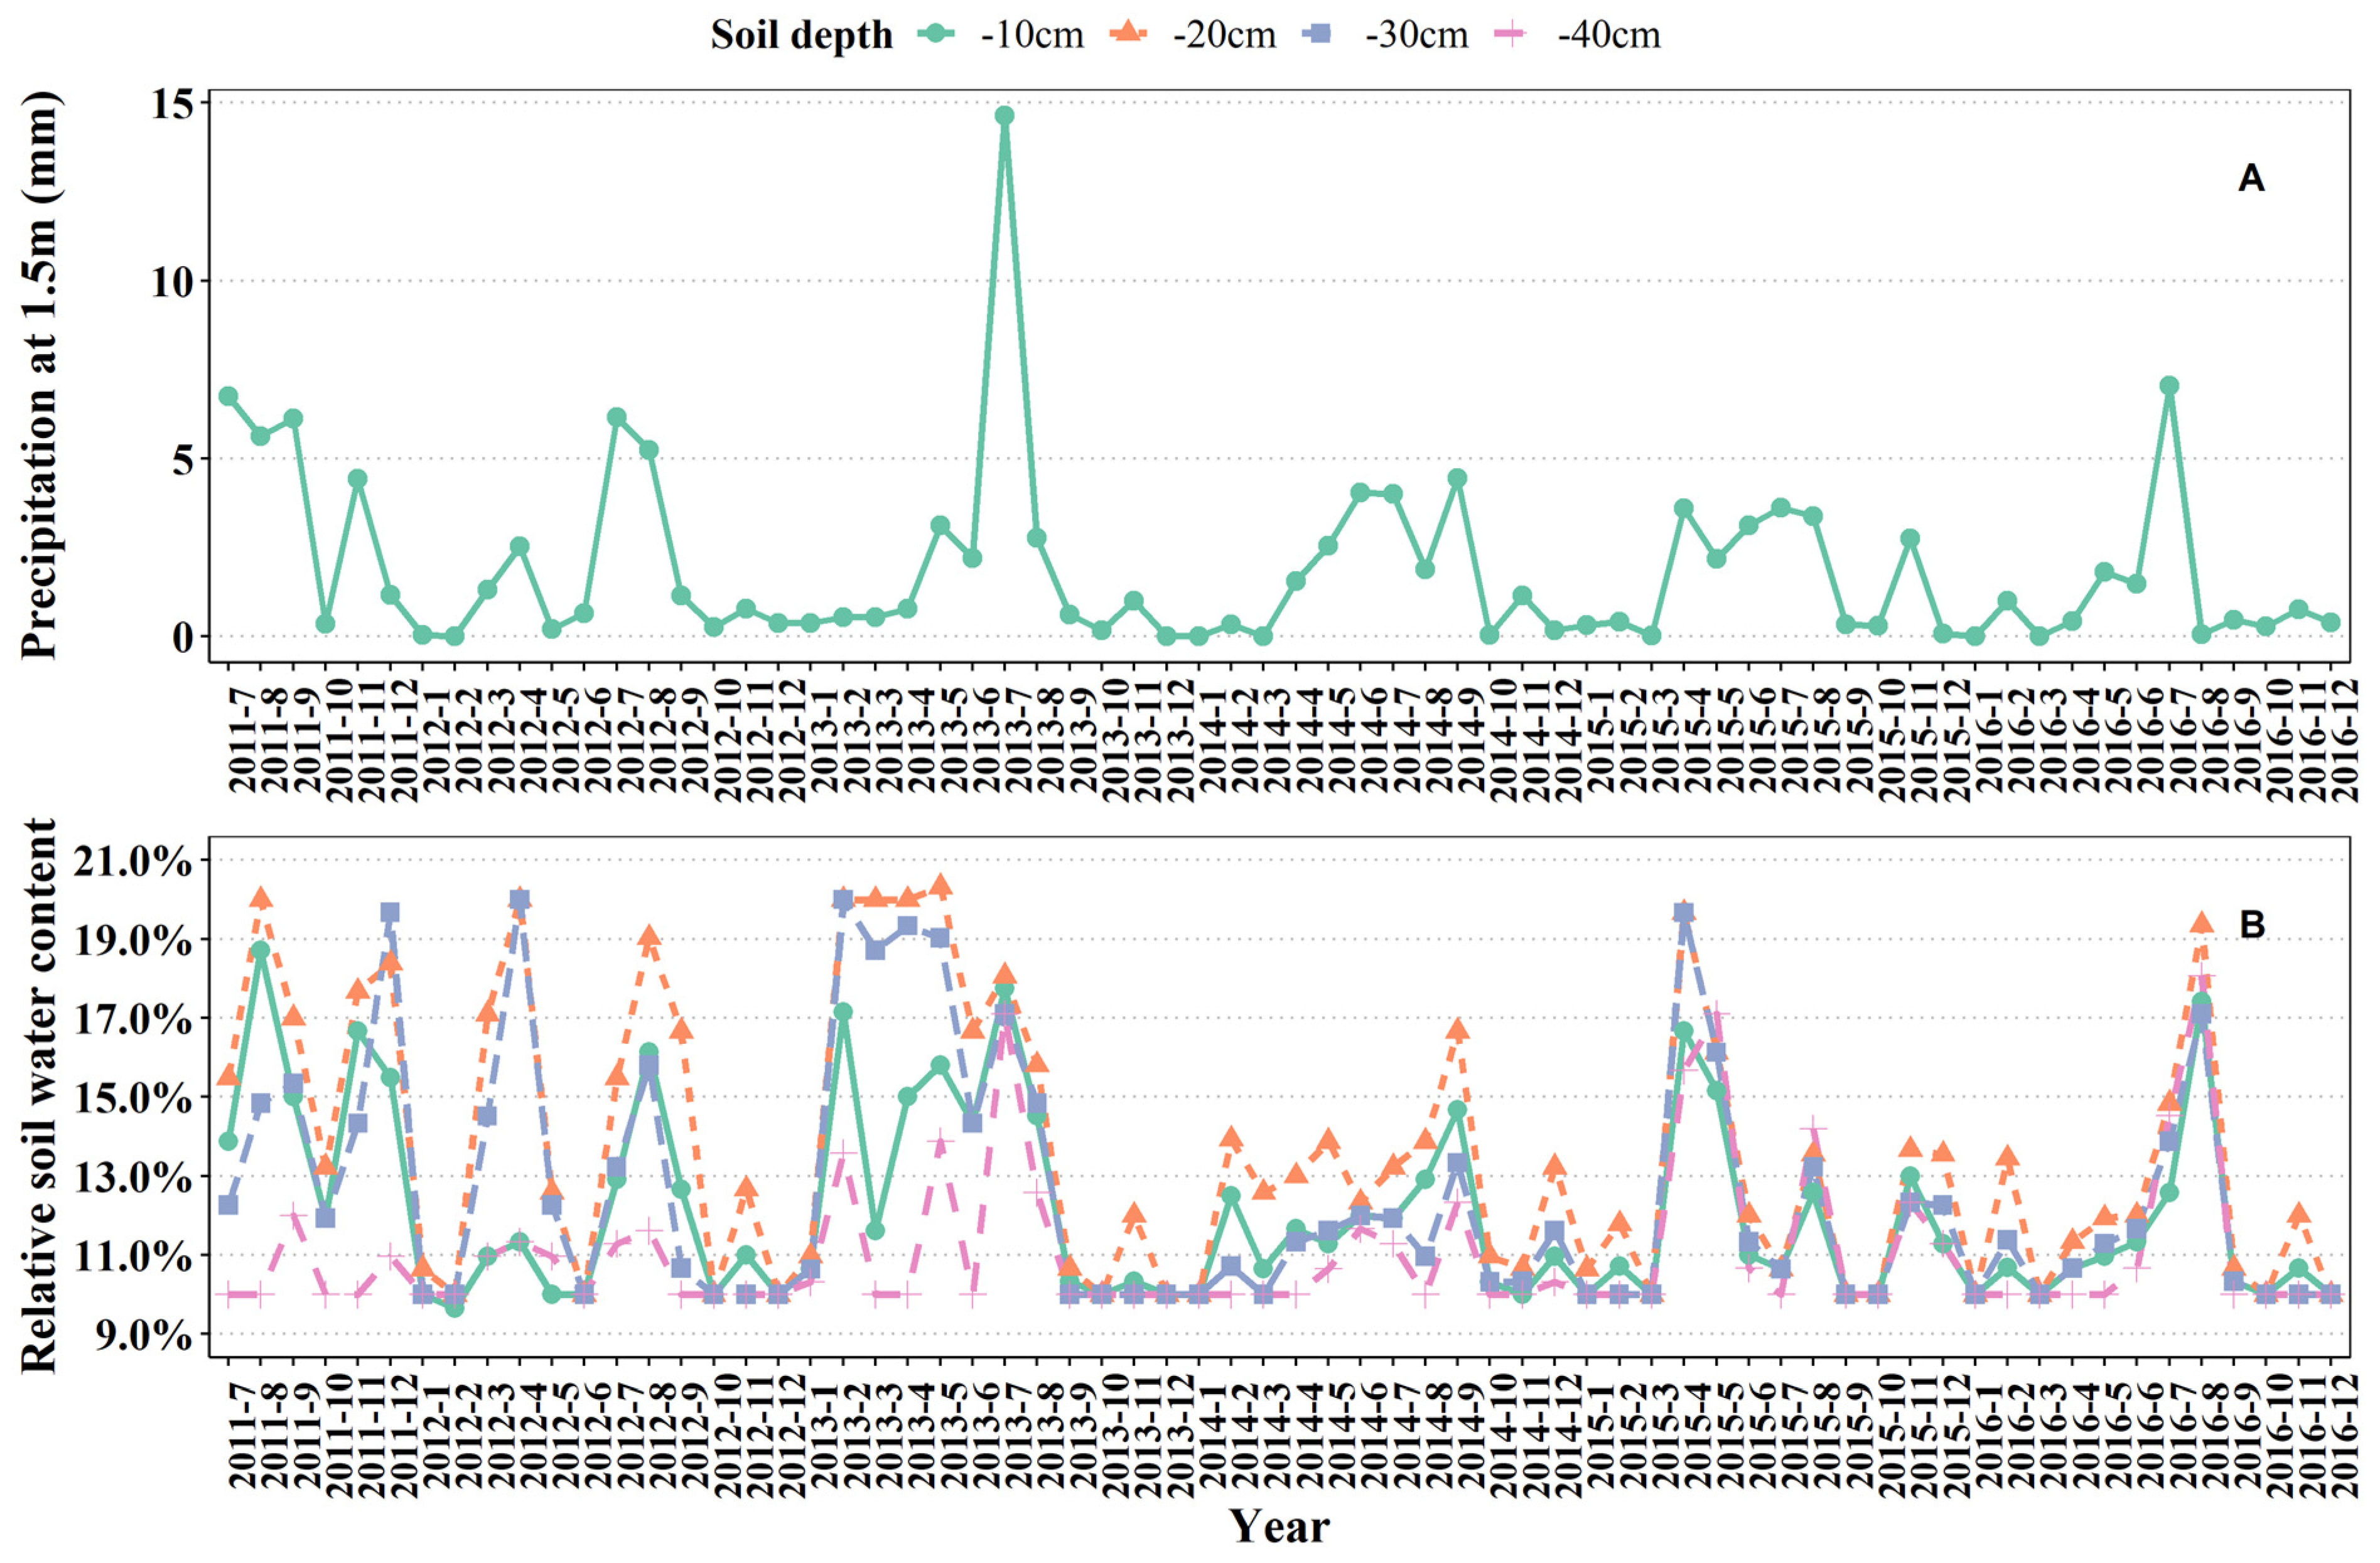
3.2. Characteristics of Environmental Factors under Q. acutissima Plantation

3.2.1. Precipitation

There were significant differences in precipitation among different months (F = 11.34, p < 0.01) and years (F = 2.84, p < 0.05). With the increase of months, the precipitation first increased and then decreased, and was mainly concentrated between June and August each year (Figure 3). Among different years, precipitation in 2011 was the highest (p < 0.01), and precipitation in 2013 was significantly higher than that in 2016 (p < 0.05), and there was no significant difference in precipitation among other years (p > 0.05). During 2012 and 2016, precipitation in the same months fluctuated significantly among years (Figure 3).

3.2.2. Soil Moisture

The results of the analysis of variance showed that RSWC varied highly significantly between months (F = 146.82, p < 0.01), years (F = 163.09, p < 0.01), and soil depths (F = 285.73, p < 0.01). As the month increased, the RSWC changed in a bimodal pattern. The RSWC reached a peak in April and August, and reached a maximum in August. The RSWC declined to nadir in January, June, and October, and reached a minimum in January and October (there was no significant difference between January and October). Among years, RSWC was 2011 > 2013 > 2012≈2015 > 2014≈2016 (p < 0.01). Among soil depths, the order of RSWC was −20 cm > −30 cm > −10 cm > −40 cm.

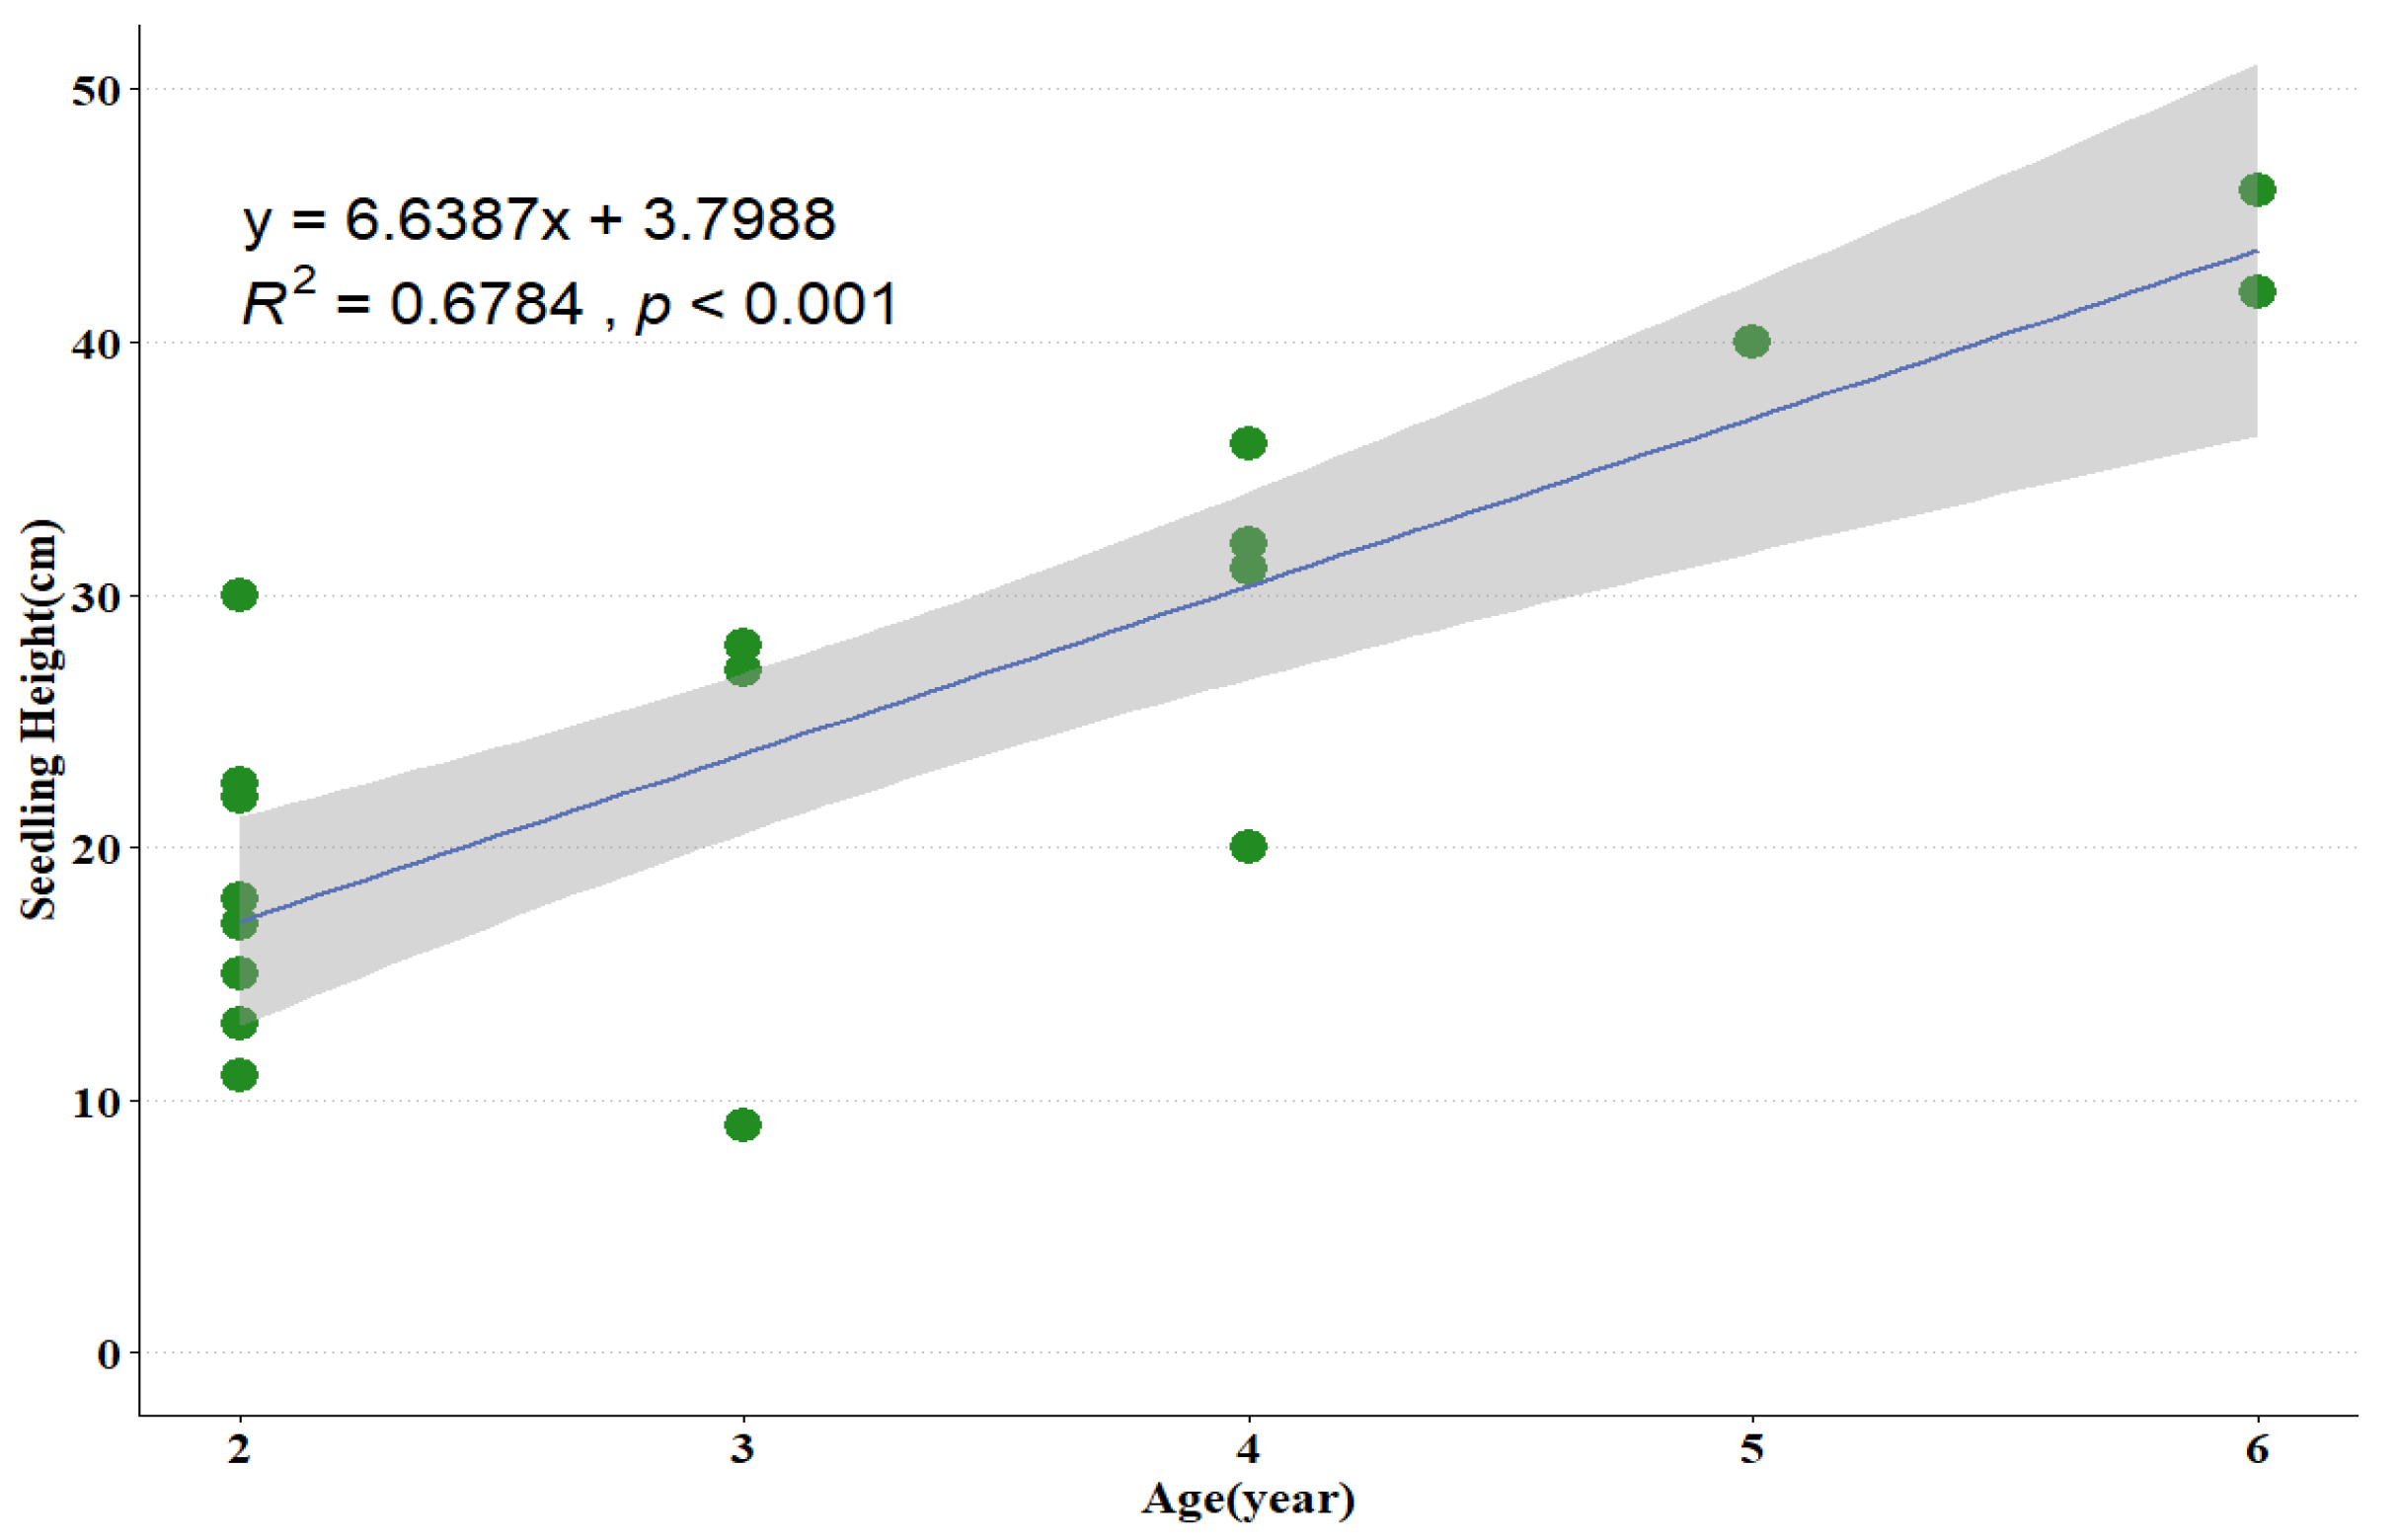
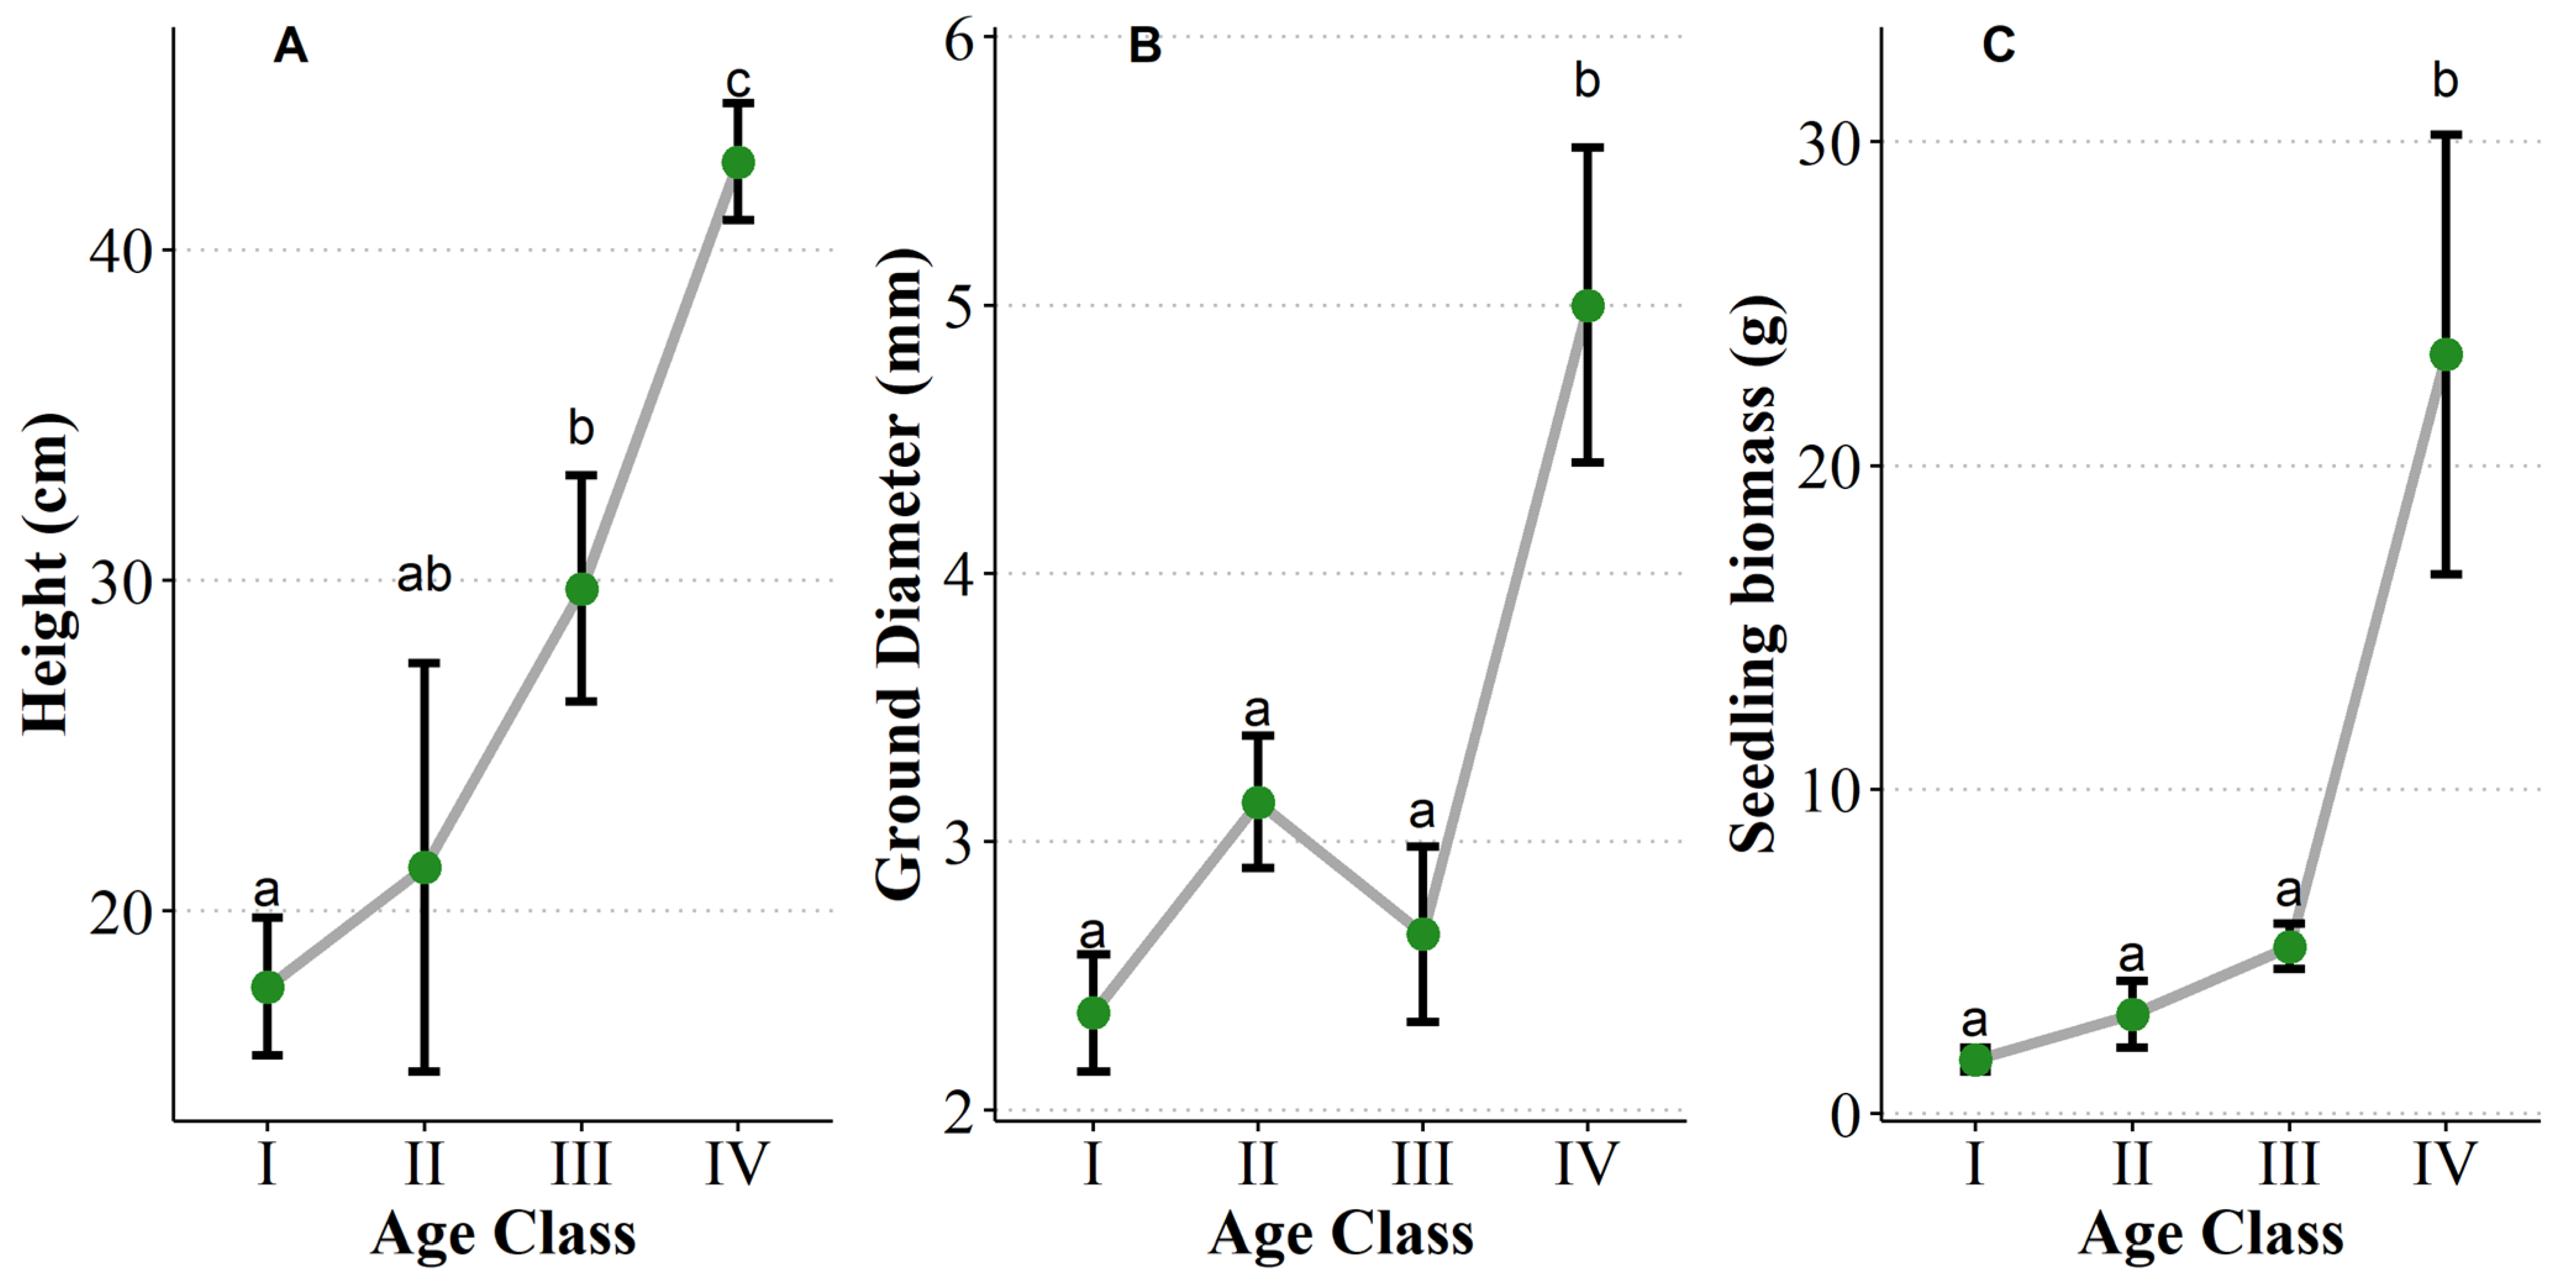
3.3. Seedling Size Traits with the Increase of Age

Seedling age had a significant effect on height (F = 11.01, p < 0.01), ground diameter (F = 11.38, p < 0.01), and biomass (F = 18.60, p < 0.01). The height increased significantly with age (Figure 4A). Ground diameter and biomass showed no significant difference among age groups I, II, and III, and increased significantly at IV (Figure 4B,C).

3.4. Adaptation Traits of Seedlings with Increasing Age

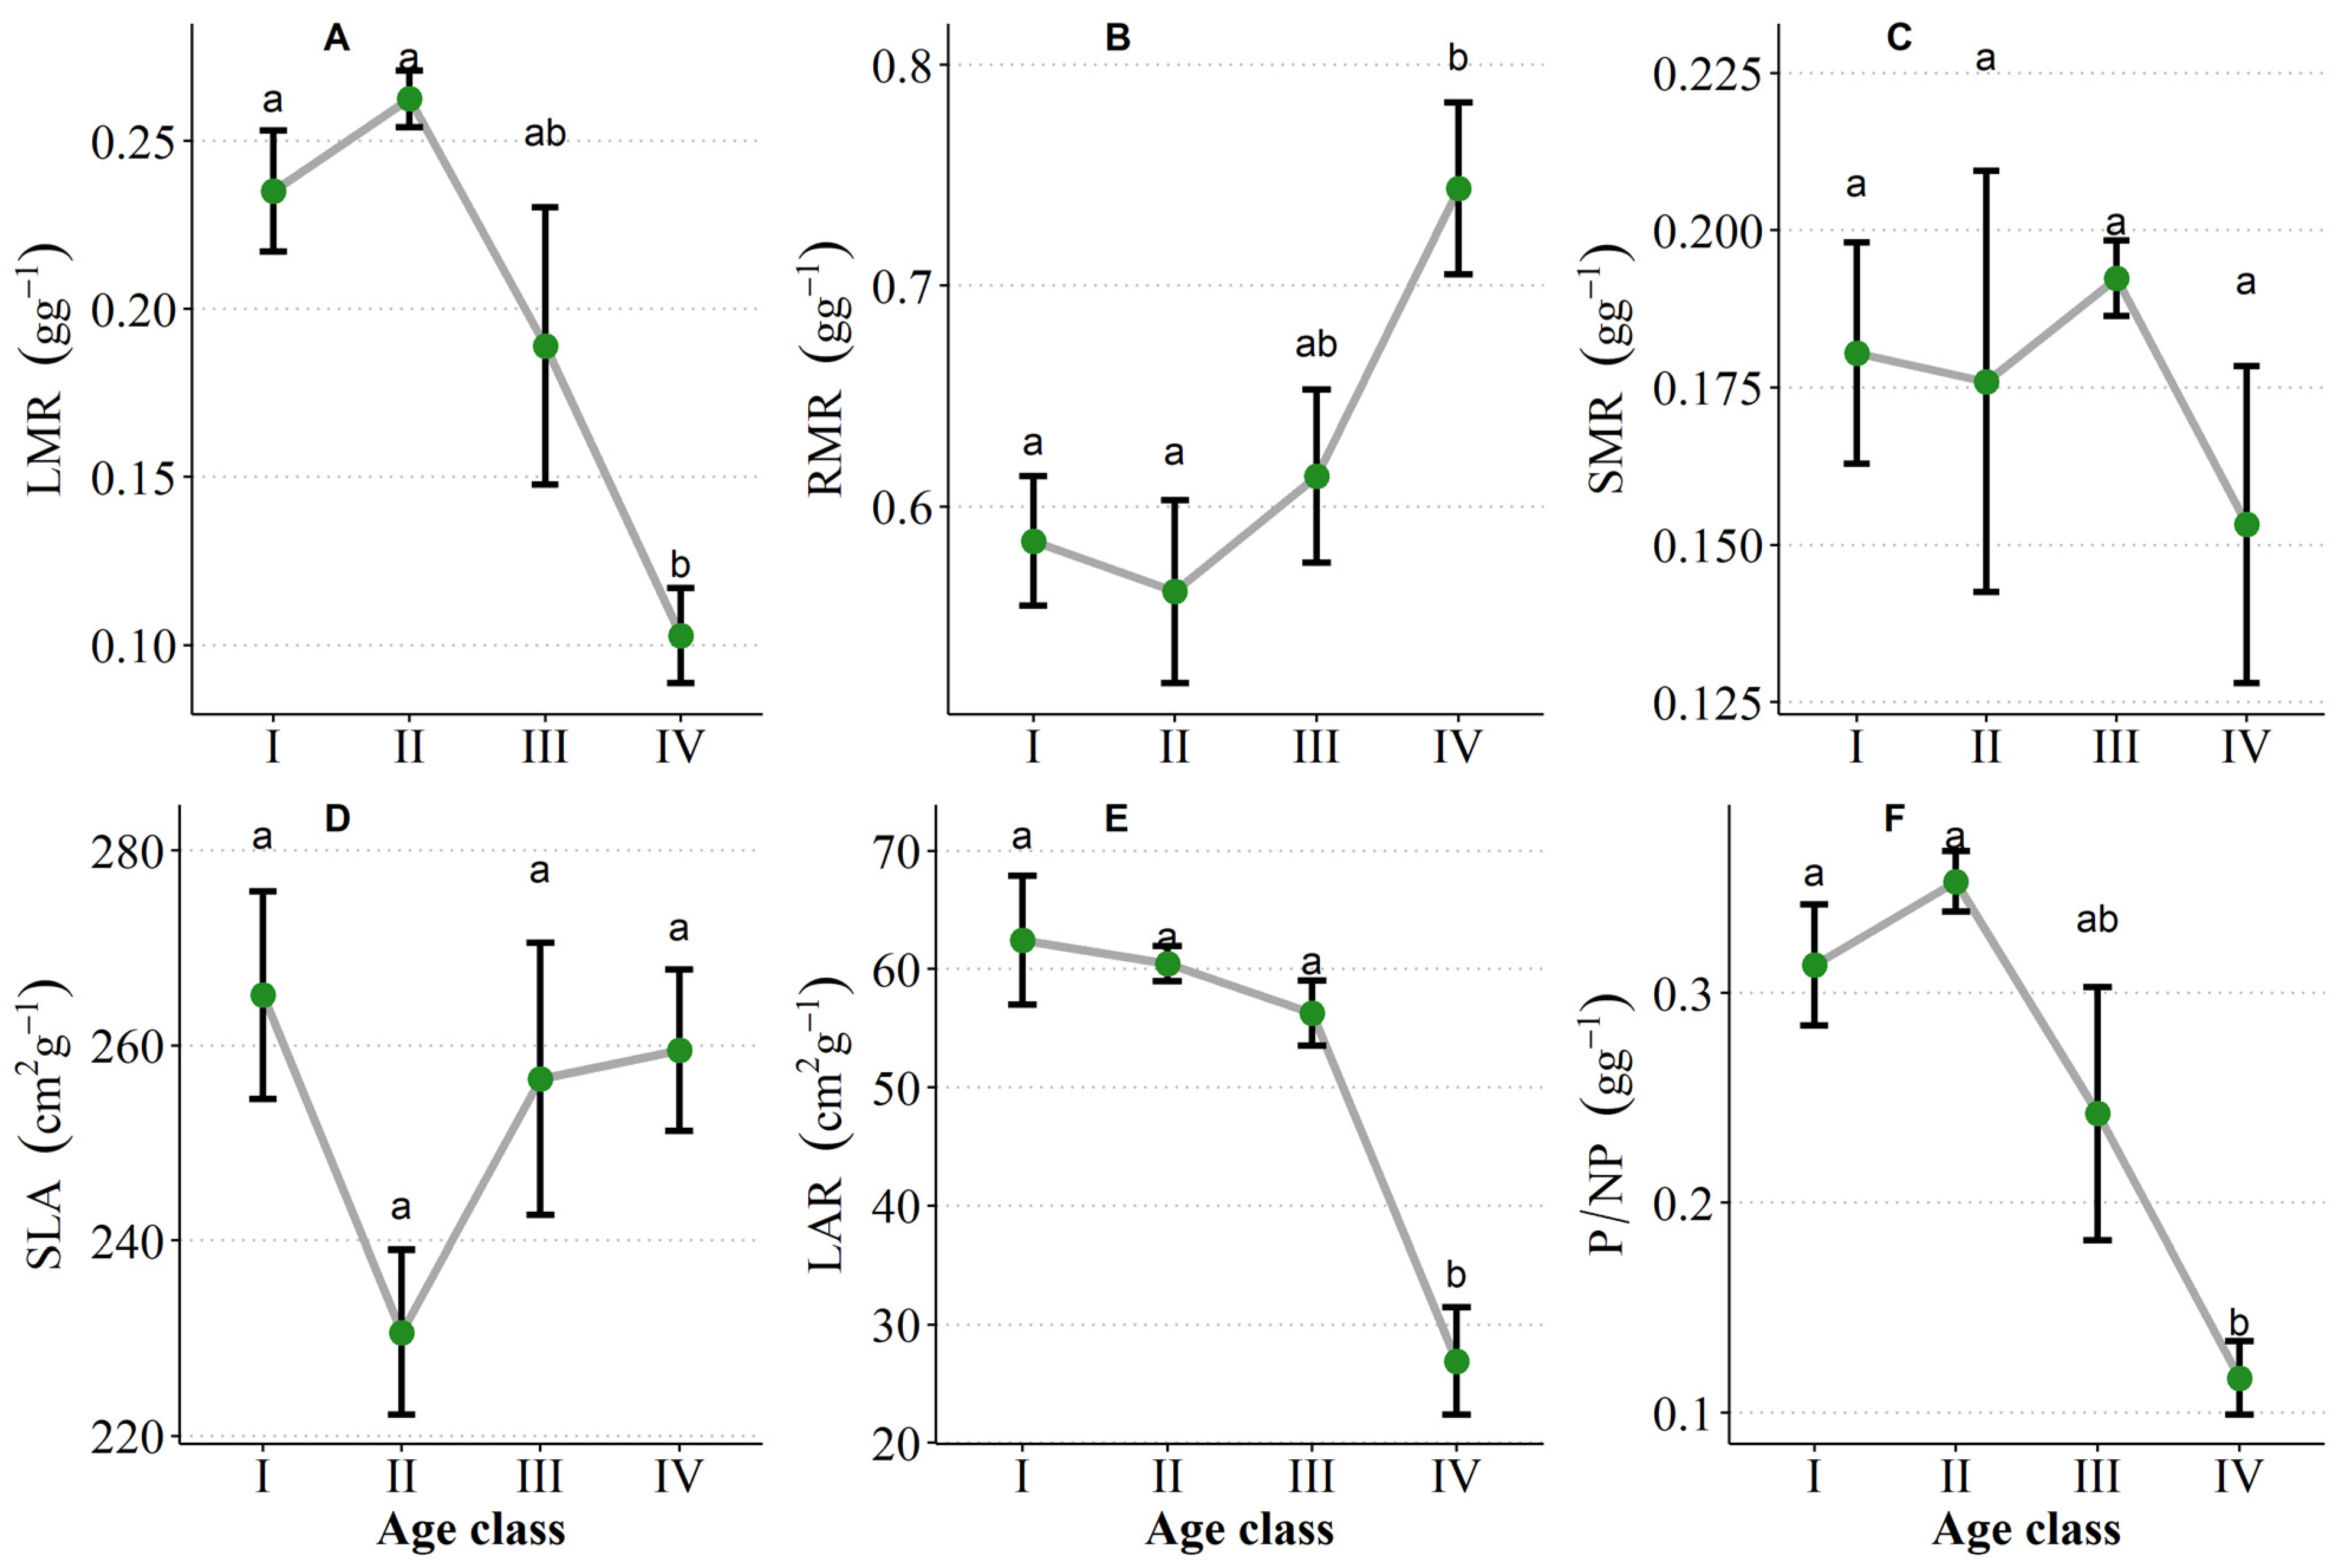
3.4.1. Biomass Allocation
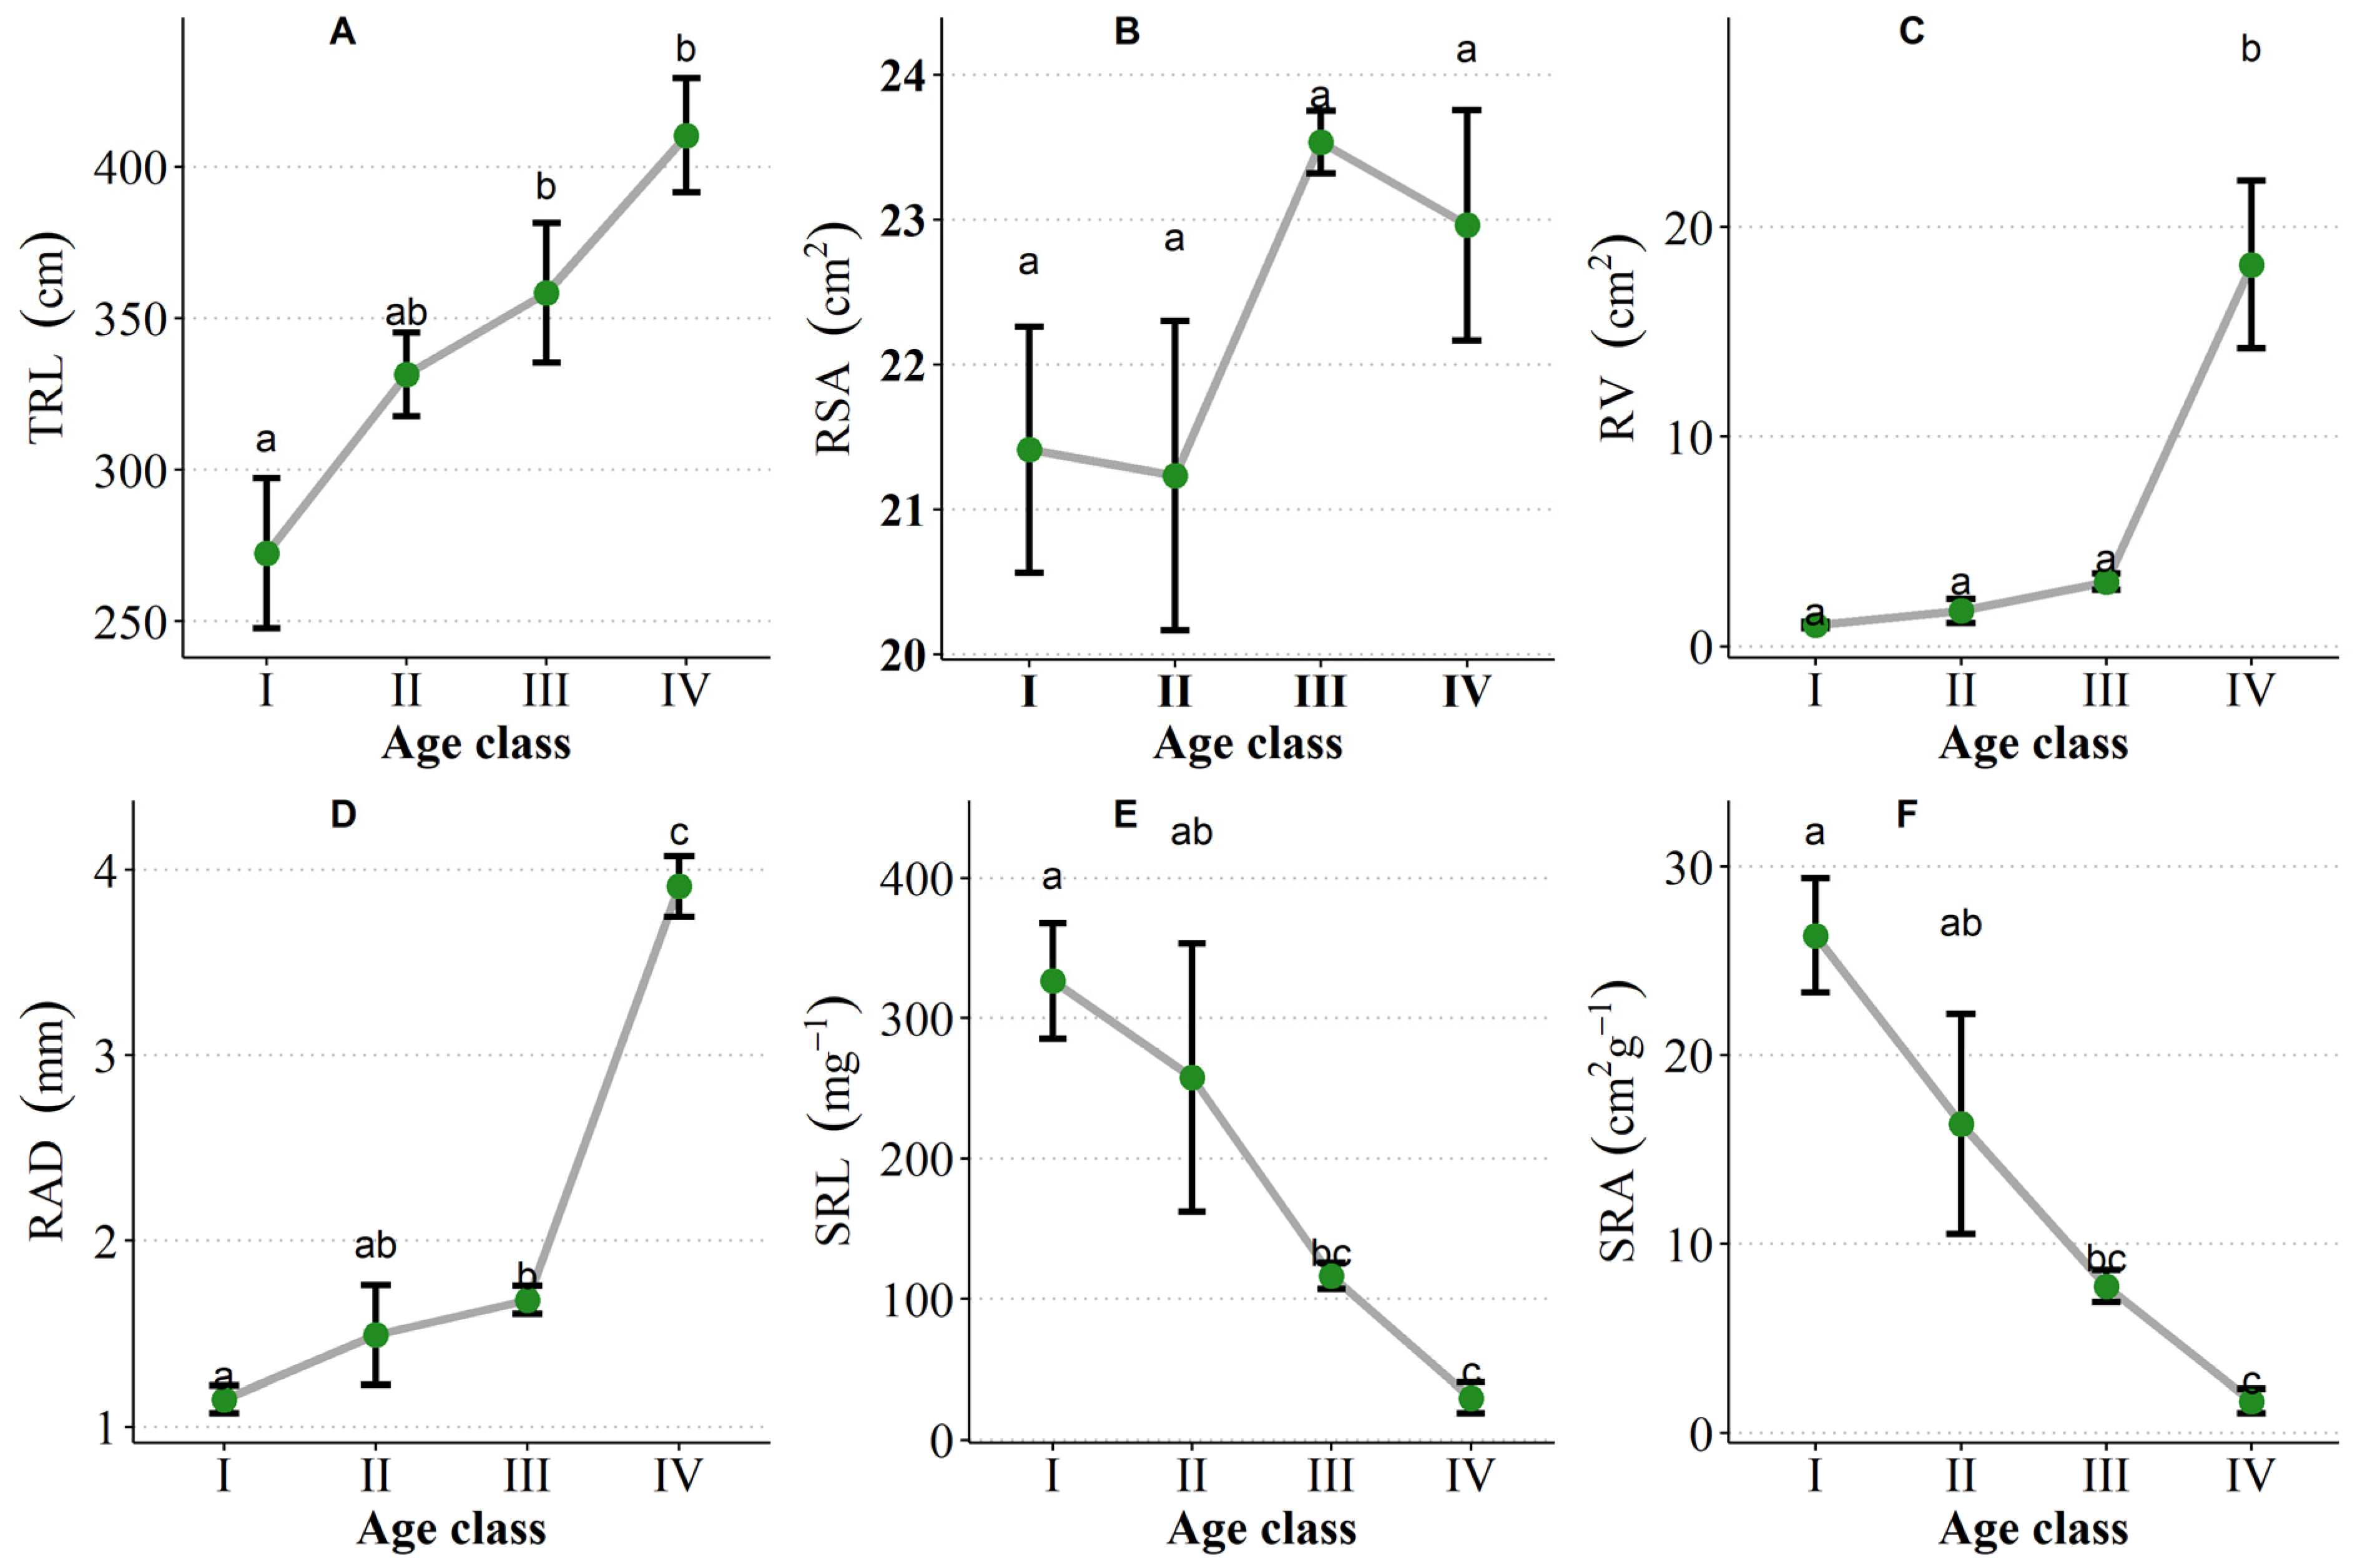
Variance analysis showed that seedling age had significant effects on LMR (F = 5.51, p < 0.01), RMR (F = 3.34, p < 0.05), LAR (F = 5.93, p < 0.01), and p/NP F = 5.15, p < 0.05), but not on SMR (F = 0.41, p = 0.75) nor SLA (F = 1.20, p = 0.35). There were no significant differences among age groups I, II, and III in LMR, LAR, and p/NP, but these indices all decreased significantly at IV (Figure 5A,E,F). As the age increased, the RMR decreased first and then increased significantly (Figure 5B).

3.4.2. Root Traits

Seedling age had significant effects on total root length (F = 4.74, p < 0.05), root volume (F = 34.64, p < 0.01), average root diameter (F = 82.42, p < 0.01), and specific root length (F = 7.19, p < 0.01), but not on specific root surface area (F = 1.35, p = 0.30). With the increase of seedling age, root length continued to increase (Figure 6A), but specific root length and specific root surface area continued to decrease significantly (Figure 6E,F). However, RV and RAD showed no significant difference among I, II, and III, and increased significantly at IV (Figure 6C,D).

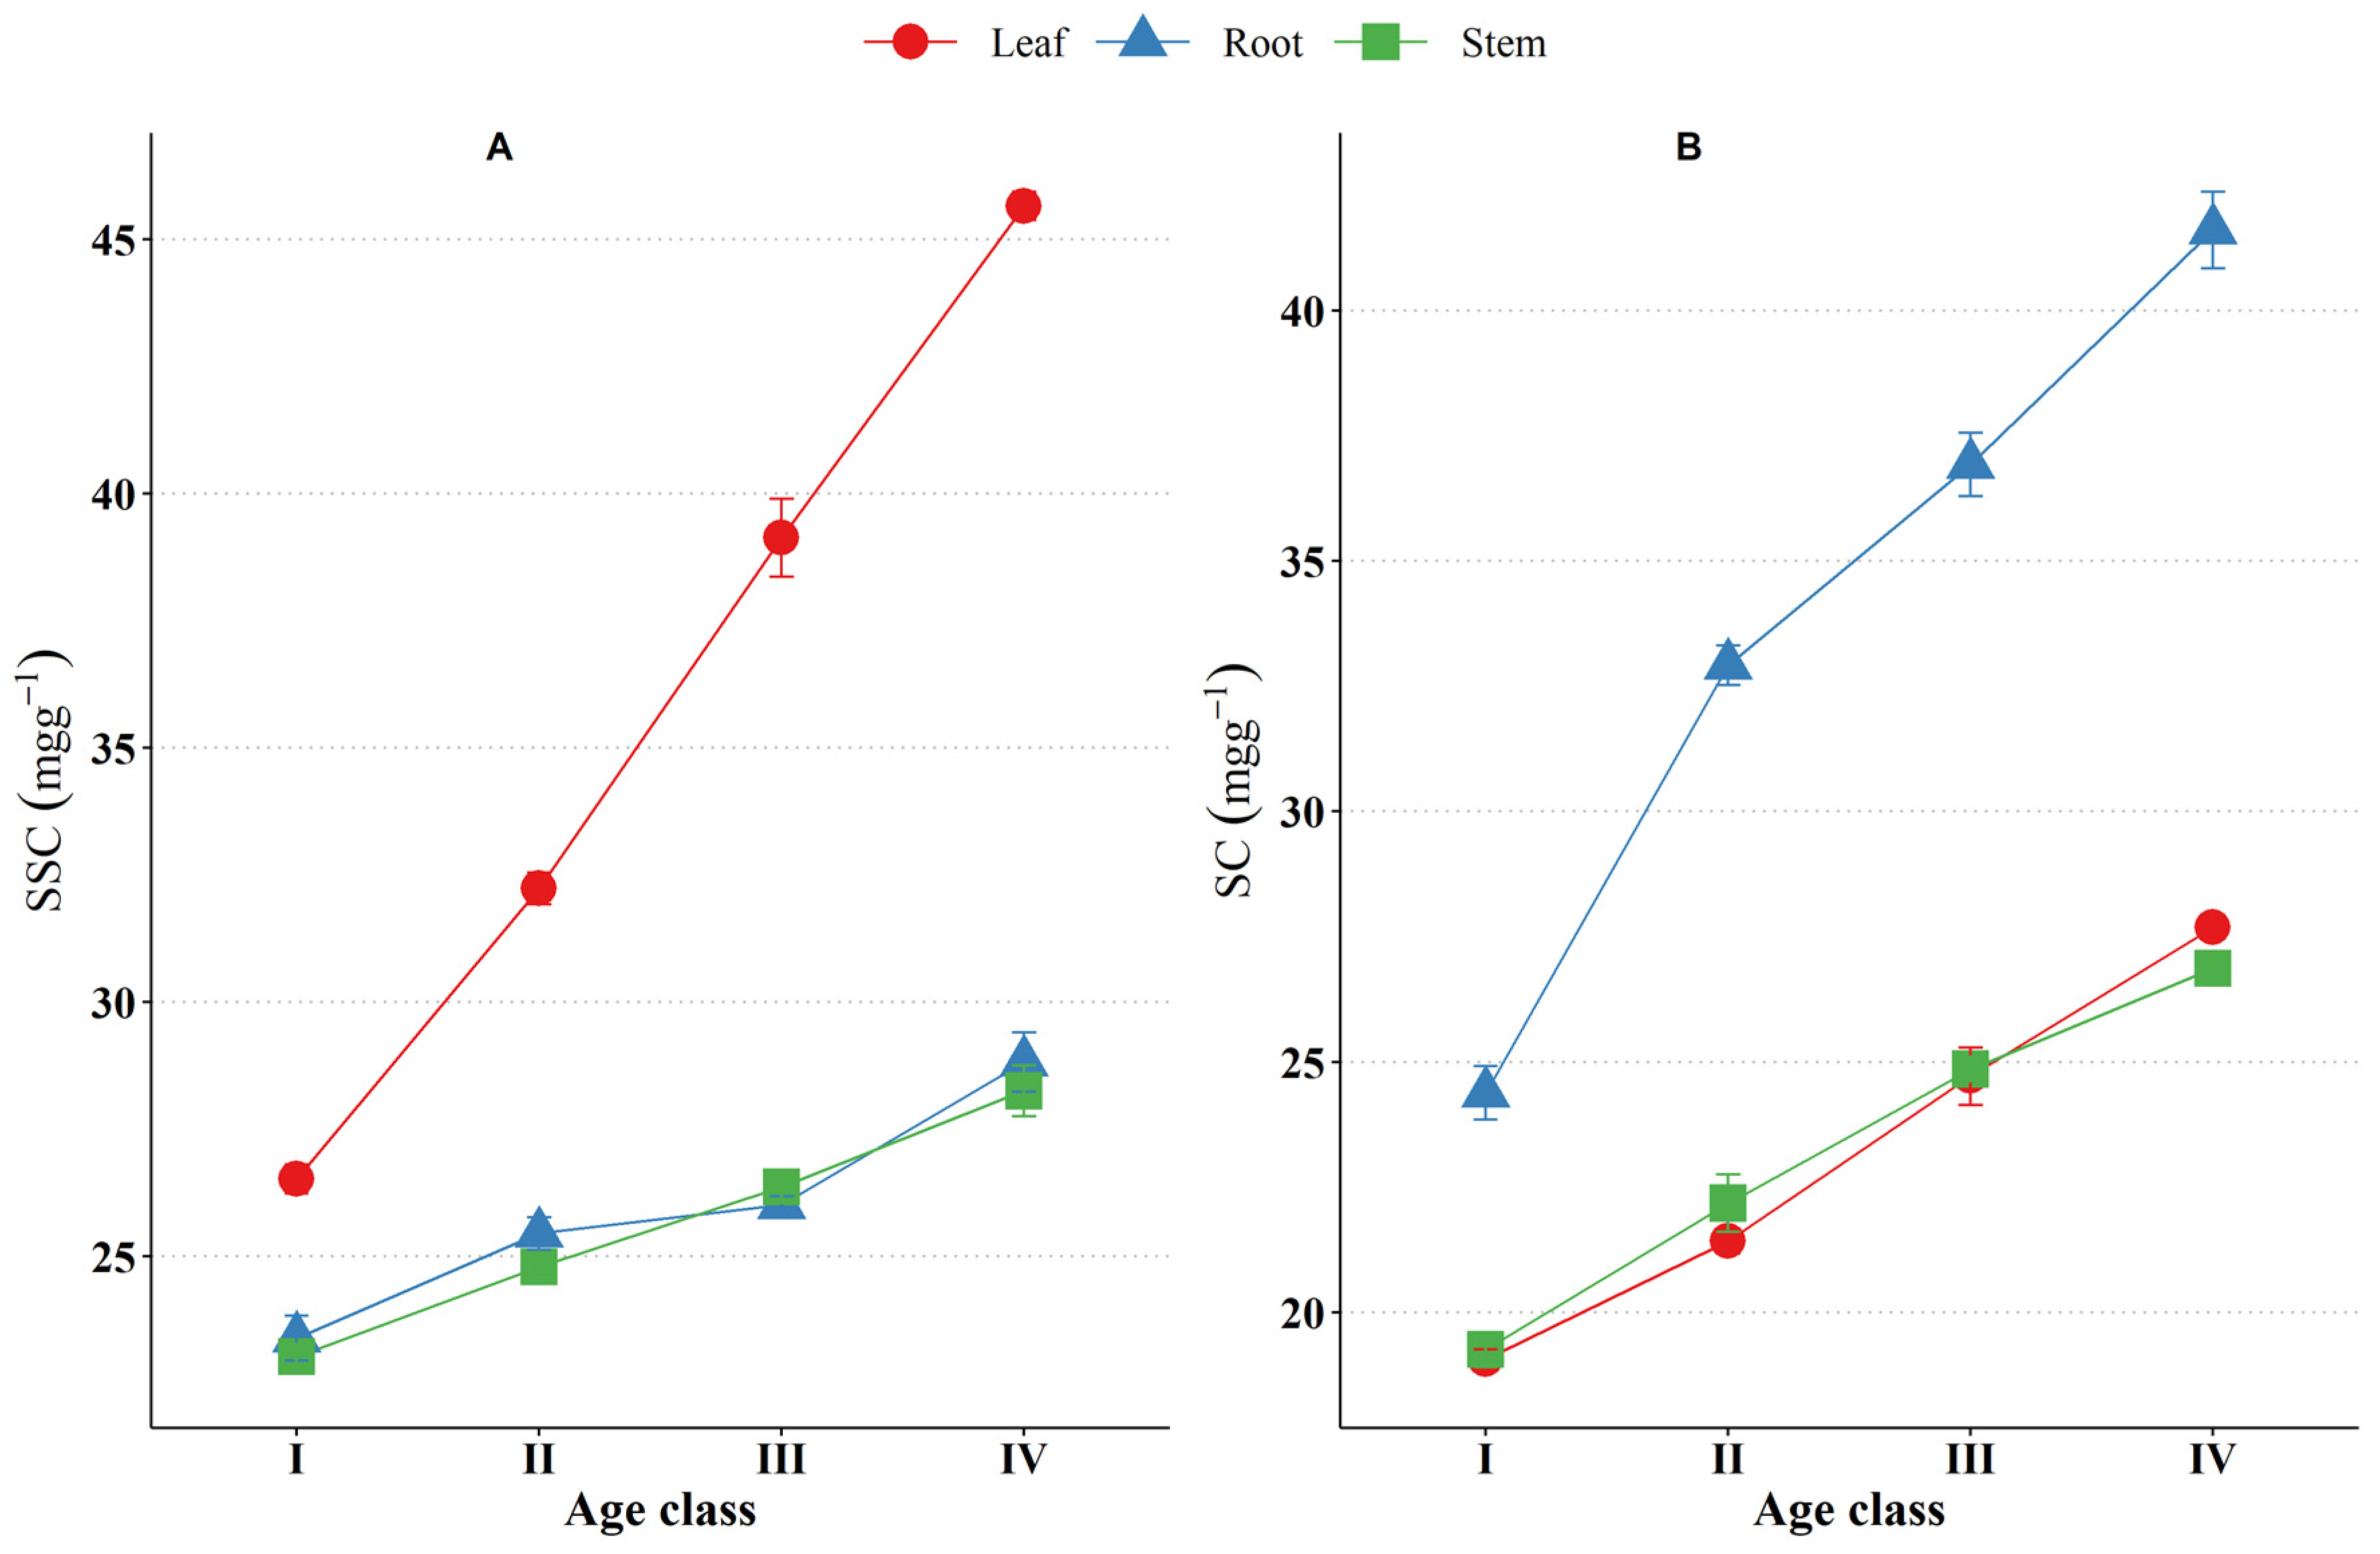
3.4.3. Non-Structural Carbohydrate (NSC)

There were significant differences in SSC (F = 312.60, p < 0.01) and SC (F = 329.40, p < 0.01) among different ages. With the increase of age, the SSC and SC of the root, stem, and leaf all increased significantly, and their orders were I < II < III < IV (p < 0.01, Figure 7). Organs also showed significant effects on SSC (F = 631.57, p < 0.01) and SC (F = 543.37, p < 0.01), respectively. There was no significant difference in soluble sugar between roots and stems (p > 0.05), which was significantly lower than that of leaves (p < 0.01). For starch, the root was significantly greater than that of the stem and leaf (p < 0.01), but there was no significant difference between the stem and leaf (p > 0.05).

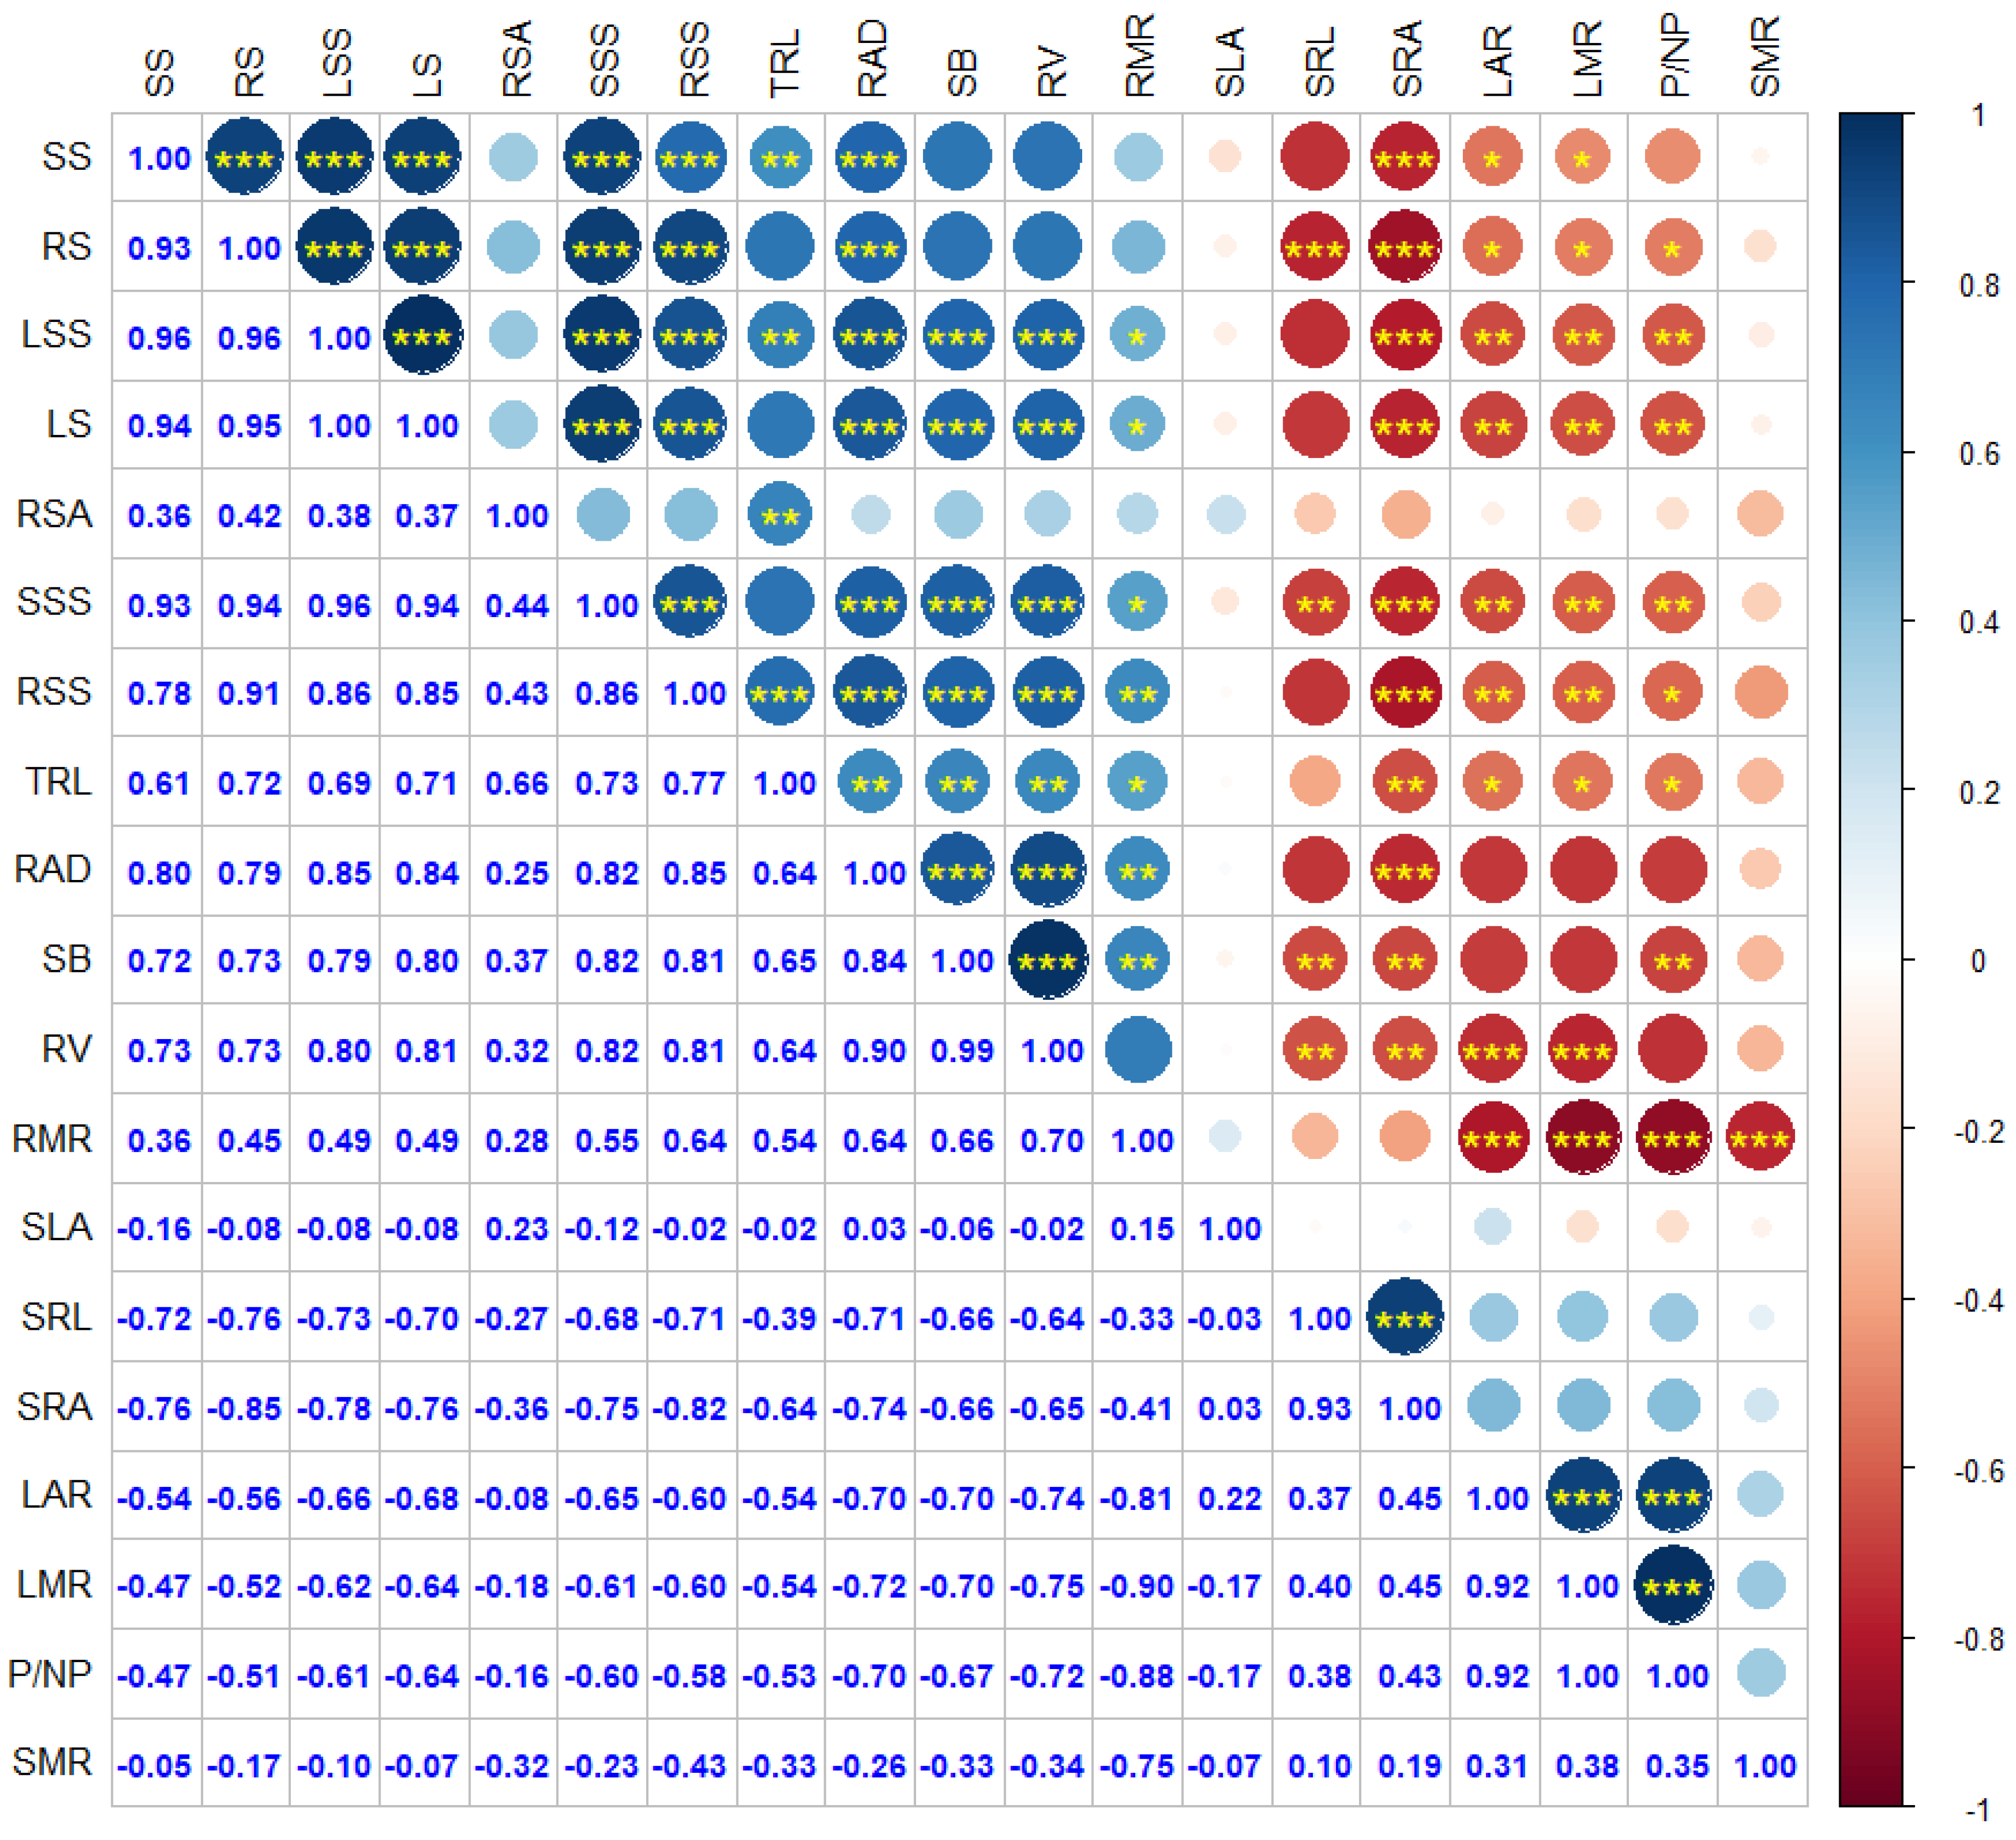
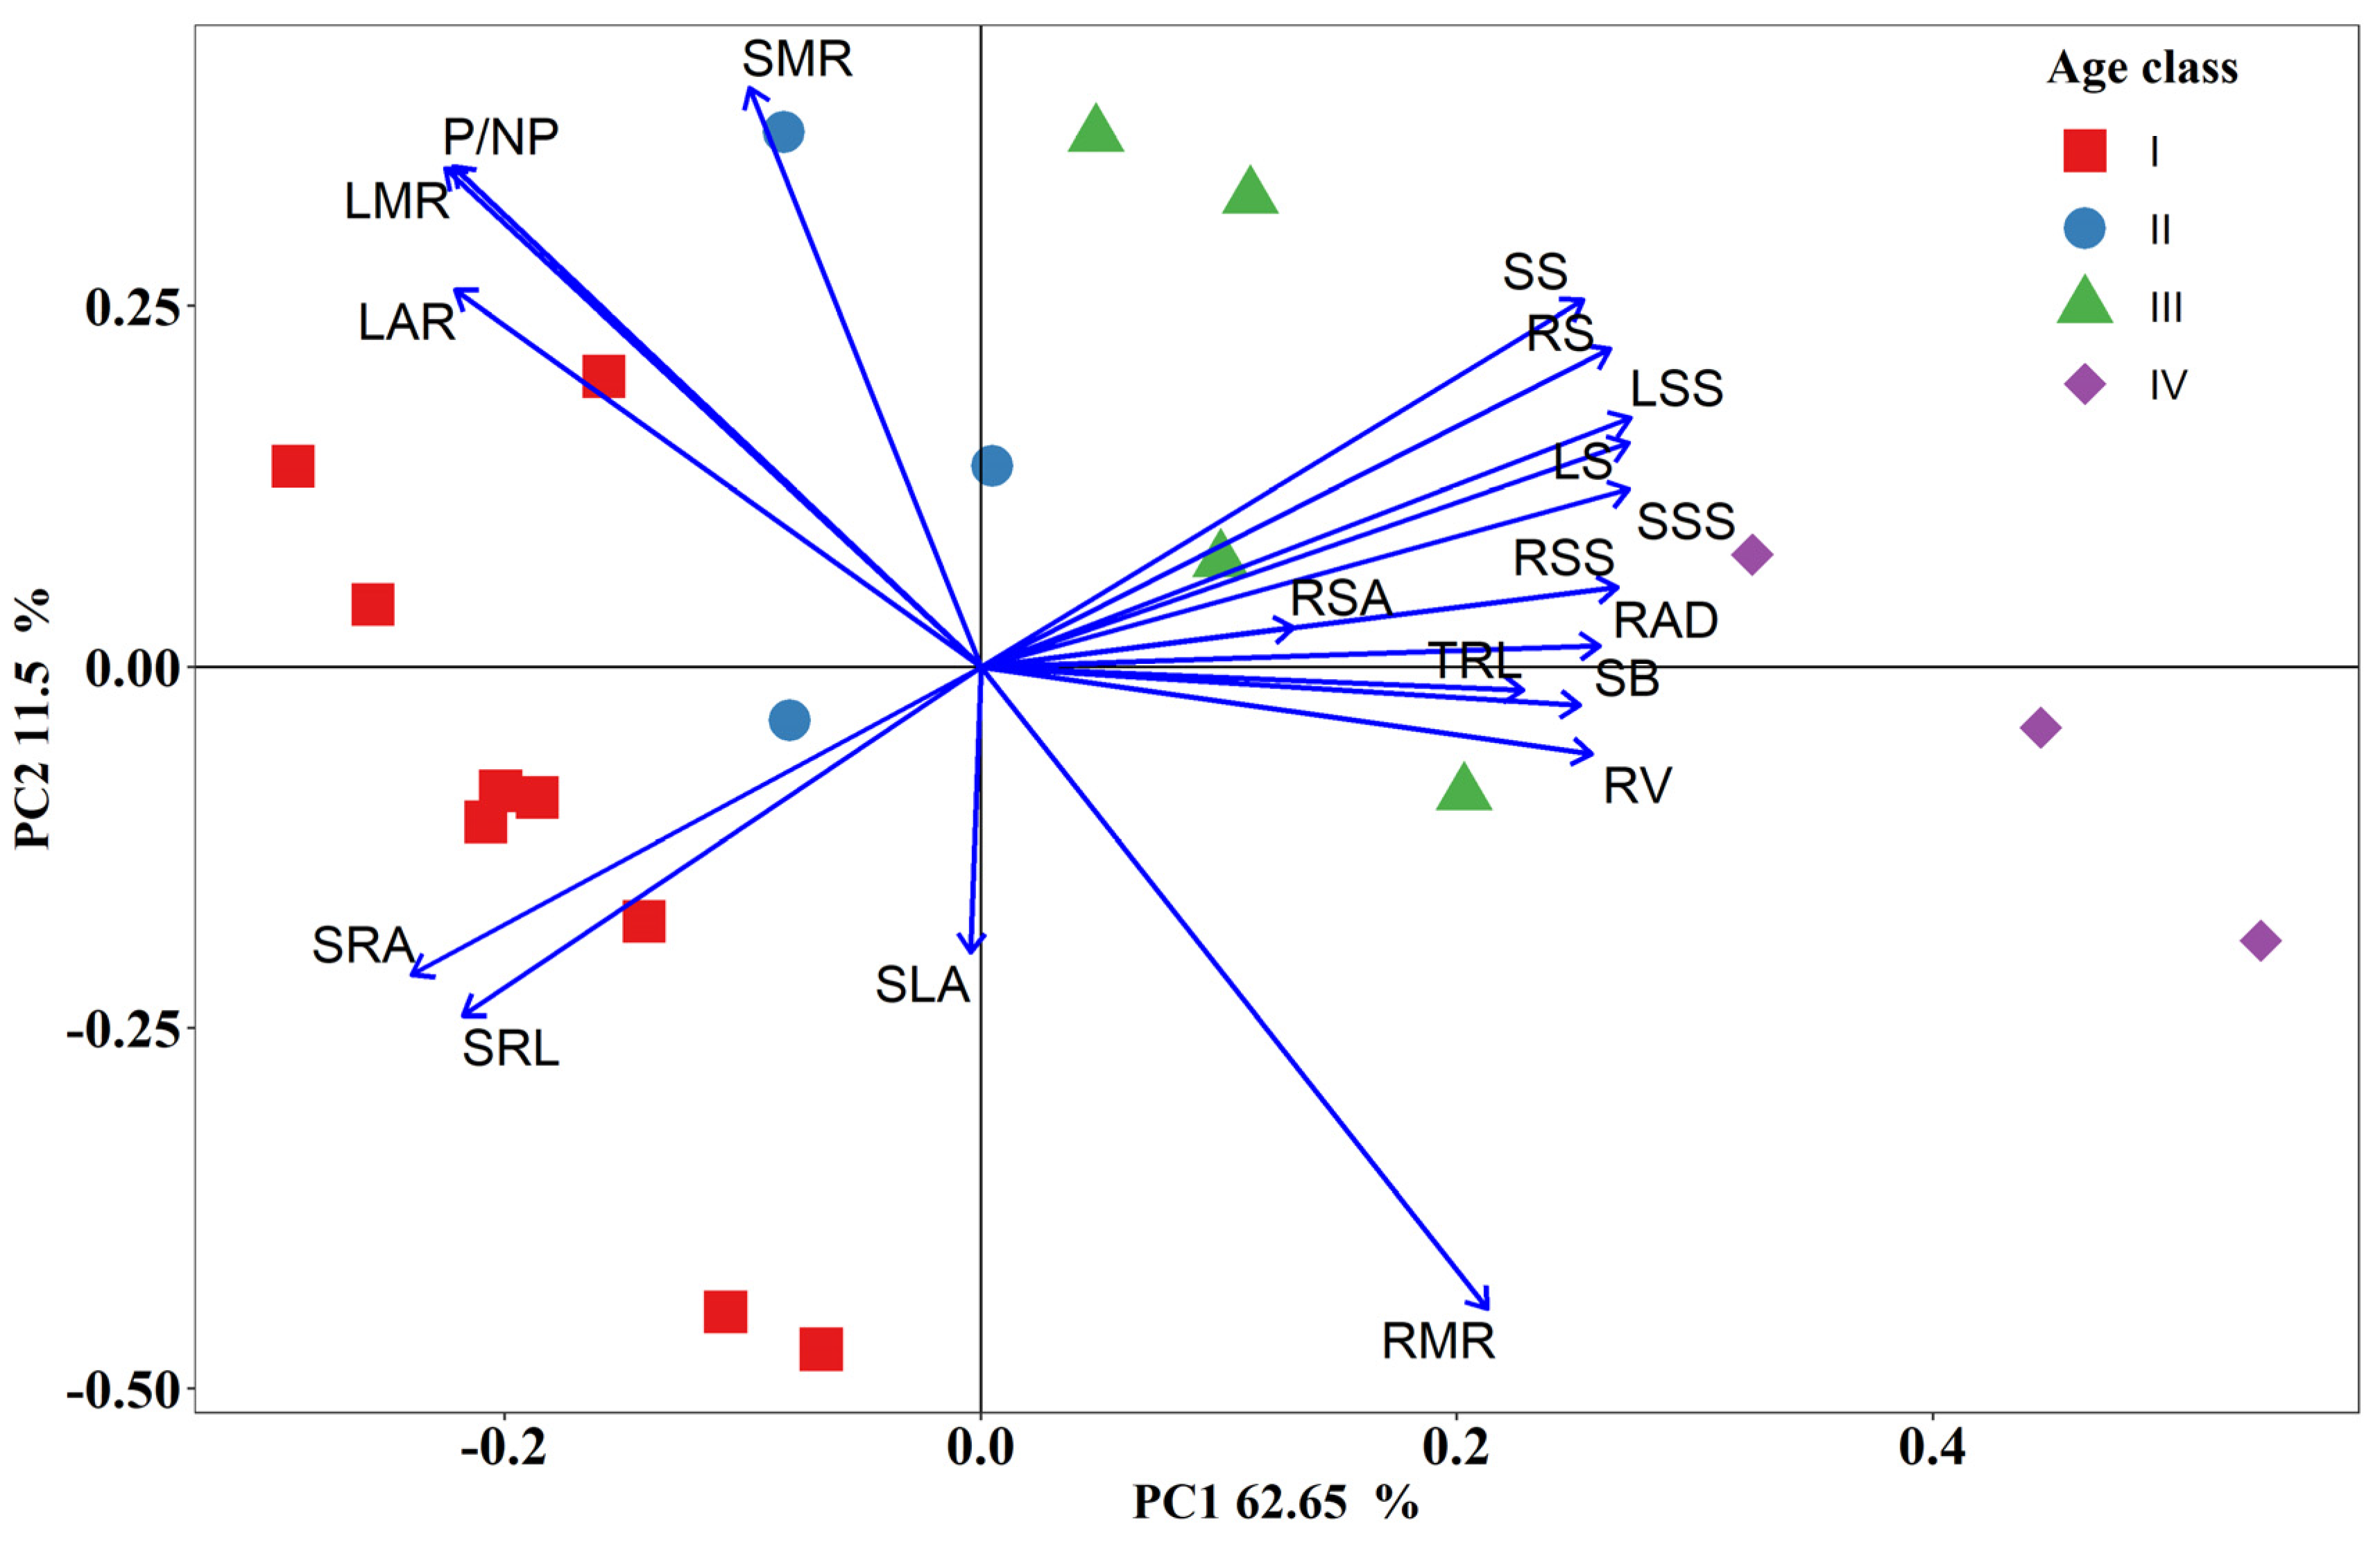
3.5. Correlation Analysis of Seedling Traits

SB was negatively correlated with LMR, LAR, P/NP, SRL, and SRA, and positively correlated with RMR, TRL, RV, RAD, RSS, SSS, LSS, RS, SS, and LS (Figure 8). LMR, LAR, and P/NP were negatively correlated with RMR, TRL, RV, and RAD. RSS, SSS, LSS, RS, SS, and LS were negatively correlated with LMR, LAR, P/NP, SRL, and SRA, and positively correlated with RMR, TRL, RV, and RAD (the correlation between SS and RMR was not significant).
The PCA incorporating seedling traits revealed that together, the first and second principal components represented 74.15% of the total variation (Figure 9). The first principal component (62.65%) was mainly related to seedling growth, including SB, NSC (SS, SSS, LSS, RS, SS, and LS), and root traits (RV, TRL, RAD, RSA, SRL, and SRA). The second principal component (11.5%) was associated with biomass allocation, including SMR, LMR, LAR, P/NP, SLA, and RMR.

4. Discussion

Over the past decades, the predominant approach to studying successional dynamics has been to examine how community-level properties (e.g., diversity, biomass/carbon) vary over time and what factors influence their rates of change. Demographic rates of species can reveal mechanisms that underpin community assembly [49]. The seedling density of the Q. acutissima plantation in this paper was 14,063 N ha−1 in 2010 and 8667 N ha−1 in 2017. Thus, there were sufficient seedlings under the Q. acutissima plantation, which was related to the ability of shade tolerance in the seedling stage [44]. The size distribution of seedlings in 2010 and 2017 was pyramid-shaped, indicating that the seedling bank was relatively stable. Compared with 2010, the stand density changed little in 2017, but the seedling density decreased significantly, reaching only 61.63% of that in 2010. Several previous studies have suggested that low soil moisture caused by precipitation reduction is an important reason for limiting forest natural regeneration [20,50,51]. From 2014 to 2016, the relative soil water content in the Q. acutissima forest significantly and continuously decreased. Multiyear lags in tree drought recovery, termed ‘drought legacy effects’, are important for understanding the impacts of drought on forest ecosystems [52]. Thus, we thought that the decrease of seedling bank density was closely related to the drought for 3 consecutive years. However, the responses of seedlings of different sizes were significantly different. The seedling density in the height class 0–20 cm in 2010 was similar to that in 2017. Rodríguez-García et al. [22] suggested that the significant variables that best explained the total seedling and viable seedling density were the spring and autumn precipitation of the year prior to establishment. During 2014 and 2016, the higher precipitation and soil water content of the Q. acutissima forest in April, May, and June may have contributed to seedling establishment. However, the seedling density in the height class 20–40 cm decreased more sharply in 2017 than in 2010, which was related to the significant decrease of relative soil water content from 2014 to 2016. Our results are consistent with the conclusions drawn by Rey and Alcántara [24]. For the seedlings taller than 40 cm, the decrease of density in 2017 was more obvious than that in 2010. Their death may have been related to the increase of minimum light demand with the increase of seedling size [29]. Many studies have shown that the conversion rate from seedlings to saplings is very low due to the insufficient relative light intensity under the forest for long-term survival [14,23,24,53]. Studies on the natural regeneration of Quercus have suggested that higher light intensity is necessary for successful regeneration [16,54]. Therefore, the microenvironment in the forest and the adaptability of seedlings with different sizes are important factors determining the dynamics of the seedling bank.
The critical process for natural regeneration is seedling survival [24]. It was found that the decrease of Q. acutissima seedling density in the height class 20–40 cm was significant, and their age was less than 5 years. Ammer et al. [53] suggested that the chances of a seedling surviving intraspecific competition for Fagus sylvatica L. were strongly determined by its dominance ranking within the first 5 years after establishment. From 2014 to 2016, the relative soil water content in the forest was significantly lower than that in other years, and the 2–4-year seedlings experienced this stage or part of it. There were no significant differences in biomass, biomass distribution, RSA, and RV among 2–4-year seedlings, indicating that their growth was significantly inhibited. Root production would decrease at severe soil drought [55,56]. In particular, Pinus taeda L. ceased root growth between −0.3 and −1.2 MPa [57]. Furthermore, severe drought increased physical soil resistance, which is assumed to restrict root growth [58]. Although there was the highest soil water content at −20 cm and −30 cm, it it may have been difficult for the seedling roots of Q. acutissima to grow to this depth under severe drought stress. However, no significant differences in biomass allocation were found among 2–4-year seedlings. Sinz et al. [17] showed that the biomass allocation of Fraxinus pennsylvanica Marsh. seedlings did not change significantly. The biomass and RMR of 5–6-year seedlings increased significantly, which may be related to the fact that these seedlings experienced a more suitable soil water content in 2013, making their roots grow to a suitable soil depth. Ammer et al. [53] suggested that the older seedlings showed stronger adaptability under the forest. Therefore, the environmental variability in the Q. acutissima forest was a vital factor affecting the growth and survival of seedlings under the forest.
Morphological and physiological adaptation is an important way for seedlings to persist under the forest. TRL and RAD of Q. acutissima seedlings aged 2 to 4 years increased significantly. Correlation analysis showed that seedling biomass was significantly positively correlated with TRL and RV. The increase of root length fostered water uptake from the soil under drought stress [55,56]. The coarsening of roots was conducive to the storage of more NSC [59]. It was also found that NSC was positively correlated with RAD. Gaucher et al. [25] thought that allocating more NSC to the root system was conducive to the survival of Acer saccharum Marsh.seedlings under the forest. With the increase of age, the starch and soluble sugar of Q. acutissima seedlings increased significantly in the roots, stems, and leaves, consistent with the results of Lusk and Piper [28]. The increase of NSC did not improve the respiration of seedlings [60], and it was more sensitive than the changes of morphological indices [34]. We also found that the NSC of Q. acutissima seedlings aged 2 to 4 years changed more rapidly than morphological indices. Because there was a significantly positive correlation between seedling biomass and NSC indices, the increase of NSC content improved the survival of Q acutissima seedlings under the forest. For 5–6-year seedlings, RMR, TRL, RV, and RAD increased significantly, and the root morphological responses were more sensitive. Walters et al. [61] and Gaucher et al. [25] suggested that higher allocation to the roots favored long-term survival under the forest. Principal component analysis showed that root characteristics and NSC content were closely related to seedling growth. Therefore, the increase of root input and NSC content, as well as the regulation of biomass distribution, were the main ways for Q. acutissima seedlings to adapt to the variable environment under the forest.

5. Conclusions

The natural regeneration of plantations is a complex and long process, and the adaptability of seedlings under the forest is one of the key foundations for its successful regeneration. In the sample plot of the Q. acutissima plantation, the seedling bank was sufficient and stable, which was closely related to its shade tolerance. Compared with 2010, the seedling density decreased significantly in 2017. The most significant reduction in seedling density was observed for seedlings below 40 cm in height (seedling age ≤ 4 years), which is a critical stage for the natural regeneration of Q. acutissima.
During 2014 and 2016, precipitation decreased significantly, and SWC continued to decrease. The growth of 2–4-year seedlings was almost stagnant, and the regulation function of biomass distribution for themselves disappeared. Furthermore, their root growth was slow, which affected their root distribution in the 20–30 cm soil layer with the highest RSWC. Therefore, drought stress was the direct cause of the disappearance of 2–4-year seedlings. For those with seedling heights higher than 40 cm (seedling age ≥ 5a), which had root systems distributed in the appropriate soil depth, their growth was less affected. With the increase of age, the regulation ability of root morphology, NSC, and biomass allocation increased, which was the main way for Q. acutissima seedlings to adapt to drought stress in the understory. Therefore, as an important factor limiting the establishment of seedlings, drought stress together with seedling adaptation influenced the dynamics of the seedling bank in the understory of Q. acutissima plantations.
In future research, to provide theoretical support for the sustainable management of Q. acutissima plantations, we should strengthen the monitoring of environmental changes in the plantation, explore limiting mechanisms of seedling growth, and put forward reasonable management measures for natural regeneration.

Author Contributions

Conceptualization, P.M. and B.C.; formal analysis, R.N.; investigation, X.K. and Q.L.; resources, W.M. and B.Z.; data curation, P.G. and J.D.; writing—original draft preparation, L.G.; writing—review and editing, P.M. and B.C.; visualization, R.N.; supervision, B.C.; funding acquisition, B.C. All authors have read and agreed to the published version of the manuscript.

Funding

This research was funded by the Key R & D project of Shandong Province, China (2017CXGC0316), Funds of the Shandong “Double Tops Program” (SYL2017XTTD09) and Central Finance Forestry Reform and Development Fund (2020TG08).

Data Availability Statement

Not applicable.

Conflicts of Interest

The authors declare no conflict of interest.

References

  1. Payn, T.; Carnus, J.M.; Freer-Smith, P.; Kimberley, M.; Kollert, W.; Liu, S.; Orazio, C.; Rodriguez, L.; Silva, L.N.; Wingfield, M.J. Changes in planted forests and future global implications. For. Ecol. Manag. 2015, 352, 57–67. [Google Scholar] [CrossRef] [Green Version]
  2. Liu, S.; Yang, Y.; Wang, H. Development strategy and management countermeasures of planted forests in China: Transforming from timber-centered single objective management towards multi-purpose management for enhancing quality and benefits of ecosystem services. Acta Ecol. Sin. 2018, 3, 1–10. [Google Scholar] [CrossRef]
  3. Jaworski, A.; Podlaski, R. Structure and dynamics of selected stands of primeval character in the Pieniny National Park. Dendrobiology 2007, 58, 25–41. [Google Scholar]
  4. Szymura, T.H.; Dunajski, A.; Aman, I.; Makowski, M.; Szymura, M. The spatial pattern and microsites requirements of Abies alba natural regeneration in the Karkonosze Mountains. Dendrobiology 2007, 58, 51–57. [Google Scholar]
  5. Madsen, P.; Hahn, K. Natural regeneration in a beech-dominated forest managed by close-to-nature principles—A gap cutting based experiment. Can. J. For. Res. 2008, 38, 1716–1729. [Google Scholar] [CrossRef]
  6. Agestam, E.; Ekö, P.M.; Nilsson, U.; Welander, N.T. The effects of shelterwood density and site preparation on natural regeneration of Fagus sylvatica in southern Sweden. For. Ecol. Manag. 2003, 176, 61–73. [Google Scholar] [CrossRef]
  7. Petritan, A.M.; Biris, I.A.; Merce, O.; Turcu, D.O.; Petritan, I.C. Structure and diversity of a natural temperate sessile oak (Quercus petraea L.)—European Beech (Fagus sylvatica L.) forest. For. Ecol. Manag. 2012, 280, 140–149. [Google Scholar] [CrossRef]
  8. Pröll, G.; Darabant, A.; Gratzer, G.; Katzensteiner, K. Unfavourable microsites, competing vegetation and browsing restrict post-disturbance tree regeneration on extreme sites in the Northern Calcareous Alps. Eur. J. For. Res. 2015, 134, 293–308. [Google Scholar] [CrossRef]
  9. Valladares, F.; Niinemets, Ü. Shade tolerance, a key plant feature of complex nature and consequences. Annu. Rev. Ecol. Evol. Syst. 2008, 39, 237–257. [Google Scholar] [CrossRef] [Green Version]
  10. Jarčuška, B. Growth, survival, density, biomass partitioning and morphological adaptations of natural regeneration in Fagus sylvatica. A review. Dendrobiology 2009, 61, 3–11. [Google Scholar]
  11. Valladares, F.; Laanisto, L.; Niinemets, Ü.; Zavala, M.A. Shedding light on shade: Ecological perspectives of understorey plant life. Plant Ecol. Divers 2016, 9, 237–251. [Google Scholar] [CrossRef] [Green Version]
  12. Guariguata, M.R. Seed and seedling ecology of tree species in neotropical secondary forests: Management implications. Ecol. Appl. 2000, 10, 145–154. [Google Scholar] [CrossRef]
  13. Barna, M.; Bosela, M. Tree species diversity change in natural regeneration of a beech forest under different management. For. Ecol. Manag. 2015, 342, 93–102. [Google Scholar] [CrossRef]
  14. Pardos, M.; Montes, F.; Aranda, I.; Cañellas, I. Influence of environmental conditions on germinant survival and diversity of Scots pine (Pinus sylvestris L.) in central Spain. Eur. J. For. Res. 2007, 126, 37–47. [Google Scholar] [CrossRef]
  15. Szewczyk, J.; Szwagrzyk, J. Spatial and temporal variability of natural regeneration in a temperate old-growth forest. Ann. For. Sci. 2010, 67, 202. [Google Scholar] [CrossRef]
  16. Dobrowolska, D. Effect of stand density on oak regeneration in flood plain forests in Lower Silesia, Poland. Forestry 2008, 81, 511–523. [Google Scholar] [CrossRef] [Green Version]
  17. Sinz, A.; Gardiner, E.S.; Lockhart, B.R.; Souter, R.A. Morphological acclimation and growth of ash (Fraxinus pennsylvanica Marsh.) advance regeneration following overstory harvesting in a Mississippi River floodplain forest. For. Ecol. Manag. 2011, 261, 246–254. [Google Scholar] [CrossRef]
  18. Nagel, T.A.; Svoboda, M.; Rugani, T.; Diaci, J. Gap regeneration and replacement patterns in an old-growth Fagus-Abies forest of Bosnia-Herzegovina. Plant Ecol. 2010, 208, 307–318. [Google Scholar] [CrossRef]
  19. Príncipe, A.; Nunes, A.; Pinho, P.; do Rosário, L.; Correia, O.; Branquinho, C. Modeling the long-term natural regeneration potential of woodlands in semi-arid regions to guide restoration efforts. Eur. J. For. Res. 2014, 133, 757–767. [Google Scholar] [CrossRef]
  20. Rodriguez-Garcia, E.; Gratzer, G.; Bravo, F. Climatic variability and other site factor influences on natural regeneration of Pinus pinaster Ait. in Mediterranean forests. Ann. For. Sci. 2011, 68, 811–823. [Google Scholar] [CrossRef] [Green Version]
  21. Dobrowolska, D.; Bolibok, L. Is climate the key factor limiting the natural regeneration of silver fir beyond the northeastern border of its distribution range? For. Ecol. Manag. 2019, 439, 105–121. [Google Scholar] [CrossRef]
  22. Rodríguez-García, E.; Juez, L.; Bravo, F. Environmental influences on post-harvest natural regeneration of Pinus pinaster Ait. in Mediterranean forest stands submitted to the seed-tree selection method. Eur. J. For. Res. 2010, 129, 1119–1128. [Google Scholar] [CrossRef] [Green Version]
  23. Szwagrzyk, J.; Szewczyk, J.; Bodziarczyk, J. Dynamics of seedling banks in beech forest: Results of a 10-year study on germination, growth and survival. For. Ecol. Manag. 2001, 141, 237–250. [Google Scholar] [CrossRef]
  24. Rey, P.J.; Alcántara, J.M. Recruitment dynamics of a fleshy-fruited plant (Olea europaea): Connecting patterns of seed dispersal to seedling establishment. J. Ecol. 2000, 88, 622–633. [Google Scholar] [CrossRef]
  25. Gaucher, C.; Gougeon, S.; Mauffette, Y.; Messier, C. Seasonal variation in biomass and carbohydrate partitioning of understory sugar maple (Acer saccharum) and yellow birch (Betula alleghaniensis) seedlings. Tree Physiol. 2005, 25, 93–100. [Google Scholar] [CrossRef] [Green Version]
  26. Balandier, P.; Sinoquet, H.; Frak, E.; Giuliani, R.; Vandame, M.; Descamps, S.; Coll, L.; Adam, B.; Prevosto, B.; Curt, T. Six-year time course of light-use efficiency, carbon gain and growth of beech saplings (Fagus sylvatica) planted under a Scots pine (Pinus sylvestris) shelterwood. Tree Physiol. 2007, 27, 1073–1082. [Google Scholar] [CrossRef] [PubMed] [Green Version]
  27. Claveau, Y.; Messier, C.; Comeau, P.G. Interacting influence of light and size on aboveground biomass distribution in sub-boreal conifer saplings with contrasting shade tolerance. Tree Physiol. 2005, 25, 373–384. [Google Scholar] [CrossRef] [Green Version]
  28. Lusk, C.H.; Piper, F.I. Seedling size influences relationships of shade tolerance with carbohydrate-storage patterns in a temperate rainforest. Funct. Ecol. 2007, 21, 78–86. [Google Scholar] [CrossRef]
  29. Sendall, K.M.; Reich, P.B.; Lusk, C.H. Size-related shifts in carbon gain and growth responses to light differ among rainforest evergreens of contrasting shade tolerance. Oecologia 2018, 187, 609–623. [Google Scholar] [CrossRef]
  30. Gasser, D.; Messier, C.; Beaudet, M.; Lechowicz, M.J. Sugar maple and yellow birch regeneration in response to canopy opening, liming and vegetation control in a temperate deciduous forest of Quebec. For. Ecol. Manag. 2010, 259, 2006–2014. [Google Scholar] [CrossRef] [Green Version]
  31. Soto, D.P.; Jacobs, D.F.; Salas, C.; Donoso, P.J.; Fuentes, C.; Puettmann, K.J. Light and nitrogen interact to influence regeneration in old-growth Nothofagus-dominated forests in south-central Chile. For. Ecol. Manag. 2017, 384, 303–313. [Google Scholar] [CrossRef]
  32. Myers, J.A.; Kitajima, K. Carbohydrate storage enhances seedling shade and stress tolerance in a neotropical forest. J. Ecol. 2007, 95, 383–395. [Google Scholar] [CrossRef]
  33. Lusk, C.H.; Falster, D.S.; Jara-Vergara, C.K.; Jimenez-Castillo, M.; Saldaña-Mendoza, A. Ontogenetic variation in light requirements of juvenile rainforest evergreens. Funct. Ecol. 2008, 22, 454–459. [Google Scholar] [CrossRef]
  34. Deng, X.; Xiao, W.; Shi, Z.; Zeng, L.; Lei, L. Combined effects of drought and shading on growth and non-structural carbohydrates in Pinus massoniana lamb. Seedlings. Forests 2020, 11, 18. [Google Scholar] [CrossRef] [Green Version]
  35. Duque, L.O.; Setter, T.L. Partitioning index and non-structural carbohydrate dynamics among contrasting cassava genotypes under early terminal water stress. Environ. Exp. Bot. 2019, 163, 24–35. [Google Scholar] [CrossRef]
  36. Gleason, S.M.; Ares, A. Photosynthesis, carbohydrate storage and survival of a native and an introduced tree species in relation to light and defoliation. Tree Physiol. 2004, 24, 1087–1097. [Google Scholar] [CrossRef] [Green Version]
  37. Veneklaas, E.J.; Den Ouden, F. Dynamics of non-structural carbohydrates in two Ficus species after transfer to deep shade. Environ. Exp. Bot. 2005, 54, 148–154. [Google Scholar] [CrossRef]
  38. Sevanto, S.; Mcdowell, N.G.; Dickman, L.T.; Pangle, R.; Pockman, W.T. How do trees die? A test of the hydraulic failure and carbon starvation hypotheses. Plant Cell Environ. 2014, 37, 153–161. [Google Scholar] [CrossRef]
  39. Galvez, D.A.; Landhäusser, S.M.; Tyree, M.T. Low root reserve accumulation during drought may lead to winter mortality in poplar seedlings. New Phytol. 2013, 198, 139–148. [Google Scholar] [CrossRef]
  40. Ivanov, Y.V.; Kartashov, A.V.; Zlobin, I.E.; Sarvin, B.; Stavrianidi, A.N.; Kuznetsov, V.V. Water deficit-dependent changes in non-structural carbohydrate profiles, growth and mortality of pine and spruce seedlings in hydroculture. Environ. Exp. Bot. 2019, 157, 151–160. [Google Scholar] [CrossRef]
  41. Tomasella, M.; Casolo, V.; Aichner, N.; Petruzzellis, F.; Savi, T.; Trifilò, P.; Nardini, A. Non-structural carbohydrate and hydraulic dynamics during drought and recovery in Fraxinus ornus and Ostrya carpinifolia saplings. Plant Physiol. Biochem. 2019, 145, 1–9. [Google Scholar] [CrossRef] [PubMed]
  42. Imaji, A.; Seiwa, K. Carbon allocation to defense, storage, and growth in seedlings of two temperate broad-leaved tree species. Oecologia 2010, 162, 273–281. [Google Scholar] [CrossRef] [PubMed]
  43. Piper, F.I.; Reyes-Díaz, M.; Corcuera, L.J.; Lusk, C.H. Carbohydrate storage, survival, and growth of two evergreen Nothofagus species in two contrasting light environments. Ecol. Res. 2009, 24, 1233–1241. [Google Scholar] [CrossRef]
  44. Yang, Y.; Wang, C.; Liu, Y. The effect of low irradiance on growth, photosynthetic characteristics, and biomass allocation in two deciduous broad-leaved tree seedlings in southeast of Hubei Province. Acta Ecol. Sin. 2010, 30, 6082–6090. [Google Scholar]
  45. Xue, W.Y.; Yang, B.; Zhang, W.H.; Yu, S.C. Spatial pattern and spatial association of Quercus acutissima at different developmental stages in the Qiaoshan mountains. Acta Ecol. Sin. 2017, 37, 3375–3384. [Google Scholar] [CrossRef] [Green Version]
  46. Meng, Y.; Cao, B.; Dong, C.; Dong, X. Mount Taishan Forest ecosystem health assessment based on forest inventory data. Forests 2019, 10, 657. [Google Scholar] [CrossRef] [Green Version]
  47. Meng, Y.; Cao, B.; Mao, P.; Dong, C.; Cao, X.; Qi, L.; Wang, M.; Wu, Y. Tree species distribution change study in Mount Tai based on Landsat remote sensing image data. Forests 2020, 11, 130. [Google Scholar] [CrossRef] [Green Version]
  48. Zhou, Y.; Wu, D.; Yu, D.; Sui, C. Variations of nonstructural carbohydrate content in Betula ermanii at different elevations of Changbai Mountain, China. Chin. J. Plant Ecol. 2009, 33, 118–124. [Google Scholar] [CrossRef]
  49. Lai, H.R.; Craven, D.; Hall, J.S.; Hui, F.K.C.; van Breugel, M. Successional syndromes of saplings in tropical secondary forests emerge from environment-dependent trait–demography relationships. Ecol. Lett. 2021, 24, 1776–1787. [Google Scholar] [CrossRef]
  50. Dodson, E.K.; Root, H.T. Conifer regeneration following stand-replacing wildfire varies along an elevation gradient in a ponderosa pine forest, Oregon, USA. For. Ecol. Manag. 2013, 302, 163–170. [Google Scholar] [CrossRef]
  51. Silva, D.; Rezende Mazzella, P.; Legay, M.; Corcket, E.; Dupouey, J.L. Does natural regeneration determine the limit of European beech distribution under climatic stress? For. Ecol. Manag. 2012, 266, 263–272. [Google Scholar] [CrossRef]
  52. Kannenberg, S.A.; Schwalm, C.R.; Anderegg, W.R.L. Ghosts of the past: How drought legacy effects shape forest functioning and carbon cycling. Ecol. Lett. 2020, 23, 891–901. [Google Scholar] [CrossRef] [PubMed] [Green Version]
  53. Ammer, C.; Stimm, B.; Mosandl, R. Ontogenetic variation in the relative influence of light and belowground resources on European beech seedling growth. Tree Physiol. 2008, 28, 721–728. [Google Scholar] [CrossRef] [PubMed] [Green Version]
  54. Collet, C.; Lanter, O.; Pardos, M. Effects of canopy opening on the morphology and anatomy of naturally regenerated beech seedlings. Trees Struct. Funct. 2002, 16, 291–298. [Google Scholar] [CrossRef]
  55. Di Iorio, A.; Montagnoli, A.; Scippa, G.S.; Chiatante, D. Fine root growth of Quercus pubescens seedlings after drought stress and fire disturbance. Environ. Exp. Bot. 2011, 74, 272–279. [Google Scholar] [CrossRef]
  56. Zang, U.; Goisser, M.; Häberle, K.H.; Matyssek, R.; Matzner, E.; Borken, W. Effects of drought stress on photosynthesis, rhizosphere respiration, and fine-root characteristics of beech saplings: A rhizotron field study. J. Plant Nutr. Soil Sci. 2014, 177, 168–177. [Google Scholar] [CrossRef]
  57. Torreano, S.J.; Morris, L.A. Loblolly Pine Root Growth and Distribution under Water Stress. Soil Sci. Soc. Am. J. 1998, 62, 818–827. [Google Scholar] [CrossRef]
  58. Bengough, A.G.; Bransby, M.F.; Hans, J.; McKenna, S.J.; Roberts, T.J.; Valentine, T.A. Root responses to soil physical conditions; growth dynamics from field to cell. J. Exp. Bot. 2006, 57, 437–447. [Google Scholar] [CrossRef] [Green Version]
  59. Gholz, H.L.; Cropper, W.P.J. Carbohydrate dynamics in mature pinus elliottii var. elliottii trees. Can. J. For. Res. 1991, 21, 1742–1747. [Google Scholar] [CrossRef]
  60. Kobe, R.K. Carbohydrate Allocation to Storage as a Basis of Interspecific Variation in Sapling Survivorship and Growth. Oikos 1997, 80, 226. [Google Scholar] [CrossRef]
  61. Walters, M.B.; Kruger, E.L.; Reich, P.B. Growth, biomass distribution and CO2 exchange of northern hardwood seedlings in high and low light: Relationships with successional status and shade tolerance. Oecologia 1993, 94, 7–16. [Google Scholar] [CrossRef] [PubMed]
Figure 1. Distribution of diameter at breast height classes for adult trees (A) and distribution of height classes for seedlings (B) of Quercus acutissima in 2010 and 2017, respectively.
Forests 13 00545 g001
Figure 2. Linear regression between seedling height and age of Quercus acutissima seedlings.
Forests 13 00545 g002
Figure 3. Variation of precipitation and relative soil water content in the Quercus acutissima plantation from 2011 to 2016. (A) Precipitation at 1.5 m; (B) relative soil water content.
Forests 13 00545 g003
Figure 4. Changes of seedling biomass (A), ground diameter (B), and seedling biomass (C) with the increase of seedling age of Quercus acutissima. Different letters above error bars show significant differences.
Forests 13 00545 g004
Figure 5. Changes of biomass allocation with the increase of seedling age of Quercus acutissima. (A) LMR, leaf mass ratio; (B) RMR, root mass ratio; (C) SMR, stem mass ratio; (D) SLA, specific leaf area; (E) LAR, leaf area ratio; (F) P/NP, photosynthetic tissues/non-photosynthetic tissues. Different letters above error bars show significant differences.
Forests 13 00545 g005
Figure 6. Changes of root traits with the increase of seedling age of Quercus acutissima. (A) TRL, total root length; (B) RSA, root total surface area; (C) RV, root volume; (D) RAD, root average diameter; (E) SRL, specific root length; (F) SRA, specific root area. Different letters above error bars show significant differences.
Forests 13 00545 g006
Figure 7. Changes of soluble sugar (A) and starch contents (B) in the roots, stems, and leaves with the increasing age of Quercus acutissima seedlings.
Forests 13 00545 g007
Figure 8. Correlations among seedling characteristics of Quercus acutissima. SB: seedling biomass; LMR: leaf mass ratio; RMR: root mass ratio; SMR: stem mass ratio; SLA: specific leaf area; LAR: leaf area ratio; TRL: total root length; RSA: root total surface area; RV: root volume; RAD: root average diameter; SRL: specific root length; SRA: specific root area; P/NP: photosynthetic tissues/non-photosynthetic tissues; RSS: root soluble sugar; SSS: stem soluble sugar; LSS: leaf soluble sugar; RS: root starch; SS: stem starch; LS: leaf starch. Significant code: *** p < 0.001, ** p < 0.01, * p < 0.05.
Forests 13 00545 g008
Figure 9. Principal component analysis of Quercus acutissima seedling trait. SB: seedling biomass; LMR: leaf mass ratio; RMR: root mass ratio; SMR: stem mass ratio; SLA: specific leaf area; LAR: leaf area ratio; TRL: total root length; RSA: total root surface area; RV: root volume; RAD: root average diameter; SRL: specific root length; SRA: specific root area; P/NP: photosynthetic tissues/ non-photosynthetic tissues; RSS: root soluble sugar; SSS: stem soluble sugar; LSS: leaf soluble sugar; RS: root starch; SS: stem starch; LS: leaf starch.
Forests 13 00545 g009
Table 1. Seedling characteristic indices, abbreviations, and units.
Seedling Characteristic IndicesAbbreviationsUnits
Relative soil water contentRSWC%
Seedling biomass (leaf + stem + root mass)SBg
Leaf mass ratio (leaf dry mass/total seedling dry mass)LMRg g−1
Stem mass ratio (stem + petiole mass)/total plant massSMRg g−1
Root mass ratio (root dry mass/total seedling dry mass)RMRg g−1
Specific leaf area (total leaf area/total leaf dry mass)SLAcm2 g−1
Leaf area ratio (total leaf area/total seedling dry mass)LARcm2 g−1
Photosynthetic tissues/non-photosynthetic tissues (leaf mass/(stem + root mass))P/NPg g−1
Total Root lengthTRLcm
Root volumeRVcm3
Root average diameterRADmm
Root total surface areaRSAcm2
Specific root length (root length/dry root mass)SRLcm g−1
Specific root area (root surface area/ dry root mass)SRAcm2 g−1
Root soluble sugarRSSmg g−1
Stem soluble sugarSSSmg g−1
Leaf soluble sugarLSSmg g−1
Root starchRSmg g−1
Stem starchSSmg g−1
Leaf starchLSmg g−1
Publisher’s Note: MDPI stays neutral with regard to jurisdictional claims in published maps and institutional affiliations.

