Article

Mixed Forest of Larix principis-rupprechtii and Betula platyphylla Modulating Soil Fauna Diversity and Improving Faunal Effect on Litter Decomposition

Research Center for Engineering Ecology and Nonlinear Science, North China Electric Power University, Beijing 102206, China
*
Author to whom correspondence should be addressed.
Forests 2022, 13(5), 703; https://doi.org/10.3390/f13050703
Submission received: 2 April 2022 / Revised: 27 April 2022 / Accepted: 29 April 2022 / Published: 30 April 2022
(This article belongs to the Section Forest Soil)

Abstract

:
This research performed a comparison study to investigate how mixed forest affects the abundance, groups, and diversity of soil fauna and the effects of soil fauna on litter decomposition. We comparatively studied two forests, Larix principis-rupprechtii forest (LF) and mixed Larix principis-rupprechtii and Betula platyphylla forest (MF), which hold 30 years of stand age and are the representative forests in the mountainous area of northwestern Hebei, China. The field experiments were conducted from May to November 2020, with soil fauna and litter samples taken every one and a half months. A total of 540 soil samples (replicated samples, 3) were collected in each forest and the soil faunas were extracted from the samples by Tullgren methods in laboratory. Litter samples were incubated separately in the sampled forests using litterbags with two mesh sizes (0.01 and 4 mm) to observe the decomposition rate. In total, 2958 (inds.) soil faunas belonging to 4 phyla, 11 classes, and 20 orders, were found, with Acarina (1079/2958; 36.48%) and Collembola (1080/2958; 36.51%) being the dominant groups. The total abundance of soil fauna in the MF (1581 inds.) was higher than that in the LF (1377 inds.), and the significantly more abundant predatory functional group in the MF (p < 0.05) may indicate a more complex soil fauna food web structure. Comparatively, the higher Shannon–Wiener index (1.42–1.74) and Pielou evenness index (0.58–0.71) and the lower Simpson dominance index (0.22–0.32) in the MF suggested that the MF promoted the soil fauna diversity. The cumulative litter decomposition rate of litterbags with 4 mm aperture in the MF (54.52% in 300 days) was higher than that in the LF (32.81% in 300 days). Moreover, the litter decomposition rate was positively correlated with the total abundance and the number of groups, and was negatively with the Simpson dominance index, implying that the soil fauna activity effectively improved litter decomposition in the MF. Via the comparison, we found that the mixture of plant species in the forest can modulate the soil fauna diversity and accelerate the litter decomposition. The results in this study may provide an interesting reference for forest restoration and sustainable management.

1. Introduction

Soil faunas are an essential part of the forest ecological system [1], with their feeding and activity being involved in the decomposition and mineralization of soil organic matter [2], improving soil structure [3,4], and regulating the structure, function, and succession of plant communities [5,6]. They are an important guarantee for the material and energy cycle of the soil ecosystem [1,7]. The community composition, distribution characteristics, and diversity of soil fauna have often been studied. In recent years, researchers have discussed the influencing factors of soil fauna diversity on a large scale (climate conditions, geographical location, etc.) or meso-micro scale (vegetation types, pH value, temperature and humidity, mineral elements, etc.). The research showed that soil macrofauna diversity decreased as the elevation increased, which was affected by annual mean precipitation, altitude, annual radiation quantity, and annual mean temperature [8]. Xu [9] confirmed that forests with small gaps harbored the most species, with the most even distribution, and the highest diversity.
All kinds of soil faunas differ greatly in size and activity ability, and their activity patterns are different. However, many species are similar in function. They form the same functional group, mainly saprozoite, phytophage, predator, and omnivore. Studying soil fauna communities based on the functional groups can help to better understand the food web structure and the soil ecological function process. The density and group number of saprophytic soil faunas are more prominent in the forests with high canopy density, moist soil, and rich litters [10]. Santos [11] found that periodically flooded forests favored groups from the saprophagous groups, while fragments and anthropic fields in the Atlantic Forest favored predator and herbivore groups, reflecting the predominant functional groups in the two different understory microhabitats. The proportions of functional groups are important biological indices to measure ecosystem function and soil fertility.
The soil fauna play an important role in litter decomposition, which is one of the most important pathways in the terrestrial ecosystem’s energy transformation and material cycles. The soil fauna directly feed on and break litter or affect the litter decomposition by affecting soil microorganisms. Many studies have shown that changing vegetation types can affect species composition and soil fauna community structure, which, in turn, affects litter decomposition [12]. Meanwhile, environmental factors are also critical. Studies have shown that temperature and moisture can directly mediate litter decomposition, but in opposite directions [13]. Njoroge [14] highlighted the importance of soil fauna in mixed litter decomposition, most strongly in dry environments.
Researchers pay great attention to the productivity of mixed forests and their effects on forest biodiversity, with soil fauna communities being one of the research focuses. Many studies have shown a positive trend for increased tree richness or when broad-leaved species are introduced into coniferous stands. Hu [15] confirmed that the mixed planting of Larix principis-rupprechtii and Betula platyphylla could increase soil fauna groups, individuals, and diversity levels, especially the increase of phytophagous groups was conducive to the initial decomposition of fresh litter. In general, the composition of the soil fauna communities is closely related to the composition of surface vegetation, and the interactions are highly complex and dynamic [16]. Therefore, research of the soil fauna community characteristics in vegetation restoration in specific regions can contribute to sustainable ecosystems management.
Owing to human destruction such as overgrazing and over-harvesting, the forest vegetation has been greatly damaged and the ecosystem function has been seriously reduced in the mountainous area of northwestern Hebei, China. In the 1990s, China set this area as a key area of forestry ecological construction and strengthened the construction of artificial forests to promote ecological restoration. Larix principis-rupprechtii seedlings were planted in the mountainous area of northwestern Hebei, with some areas growing into pure Larix principis-rupprechtii forest. Meanwhile, some Larix principis-rupprechtii seedlings were planted near the secondary Betula platyphylla forests, where the seedlings of Betula platyphylla also invaded, and then the seedlings of the two species competed to grow into a mixed forest. Based on previous research works, we hypothesized that the mixture of plant species can promote better restoration of soil fauna communities, leading to higher abundance, group number, and diversity of the soil fauna. Additionally, the faunal effect on litter decomposition in the mixed forest can be improved simultaneously with the soil fauna diversity. Thus, in this study, we take the Larix principis-rupprechtii forest (LF) as well as the mixed Larix principis-rupprechtii and Betula platyphylla forest (MF) as research objects to comparatively investigate the restoration outcomes of the soil fauna diversity and faunal effect on the litter decomposition. We analyzed the temporal and vertical distribution of soil fauna communities and the response of soil fauna to soil properties, and then explored the relationship between soil fauna and litter decomposition by investigating litter mass-loss rates in litterbags with different mesh sizes. We expected to conclude that the MF will improve the abundance, groups and diversity of soil fauna compared with the LF. We also expected to find a difference in litter decomposition rate between the two sampled forests, i.e., a higher decomposition rate in the MF than in the LF. This research may improve the understanding on the restoration of forest ecosystem function and provide an interesting reference for forest sustainable management.

2. Materials and Methods
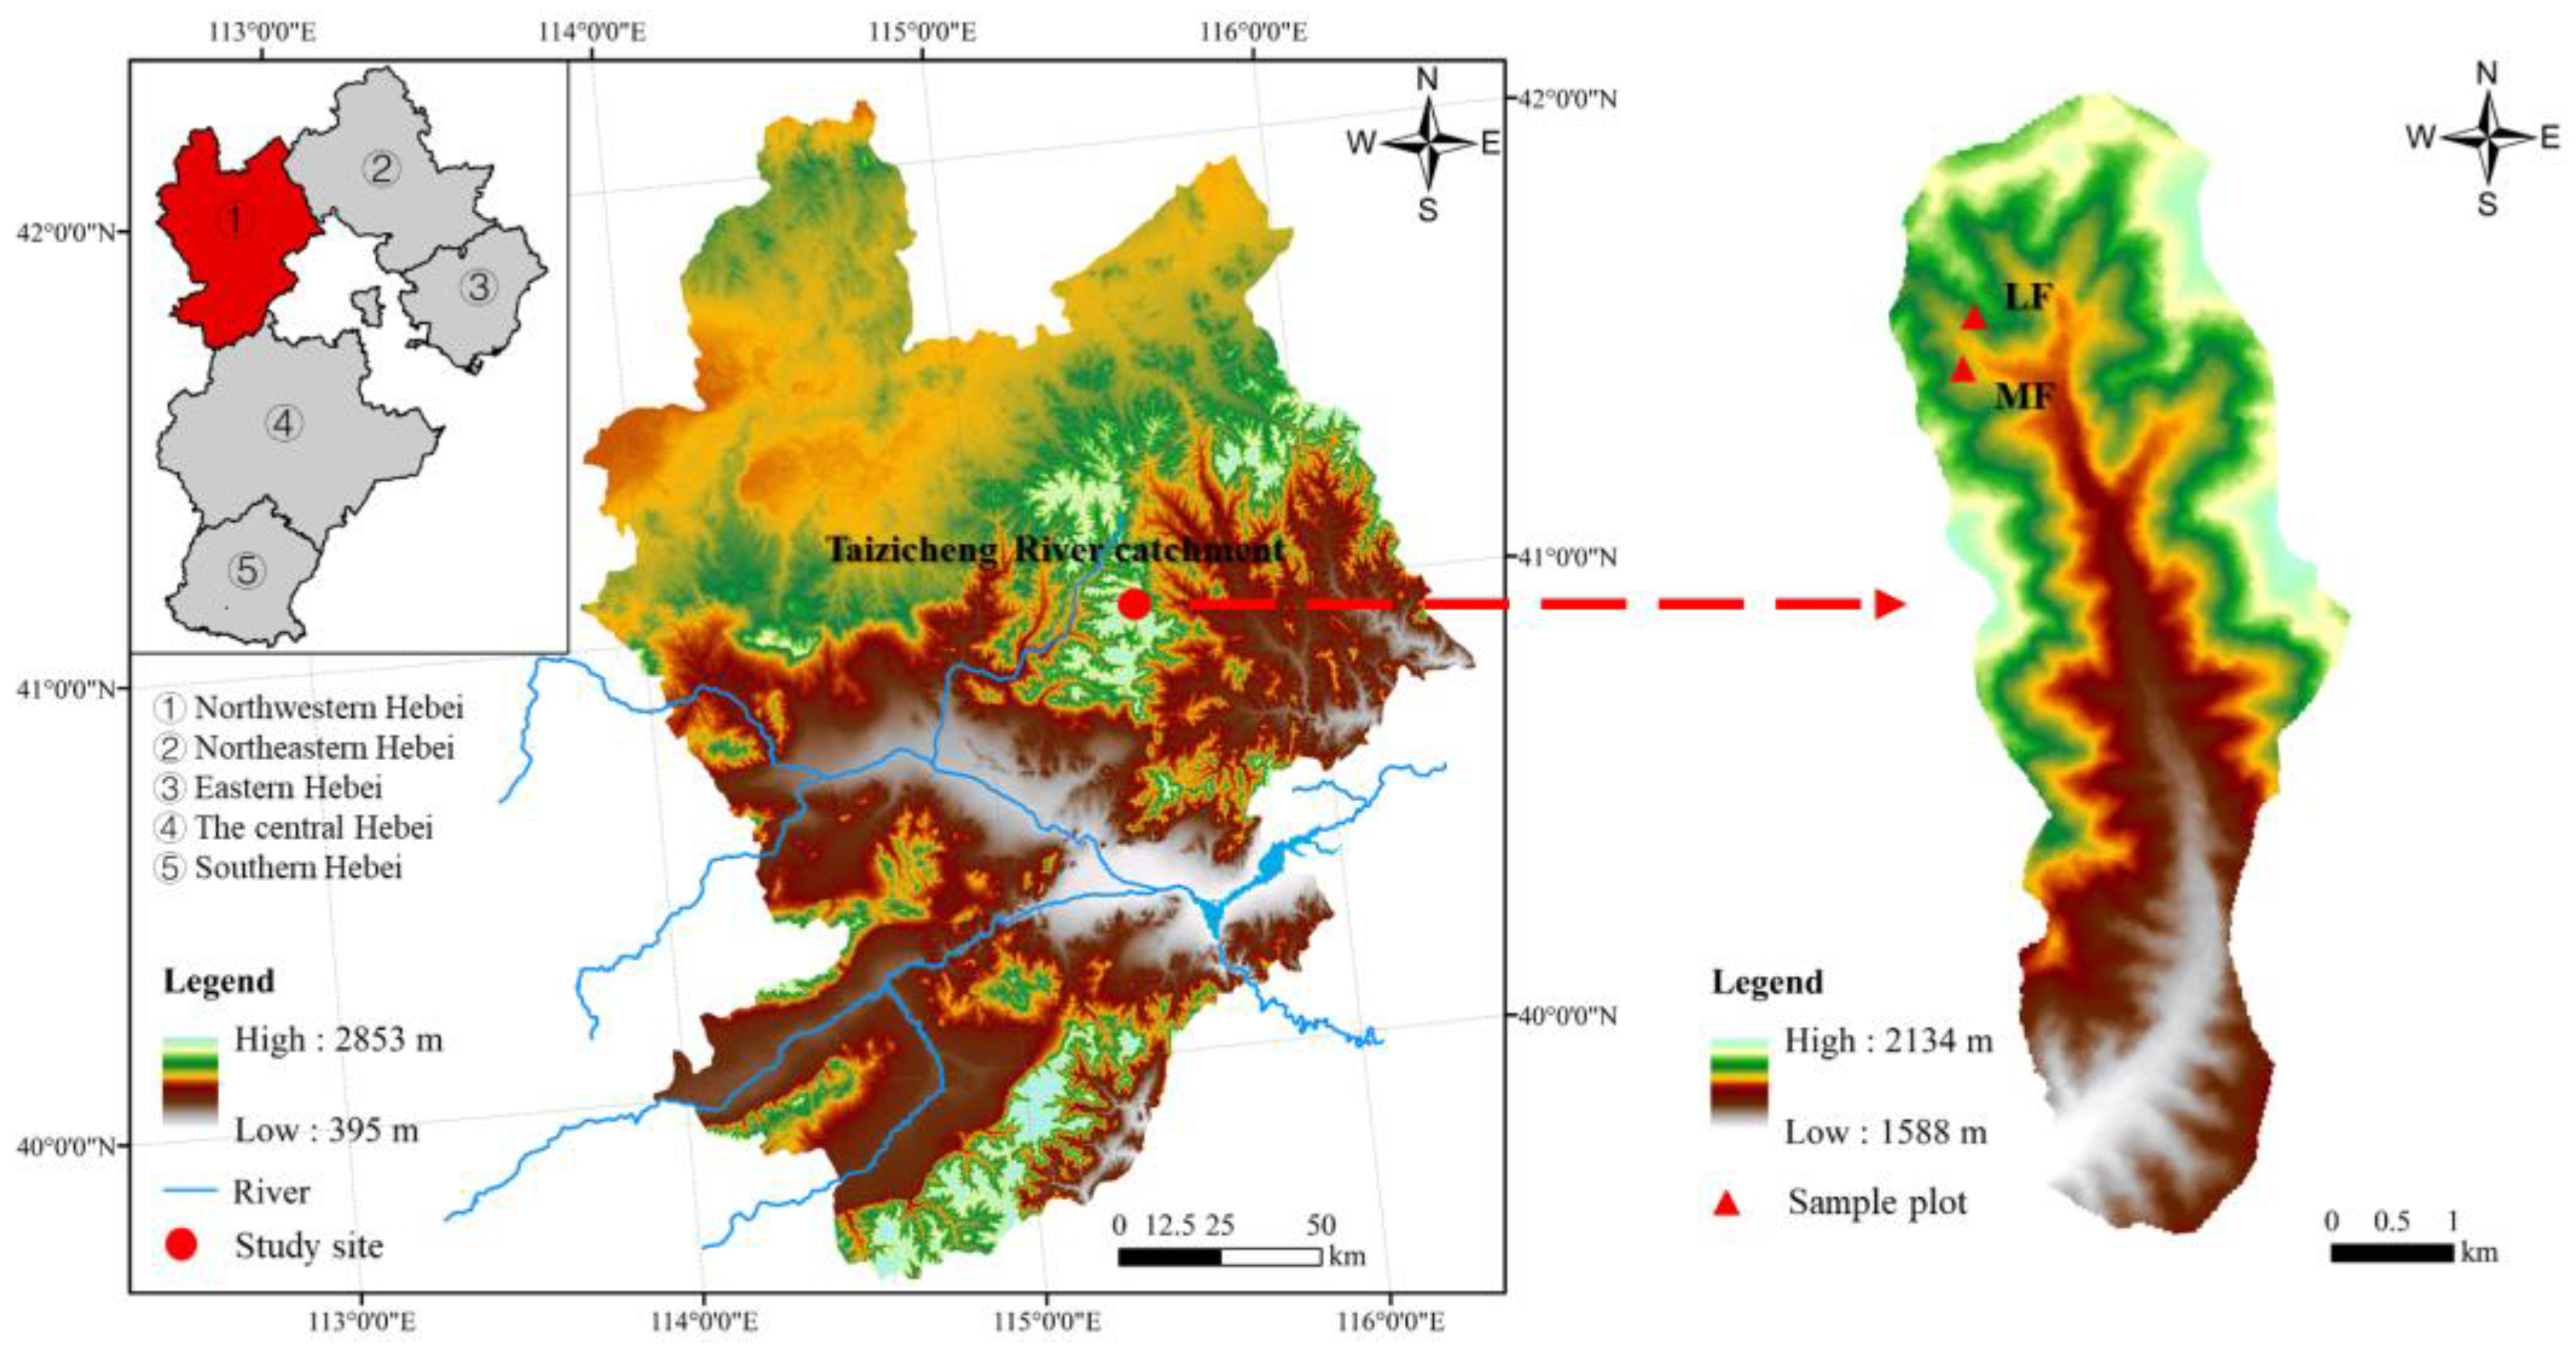
2.1. Study Site

The study site is located in the Taizicheng River catchment in the mountain area of northwestern Hebei, China (Figure 1, Table 1). The study site belongs to the cold temperate sub-arid zone of the continental monsoon climate [17]. Due to the climate being rather mountainous, the temperature rises quickly, and precipitation is poor in spring (May–June). Summer (July–August) is cool and short, with a significant temperature difference between day and night and concentrated rainfall. The first frost appears earlier in autumn (September–October). Cold air is frequent in winter (November–April). The vegetation period in the mountain area of northwestern Hebei is about 90 days. Over a year, the average temperature is 3.7 °C, and the average precipitation is 483.3 mm. More than 2100 species of terrestrial wild plants belong to 513 genera and 120 families in the northwestern Hebei (Zhangjiakou Municipal People’s Government; www.zjk.gov.cn accessed on 19 April 2021).

2.2. Experimental Design

A 100 m × 100 m sample plot was set in each forest type, respectively. According to the diagonal method, three subplots, each of which measured 30 m × 30 m, were established in each sample plot on the upslope, mesoslope, and downslope. Three replicate sampling points with similar habitats were selected for each 30 m × 30 m subplot, and the three samples were mixed into a composite sample. In early May, mid-June, early August, mid-September, and early November 2020, specimens were collected five times at fixed points in the plots. The sampling sites were required to be free of rocks, human disturbances, and soil fauna nests. Soil samples were collected with a 200 mL volumetric ring knife (height: 5 cm) in four soil layers of 0–5 cm, 5–10 cm, 10–15 cm, and 15–20 cm below the surface, called layer I, layer II, layer III, and layer IV, respectively. A total of 1080 samples (i.e., 360 composite samples) were collected in the two sampled forests, including replicated samples, and statistics were averaged. Manual sorting and a modified Tullgren funnel method were used to collect the soil fauna. The excavated soil sample was placed in a stainless-steel tray to hand-picking soil macrofauna. Then, the collected faunas were extracted using the modified Tullgren funnel method for 48 h in the laboratory. All of the extracted soil fauna samples were preserved in 75% ethanol. They were counted and identified into order, family, and other classification elements under a stereoscopic microscope (OLYMPUS SZX16; OLYMPUS in Tokyo, Japan) [18]. According to their feeding characteristics, the soil faunas were classified as saprozoite, phytophage, predator, and omnivore based on the monographic and related literature [19]. Further, the various soil fauna groups were classified based on the number of individuals as follows: (1) dominant groups: >10% of the total number of individuals captured; (2) common groups: 1–10% of the total number of individuals; (3) rare groups: <1% of the total number of individuals.
Litter samples were collected in September 2019. Only the existing intact litters that had not been decomposed in the sample plot were collected as test samples to ensure the consistency of freshness of litters. Soil and other impurities were removed in the laboratory and air-dried to a constant weight of 65 °C. Litterbags with specifications of 20 × 20 cm, aperture of 4 mm (allowing all soil fauna to enter) and 0.01 mm (excluding the influence of soil fauna) were loaded with 20 g (accurate to 0.001 g). Litterbags were stitched together with nylon mesh with corresponding apertures [20], and were placed in the corresponding plot in January 2020 and decomposed under natural conditions. In mid-June, early August, mid-September, and early November 2020, three litterbags were randomly taken from each sampling site and brought back to the laboratory. The litter was dried and weighed to measure the decomposition rate. Since the study area was covered with snow from January to May 2020, sampling was not carried out considering the feasibility of practical work.
Environmental factors analyzed included soil bulk density (BD), pH, organic matter (SOM), total nitrogen (TN), and total phosphorus (TP). Undisturbed soil samples collected with a ring knife were used to measure BD. The collected soil samples were air-dried, ground, and made to pass through 0.25 mm sieves for laboratory analyses. The soil sieved with the 0.25 mm mesh screen was utilized to measure TN and TP contents. Soil TN content was determined using the semi-micro Kjeldahl method [21]. Soil TP content was measured using molybdenum-antimony colorimetry. Soil pH was measured using an acidimeter (soil:water = 1:2.5, w/v) [22]. Basic soil properties in the two forest types are shown in Table 2.

2.3. Statistical Analyses

The diversity of soil fauna communities was quantified using the Shannon–Wiener index (H) [23], Pielou evenness index (J) [24], and Simpson dominance index (C) [25]. The calculation formulas are as follows:
H = i = 1 n P i ln ( P i ) ,
J = H / ln S ,
C = ( n i / N ) 2 ,
where S is the number of soil fauna groups, Pi is the proportion of the individuals of i-th group to the total individuals, ni is the number of individuals in the i-th group, and N is the total number of individuals in all groups.
Litter mass residual rate ( R M ) [26]:
R M = M t / M 0 × 100 % ,
where R M is litter mass residual rate (%); M t is the mass of litters at t decomposition time (g); M 0 is the initial mass of litter (g).
Olson model of litter decomposition [27]:
M t / M 0 = a e k t ,
Time required for 50% decomposition of litter and 95% decomposition of litter:
t 50 % = ln 0.5 / k , t 95 % = ln 0.05 / k ,
where a is the modified parameter; k is the decomposition rate of litter; t is the decomposition time of litter.
Contribution of soil fauna to litter decomposition (L) [28]:
L = L f a u n a / L t o t a l × 100 % ,
where L f a u n a refers to the litter loss caused by the soil fauna (the difference in litter loss rate between the 4 mm diameter and the 0.01 mm diameter litterbags); L t o t a l refers to the litter loss caused by the soil fauna, microorganisms, and abiotic factors (the litter loss rate of the 4 mm diameter litterbags).
The properties of soil fauna abundance, functional groups, and diversity in each composite sample were compared by one-way ANOVA, and the LSD procedure and contrasts with a probability level of 0.05 was used to identify significant differences. Using the Pearson correlation coefficient, the ecological indices of soil fauna community soil faunal in mid-June, early August, mid-September, and early November were used to analyze the monthly average mass loss of litterbags from 0 to 165 d, 165 to 210 d, 210 to 255 d, and 255 to 300 d. Redundancy analysis (RDA) was applied to analyze the relationships between soil fauna communities and soil properties using CANOCO 5.0 (Biometris, Wageningen, Netherlands). In addition, the significance of the first axis and all axes was evaluated by Monte Carlo tests (499 times, p < 0.05). Statistical analyses were conducted via SPSS 25 (IBM Corp., Armonk, NY, USA). Figures were made using the drawing software Origin 2018 (OriginLab., Northampton, MA, USA).

3. Results

3.1. Soil Fauna Community Characteristics

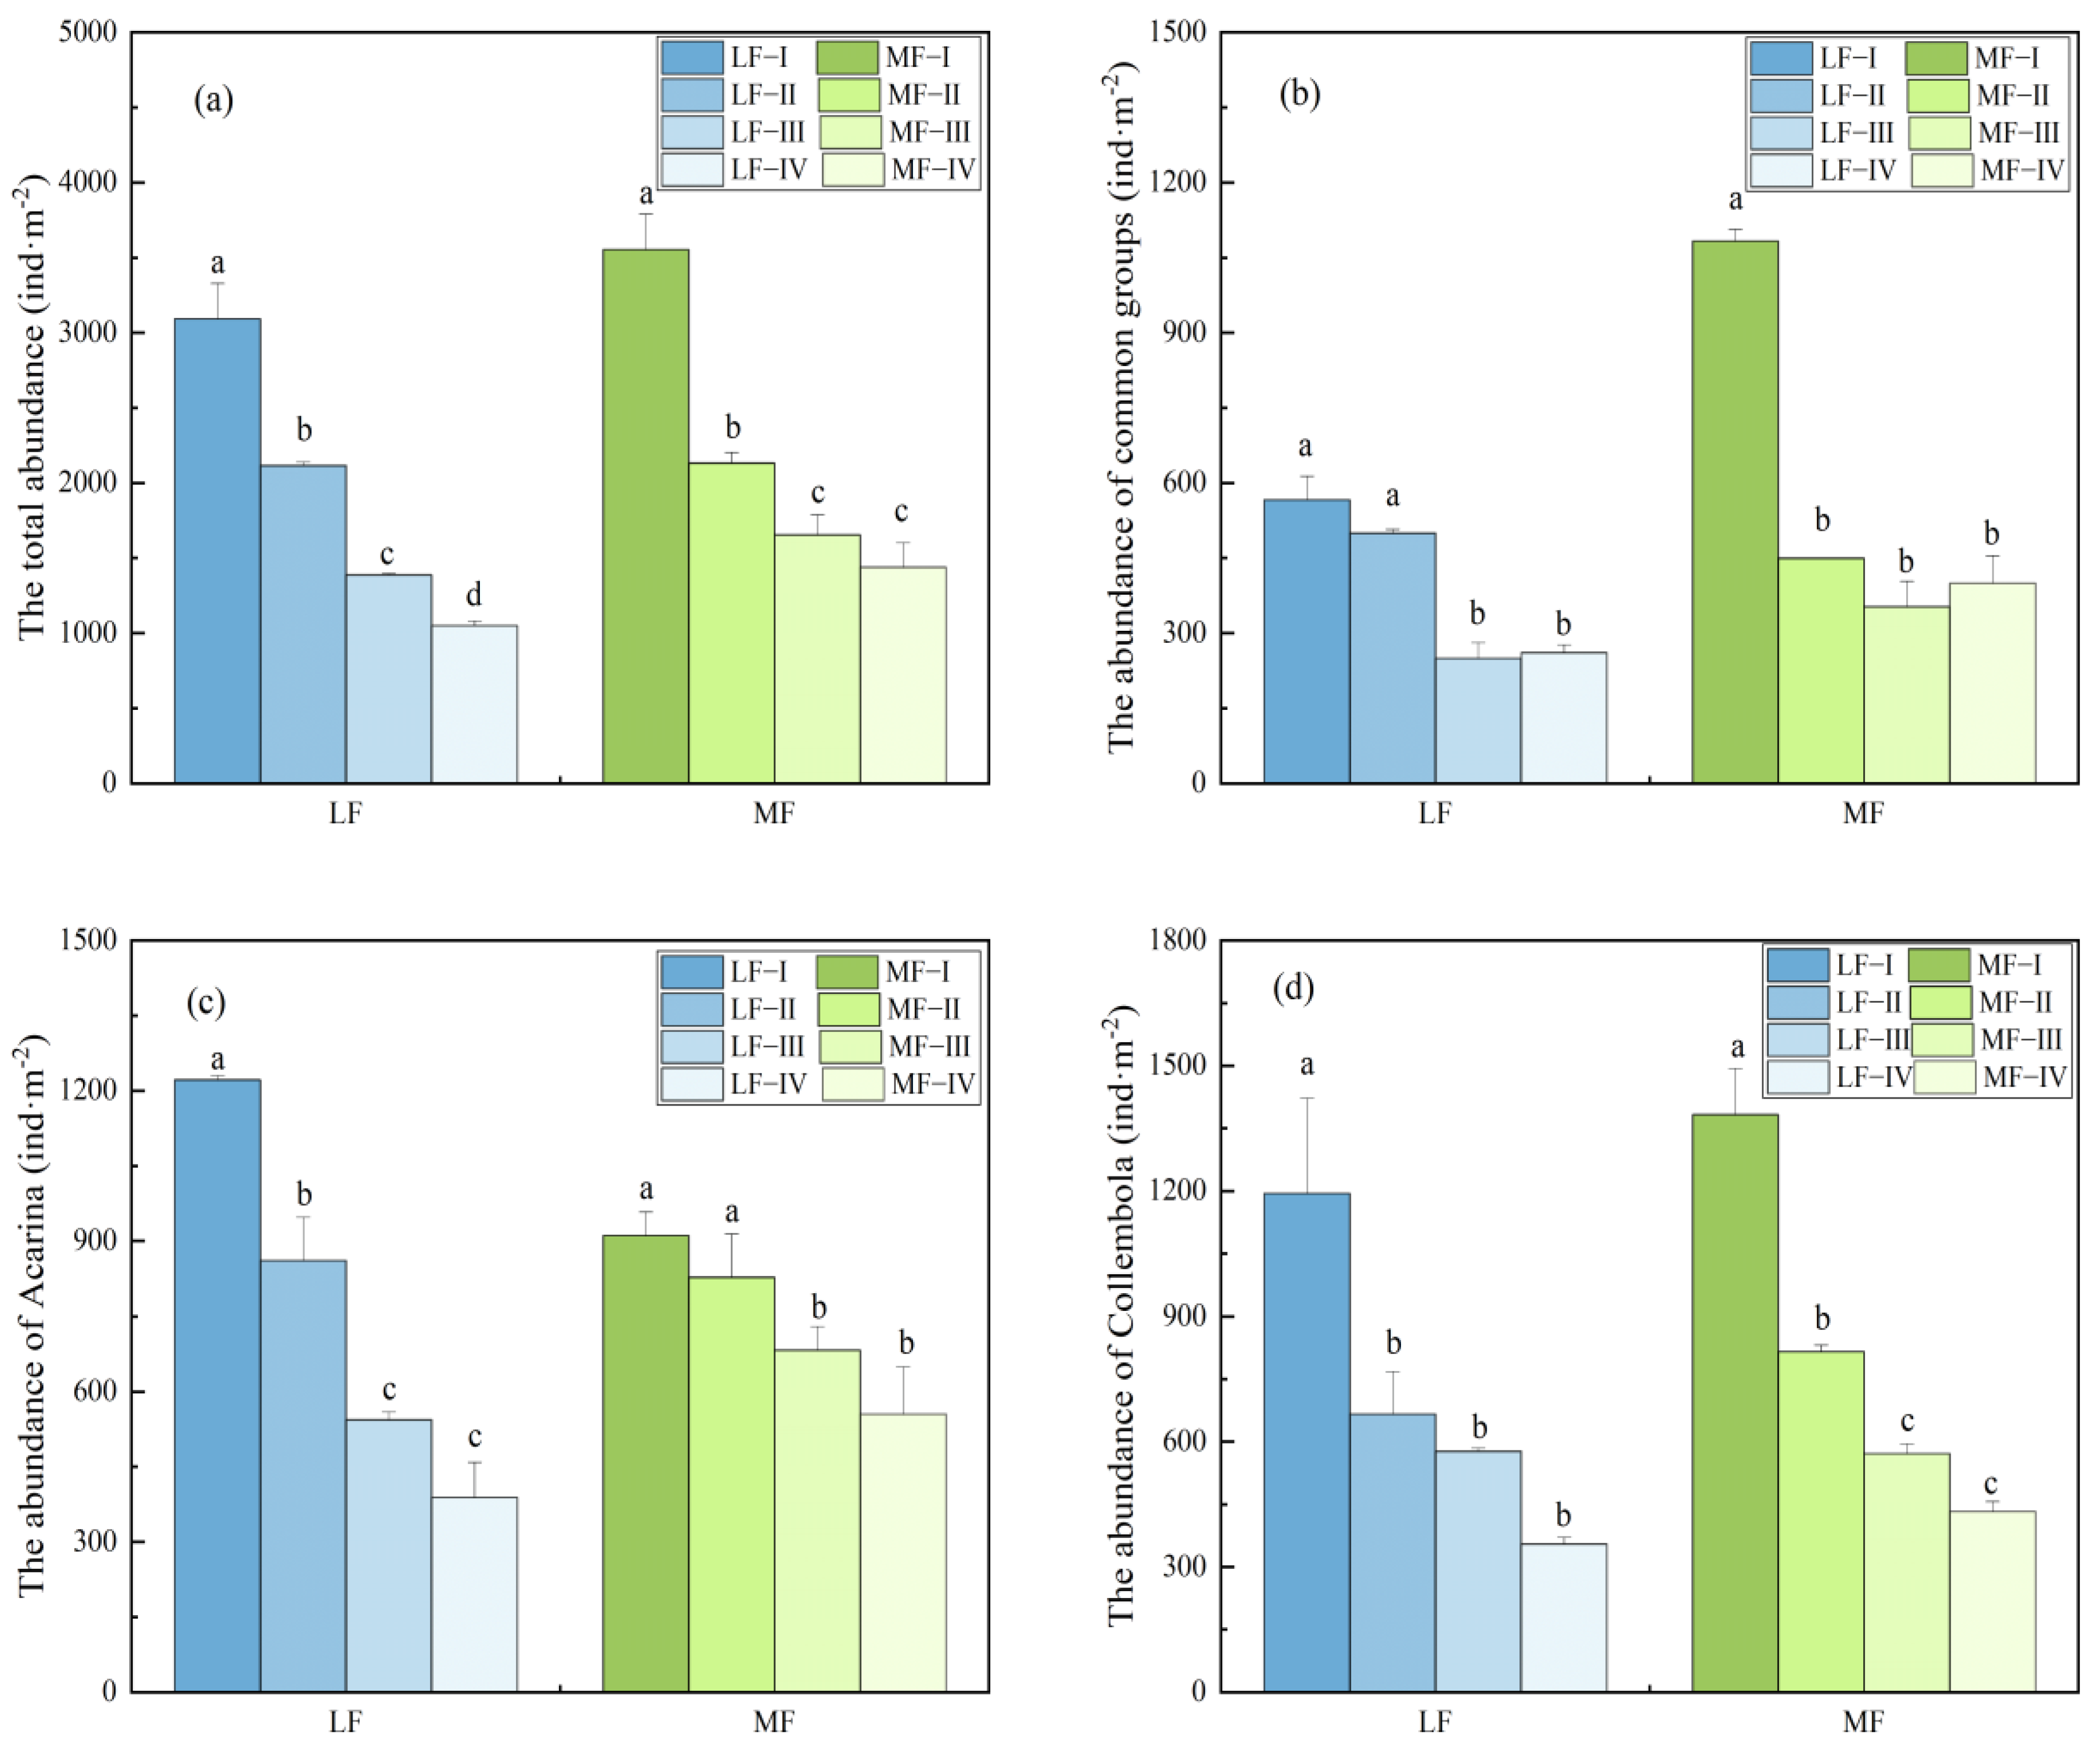
3.1.1. Temporal and Vertical Distribution of Soil Fauna Community

A total of 2958 (inds.) soil faunas were captured in this study, belonging to 4 phyla, 11 classes, 20 orders, and 39 families, including 22 groups (Table 3). Acarina (1079/2958; 36.48%) and Collembola (1080/2958; 36.51%) were dominant groups. The common groups were Isoptera (156/2958; 5.27%), Diptera (larvae) (191/2958; 6.46%), Enchytraeidae (59/2958; 1.99%), Araneae (97/2958; 3.28%), and Geophilomorpha (32/2958; 1.08%); the rest were rare (98/2958; 3.31%).
A total of 1377 (inds.) soil faunas, including 19 groups, were captured in the LF (Table 3). The dominant groups were Acarina (543/1377; 39.43%) and Collembola (503/36.53; 36.53%). The common endemic groups of the LF were Isopoda (17/1377; 1.23%) and Psocoptera (42/1377; 3.05%) in the two sampled forests. The abundance of dominant and common groups was large in the LF, accounting for 75.96% and 19.75% of the total abundance, respectively, constituting the basic components of soil fauna in the LF. The abundance of rare groups accounted for only 4.29%, whereas 10 fauna groups were included in rare groups, accounting for 52.63% of the total groups in the LF, which were indispensable components of improving soil fauna diversity. The total abundance of soil fauna changed significantly with the seasons (p < 0.05) and showed a unimodal trend from May to November. The abundance of Diptera (larvae) showed a decreasing trend and was common in early May but rare in early November.
A total of 1581 (inds.) soil faunas, including 19 groups, were captured in the MF (Table 3). The dominant groups were also Acarina (536/1581; 33.90%) and Collembola (577/1581; 36.50%), Thysanoptera (76/1581; 4.81%) and Geophilomorpha (29/1581; 1.83%) were the common endemic groups of the MF in the two sampled forests. The MF modulated the abundance of dominant, common and rare groups of soil fauna. Similar to the LF, the abundance of rare groups in the MF was low (2.46%), whereas the proportion of fauna groups included in the rare groups was high (52.63%). However, the abundance of common groups in the MF (27.24%) was higher than that in the LF (19.75%). The abundance of the MF varied more significantly than that of LF by month, especially the total abundance (p < 0.05). In early August, the individuals of dominant groups were 6–7 times that of early May.
The soil fauna community tended to gather on the soil surface in the vertical distribution (Figure 2). In the LF, the abundance of total soil fauna and dominant groups in soil layer I differed significantly from that in layer II (p < 0.05), and the difference between adjacent soil layers III and IV was at the least significant level (p < 0.05). The surface aggregation of soil fauna in the MF was more pronounced than that in the LF except for Acarina in Figure 2, indicating that the soil surface of the MF provided more ample food resources. The surface aggregation of the common groups in the MF was the most significant level in Figure 2 (p < 0.05), and the abundance advantage of common groups in the MF was mainly in layer I compared with the LF.
The functional groups of soil fauna were mainly saprozoite (721/1377; 52.36%) and omnivore functional group (546/1377; 39.65%), with a small proportion from the phytophage (57/1377; 4.14%) and predator functional group (53/1377; 3.85%) in the LF. During the study period, phytophagous soil fauna obviously responded to seasonal dynamics with an inverted U-type distribution (Figure 3a). In the vertical distribution, the proportion of omnivorous soil fauna showed minimal change (36.95%–40.97%) (Figure 3b). The functional groups of soil fauna were mainly saprozoite (840/1581; 53.13%) and omnivore (539/1581; 34.09%), followed by predator (186/1581; 11.76%) and phytophage (16/1581; 11.76%) in the MF. There was a strong response by saprozoite to seasonal dynamics, accounting for the highest proportion (354/611; 57.94%) in early August (Figure 3a). Predator’s temporal and vertical distribution ratios were relatively constant, and community stability was high (Figure 3b).
The mixed forest modulated different functional groups to different degrees (Table 4). In terms of abundance and proportion of each functional group, the MF had the strongest modulation effects on predator, which increased by 250.94% and 205.78%, respectively. However, the functional groups with the weakest effects were different, namely omnivore (1.18%) and saprozoite (1.73%). Regarding the abundance of functional groups, phytophage and omnivore showed a decreasing trend in the MF, whereas only phytophage showed a decreasing trend in proportion.
The diversity of the soil fauna in the MF was higher than that in the LF, with both showing the same dynamic trend over time (Figure 4). The changing curves of the Shannon–Wiener index (H) were both inverted U-type in the two sampled forests; that is, they reached their highest values in early August. The variation trend of the Pielou evenness index (J) was opposite to that of the Simpson dominance index (C) in the two sampled forests, showing the W and M types, respectively. The tendency of the soil fauna diversity differed between the LF and the MF (Figure 4). The Shannon–Wiener index (H) was the highest in layer II (H; 1.69) in the LF, whereas highest (H; 1.80) in layer I in the MF.

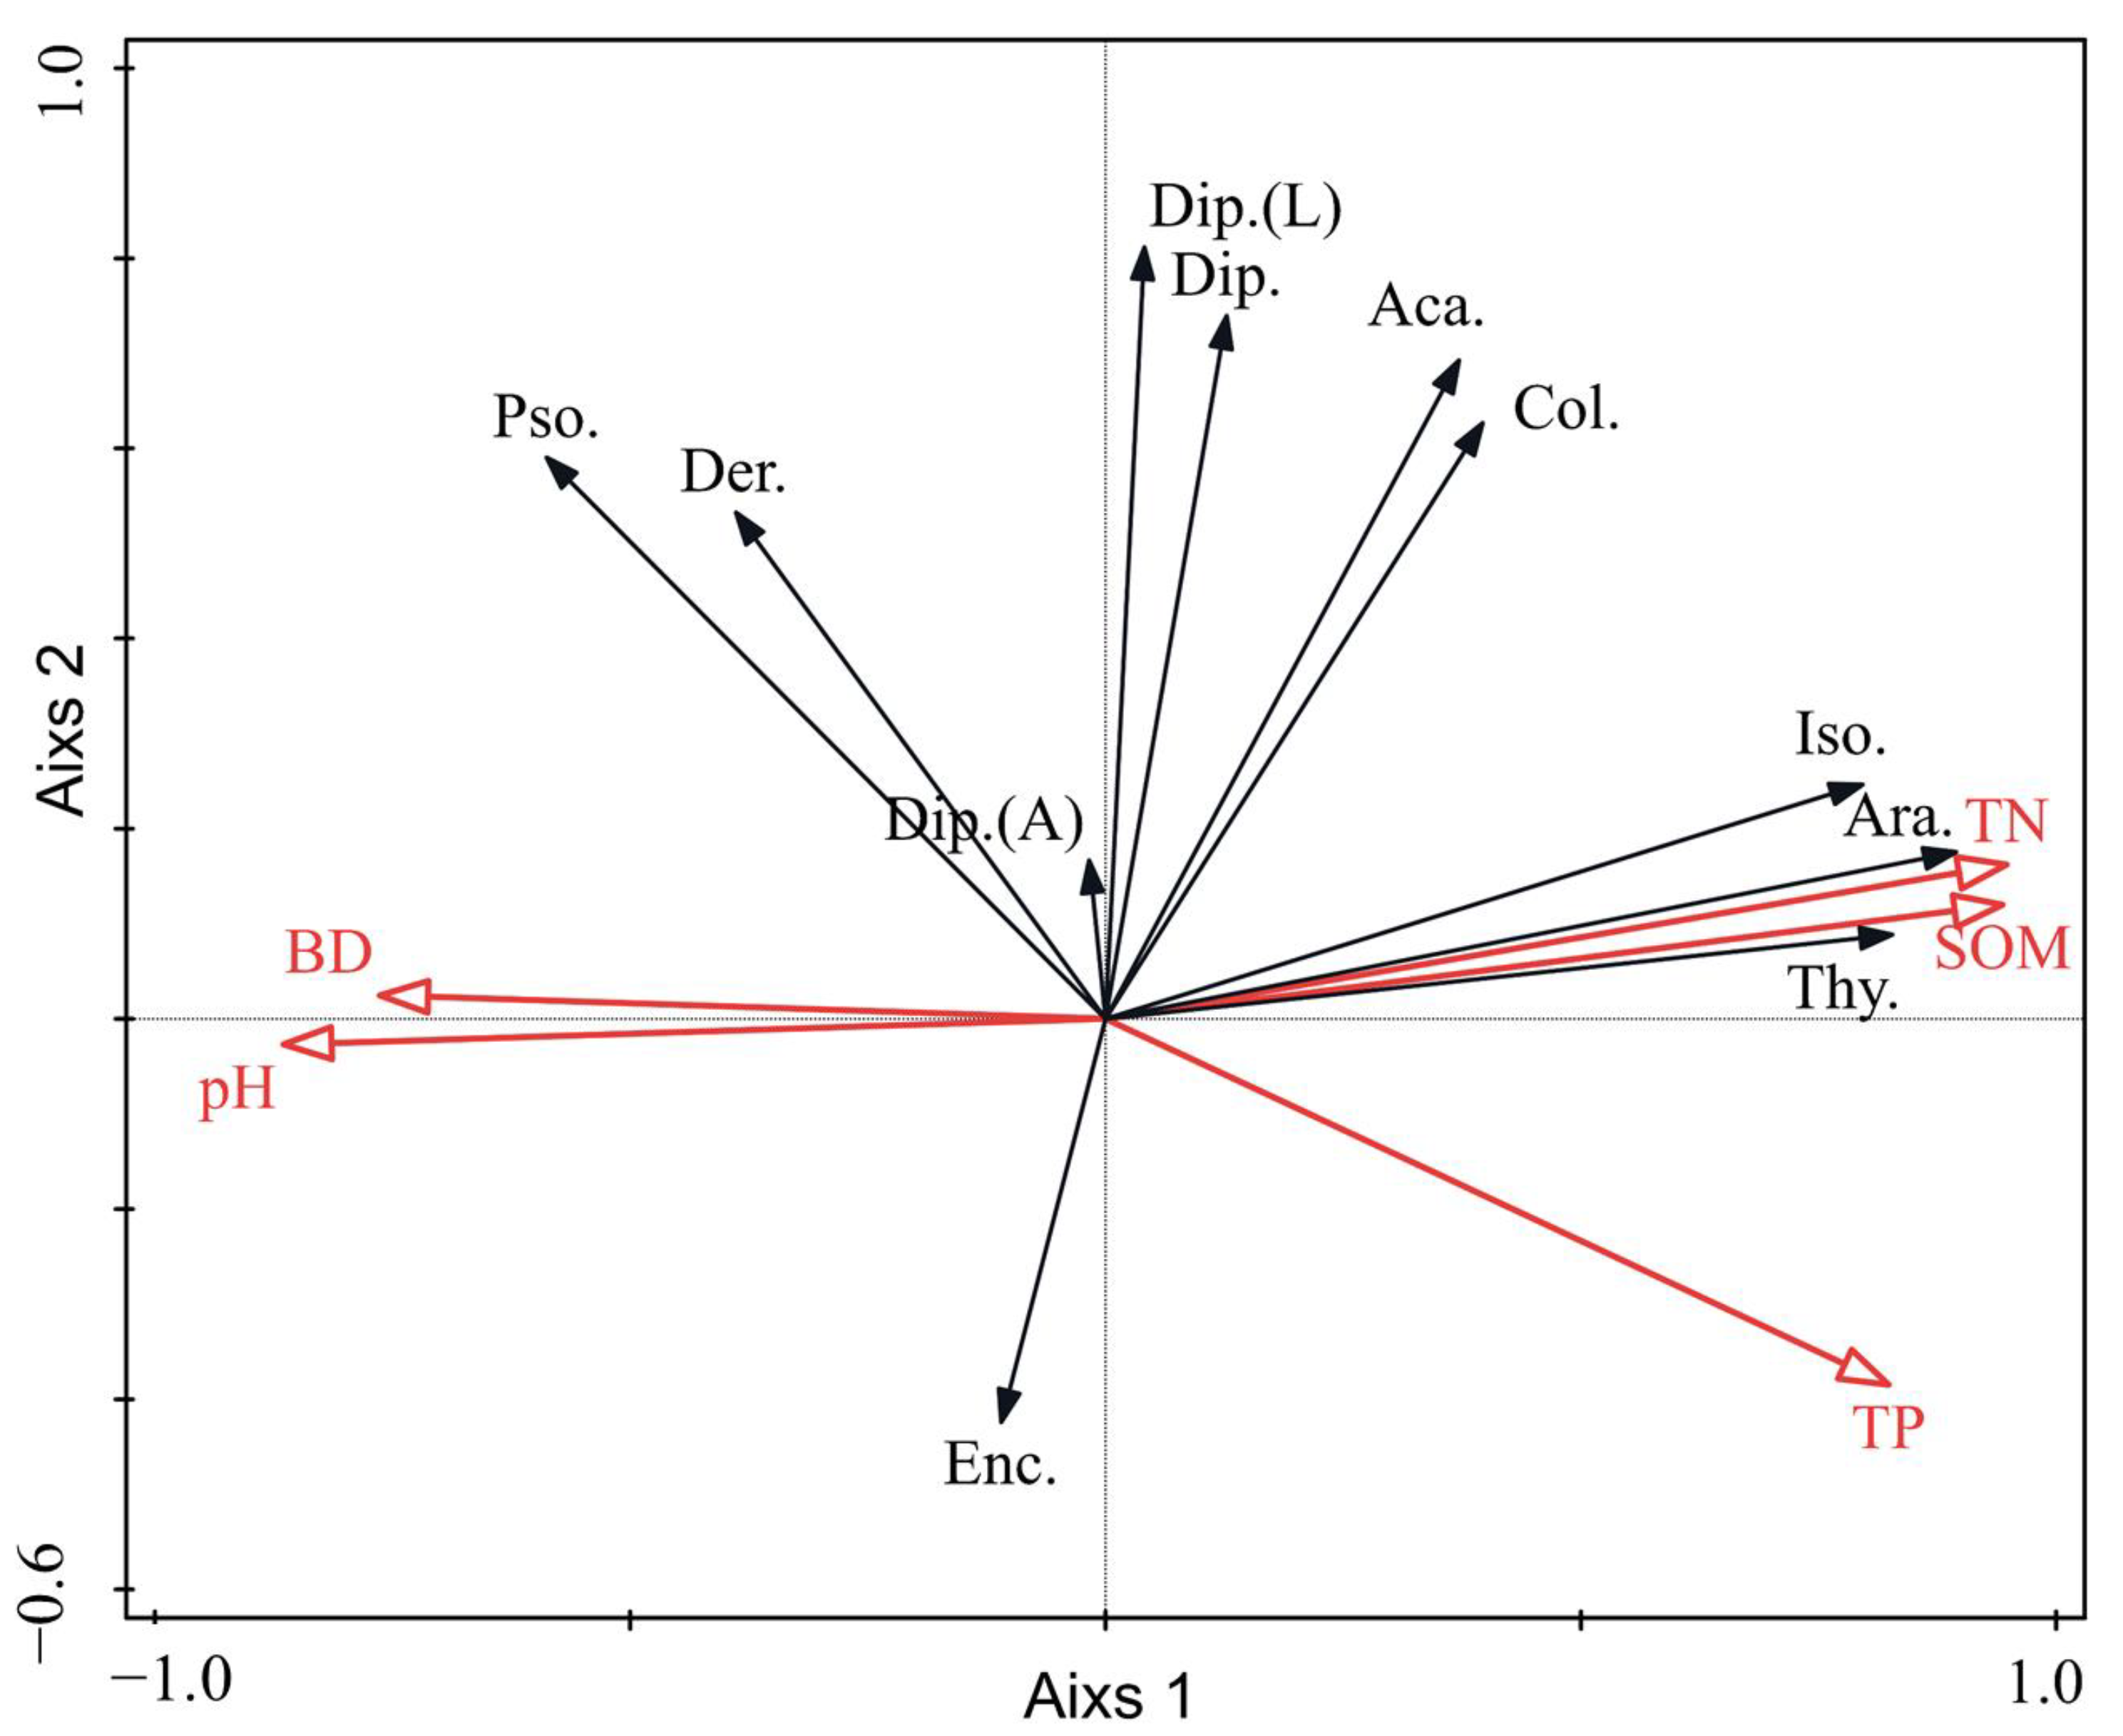
3.1.2. Correlation Analysis between the Soil Fauna and Soil Properties

The gradient relationship between the soil fauna and soil properties can be established by sorting [29]. The soil fauna and soil properties were sorted into two-dimension using redundant analysis (Figure 5). After the continuous optimization of Interactive Forward Selection, the main soil properties were selected as environmental factors to explain the community characteristics of the main fauna groups. The first canonical axis was determined by BD, pH, TN, and SOM; it explained 35.62% of the total variation (Table 5; F = 3.9, p = 0.024 < 0.05; Monte Carlo test with 499 permutations). The second canonical axis comprised TP; it explained 18.76% of the variation (F = 2.7, p = 0.006 < 0.01; Monte Carlo test with 499 permutations).
Isoptera, Thysanoptera, and Araneae were more significantly related to TN and SOM than the other groups. TP and pH had a weak impact on soil fauna. The analysis of simple term effects showed that TN (explained 32.8%, F = 4.9, p = 0.002) and TP (explained 15.8%, F = 2.8, p = 0.02) had greater explanation rates and significant correlations with the soil fauna.

3.2. Effects of Soil Fauna on Litter Decomposition

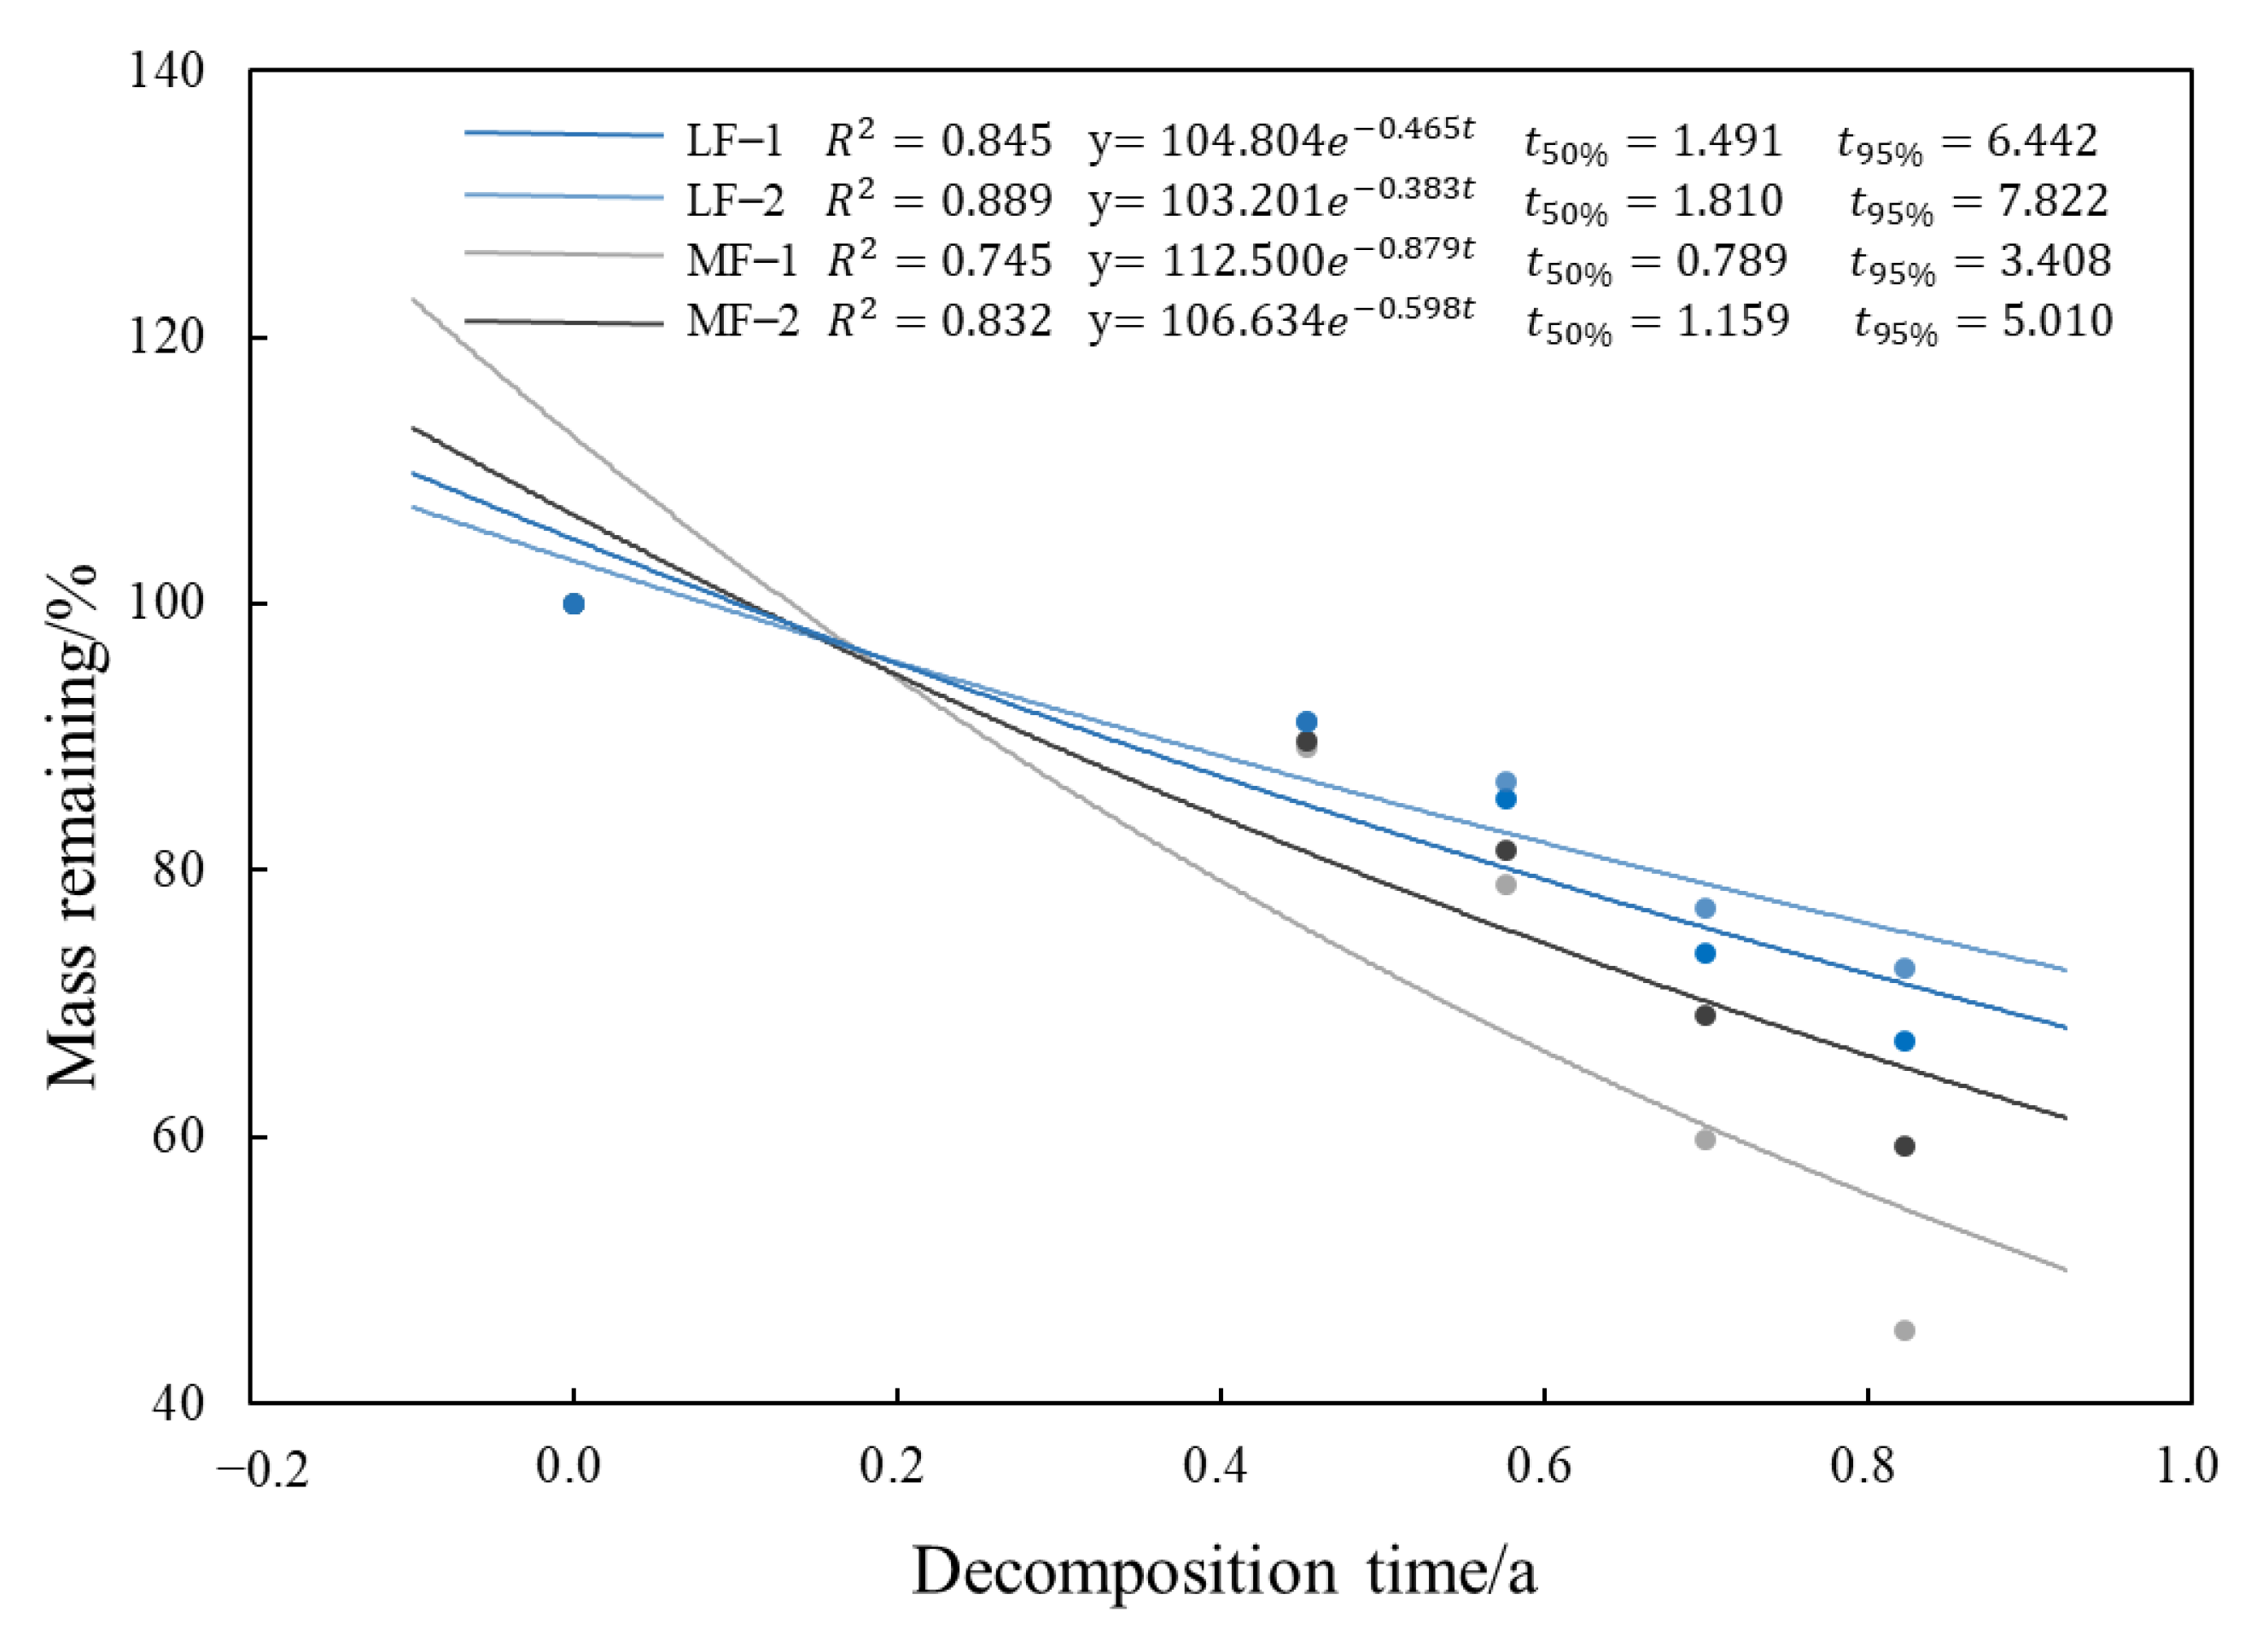
3.2.1. Dynamic Characteristics of Litter Decomposition

The net decomposition rate of litter during the decomposition process was calculated (Figure 6). During litter decomposition, the net decomposition rates of litter gradually increased from 0 to 210 d and gradually decreased after 210 d in both forest types. The cumulative decomposition rate of litter with different mesh sizes was MF–1 (54.52%) > MF–2 (40.64%) > LF–1 (32.81%) > LF–2 (27.41%), and the soil fauna activity improved litter decomposition rate. With the same mesh size, the cumulative litter decomposition rate in the MF was significantly higher than that in the LF (p < 0.05), indicating that litter quality is an essential factor affecting the litter decomposition rate.
The residual mass rates and decomposition times fit the Olson exponential decay model (Figure 7). LF–2 (R2 = 0.889) had the best fitting effect, whereas MF–1 (R2 = 0.745) had the poorest. The litter decomposition rate in the 4 mm litterbags was faster than in the 0.01 mm litterbags in the same forest type. The decomposition in the 4 mm litterbags in the MF was the fastest, with decomposition times of 0.789 a and 3.408 a for 50% and 95%, respectively. The decomposition in the 0.01 mm litterbags in the LF was the slowest, with a residue rate of 72.591% after 300 a of decomposition, and decomposition times of 1.810 a and 7.822 a for 50% and 95%, respectively.

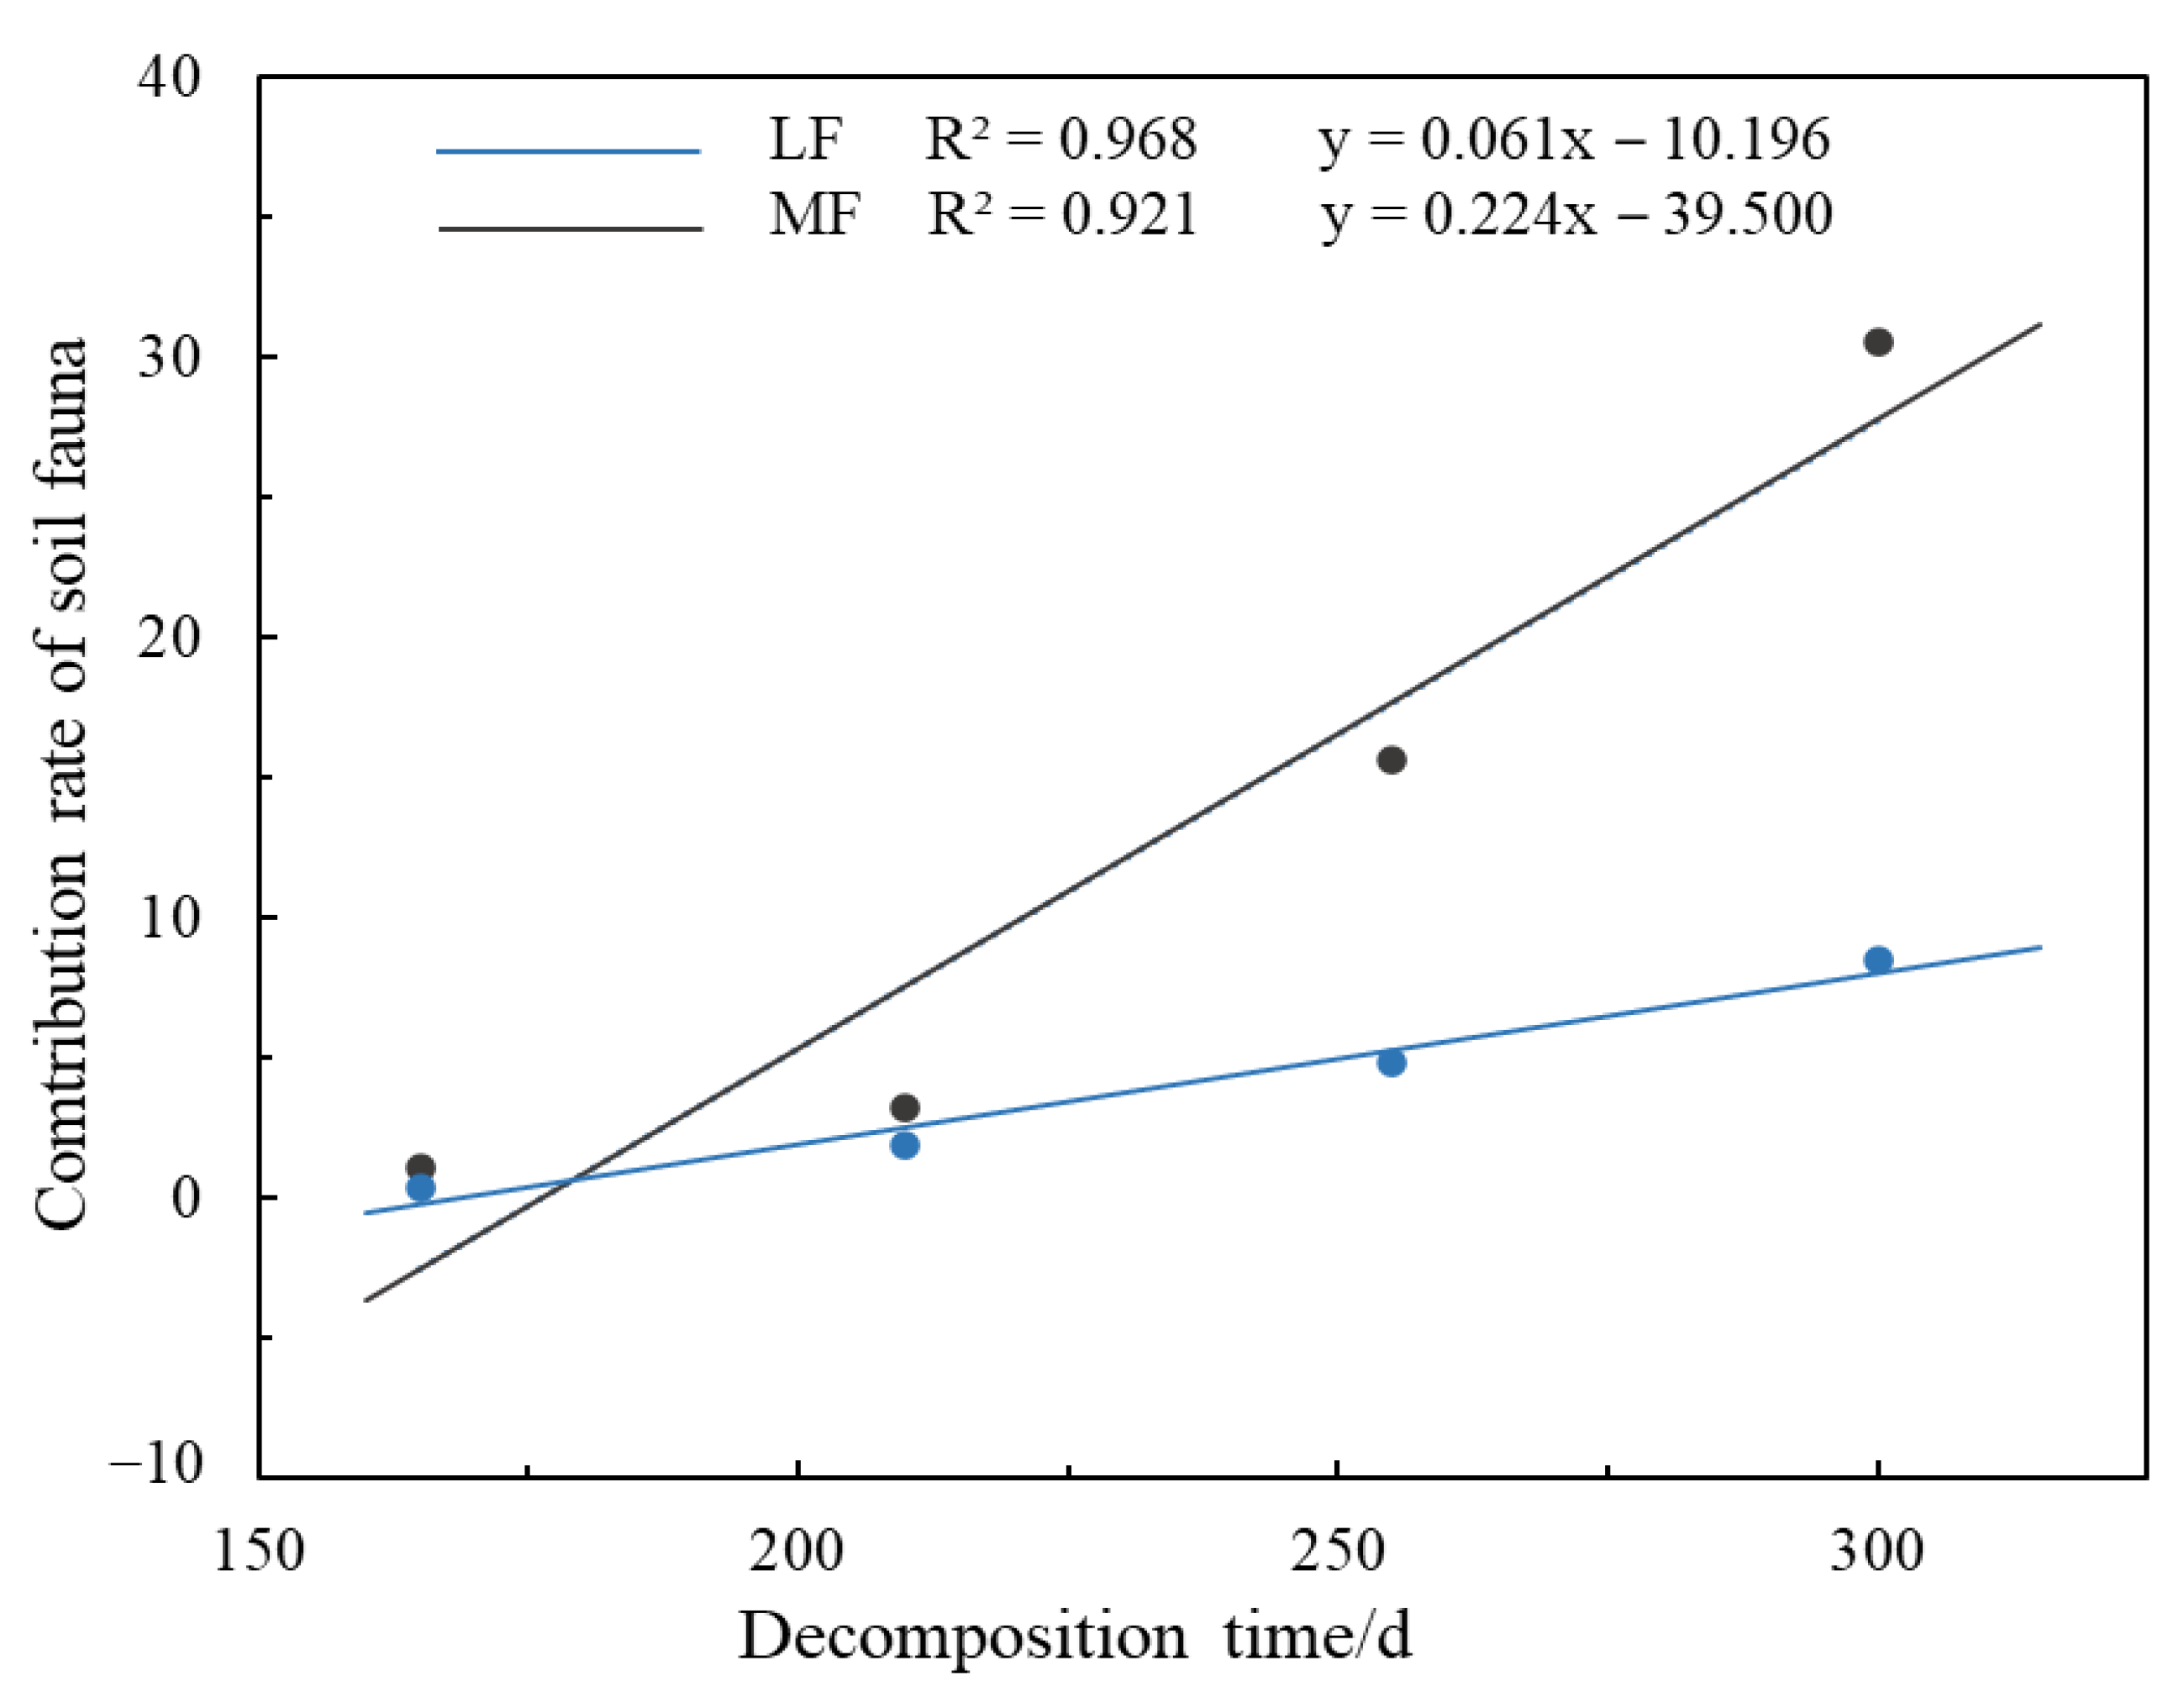
3.2.2. Contribution of the Soil Fauna Community to Litter Decomposition

As decomposition progressed, the contribution rate of the soil fauna to litter decomposition showed an increasing trend (Figure 8). The contribution rate of the soil fauna was positively correlated with the decomposition time. The litter decomposition rate was different between the LF and the MF, and the contribution rate of the soil fauna to the MF (30.58%) was much higher than that of the LF (8.54%).
The Pearson correlation analysis was used to analyze the relationship between the soil faunal ecological indices and the decomposition rate (Table 6). There was a significant positive correlation between litter decomposition rates and the total abundance and the abundance of dominant groups (p < 0.05). The litter decomposition rates were significantly positively correlated with the Shannon–Wiener index (H) in the LF (p < 0.05). The litter decomposition rates were significantly positively correlated with the number of groups in the MF (p < 0.05). The Simpson dominance index (C) was negatively correlated with the litter decomposition rates in both forest types, and significantly correlated with the LF (p < 0.05).

4. Discussion

4.1. Soil Fauna Community Characteristics

The community structure of the soil fauna is closely related to the forest vegetation composition, and microhabitat heterogeneity created by that stand structure has an important effect on the soil fauna community [30,31,32]. In this study, the total abundance of soil fauna in the MF was higher than that in the LF, and there were more common groups present, which resulted in a higher food web structure complexity for the soil fauna. The quality and quantity of litter can affect the soil fauna [33,34,35,36]. Chauvat [37] highlighted that incorporating beech into pure spruce forests increased the presence of new food sources and significantly increased the soil fauna density. The presence of Larix principis-rupprechtii ensured the accumulation of litterfall. At the same time, the addition of Betula platyphylla enriched the composition of the litterfall, so the composition of soil fauna in the mixed forest was richer and more stable.
Dividing the soil fauna into different functional groups based on the food source, feeding mode, and life history strategy can facilitate the study of the function of the soil fauna groups in the ecosystem [38,39]. The responses of different functional groups to environmental changes result in a different distribution of each functional group among the stands [40,41,42]. The proportion of predatory functional groups in the MF was higher than that in the LF, and the range of variation was low, indicating that the predatory soil faunas were at a higher trophic level in the food chain, and the community stability was high. Phytophagous soil fauna had a strong response to seasonal dynamics owing to their feeding habits.
The diversity index of soil fauna can reflect the complexity of community composition and reveal the response characteristics of the soil fauna community to environmental changes [43]. In this study, the Shannon–Wiener index (H) in the MF was higher than in the LF, consistent with the higher soil fauna diversity in other mixed forest areas [44,45,46]. When coniferous forests have a single tree species, the litter does not decompose easily, and the soil is relatively barren. Therefore, the living environment formed is not suitable for the survival of many soil faunas [47]. The mixed forest is species-rich, and has diverse microhabitats, and abundant litter species, which effectively maintain the soil surface water [48,49,50]. Broad-leaved litter can rapidly decompose into the soil and form organic matter, increasing soil fertility and improving the soil physical structure [51,52]. In this study, SOM, TN, and TP levels in the MF were higher than those in the LF, which was beneficial to the survival of various soil fauna groups and improved diversity.
Soil characteristics are critical environmental factors affecting the soil fauna community, and mixed planting indirectly affects the soil physical and chemical properties through changes in the standing vegetation composition. Chang [53] confirmed that soil organic matter and water content are closely related to the Collembola community. Yang [16] believed that soil water content, soil organic matter, and total litter nitrogen had a pronounced effect on the distribution of the main groups in the northern Loess Plateau. RDA ordination analysis showed that BD, SOM, TN, and pH significantly affected the soil fauna in this study, which was similar to the results by Tang [54]. Most soil fauna showed a significant negative response to soil pH, which is a limiting factor for the diversity of soil fauna [55]. Acarina, Collembola, Araneae, Isoptera, and Thylaptera were negatively correlated with BD and pH in this study. Nitrogen is the primary nutrient for protein construction and the development of soil fauna, which significantly affects the soil fauna community [56,57]. In this study, the total nitrogen content in layer I of the MF was the highest, which could provide more nitrogen for soil fauna to meet their growth and development requirements. Bartz [58] found a significant positive correlation between earthworm abundance and soil organic matter content. However, there was no close correlation between earthworm abundance and soil properties in the present study.

4.2. Effects of Soil Fauna on Litter Decomposition

The litter decomposition rate is mainly controlled by hydrothermal conditions [59], litter quality [60,61], and the soil fauna [62,63,64]. In this study, the decomposition rate in summer (210–255 d) was higher than that in other seasons because the good hydrothermal conditions in summer promoted the mineralization of soil, and the activity of soil microorganisms and soil fauna increased, which enabled the decomposition of lignin and other refractory substances in the litter. This is consistent with the results of previous studies [65,66,67,68,69]. Leaching and physical fragmentation under the effect of precipitation directly promote the decomposition of litter and increase the water content of litter, thereby affecting the decomposition rate [70,71,72]. It is also beneficial to the growth and reproduction of soil microorganisms and fauna, enhances their activity, and promotes litter decomposition. Under certain regional climate conditions, litter substrate quality is usually the main influencing factor. In this study, the litter decomposition rate of the MF was higher than that of the LF, indicating that mixed planting significantly promoted litter decomposition. Birch leaves contain different nutrients from larch leaves. The two species’ interactions of the litter increased the decomposition rate, while mixed forest litter substrate changes attracted increasing soil fauna colonization, increasing the crushing effect of litter. This is in line with the results of previous studies [73,74,75].
In this study, the difference in litter decomposition rates in the two types of mesh size litterbags in the same forest type indicated that soil fauna promoted litter decomposition, and litter decomposition rate was positively correlated with the abundance, group number, and diversity of soil fauna, which is consistent with the results of many previous studies [62,63]. The dominant groups accounted for 77.45% and 67.56% of the total soil fauna in the LF and the MF, respectively, and were the main groups involved in litter decomposition. Correlation analysis showed that the dominant groups (Acarina and Collembola) had a significant promoting effect on litter decomposition. In addition, correlation analysis showed that the Simpson dominance index (C) of the soil fauna was negatively correlated with the litter decomposition rate and reached a significant level in the LF (p < 0.05), suggesting that some critical groups in common and rare groups played a decisive role in the litter decomposition. In this study, the diversity of the soil fauna in the MF was higher than that in the LF. The number of groups and the Pielou evenness index (J) were more strongly correlated with the litter decomposition rate, whereas the Simpson dominance index (C) was more negatively correlated with the litter decomposition rate, indicating that the diversity of soil fauna could significantly promote litter decomposition, whereas the litter decomposition rate was severely restricted when the soil fauna group was less diverse.

5. Conclusions

The abundance and groups of soil faunas in the MF were higher than those in the LF. The dominant groups of the two forest types were the same, namely, Acarina and Collembola, which showed universal adaptability to the different microhabitats. The proportion of common groups in the MF was higher, indicating that the soil faunas were more abundant. There was a strong similarity in the composition of the functional groups between the two forest types. Under the influence of the dominant groups, saprozoite and omnivore were the main components. In the two forest types, the soil fauna had a strong response to seasonal dynamics, and the abundance and groups peaked in August when the hydrothermal conditions were good. Due to air permeability and food resources, soil fauna tended to gather on the soil surface in a vertical distribution. The soil fauna showed more obvious surface clustering characteristics in the MF. The soil fauna diversity in the MF was higher than in the LF. The Shannon–Wiener index (H), Pielou evenness index (J), and Simpson dominance index (C) of soil fauna in the MF were higher than that in the LF during the study period, which indicated that the stability and diversity of soil fauna communities in the MF were stronger. Microhabitat factors have an important effect on soil fauna community composition and diversity, and different soil fauna groups are affected differently by environmental factors. In this study, SOM and TN significantly affected soil fauna, whereas BD and pH were the limiting factors for some soil fauna groups.
The quality and quantity of litter in the MF were improved, and the decomposition rate was higher than that in the LF. The soil fauna community had an important influence on litter decomposition. The litter decomposition rate was positively correlated with the total abundance and the number of groups, and it was negatively correlated with the Simpson dominance index (C), indicating that the soil fauna community diversity improved the litter decomposition rate. The litter decomposition rate was significantly correlated with the number of groups only in the MF due to more abundant soil fauna groups.
In conclusion, the mixed Larix principis-rupprechtii and Betula platyphylla forest can effectively improve the abundance, groups, and soil fauna diversity by regulating vegetation’s composition and structure. Moreover, the litter decomposition is further improved, which is conducive to the nutrient cycling of the forestry ecosystem and greatly benefits vegetation restoration in mountainous areas.

Author Contributions

Conceptualization, H.Z. and T.H.; methodology, H.Z. and G.H.; software, G.H.; writing—original draft preparation, H.Z., G.H. and T.H.; writing—review and editing, T.H. and G.H.; visualization, G.H.; supervision, H.Z. and T.H.; funding acquisition, H.Z.; Data curation, Y.F. and X.W.; project administration, W.T. All authors have read and agreed to the published version of the manuscript.

Funding

This research was supported by the National Science and Technology Major Project for Water Pollution Control and Treatment (2017ZX07101002).

Conflicts of Interest

The authors declare no conflict of interest.

References

  1. Yin, X.; Song, B.; Dong, W.; Xin, W.; Wang, Y. A Review on the Eco-Geography of Soil Fauna in China. J. Geogr. Sci. 2010, 20, 333–346. [Google Scholar] [CrossRef]
  2. García-Palacios, P.; Maestre, F.T.; Kattge, J.; Wall, D.H. Climate and Litter Quality Differently Modulate the Effects of Soil Fauna on Litter Decomposition across Biomes. Ecol. Lett. 2013, 16, 1045–1053. [Google Scholar] [CrossRef] [PubMed] [Green Version]
  3. Carrillo, Y.; Ball, B.A.; Bradford, M.A.; Jordan, C.F.; Molina, M. Soil Fauna Alter the Effects of Litter Composition on Nitrogen Cycling in a Mineral Soil. Soil Biol. Biochem. 2011, 43, 1440–1449. [Google Scholar] [CrossRef]
  4. Gong, X.; Wang, S.; Wang, Z.; Jiang, Y.; Hu, Z.; Zheng, Y.; Chen, X.; Li, H.; Hu, F.; Liu, M.; et al. Earthworms Modify Soil Bacterial and Fungal Communities through Enhancing Aggregation and Buffering PH. Geoderma 2019, 347, 59–69. [Google Scholar] [CrossRef]
  5. Bardgett, R.D.; van der Putten, W.H. Belowground Biodiversity and Ecosystem Functioning. Nature 2014, 515, 505–511. [Google Scholar] [CrossRef] [PubMed]
  6. Tilman, D.; Isbell, F.; Cowles, J.M. Biodiversity and Ecosystem Functioning. Annu. Rev. Ecol. Evol. Syst. 2014, 45, 471–493. [Google Scholar] [CrossRef]
  7. Bardgett, R.D.; Chan, K.F. Experimental Evidence That Soil Fauna Enhance Nutrient Mineralization and Plant Nutrient Uptake in Montane Grassland Ecosystems. Soil Biol. Biochem. 1999, 31, 1007–1014. [Google Scholar] [CrossRef]
  8. Yin, X.; Qiu, L.; Jiang, Y.; Wang, Y. Diversity and Spatial-Temporal Distribution of Soil Macrofauna Communities Along Elevation in the Changbai Mountain, China. Environ. Entomol. 2017, 46, 454–459. [Google Scholar] [CrossRef]
  9. Xu, J.; Lie, G.; Xue, L. Effects of Gap Size on Diversity of Soil Fauna in a Cunninghamia Lanceolata Stand Damaged by an Ice Storm in Southern China. J. For. Res. 2016, 27, 1427–1434. [Google Scholar] [CrossRef]
  10. Xu, H.; Yu, L.; Huang, X. Biodiversity of Macro Ground-Dwelling Arthropods in Secondary Forests and Plantationforests of Montane Region of Eastern Liaoning Province. Chin. J. Ecol. 2015, 34, 727–735. (In Chinese) [Google Scholar]
  11. dos Santos, R.N.; Cabreira, W.V.; Pereira, M.G.; de Souza, R.C.; de Lima, S.S.; Louzada, M.A.P.; dos Santos, G.L.; Silva, A.C.R. da Community Ecology of Soil Fauna Under Periodically Flooded Forest and Anthropic Fields. Floresta Ambient 2020, 28, e20200052. [Google Scholar] [CrossRef]
  12. Yang, B.; Zhang, W.; Xu, H.; Wang, S.; Xu, X.; Fan, H.; Chen, H.Y.H.; Ruan, H. Effects of Soil Fauna on Leaf Litter Decomposition under Different Land Uses in Eastern Coast of China. J. For. Res. 2018, 29, 973–982. [Google Scholar] [CrossRef]
  13. Tan, B.; Yin, R.; Zhang, J.; Xu, Z.; Liu, Y.; He, S.; Zhang, L.; Li, H.; Wang, L.; Liu, S.; et al. Temperature and Moisture Modulate the Contribution of Soil Fauna to Litter Decomposition via Different Pathways. Ecosystems 2021, 24, 1142–1156. [Google Scholar] [CrossRef]
  14. Njoroge, D.M.; Chen, S.-C.; Zuo, J.; Dossa, G.G.O.; Cornelissen, J.H.C. Soil Fauna Accelerate Litter Mixture Decomposition Globally, Especially in Dry Environments. J. Ecol. 2022, 110, 659–672. [Google Scholar] [CrossRef]
  15. Hu, M.M.; Tian, L.; Wu, Y.N. Influences of Thinning and Mixed Transformation of Larix Principis-Rupprechtii Plantations on the Community Structure of Soil Macro Faunal in Saihanba Area. Sci. Silvae Sin. 2019, 55, 153–162. (In Chinese) [Google Scholar]
  16. Yang, X.; Shao, M.; Li, T.; Gan, M.; Chen, M. Community Characteristics and Distribution Patterns of Soil Fauna after Vegetation Restoration in the Northern Loess Plateau. Ecol. Indic. 2021, 122, 107236. [Google Scholar] [CrossRef]
  17. Zhu, X.; Hu, Y.; Gao, B. Influence of Enviroment of Forest-Steppe Ecotone on Soil Arthropods Community in Northern Hebei, China. Procedia Environ. Sci. 2011, 10, 1862–1867. [Google Scholar] [CrossRef] [Green Version]
  18. Yin, W.Y. Pictorial Keys to Soil Animals of China; Science Press: Beijing, China, 1998. [Google Scholar]
  19. Swift, M.J.; Andrén, O.; Brussaard, L.; Briones, M.; Couteaux, M.-M.; Ekschmitt, K.; Kjoller, A.; Loiseau, P.; Smith, P. Global Change, Soil Biodiversity, and Nitrogen Cycling in Terrestrial Ecosystems: Three Case Studies. Glob. Change Biol. 1998, 4, 729–743. [Google Scholar] [CrossRef]
  20. Crutsinger, G.M.; Sanders, N.J.; Classen, A.T. Comparing Intra- and Inter-Specific Effects on Litter Decomposition in an Old-Field Ecosystem. Basic Appl. Ecol. 2009, 10, 535–543. [Google Scholar] [CrossRef]
  21. Page, A.L.; Miller, R.H.; Kenney, D.R. Methods of Soil Analysis Part 2 (Agronomy Monographs 9); American Society of Agronomy: Madison, WI, USA, 1982. [Google Scholar]
  22. Dick, W.A.; Cheng, L.; Wang, P. Soil Acid and Alkaline Phosphatase Activity as PH Adjustment Indicators. Soil Biol. Biochem. 2000, 32, 1915–1919. [Google Scholar] [CrossRef]
  23. Shannon, C.E. A Mathematical Theory of Communication. Bell Syst. Tech. J. 1948, 27, 379–423. [Google Scholar] [CrossRef] [Green Version]
  24. Pielou, E.C. The Measurement of Diversity in Different Types of Biological Collections. J. Theor. Biol. 1966, 13, 131–144. [Google Scholar] [CrossRef]
  25. Simpson, E.H. Measurement of Diversity. Nature 1949, 163, 688. [Google Scholar] [CrossRef]
  26. Gao, J.; Kang, F.; Li, T.; Song, X.; Zhao, W.; Yu, X.; Han, H. Assessing the Effect of Leaf Litter Diversity on the Decomposition and Associated Diversity of Fungal Assemblages. Forests 2015, 6, 2371–2386. [Google Scholar] [CrossRef] [Green Version]
  27. Olson, J.S. Energy Storage and the Balance of Producers and Decomposers in Ecological Systems. Ecology 1963, 44, 322–331. [Google Scholar] [CrossRef] [Green Version]
  28. Seastedt, T.R. The Role of Microarthropods in Decomposition and Mineralization Processes. Annu. Rev. Entomol. 1984, 29, 25–46. [Google Scholar] [CrossRef]
  29. Hemerik, L.; Brussaard, L. Diversity of Soil Macro-Invertebrates in Grasslands under Restoration Succession. Eur. J. Soil Biol. 2002, 38, 145–150. [Google Scholar] [CrossRef] [Green Version]
  30. Caruso, T.; Melecis, V.; Kagainis, U.; Bolger, T. Population Asynchrony Alone Does Not Explain Stability in Species-Rich Soil Animal Assemblages: The Stabilizing Role of Forest Age on Oribatid Mite Communities. J. Anim. Ecol. 2020, 89, 1520–1531. [Google Scholar] [CrossRef]
  31. Wei, Q.; Yin, R.; Huang, J.; Vogler, A.P.; Li, Y.; Miao, X.; Kardol, P. The Diversity of Soil Mesofauna Declines after Bamboo Invasion in Subtropical China. Sci. Total Environ. 2021, 789, 147982. [Google Scholar] [CrossRef]
  32. Peng, Y.; Holmstrup, M.; Schmidt, I.K.; De Schrijver, A.; Schelfhout, S.; Heděnec, P.; Zheng, H.; Bachega, L.R.; Yue, K.; Vesterdal, L. Litter Quality, Mycorrhizal Association, and Soil Properties Regulate Effects of Tree Species on the Soil Fauna Community. Geoderma 2022, 407, 115570. [Google Scholar] [CrossRef]
  33. Hättenschwiler, S.; Bretscher, D. Isopod Effects on Decomposition of Litter Produced under Elevated CO2, N Deposition and Different Soil Types. Glob. Change Biol. 2001, 7, 565–579. [Google Scholar] [CrossRef]
  34. Hättenschwiler, S.; Gasser, P. Soil Animals Alter Plant Litter Diversity Effects on Decomposition. Proc. Natl. Acad. Sci. USA 2005, 102, 1519–1524. [Google Scholar] [CrossRef] [PubMed] [Green Version]
  35. Santonja, M.; Fernandez, C.; Proffit, M.; Gers, C.; Gauquelin, T.; Reiter, I.M.; Cramer, W.; Baldy, V. Plant Litter Mixture Partly Mitigates the Negative Effects of Extended Drought on Soil Biota and Litter Decomposition in a Mediterranean Oak Forest. J. Ecol. 2017, 105, 801–815. [Google Scholar] [CrossRef] [Green Version]
  36. Vos, V.C.A.; van Ruijven, J.; Berg, M.P.; Peeters, E.T.H.M.; Berendse, F. Macro-Detritivore Identity Drives Leaf Litter Diversity Effects. Oikos 2011, 120, 1092–1098. [Google Scholar] [CrossRef]
  37. Chauvat, M.; Titsch, D.; Zaytsev, A.S.; Wolters, V. Changes in Soil Faunal Assemblages during Conversion from Pure to Mixed Forest Stands. For. Ecol. Manag. 2011, 262, 317–324. [Google Scholar] [CrossRef]
  38. Lavelle, P. Faunal Activities and Soil Processes: Adaptive Strategies That Determine Ecosystem Function. In Advances in Ecological Research; Begon, M., Fitter, A.H., Eds.; Academic Press: Cambridge, MA, USA, 1997; Volume 27, pp. 93–132. [Google Scholar]
  39. Moore, J.C.; de Ruiter, P.C.; Hunt, H.W.; Coleman, D.C.; Freckman, D.W. Microcosms and Soil Ecology: Critical Linkages between Fields Studies and Modelling Food Webs. Ecology 1996, 77, 694–705. [Google Scholar] [CrossRef]
  40. Brussaard, L. Soil Fauna, Guilds, Functional Groups and Ecosystem Processes. Appl. Soil Ecol. 1998, 9, 123–135. [Google Scholar] [CrossRef]
  41. Brussaard, L.; Pulleman, M.M.; Ouédraogo, É.; Mando, A.; Six, J. Soil Fauna and Soil Function in the Fabric of the Food Web. Pedobiologia 2007, 50, 447–462. [Google Scholar] [CrossRef]
  42. Ferris, H.; Matute, M.M. Structural and Functional Succession in the Nematode Fauna of a Soil Food Web. Appl. Soil Ecol. 2003, 23, 93–110. [Google Scholar] [CrossRef]
  43. Inkotte, J.; Bomfim, B.; da Silva, S.C.; Valadão, M.B.X.; da Rosa, M.G.; Viana, R.B.; D’Ângelo Rios, P.; Gatto, A.; Pereira, R.S. Linking Soil Biodiversity and Ecosystem Function in a Neotropical Savanna. Appl. Soil Ecol. 2022, 169, 104209. [Google Scholar] [CrossRef]
  44. Korboulewsky, N.; Perez, G.; Chauvat, M. How Tree Diversity Affects Soil Fauna Diversity: A Review. Soil Biol. Biochem. 2016, 94, 94–106. [Google Scholar] [CrossRef]
  45. Scheu, S. Linkages Between Tree Diversity, Soil Fauna and Ecosystem Processes. In Forest Diversity and Function: Temperate and Boreal Systems; Scherer-Lorenzen, M., Körner, C., Schulze, E.-D., Eds.; Springer: Berlin/Heidelberg, Germany, 2005; pp. 211–233. ISBN 978-3-540-26599-3. [Google Scholar]
  46. Wardle, D.A. The Influence of Biotic Interactions on Soil Biodiversity. Ecol. Lett. 2006, 9, 870–886. [Google Scholar] [CrossRef] [PubMed]
  47. Huuskonen, S.; Domisch, T.; Finér, L.; Hantula, J.; Hynynen, J.; Matala, J.; Miina, J.; Neuvonen, S.; Nevalainen, S.; Niemistö, P.; et al. What Is the Potential for Replacing Monocultures with Mixed-Species Stands to Enhance Ecosystem Services in Boreal Forests in Fennoscandia? For. Ecol. Manag. 2021, 479, 118558. [Google Scholar] [CrossRef]
  48. Ammer, C. Diversity and Forest Productivity in a Changing Climate. New Phytol. 2019, 221, 50–66. [Google Scholar] [CrossRef] [PubMed] [Green Version]
  49. del Río, M.; Pretzsch, H.; Alberdi, I.; Bielak, K.; Bravo, F.; Brunner, A.; Condés, S.; Ducey, M.J.; Fonseca, T.; von Lüpke, N.; et al. Characterization of the Structure, Dynamics, and Productivity of Mixed-Species Stands: Review and Perspectives. Eur. J. Forest Res. 2016, 135, 23–49. [Google Scholar] [CrossRef]
  50. Pretzsch, H.; del Río, M.; Ammer, C.; Avdagic, A.; Barbeito, I.; Bielak, K.; Brazaitis, G.; Coll, L.; Dirnberger, G.; Drössler, L.; et al. Growth and Yield of Mixed versus Pure Stands of Scots Pine (Pinus Sylvestris L.) and European Beech (Fagus Sylvatica L.) Analysed along a Productivity Gradient through Europe. Eur. J. Forest Res. 2015, 134, 927–947. [Google Scholar] [CrossRef] [Green Version]
  51. Jacob, M.; Weland, N.; Platner, C.; Schaefer, M.; Leuschner, C.; Thomas, F.M. Nutrient Release from Decomposing Leaf Litter of Temperate Deciduous Forest Trees along a Gradient of Increasing Tree Species Diversity. Soil Biol. Biochem. 2009, 41, 2122–2130. [Google Scholar] [CrossRef]
  52. Szanser, M.; Ilieva-Makulec, K.; Kajak, A.; Górska, E.; Kusińska, A.; Kisiel, M.; Olejniczak, I.; Russel, S.; Sieminiak, D.; Wojewoda, D. Impact of Litter Species Diversity on Decomposition Processes and Communities of Soil Organisms. Soil Biol. Biochem. 2011, 43, 9–19. [Google Scholar] [CrossRef]
  53. Chang, L.; Wu, H.; Wu, D.; Sun, X. Effect of Tillage and Farming Management on Collembola in Marsh Soils. Appl. Soil Ecol. 2013, 64, 112–117. [Google Scholar] [CrossRef]
  54. Tang, T.W.; Feng, Y.; Wu, X.G. Characteristics of Soil Macrofauna Community under Urban Forests in Chengdu in Winter. Chin. J. Appl. Environ. Biol. 2020, 26, 1207–1217. (In Chinese) [Google Scholar]
  55. Chen, D.; Lan, Z.; Bai, X.; Grace, J.B.; Bai, Y. Evidence That Acidification-Induced Declines in Plant Diversity and Productivity Are Mediated by Changes in below-Ground Communities and Soil Properties in a Semi-Arid Steppe. J. Ecol. 2013, 101, 1322–1334. [Google Scholar] [CrossRef]
  56. Hu, B.; Zhou, M.; Bilela, S.; Simon, J.; Dannenmann, M.; Liu, X.; Alfarraj, S.; Hou, L.; Chen, H.; Zhang, S.; et al. Nitrogen Nutrition of Native and Introduced Forest Tree Species in N-Limited Ecosystems of the Qinling Mountains, China. Trees 2017, 31, 1189–1202. [Google Scholar] [CrossRef]
  57. Lu, P.; Tan, Y.; Dai, N.; Di, M.; Weng, X.; Zhan, Y.; Xu, D. Composition and Structure of Soil Fauna Communities and Their Relationships with Environmental Factors in Copper Mine Waste Rock after Re-Vegetation. Glob. Ecol. Conserv. 2021, 32, e01889. [Google Scholar] [CrossRef]
  58. Bartz, M.L.C.; Pasini, A.; Brown, G.G. Earthworms as Soil Quality Indicators in Brazilian No-Tillage Systems. Appl. Soil Ecol. 2013, 69, 39–48. [Google Scholar] [CrossRef]
  59. Hong, J.; Lu, X.; Ma, X.; Xiaodan, W. Five-Year Study on the Effects of Warming and Plant Litter Quality on Litter Decomposition Rate in a Tibetan Alpine Grassland. Sci. Total Environ. 2021, 750, 142306. [Google Scholar] [CrossRef]
  60. Zhou, S.; Butenschoen, O.; Barantal, S.; Handa, I.T.; Makkonen, M.; Vos, V.; Aerts, R.; Berg, M.P.; McKie, B.; Van Ruijven, J.; et al. Decomposition of Leaf Litter Mixtures across Biomes: The Role of Litter Identity, Diversity and Soil Fauna. J. Ecol. 2020, 108, 2283–2297. [Google Scholar] [CrossRef]
  61. Yang, X.; Chen, J. Plant Litter Quality Influences the Contribution of Soil Fauna to Litter Decomposition in Humid Tropical Forests, Southwestern China. Soil Biol. Biochem. 2009, 41, 910–918. [Google Scholar] [CrossRef]
  62. Xin, W.D.; Yin, X.Q.; Song, B. Contribution of Soil Fauna to Litter Decomposition in Songnen Sandy Lands in Northeastern China. J. Arid. Environ. 2012, 77, 90–95. [Google Scholar] [CrossRef]
  63. Zan, P.; Sun, T.; Mao, Z. Effects of Soil Fauna on Litter Decomposition Using FIeld Microcosms across 16 Co-Occurring Temperate Tree Species. Aust. For. 2021, 84, 33–38. [Google Scholar] [CrossRef]
  64. Lin, D.; Wang, F.; Fanin, N.; Pang, M.; Dou, P.; Wang, H.; Qian, S.; Zhao, L.; Yang, Y.; Mi, X.; et al. Soil Fauna Promote Litter Decomposition but Do Not Alter the Relationship between Leaf Economics Spectrum and Litter Decomposability. Soil Biol. Biochem. 2019, 136, 107519. [Google Scholar] [CrossRef]
  65. Anderson, J.M.; Ineson, P.; Huish, S.A. Nitrogen and Cation Mobilization by Soil Fauna Feeding on Leaf Litter and Soil Organic Matter from Deciduous Woodlands. Soil Biol. Biochem. 1983, 15, 463–467. [Google Scholar] [CrossRef]
  66. Handa, I.T.; Aerts, R.; Berendse, F.; Berg, M.P.; Bruder, A.; Butenschoen, O.; Chauvet, E.; Gessner, M.O.; Jabiol, J.; Makkonen, M.; et al. Consequences of Biodiversity Loss for Litter Decomposition across Biomes. Nature 2014, 509, 218–221. [Google Scholar] [CrossRef] [PubMed] [Green Version]
  67. Hättenschwiler, S.; Jørgensen, H.B. Carbon Quality Rather than Stoichiometry Controls Litter Decomposition in a Tropical Rain Forest. J. Ecol. 2010, 98, 754–763. [Google Scholar] [CrossRef]
  68. Makkonen, M.; Berg, M.P.; Handa, I.T.; Hättenschwiler, S.; van Ruijven, J.; van Bodegom, P.M.; Aerts, R. Highly Consistent Effects of Plant Litter Identity and Functional Traits on Decomposition across a Latitudinal Gradient. Ecol. Lett. 2012, 15, 1033–1041. [Google Scholar] [CrossRef]
  69. Wall, D.H.; Bradford, M.A.; St. John, M.G.; Trofymow, J.A.; Behan-Pelletier, V.; Bignell, D.E.; Dangerfield, J.M.; Parton, W.J.; Rusek, J.; Voigt, W.; et al. Global Decomposition Experiment Shows Soil Animal Impacts on Decomposition Are Climate-Dependent. Glob. Change Biol. 2008, 14, 2661–2677. [Google Scholar] [CrossRef] [Green Version]
  70. García-Palacios, P.; Prieto, I.; Ourcival, J.-M.; Hättenschwiler, S. Disentangling the Litter Quality and Soil Microbial Contribution to Leaf and Fine Root Litter Decomposition Responses to Reduced Rainfall. Ecosystems 2016, 19, 490–503. [Google Scholar] [CrossRef]
  71. Sanaullah, M.; Rumpel, C.; Charrier, X.; Chabbi, A. How Does Drought Stress Influence the Decomposition of Plant Litter with Contrasting Quality in a Grassland Ecosystem? Plant Soil 2012, 352, 277–288. [Google Scholar] [CrossRef]
  72. Walter, J.; Hein, R.; Beierkuhnlein, C.; Hammerl, V.; Jentsch, A.; Schädler, M.; Schuerings, J.; Kreyling, J. Combined Effects of Multifactor Climate Change and Land-Use on Decomposition in Temperate Grassland. Soil Biol. Biochem. 2013, 60, 10–18. [Google Scholar] [CrossRef]
  73. Rustad, L.E.; Cronan, C.S. Element Loss and Retention during Litter Decay in a Red Spruce Stand in Maine. Can. J. For. Res. 1988, 18, 947–953. [Google Scholar] [CrossRef]
  74. Staaf, H.; Staaf, H. Influence of Chemical Composition, Addition of Raspberry Leaves, and Nitrogen Supply on Decomposition Rate and Dynamics of Nitrogen and Phosphorus in Beech Leaf Litter. Oikos 1980, 35, 55. [Google Scholar] [CrossRef]
  75. Taylor, B.R.; Parsons, W.F.J.; Parkinson, D. Decomposition of Populustremuloides Leaf Litter Accelerated by Addition of Alnuscrispa Litter. Can. J. For. Res. 1989, 19, 674–679. [Google Scholar] [CrossRef]
Figure 1. Location of the study site.
Forests 13 00703 g001
Figure 2. Vertical distribution of the soil fauna community. (a) The total abundance; (b) the abundance of common groups; (c) the abundance of Acarina; (d) the abundance of Collembola. Different letters indicate significant differences between soil layers of the same forest at the 0.05 probability level.
Forests 13 00703 g002
Figure 3. Temporal and vertical distribution of functional groups in the two forest types. (a) Temporal distribution; (b) vertical distribution.
Forests 13 00703 g003
Figure 4. Temporal and vertical distribution of diversity indices of the soil fauna. (a) The Shannon–Wiener index (H); (b) the Pielou evenness index (J); (c) the Simpson dominance index (C).
Forests 13 00703 g004aForests 13 00703 g004b
Figure 5. Redundancy analysis between main groups of the soil fauna and the selected properties of soil. Red arrows represent soil properties labeled as: soil bulk density (BD), soil pH value (pH), soil organic matter (SOM), total nitrogen (TN), and total phosphorus (TP). Black arrows represent groups of soil fauna labeled as: Acarina (Aca.), Araneae (Ara.), Collembola (Col.), Dermaptera (Der.), Diplopoda (Dip.), Diptera adult (Dip. (A)), Diptera larvae (Dip. (L)), Enchytraeidae (Enc.), Isoptera (Iso.), Psocoptera (Pso.), and Thysanoptera (Thy.).
Forests 13 00703 g005
Figure 6. Dynamic changes in the net decomposition rate of litter. MF–1: Mixed Larix principis-rupprechtii and Betula platyphylla forest, 4 mm litterbags; MF–2: Mixed Larix principis-rupprechtii and Betula platyphylla forest, 0.01 mm litterbags; LF–1: Larix principis-rupprechtii forest, 4 mm litterbags; LF–2: Larix principis-rupprechtii forest, 0.01 mm litterbags.
Forests 13 00703 g006
Figure 7. Olson negative index regression relation between litter residues and time.
Forests 13 00703 g007
Figure 8. Contributions of soil fauna to litter decomposition.
Forests 13 00703 g008
Table 1. The basic situation of the sample plots in the study site.
StandsSlope
Aspect
Longitude and
Latitude
Altitude
m·a·s·l a
Stand Density
(Trees/ha)
Average Height of Trees (m)Diameter at Breast Height (cm)Major Understory Vegetation
Larix principis-rupprechtii forest (LF)Southwest115°26′58′′ E
40°58′53′′ N
198511387.610.29Potentilla fruticose,
Rubus swinhoei Hance,
Malus baccata, etc.
Mixed Larix principis-rupprechtii and Betula platyphylla forest (MF)Northeast115°27′51′′ E 40°58′37′′ N190422019.810.57Rubus swinhoei Hance,
Crataegus pinnatifida Bunge, Rosa bella, Ribes rubrum, Malus baccata, etc.
a: Meters above sea level.
Table 2. Quality parameters of soil in the sampled forests.
BD (g·cm−3)pHSOM (g·kg−1)TN (g·kg−1)TP (g·kg−1)
Larix principis-rupprechtii forest
0–10 cmupslope0.96 ± 0.006.61 ± 0.0257.28 ± 0.262.94 ± 0.060.54 ± 0.01
mesoslope1.33 ± 0.006.98 ± 0.0348.72 ± 0.942.66 ± 0.040.64 ± 0.01
downslope0.99 ± 0.006.90 ± 0.0455.05 ± 0.392.96 ± 0.050.76 ± 0.03
10–20 cmupslope1.35 ± 0.006.80 ± 0.0143.59 ± 0.742.36 ± 0.050.59 ± 0.00
mesoslope0.96 ± 0.007.10 ± 0.0146.84 ± 0.542.41 ± 0.040.67 ± 0.02
downslope1.06 ± 0.007.09 ± 0.0351.40 ± 0.412.83 ± 0.030.81 ± 0.01
Mixed Larix principis-rupprechtii and Betula platyphylla forest
0–10 cmupslope0.83 ± 0.006.19 ± 0.0594.87 ± 2.284.80 ± 0.040.97 ± 0.01
mesoslope0.80 ± 0.006.29 ± 0.0274.11 ± 0.883.88 ± 0.050.94 ± 0.01
downslope0.73 ± 0.006.72 ± 0.0188.87 ± 1.924.39 ± 0.040.83 ± 0.02
10–20 cmupslope0.82 ± 0.006.82 ± 0.0275.85 ± 1.393.85 ± 0.040.95 ± 0.01
mesoslope0.88 ± 0.006.38 ± 0.0468.32 ± 1.733.49 ± 0.060.94 ± 0.01
downslope0.90 ± 0.006.71 ± 0.0260.50 ± 1.692.91 ± 0.060.78 ± 0.02
Table 3. Composition of the soil fauna community.
GroupsLarix principis-rupprechtii ForestMixed Larix principis-rupprechtii and Betula platyphylla Forest
May.Jun.Aug.Sep.Nov. Total May.Jun.Aug.Sep.Nov. Total
IndividualsIndividualsPercentageAbundanceIndividualsIndividualsPercentageAbundance
Acarina50 c104 b145 a134 a110 b54339.43+++30 d54 c173 a194 a85 b53633.90+++
Collembola34 c101 ab157 a117 ab94 b50336.53+++28 d54 c218 a212 a65 b57736.50+++
Hemiptera0040040.29+0000000.00
Isoptera471693392.83++512742061177.40++
Orthoptera1400050.36+0050050.32+
Thysanoptera03810120.87+03511111764.81++
Dermaptera3000030.22+0000000.00
Coleoptera (adult)53320130.94+0000000.00
Coleoptera (larvae)0233080.58+0002240.25+
Diptera (adult)141020171.23++001304171.08++
Diptera (larvae)4723211081097.92++46422010825.19++
Lepidoptera (larvae)0000000.000111030.19+
Formicidae0000000.002001030.19+
Gastropoda0000000.000030030.19+
Diplopoda0104050.36+0210030.19+
Protura0005050.36+0000110.06+
Isopoda09530171.23++0600060.38+
Psocoptera0030120423.05++0133180.51+
Enchytraeidae101923251.82++176182342.15++
Araneae210119231.67++5416472744.68++
Geophilomorpha1110030.22+613523291.83++
Symphyla0010010.07+2001030.19+
Number of groups1013 1413 6 19 9111313 12 19
Sum149 d263 bc423 a305 b237 c1377 86 e163 d611 a532 b192 c1581
Degree of dominance; +++: Dominant groups; ++: Common groups; +: Rare groups; –: Uncollected. Abundance with the same letters (a, b, c, or d) at the row of the same forest type is not significantly different (ANOVA with LSD test, p < 0.05). Table 3 shows the mean number of individuals extracted from the samples, multiplied by 6.94 to calculate individuals per square meter in 0–20 cm soil layer.
Table 4. Effects of mixed forest on the abundance and composition of functional groups.
SaprozoitePhytophagePredatorOmnivore
Abundance (inds.)
LF721 ± 7057 ± 453 ± 0546 ± 33
MF840 ± 3016 ± 3186 ± 13539 ± 14
Modulated ratio (%)16.86 ± 7.34−71.67 ± 7.07250.94 ± 24.01−1.18 ± 3.30
Proportion (%)
LF52.31 ± 3.524.14 ± 0.183.85 ± 0.1239.71 ± 3.59
MF53.12 ± 1.021.01 ± 0.2011.76 ± 0.6234.13 ± 1.44
Modulated ratio (%)1.73 ± 4.90−75.37 ± 5.80205.78 ± 25.4113.92 ± 4.14
Modulated ratio (%): the increasing ratio in abundance (inds.) or proportion (%) of a certain functional group in the MF compared with the LF.
Table 5. Eigenvalues and taxa-environment correlation coefficients for the RDA ordination axes.
ParametersAxis 1Axis 2Axis 3Axis 4
Eigenvalues0.35620.18760.04020.0195
Explained variation (%) (cumulative)35.6254.3858.460.35
Pseudo–canonical correlation0.9160.93230.62470.4654
Explained fitted variation (%) (cumulative)59.0290.196.76100
Monte Carlo test after 499 permutations
Text on the first axispseudo–F = 3.9, p = 0.024
Text on all axespseudo–F = 2.7, p = 0.006
Table 6. Correlation coefficients between decomposition rate and abundance, group numbers, ecological indices of soil fauna.
LFMF
Total abundance0.995 **0.894 **
The number of groups0.6710.877 **
Shannon–Wiener index (H)0.893 **0.654
Pielou evenness index (J)0.2850.061
Simpson dominance index (C)–0.880 **–0.586
Collembola0.991 **0.866 **
Acarina0.846 *0.746 *
**: p = 0. 01; *: p= 0. 05.
Publisher’s Note: MDPI stays neutral with regard to jurisdictional claims in published maps and institutional affiliations.

