Abstract
Acid hydrolysable components have been thought to release from plant litter at early periods of decomposition and to be sensitive to hydrological change. Variations in snow depth and timing may alter the release of acid hydrolysable components from decomposing litter in seasonally snow-covered ecosystems. Here, we measured the release of acid hydrolyzable components from four foliar litters (fir, cypress, larch and birch) in deep and shallow snow plots during winter (snow formation, snow coverage and snowmelt stages) and growing seasons in an alpine forest from 2012 to 2016. We found that the content of acid hydrolysable components was 16–21% in fresh litter across species, and only 4–5% of these components remained in the litter after four years of decomposition when 53–66% of litter mass was lost. The content of acid hydrolysable components greatly decreased within 41 days and during the growing seasons of the fourth year of decomposition, suggesting that acid hydrolysable components in plant litter are not only released at early periods but also at a very late period during litter decay. However, the content of acid hydrolysable components increased significantly at snowmelt stages. Reduced snow cover increased the content and remaining level of acid hydrolysable components during the four years of decomposition by altering leaching, microbial biomass and stoichiometry. We propose that more effective partitioning of chemical fractions should be incorporated to distinguish the carbon and nutrient release during litter decomposition within a complex context of the changing environment.
1. Introduction
The release of labile components from plant litter is one of the fastest pathways for carbon (C) turnover in forest ecosystems due to its high decomposability [1]. These labile fractions, such as water soluble and acid hydrolysable components, are primarily leached during early decomposition [2] and are rapidly consumed by soil decomposers [3]. However, “labile” is defined relative to “recalcitrant”, and our current knowledge of the entire fraction of “labile” components is a nebulous concept in litter decomposition studies [1]. Most studies have focused on dissolved organic carbon (DOC), but other forms of labile fractions, such as acid hydrolysable components, are also released from plant litter during early stages of decomposition and regulate some important ecological processes [4]. These acid hydrolysable components decomposed from fresh litter supply the C that is available for soil microorganisms, which in turn contribute to litter breakdown and C and nutrient cycling [5].
Acid hydrolysable components in plant litter are consumed or released in different stages of decomposition [2]. In the early stage, acid hydrolysable components are released rapidly from senesced litter because fresh litter contains large amounts of soluble compounds, including some polysaccharides, hemicellulose, cellulose and some soluble lignin [6]. Additionally, the snowmelt stage may be another peak of acid hydrolysable components release because higher microbial activity under a warmer environment facilitates the degradation of hemicellulose and cellulose, and this decomposed detritus could be leached by snowmelt water [7]. Moreover, repeated soil freezing and thawing during winter causes previously stabilized organic matter to be available as labile C and nutrients [8]. These previous findings suggest that shifts in the ambient environment during different decomposition periods strongly control the release of acid hydrolysable components from plant litter.
Snow cover in the Northern Hemisphere has decreased by 7% and is projected to decrease by 25% by the end of this century [9]. This reduction has a profound influence on litter decomposition and nutrient cycling in many cold ecosystems [10,11]. Notably, a reduction in snow depth directly decreases water availability due to the decreased snowmelt water supply [12]. Furthermore, some acid hydrolysable components in plant litter are water soluble and primarily released by leaching [13]; thereby, a decline in winter snow depth may directly decrease the release of acid hydrolysable components from decomposing litter materials [14]. Additionally, reduced snow cover has been demonstrated to reduce soil microbial biomass and extracellular enzymatic activity, and this effect could decrease the depolymerization of acid hydrolysable components during litter decomposition [15]. However, reduced snow cover also leads to more fluctuations of soil freezing and thawing [16], which can physically impact litter breakdown and therefore promote the release of acid hydrolysable components [17].
Here, we hypothesize that (1) the decline in snow depth decreases the release of acid hydrolysable components from plant litter, and (2) the formation, coverage and melting of winter snow cover alters the release of acid hydrolysable components. We conducted a litterbag experiment in a high-elevation alpine forest using four dominant tree litter species and measured the contents and release patterns of acid hydrolysable components during four years of decomposition from 2012 to 2016. Our objectives were as follows: (1) to follow the long-term release pattern of acid hydrolysable components, which have been thought to release rapidly during early periods of litter decomposition; and (2) to assess the potential influence of variations in snow depth and timing on the release of acid hydrolysable components in decomposing litter in this alpine forest.
2. Materials and Methods
2.1. Experimental Site
This study was conducted at the Long-term Research Station of Alpine Forest Ecosystems, Sichuan, China (31°14′ N, 102°53′ E, 3579–3582 m). The experimental sites are located in a primeval alpine forest on the eastern Tibetan Plateau and have been extensively described elsewhere [18]. The mean annual temperature and precipitation are 2.7 °C and 850 mm, respectively. Snow cover develops in late October and melts in April of the following year with a maximum snow depth of approximately 50 cm and a soil freezing time of approximately 120 days [19]. This alpine forest is dominated by coniferous fir (Abies faxoniana Rehd. et Wils.), cypress (Sabina saltuaria Rehder & E.H.Wilson), deciduous larch (Larix mastersiana Rehd. et Wils.) and birch (Betula albosinensis Burk.). Canopy gaps induced by natural tree fall and other climatic extremes cover 13–23% of the forest landscape. Soils are classified as Cambisols (WRB soil taxonomy) [20] and the litter depth (Oi/Oe) is 7 cm with a C stock of 1.6 t ha−1 in autumn (the peak of litter fall). The contents of C, nitrogen (N), phosphorus (P) and humic substances in the organic soils (Oa/A) are 16%, 0.58%, 0.17% and 6.1%, respectively [21].
2.2. Experimental Design
We used a 2 (snow depth) × 4 (litter species) factorial design in this study. Litter decay at different snow depths was facilitated by incubating litter samples in the canopy gap (deep snow plot) and under the canopy (shallow snow plot). The alternative to this strategy was to perform repeated manual shoveling to reduce snow cover, but this strategy increases the risk of losing needle litter (fir, cypress and larch) from litterbags, which must have sufficiently large mesh sizes to permit access by soil fauna [22]. To decrease the uncertainty among litter species, four dominant tree species (fir, cypress, larch and birch) with different initial qualities (Table 1) were studied. Specifically, three sites (as replicates, 500–2000 m apart) with similar topographies and canopy covers that receive similar snowfall and litter fall were set up in this alpine forest in 2009. Each site had two pairs of deep/shallow snow plots (n = 6), and each plot had four subplots (3 × 3 m in size and 3–4 m apart) for incubating the four foliar litters (a total of 24 subplots).

Table 1.
Initial chemical compounds in the four foliar litters.
To assess the effect of variation in winter snow timing on litter decomposition, samplings were scheduled at the ends of the snow formation, snow coverage and snowmelt stages during winter from 2012 to 2014. From 2014 to 2016, we collected samples only once each winter (at the end of the snowmelt stage). The beginning and end of winter were defined as having hourly temperatures with a 50% probability (continuous over 12 h per day) of freezing (below 0 °C; Table 2) [23]. The winter was further divided into snow formation, snow coverage and snowmelt stages based on the snow dynamics and changes in temperature according to our previous meteorological monitoring in this alpine forest (Figure 1) [18] and the experiments that were conducted in other cold biomes [24]. We also performed sampling at the end of the growing season (beginning of the snow formation stage) of each year.
Table 2.
Sampling comparison of the timing and length of winters during the four years of decomposition.
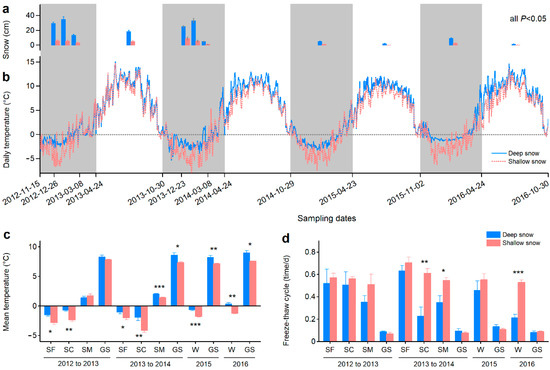
Figure 1.
Snow depth, temperature and freeze–thaw cycle. (a) Snow depths (±SE, n = 18) in deep and shallow snow plots on each sampling date. The samplings were scheduled at the ends of the snow formation, snow coverage and snowmelt stages during winter from 2012 to 2014 (only the snowmelt stages from 2014 to 2016) and at the end of the growing season (beginning of the snow formation stage). The differences between deep and shallow snow plots are significant (p < 0.05) on all sampling dates. (b) Daily temperatures (n = 6) at the litter surface during the four years of decomposition. Winter times including the snow formation, snow coverage and snowmelt stages are shaded. The dashed line is drawn at the zero value. (c) Mean temperatures (±SE, n = 6) at individual stages. The times between two adjacent sampling dates were defined as separate stages. (d) Freeze–thaw cycles (±SE, n = 6) at individual stages. The values were calculated by the quotients of the total number of freeze–thaw cycles and the number of days of certain stages. For panel c and d, the winters in 2015 and 2016 were not divided into snow formation, snow coverage and snowmelt stages. SF: snow formation stage, SC: snow coverage stage, SM: snowmelt stage, W: winter, and GS: growing season. * p < 0.05, ** p < 0.01 and *** p < 0.001.
2.3. Litterbag Experiment
Foliar litters of the four dominant trees species in this alpine forest were studied using an in situ litterbag method [22]. In the fall of 2012, senesced needles or leaves of each tree species were collected on tarpaulins from 20 or more trees (15–20 cm in diameter) by shaking their limbs. Green or partly decomposed needles (leaves), twigs and bark were removed, and only newly shed foliar litter was air-dried at room temperature for two weeks. Litter samples (10 ± 0.05 g) were placed into nylon litterbags (20 × 25 cm in size with mesh sizes of 1.0 mm on the top and 0.5 mm on the bottom). A total of 1172 litterbags (2 litterbags × 6 replicates × 4 litter species × 2 snow plots × 12 sampling times + 5 litterbags × 4 litter species) were incubated in the deep and shallow snow plots on November 15 and 16, 2012. Litterbags in the same subplots were strung together and kept 2–5 cm apart. Five litterbags of each litter species were randomly collected to determine the losses during sample establishment and the gravimetric water contents of these air-dried litter samples before field incubation.
2.4. Sampling and Analysis
On each sampling date, snow depths were manually measured in triplicate in each deep and shallow snow plot (n = 18). Temperatures at the litter surface were recorded using data loggers (iButton DS1923-F5, Sunnyvale, CA, USA) placed in marked litterbags in deep and shallow snow plots (both n = 6). Based on hourly temperature data, a freeze–thaw cycle was defined as a transition above or below 0 °C for at least 3 h and then a transition back [25].
Two litterbags per subplot were randomly collected, carefully placed in separate plastic bags and returned to the laboratory. Roots, mosses and soils were carefully removed from the litter samples. One cleaned subsample was oven-dried at 105 °C for 48 h to measure the dry mass remaining and gravimetric water content in the decomposing litter. The remaining mass of decomposing litter was evaluated on a dry matter basis. Another subsample was air-dried, milled and used to extract the acid hydrolysable components using an acid hydrolysis method [26]. In our long-term study in this alpine forest, we also measured proximate fractions, elements, humic substances and microbial activities during the decomposition of these foliar litters. In this study, we focused on the release pattern of acid hydrolysable components.
Here, the acid hydrolysable components were defined as the fraction that can be hydrolyzed by 2.5 mol/L H2SO4 [26]. These components were different with acid-soluble substances hydrolyzed by 72% H2SO4 as well as with dissolved organic carbon or hot-water extractable carbon, which are considered to be more labile with higher decomposability than acid hydrolysable components. In this study, the acid hydrolysable components include some polysaccharide, hemicellulose, cellulose and soluble lignin or phenols [6].
Specifically, a 0.10 g subsample was hydrolyzed by 2.5 mol/L H2SO4 at 105 °C for 30 min. The extracted acid hydrolysable components were diluted with deionized water, filtered through a 0.45 μm mesh and measured using a TOC analyzer (multi N/C 2100, Analytic Jena, Thüringen, Germany). Litter C and N contents were determined by elemental analyzer (Vario Max CN, Elementar, Germany) and were used to calculate litter C/N stoichiometry. Microbial biomass C content was measured using the chloroform fumigation-incubation method [27]. At the same time, a 0.5 g subsample was oven-dried at 105 °C for 48 h to determine the gravimetric water content in the air-dried decomposing litter. The content of acid hydrolysable components was calculated based on the dry mass of decomposing litter.
2.5. Data Analysis
The content of acid hydrolysable components (%) was presented as % of litter dry mass, and the remaining acid hydrolysable components (AHCr, % of original; Equation (1)) were calculated as follows:
where AHCC0 and AHCt are the initial content of acid hyrolysable components and their contents at time t (t = 1, 2, …, 12), respectively; and M0 and Mt are the initial litter dry mass and the masses at time t (t = 1, 2, …, 12).
AHCr(%) = (AHCt × Mt)/(AHC0 × M0) × 100
We first examined the overall effects of variations in snow depth and litter species over time via variance analysis (ANOVA). Differences between deep and shallow snow plots were assessed by paired t-tests, or by Wilcoxon signed-rank tests if sample sizes were unequal in MATLAB R2012a (MathWorks Inc., Natick, MA, USA). A path analysis was used to distinguish how variation in snow depth affects acid hydrolysable components during litter decomposition by altering the environment (litter temperature and gravimetric water content), litter quality (e.g., C/N ratio) and soil microbes (e.g., microbial biomass C; MBC) in AMOS 22.0 (IBM SPSS, Chicago, IL, USA). We also compared the relationships between litter mass remaining and the remaining acid hydrolysable components for each litter species.
3. Results
3.1. Snow Depth, Temperature and Freeze–Thaw Cycle
The snow depth in the shallow snow plot was 79% lower than that in the deep snow plot (Figure 1a). The snow depths were higher at the ends of the snow formation and snow coverage stages relative to those at the ends of the snowmelt stages in 2013 and 2014. The daily temperature was higher in the deep snow plot than that in the shallow snow plot, particularly during winter (Figure 1b). The mean temperatures at snow formation and snow coverage stages were below 0, but those at the snowmelt stages were above 0 during the winters in 2013 and 2014. The mean temperatures were significantly (p < 0.05) higher in the deep snow plots at all stages during the four years of decomposition, except those at the snowmelt stage and growing season in 2013 (Figure 1c).
The average freeze–thaw cycles in winters during the four years of decomposition were 0.41 and 0.57 times per day for the deep and shallow snow plots, respectively. For individual stages, the freeze–thaw cycles were significantly (p < 0.05) lower in the deep snow plots than those in the shallow snow plots at the snow coverage and snowmelt stages in 2014 as well as during the winter in 2016 (Figure 1d).
3.2. Mass Remaining
Litter mass remaining varied greatly among litter species (F = 35.9, p < 0.001) but did not differ between deep and shallow snow plots (F = 1.8, p = 0.25, Table 3) over time. After four years of decomposition, 53%, 66%, 58% and 61% of litter mass were lost at the deep snow plots, respectively, and 55%, 65%, 55% and 60% of litter mass were lost at the shallow snow plots for fir, cypress, larch and birch litter, respectively (Figure 2).
Table 3.
Results of repeated measures ANOVA testing for the effects of litter species and variation in snow depth over time.
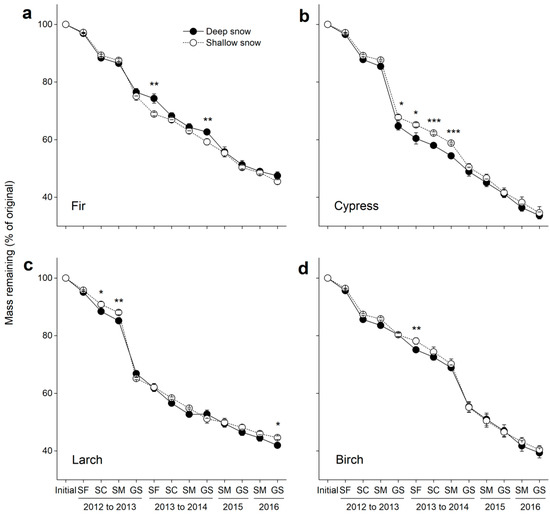
Figure 2.
Mass remaining in decomposing litter in the deep and shallow snow plots. (a) Fir, (b) cypress, (c) larch, and (d) birch. SF: snow formation stage, SC: snow coverage stage, SM: snowmelt stage, and GS: growing season. * p < 0.05, ** p < 0.01 and *** p < 0.001.
3.3. Gravimetric Water Content
The initial gravimetric water contents in the fir, cypress, larch and birch litters were 8%, 9%, 10% and 13%, respectively, but varied greatly over time (F = 775.7, p < 0.001; Table 3). The gravimetric water content in all the foliar litters showed an increasing tendency in 2013 but greatly decreased at the snow formation and snow coverage stages in 2014 (Figure 3). For all the litter species, the gravimetric water content notably increased in 2016 to 40%, 30%, 23% and 24%, respectively, in the deep snow plots after four years of decomposition. The variation in snow depth significantly (F = 13.7, p < 0.001; Table 3) changed the gravimetric water content in the decomposing litter, and higher (p < 0.05) gravimetric water contents were observed in deep snow plots for all litter species (Figure 3a–d).
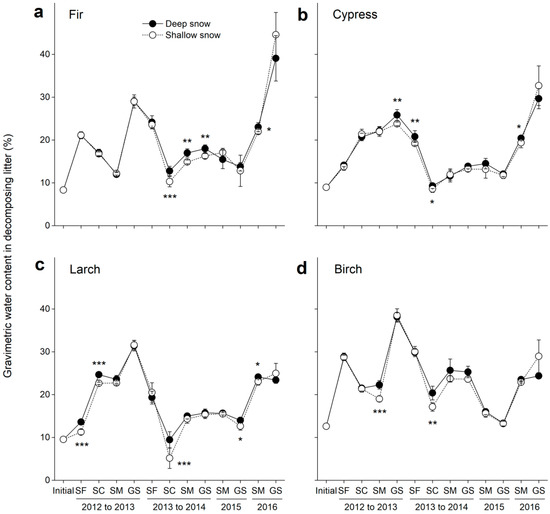
Figure 3.
Gravimetric water contents (±SE, n = 6) in decomposing litter in the deep and shallow snow plots. (a) Fir, (b) cypress, (c) larch, and (d) birch. SF: snow formation stage, SC: snow coverage stage, SM: snowmelt stage, and GS: growing season. * p < 0.05, ** p < 0.01 and *** p < 0.001.
3.4. Content of Acid Hydrolysable Components
The initial contents of the acid hydrolysable components were 19%, 19%, 21% and 16% for the fir, cypress, larch and birch litters, respectively (Figure 4a–d). The content of acid hydrolysable components significantly (F = 274.1, p < 0.001; Table 3) changed over time, but this change did not differ among the litter species (F = 1.5, p = 0.23). During the four years of decomposition, the content of the acid hydrolysable components greatly decreased at the snow formation stage in 2012 and the growing season in 2016. The contents of the acid hydrolysable components also decreased during the growing season in 2013 to the snow coverage stage in 2014, as well as at the snowmelt stage and growing season in 2015. However, the content of acid hydrolysable components increased at both the snow coverage and snowmelt stages in 2013, while only at the snowmelt stages in 2014 and 2016 for all litter species. After four years of decomposition, the content of the acid hydrolysable components was only 1.8–2.7% in the deep snow plots across the litter species.
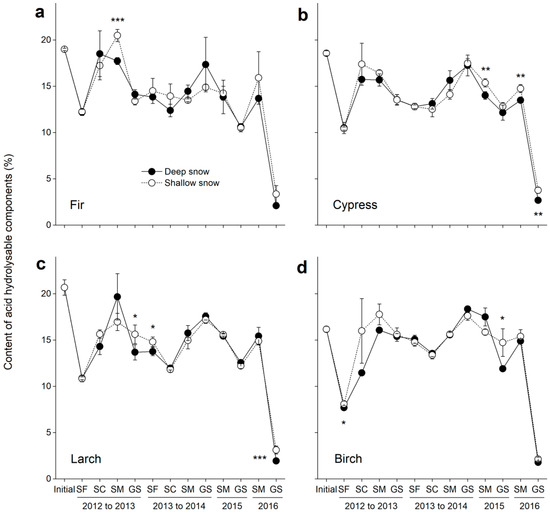
Figure 4.
Contents of acid hydrolysable components (±SE, n = 6) in decomposing litter in the deep and shallow snow plots. (a) Fir, (b) cypress, (c) larch, and (d) birch. SF: snow formation stage, SC: snow coverage stage, SM: snowmelt stage, and GS: growing season. * p < 0.05, ** p < 0.01 and *** p < 0.001.
Overall, the variation in snow depth did not significantly (F = 3.0, p = 0.083; Table 3) change the content of the acid hydrolysable components for the decomposing litter across species. However, for individual litter species, the effect of variation in snow depth on the content of acid hydrolysable components was greater for birch litter (F = 6.0, p = 0.016) compared with those for other foliar litters (p > 0.05; Table 4). During the four years of decomposition, the contents of the acid hydrolysable components were significantly higher (p < 0.05) in shallow snow plots than those in deep snow plots for all litter species at certain stages. At the end of the experiment, higher (p < 0.01) contents of acid hydrolysable components were also observed in the shallow snow plots for cypress and larch litters.
Table 4.
Results of repeated measures ANOVA testing for the effects of variation in snow depth over time for each litter species.
The path analysis results showed that snow depth was positively (p < 0.001; Figure 5) correlated with litter temperature (r = 0.38), gravimetric water content (r = 0.18) and MBC (r = 0.43) but negatively (r = −0.21, p < 0.001) correlated with the litter C/N ratio. The litter temperature and gravimetric water content did not have significant effects on either the C/N ratio or MBC (all p > 0.05), but both were negatively correlated with the content of acid hydrolysable components (r = −0.11, p < 0.01 for litter temperature and r = −0.25, p < 0.001 for gravimetric water content). The litter C/N ratio and MBC had, respectively, negative (r = −0.34) and positive (r = 0.15; both p < 0.001) effects on the content of the acid hydrolysable components.
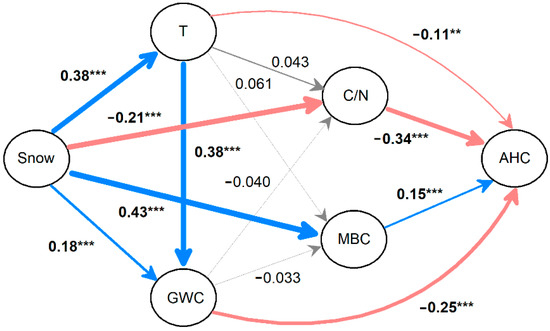
Figure 5.
Path analysis shows direct and indirect effects of the variation in snow depth on the release of acid hydrolysable components. The color (blue: positive, and red: negative) and gray arrows denote significant and non-significant effects, respectively. The widths of the arrows and associated numbers (standard regression weights) represent the strength of the path coefficients, and the bold coefficients with asterisks are significant (** p < 0.01 and *** p < 0.001). T: temperature, GWC: gravimetric water content, C/N: carbon to nitrogen ratio, MBC: microbial biomass carbon, and AHC: acid hydrolysable components. n = 576, R2 = 0.531, p < 0.001 for the model.
3.5. Remaining Acid Hydrolysable Components
Overall, the remaining acid hydrolysable components consistently decreased over time (F = 333.7, p < 0.001; Table 3), and marked declines were found at the snow formation stage in 2012 and during the growing seasons in 2012 and 2016 for all litter species. However, the remaining acid hydrolysable components increased during the snow coverage and snowmelt stages in 2013 as well as the snowmelt stages in 2014 and 2016 (Figure 6a–d). After four years of decomposition, the remaining acid hydrolysable components were only 4–5% across the litter species.

Figure 6.
Remaining acid hydrolysable components (±SE, n = 6) in decomposing litter in the deep and shallow snow plots. (a) Fir, (b) cypress, (c) larch, and (d) birch. SF: snow formation stage, SC: snow coverage stage, SM: snowmelt stage, and GS: growing season. * p < 0.05, ** p < 0.01 and *** p < 0.001.
The variation in snow depth had a significant (F = 6.8, p = 0.0094; Table 3) effect on the remaining acid hydrolysable components across litter species, and these effects were greater for cypress (F = 6.6, p = 0.011; Table 4) and birch litters (F = 6.4, p = 0.013) compared with fir and larch litters (both p > 0.05). During the four years of decomposition, the remaining acid hydrolysable components were significantly higher (p < 0.05) in shallow snow plots than those in deep snow plots for all litter species at certain stages. At the end of the experiment, higher (p < 0.001) remaining acid hydrolysable components were also observed in the shallow snow plot for larch litter (Figure 5c). The remaining acid hydrolysable components in the decomposing litter were significantly correlated with the remaining litter mass for all litter species (all p < 0.001; Figure 7).
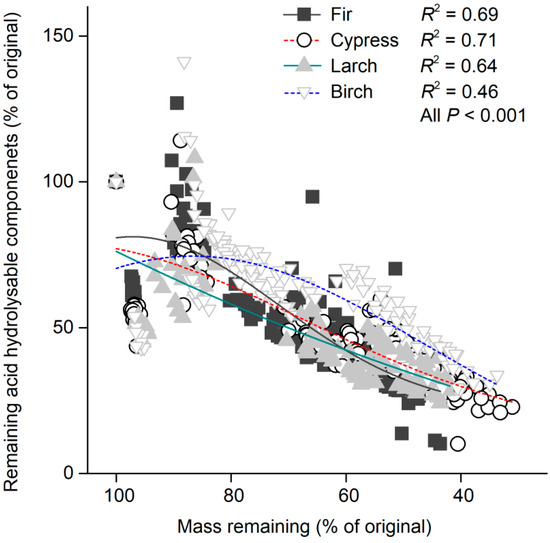
Figure 7.
Remaining litter mass versus acid hydrolysable components for each litter species. Adjusted R2 values from Gaussian functions are shown for each litter species, and all p < 0.001 (n = 144 for each litter species).
4. Discussion
Different components with hierarchical decomposability have been widely used to assess chemical changes during litter decomposition [6]. Labile components are highly decomposable, but a clear boundary is absent in soil organic matter studies and Earth system models [1]. Dissolved organic C has been considered as a labile component and is rich in fresh plant litter [4]. In this study, the initial contents of water-soluble substances (extracted at 80 °C for 1 h) were 24%, 14%, 30% and 10%, respectively, for fresh fir, cypress, larch and birch litters (Table 1). However, the initial contents of acid hydrolysable components were only 19%, 19%, 21% and 16% for fresh fir, cypress, larch and birch litters, respectively, which were similar with the content of water-soluble substances but lower than the contents of acid-soluble substances (extracted with 72% H2SO4) (Table 1). These results suggest that the acid hydrolysable components under the conditions of this study (extracted by 2.5 mol/L H2SO4) are just parts of the soluble components that can be dissolved in hot water.
Acid hydrolysable components have been thought to release during the early or intermediate periods of litter decomposition in both field and laboratory experiments [4,28], and this hierarchical pattern of decomposability is similar with dissolved organic C [1]. For example, in a 13C tracer experiment, Kammer et al. [3] found that approximately 80% of the annual dissolved organic C was leached from the litter layer during the first winter of decomposition after litter fall. Our results showed that 38%–55% of acid hydrolysable components were released during the first 41 days, suggesting that the acid hydrolysable components are highly soluble and release rapidly. However, another peak for the release of acid hydrolysable components was observed in the fourth year of decomposition, possibly due to the large increase in litter water content (Figure 3). These results suggest that the acid hydrolysable components are different with dissolved organic C and could be released at a later period than previously expected. In addition, a significant release of acid hydrolysable components occurred during the growing season of the first year of decomposition. These releases were in accordance with the increase in gravimetric water content in the decomposing litter, implying that water content may be the dominant driver for the release of acid hydrolysable components. The path analysis results also indicated that gravimetric water content had a strong effect on the release of acid hydrolysable components (Figure 5), suggesting that hydrological leaching strongly controls the release of these labile components during litter decomposition.
However, we also found that a high level of acid hydrolysable components was maintained over a long term after a rapid release and even increased during snowmelt (Figure 6). Several reasons can explain the high level of acid hydrolysable components during litter decomposition, particularly during snowmelt. First, some acid hydrolysable are intermediate decomposable carbohydrates [2], and these components were decomposed to smaller carbohydrates [6], increasing the proportion of acid hydrolysable components measured under the conditions of this study. Our previous studies also found that cellulose content greatly decreased during the snow coverage and snowmelt stages in the first year of decomposition at these sites [29]. Moreover, we found that repeated soil freezing and thawing during winter strongly contributes to C decay during litter decomposition in this alpine forest [19]. In addition, earlier studies found that cold-tolerant microbes maintain high activities at temperatures above −4 °C [30] but die during snowmelt due to C starvation over winter and their inability to adapt to an increase in ambient temperature [31]. Our previous research conducted in this alpine forest also found that the microbial biomass was higher during snow cover than that during snowmelt [32], suggesting that dead microbial necromass (i.e., glucosamine and muramic acid) may contribute to the increase in acid hydrolysable components during snowmelt. Our results suggest that acid hydrolysable components do not consistently decrease as decomposition proceeds, and winter snow exerts an important influence on these labile components in plant litter during snow formation, snow coverage and snowmelt in this alpine forest.
Reduced snow cover increases soil freezing (Figure 1d) [16] and alters soil microbial processes in cold areas [33,34]. In this study, a reduction in snow depth decreased the gravimetric water content, which had a negative effect (r = −0.25, p < 0.001) on the content of acid hydrolysable components, and this effect was greater than that from the change in temperature driven by the shift in snow depth (r = −0.11, p < 0.01). These results indicated that a decline in winter snow cover may primarily reduce leaching and, thus, decrease the release of acid hydrolysable components from plant litter [4]. A reduction in snow cover has also been demonstrated to strongly decrease the microbial biomass [35], which was positively correlated with the content of acid hydrolysable components. This result suggests that microorganisms can either degrade the intermediate decomposable compounds from plant-derived carbohydrates [36] or contribute the dead biomass to microbial-derived fractions [37] that can be measured by acid hydrolysis.
5. Conclusions
The acid hydrolysable components released rapidly at the initial stages of decomposition as well as at later periods. However, these labile components greatly increased during snowmelt. Only 4–5% of the acid hydrolysable components remained in litter after four years of decomposition in this alpine forest. A reduction in snow depth decreased the release of acid hydrolysable components from plant litter by altering leaching, microbial biomass and stoichiometry.
Author Contributions
X.N. and F.W. conceived the study; S.L., X.N. and K.Y. performed the field experiment and chemical analysis; S.L. wrote the first draft. All authors contributed critically to the drafts and revisions. All authors have read and agreed to the published version of the manuscript.
Funding
The National Natural Science Foundation of China (32101509, 32022056 and 32171641).
Institutional Review Board Statement
Not applicable.
Informed Consent Statement
Not applicable.
Data Availability Statement
The data are included in the manuscript submitted for peer review and will be archived online as supplementary materials of the manuscript is accepted for publication.
Conflicts of Interest
The authors declare no conflict of interest.
References
- Adair, E.C.; Parton, W.J.; Grosso, S.J.D.; Silver, W.L.; Harmon, M.E.; Hall, S.A.; Burke, I.C.; Hart, S.C. Simple three-pool model accurately describes patterns of long-term litter decomposition in diverse climates. Glob. Chang. Biol. 2008, 14, 2636–2660. [Google Scholar] [CrossRef]
- Berg, B. Decomposition patterns for foliar litter—A theory for influencing factors. Soil Biol. Biochem. 2014, 78, 222–232. [Google Scholar] [CrossRef]
- Kammer, A.; Schmidt, M.W.I.; Hagedorn, F. Decomposition pathways of 13C-depleted leaf litter in forest soils of the Swiss Jura. Biogeochemistry 2012, 108, 395–411. [Google Scholar] [CrossRef][Green Version]
- Soong, J.L.; Parton, W.J.; Calderon, F.; Campbell, E.E.; Cotrufo, M.F. A new conceptual model on the fate and controls of fresh and pyrolized plant litter decomposition. Biogeochemistry 2015, 124, 27–44. [Google Scholar] [CrossRef]
- Schimel, J.P.; Schaeffer, S.M. Microbial control over carbon cycling in soil. Front. Microbiol. 2012, 3, 348. [Google Scholar] [CrossRef]
- Preston, C.M.; Nault, J.R.; Trofymow, J.A.; Smyth, C.; CIDET Working Group. Chemical changes during 6 years of decomposition of 11 litters in some Canadian forest sites. part 1. elemental composition, tannins, phenolics, and proximate fractions. Ecosystems 2009, 12, 1053–1077. [Google Scholar] [CrossRef]
- Campbell, E.E.; Parton, W.J.; Soong, J.L.; Paustian, K.; Hobbs, N.T.; Cotrufo, M.F. Using litter chemistry controls on microbial processes to partition litter carbon fluxes with the Litter Decomposition and Leaching (LIDEL) model. Soil Biol. Biochem. 2016, 100, 160–174. [Google Scholar] [CrossRef]
- Schimel, J.; Balser, T.C.; Wallenstein, M. Microbial stress-response physiology and its implications for ecosystem function. Ecology 2007, 88, 1386–1394. [Google Scholar] [CrossRef]
- IPCC. Summary for Policymakers. In Climate Change 2020: The Physical Science Basis; Cambridge University Press: New York, NY, USA, 2021. [Google Scholar]
- Baptist, F.; Yoccoz, N.G.; Choler, P. Direct and indirect control by snow cover over decomposition in alpine tundra along a snowmelt gradient. Plant Soil. 2010, 328, 397–410. [Google Scholar] [CrossRef]
- Aerts, R.; Callaghan, T.V.; Dorrepaal, E.; Van Logtestijn, R.S.P.; Cornelissen, J.H.C. Seasonal climate manipulations have only minor effects on litter decomposition rates and N dynamics but strong effects on litter P dynamics of sub-arctic bog species. Oecologia 2012, 170, 809–819. [Google Scholar] [CrossRef]
- Brooks, P.D.; Grogan, P.; Templer, P.H.; Groffman, P.; Öquist, M.G.; Schimel, J. Carbon and nitrogen cycling in snow-covered environments. Geogr. Comp. 2011, 5, 682–699. [Google Scholar] [CrossRef]
- Neff, J.C.; Asner, G.P. Dissolved organic carbon in terrestrial ecosystems: Synthesis and a model. Ecosystems 2001, 4, 29–48. [Google Scholar] [CrossRef]
- Edwards, A.C.; Scalenghe, R.; Freppaz, M. Changes in the seasonal snow cover of alpine regions and its effect on soil processes: A review. Quatern. Int. 2007, 162, 172–181. [Google Scholar] [CrossRef]
- Kreyling, J.; Haei, M.; Laudon, H. Snow removal reduces annual cellulose decomposition in a riparian boreal forest. Can. J. Soil Sci. 2013, 93, 427–433. [Google Scholar] [CrossRef]
- Groffman, P.M.; Driscoll, C.T.; Fahey, T.J.; Hardy, J.P.; Fitzhugh, R.; Tierney, G.L. Colder soils in a warmer world: A snow manipulation study in a northern hardwood forest ecosystem. Biogeochemistry 2001, 56, 135–150. [Google Scholar] [CrossRef]
- Matzner, E.; Borken, W. Do freeze-thaw events enhance C and N losses from soils of different ecosystems? A review. Eur. J. Soil Sci. 2008, 59, 274–284. [Google Scholar] [CrossRef]
- Ni, X.; Yang, W.; Li, H.; Xu, L.; He, J.; Tan, B.; Wu, F. The responses of early foliar litter humification to reduced snow cover during winter in an alpine forest. Can. J. Soil Sci. 2014, 94, 453–461. [Google Scholar] [CrossRef]
- Wu, F.; Peng, C.; Zhu, J.; Zhang, J.; Tan, B.; Yang, W. Impacts of freezing and thawing dynamics on foliar litter carbon release in alpine/subalpine forests along an altitudinal gradient in the eastern Tibetan Plateau. Biogeosciences 2014, 11, 6471–6481. [Google Scholar]
- IUSS Working Group WRB. World Reference Base for Soil Resources 2014; FAO: Rome, Italy, 2015.
- Ni, X.; Yang, W.; Tan, B.; He, J.; Xu, L.; Li, H.; Wu, F. Accelerated foliar litter humification in forest gaps: Dual feedbacks of carbon sequestration during winter and the growing season in an alpine forest. Geoderma 2015, 241, 136–144. [Google Scholar] [CrossRef]
- Bradford, M.A.; Tordoff, G.M.; Eggers, T.; Jones, T.H.; Newington, J.E. Microbiota, fauna, and mesh size interactions in litter decomposition. Oikos 2002, 99, 317–323. [Google Scholar] [CrossRef]
- Ladwig, L.M.; Ratajczak, Z.R.; Ocheltree, T.W.; Hafich, K.A.; Churchill, A.C.; Frey, S.J.K.; Fuss, C.B.; Kazanski, C.E.; Muñoz, J.D.; Petrie, M.D.; et al. Beyond arctic and alpine: The influence of winter climate on temperate ecosystems. Ecology. 2016, 97, 272–283. [Google Scholar] [CrossRef] [PubMed]
- Olsson, P.Q.; Sturm, M.; Racine, C.H.; Romanovsky, V.; Liston, G.E. Five stages of the Alaskan arctic cold season with ecosystem implications. Arc. Ant. Alp. Res. 2003, 35, 74–81. [Google Scholar] [CrossRef]
- Konestabo, H.S.; Michelsen, A.; Holmstrup, M. Responses of springtail and mite populations to prolonged periods of soil freeze-thaw cycles in a sub-arctic ecosystem. Appl. Soil Ecol. 2007, 36, 136–146. [Google Scholar] [CrossRef]
- Rovira, P.; Vallejo, V.R. Labile and recalcitrant pools of carbon and nitrogen in organic matter decomposition at different depths in soil: An acid hydrolysis approach. Geoderma 2002, 107, 109–141. [Google Scholar] [CrossRef]
- Jenkinson, D.S.; Powlson, D.S. The effects of biocidal treatments on metabolism in soil V. A method for measuring soil biomass. Soil Biol. Biochem. 1976, 8, 209–213. [Google Scholar] [CrossRef]
- Cotrufo, M.F.; Soong, J.L.; Horton, A.J.; Campbell, E.E.; Haddix, M.L.; Wall, D.H.; Parton, W.J. Formation of soil organic matter via biochemical and physical pathways of litter mass loss. Nat. Geosci. 2015, 8, 776–779. [Google Scholar] [CrossRef]
- Li, H.; Wu, F.; Yang, W.; Xu, L.; Ni, X.; He, J.; Tan, B.; Hu, Y. Effects of forest gaps on litter lignin and cellulose dynamics vary seasonally in an alpine forest. Forests. 2016, 7, 27. [Google Scholar] [CrossRef]
- Schmidt, S.K.; Lipson, D.A. Microbial growth under the snow: Implications for nutrient and allelochemical availability in temperate soils. Plant Soil 2004, 259, 1–7. [Google Scholar] [CrossRef]
- Lipson, D.A.; Schmidt, S.K.; Monson, R.K. Carbon availability and temperature control the post-snowmelt decline in alpine soil microbial biomass. Soil Biol. Biochem. 2004, 32, 441–448. [Google Scholar] [CrossRef]
- Yang, Y.; Wu, F.; He, Z.; Xu, Z.; Liu, Y.; Yang, W.; Tan, B. Effects of snow pack removal on soil microbial biomass carbon and nitrogen and the number of soil culturable microorganisms during wintertime in alpine Abies faxoniana forest of western Sichuan, Southwest China. Chin. J. Appl. Ecol. 2012, 23, 1809–1816, (In Chinese with English abstract). [Google Scholar]
- Monson, R.K.; Lipson, D.L.; Burns, S.P.; Turnipseed, A.A.; Delany, A.C.; Williams, M.W.; Schmidt, S.K. Winter forest soil respiration controlled by climate and microbial community composition. Nature 2006, 439, 711–714. [Google Scholar] [CrossRef] [PubMed]
- Sorensen, P.O.; Templer, P.H.; Christenson, L.; Duran, J.; Fahey, T.; Fisk, M.C.; Groffman, P.M.; Morse, J.L.; Finzi, A.C. Reduced snow cover alters root-microbe interactions and decreases nitrification rates in an northern hardwood forest. Ecology 2016, 97, 3359–3368. [Google Scholar] [CrossRef] [PubMed]
- Sorensen, P.O.; Templer, P.H.; Finzi, A.C. Contrasting effects of winter snowpack and soil frost on growing season microbial biomass and enzyme activity in two mixed-hardwood forests. Biogeochemistry 2016, 128, 141–154. [Google Scholar] [CrossRef]
- Kaiser, K.; Kalbitz, K. Cycling downwards—dissolved organic matter in soils. Soil Biol. Biochem. 2012, 52, 29–32. [Google Scholar] [CrossRef]
- Ni, X.; Liao, S.; Tan, S.; Wang, D.; Peng, Y.; Yue, K.; Wu, F.; Yang, Y. A quantitative assessment of amino sugars in soil profiles. Soil Biol. Biochem. 2020, 143, 107762. [Google Scholar] [CrossRef]
Publisher’s Note: MDPI stays neutral with regard to jurisdictional claims in published maps and institutional affiliations. |
© 2022 by the authors. Licensee MDPI, Basel, Switzerland. This article is an open access article distributed under the terms and conditions of the Creative Commons Attribution (CC BY) license (https://creativecommons.org/licenses/by/4.0/).