Article

Generalists and Specialists Determine the Trend and Rate of Soil Fungal Distance Decay of Similarity in a 20-ha Subtropical Forest

by
Pachchara Chaithaisong
1,2,
Mark Jun M. Alcantara
1,2,
Liang Song
1,3 and
Yue-Hua Hu
1,*
1
CAS Key Laboratory of Tropical Forest Ecology, Xishuangbanna Tropical Botanical Garden, Chinese Academy of Sciences, Menglun, Mengla 666303, China
2
University of Chinese Academy of Sciences, Beijing 100049, China
3
Center of Plant Ecology, Core Botanical Gardens, Chinese Academy of Sciences, Mengla 666303, China
*
Author to whom correspondence should be addressed.
Forests 2022, 13(8), 1188; https://doi.org/10.3390/f13081188
Submission received: 9 June 2022 / Revised: 14 July 2022 / Accepted: 22 July 2022 / Published: 27 July 2022
(This article belongs to the Section Forest Soil)

Abstract

:
Fungi are an important component of microbial communities that serve a variety of important roles in nutrient cycling and are essential for plant nutrient uptake in forest soils. Distance decay of similarity (DDS) is one of the few ubiquitous phenomena in community ecology. However, the contribution of specialist and generalist fungal species in shaping DDS remains poorly investigated. Through removing operational taxonomic units (OTU) with low or high frequencies, we rigorously quantified the impact of specialists or generalists on the change in slope, initial similarity, and halving distance of DDS of undefined saprotroph, plant mutualist, and plant putative pathogen communities in a 20-ha subtropical evergreen forest plot in Yunnan Province, Southwest China. We hypothesized that (1) the soil fungal co-occurrence networks are different between the three fungal guilds; (2) specialists and generalists contribute to the spatial turnover and nestedness of beta diversity, respectively; and (3) the removal of specialists or generalists will have opposite effects on the change of slope, initial similarity, and halving distance of DDS. Co-occurrence network analysis showed that the undefined saprotroph network had a much more complicated structure than mutualist and pathogen networks. Ascomycota and Basidiomycota were the two most abundant phyla in soil fungal communities. We found that partly in line with our expectations, the change in initial similarity increased and decreased when removing specialists and generalists, respectively, but there was always one exception guild of out of the three communities for the change in slope and halving distance. We identified that such change was mainly due to the change in turnover and nestedness of beta diversity. Furthermore, the results show that species turnover rather than species nestedness drove fungal beta diversity across functional guilds for both specialists and generalists.

1. Introduction

Distance decay of similarity (DDS) is widely observed in various organisms [1] and has long been recognized as “the first law of geography” [2]. A pattern of DDS in a community is the consequence of joint effects of dispersal, selection, drift, and diversification [3]. Numerous studies have been implemented to unravel the relative importance of assembly processes through investigating DDS at various scales [4,5,6,7]. Recently, community assembly studies showed that the mechanisms underlying the distribution of generalists and specialists differ from each other [8,9,10]. However, the effect of generalist and specialist species on DDS has been rarely investigated, especially for microbial communities.
How generalist and specialist species alter DDS relationships has mixed evidence, potentially due to the little related research. A theoretical study showed that specialists have relatively weak impacts on DDS compared to those of generalists [11]. On the contrary, Oono et al. [12] demonstrated that the DDS pattern of specialists was more similar to the DDS of whole foliar fungal endophytes than that by generalists. Zinger et al. [13] found a significant association between the removal of specialists and the change in DDS slope. However, abundance might not reflect species spatial distribution directly, especially for sequencing data that are compositional [14]. Thus, more knowledge about the underlying biogeographic patterns governing fungal community composition is required to support future predictions of ecosystem functioning [15].
The fungal kingdom is one of the most diverse groups on Earth [16] and accounts for a substantial proportion of the genetic diversity in the biosphere on Earth [17]. It plays a variety of crucial roles in maintaining species coexistence [18], nutrient cycling [19,20], and facilitating nutrient uptake by plants in terrestrial ecosystems. Co-occurrence network analysis has been widely used to study microbial interaction patterns [21]. Recently, this method, combined with next-generation sequencing, has been employed to explore the structure and assembly of complex fungal communities in forest soils [22]. Communities of fungi associated with plants can vary in composition or function when environments change, which has implications for fungal contributions to plant resilience [23]. A previous study suggested that geographic distance is a better predictor of fungal community distribution [24]. Understanding soil fungi fine-scale spatial distribution patterns may add to understanding community assembly mechanisms in soil microbes.
The fungal kingdom consists of diversified functional guilds [25] exhibiting different growth strategies and nutrient-acquisition capabilities [26]. Peay et al. [17] reported that the latitudinal gradient modes of several typical fungal guilds were significantly different from each other. The relative contribution of vegetation, soil, space, and climate varies across the guilds and account for variation in patterns [16]. However, the contribution of assembly processes is scale dependent [27]. Schröter et al. [28] clearly showed that the relative importance of assembly processes in driving fungal trophic guilds in the root mycobiome shifted from large scale to local scale. The community of specialist and generalist fungi in orchard soil was dominated by deterministic and stochastic processes, respectively [29]. Moreover, Jiao and Lu [30] found that the generalist fungal community was dominated by the stochastic process. In contrast, deterministic process primarily governs specialist fungal communities in agricultural soils. Therefore, how specialists and generalists influence DDS across different fungal guilds needs to be clarified at local scales.
To address the effects of specialists and generalists on DDS of multiple fungal guilds, soil samples were collected from a subtropical evergreen forest in Southwest China. Specifically, the following questions were addressed: (1) Are the soil fungal co-occurrence networks different between the three fungal guilds? (2) Which fungal taxa (specialists or generalists) contribute more to the DDS slope, initial similarity, and halving distance within each of the three fungal guilds? (3) How does specialists and generalists influence the nestedness and turnover beta diversity components within each of the three fungal guilds?

2. Materials and Methods

2.1. Study Site

This study was carried out in the 20 ha (500 m × 400 m) mid-mountain moist evergreen broadleaved forest plot in the Ailaoshan National Nature Reserve (24°32′ N, 101°01′ E), central Yunnan Province, Southwest China (Figure 1). The elevation of the plot ranges from 2472 to 2628 m above sea level. The vegetation type is subtropical evergreen broadleaved forest, dominated by the subtropical oak species Lithocarpus hancei, L. xylocarpus, Castanopsis wattii, and Schima noronhae [31]. The climate is a typical monsoon climate, with a 1931 mm mean annual precipitation, 85% of which falls from May to October [32]. The mean monthly temperature is 11.3 °C, ranging from 5.7 °C in January to 15.6 °C in July [33]. The soil is classified as an alfisol [34].

2.2. Collection of Soil Fungal Samples

Soil samples were collected over a regular grid of points with 50 m in between in the 20 ha plot (Figure 1). Each grid point was paired with three additional sample points at any random selected distances out of 0.5 m, 2.5 m, 5 m, 10 m, 15 m, and 24.9 m in three random compass directions from the grid to capture variation in soil fungal composition at finer scales. For each sample, topsoil was collected from a depth between 0 and 10 cm. The soil included fine roots and comprised both the organic layer and top mineral soil. A total of 396 soil samples was taken in June 2017. The samples were collected in plastic bags and immediately transported to the laboratory on ice for analysis. All samples were stored at −80 °C prior to fungal DNA extraction. Soil fungal DNA were extracted using the MoBio PowerSoil™ DNA Isolation Kits (Bio Mio Lab Inc., Solana Beach, CA, USA) following the manufacturer’s instructions.

2.3. Sequencing and Sequence Data Processing

The soil samples were sequenced for fungal ITS2 region. The sequencing libraries were constructed using a previously described process [35], replacing the 16S specific primers with primers targeting fungal ITS2 region. Sequencing was conducted on the MiSeq platform in the University of Minnesota Genomic Center.
Read1 and Read2 sequencing data were processed using the FAST pipeline (https://github.com/ZeweiSong/FAST/, accessed on 31 January 2019), following the protocol using both reads for ITS2 (https://github.com/ZeweiSong/FAST/wiki/Fungal-ITS2-Pipeline-Using-Both-Reads, accessed on 31 January 2019). Illumina sequencing primers were first removed using cutadapt [36] and then merged using PEAR v0.9.8 [37]. In order to align with the UNITE database, we trimmed a 60 bp tail from all sequences. These 60 bp tails were trimmed in UNITE based on our own test using ITSx [38]. Sequences with ambiguous bases or homopolymers longer than nine bases were removed and sequences with a maximum error rate > 1 were discarded. The sequences passing these quality-filtering steps were then clustered using NINJA-OPS (Knights Lab, Minneapolis, MN, USA) [39] with a similarity of 0.97. The resulting compositional data were randomly sampled to 10,000 sequence reads per sample. This was achieved using an iterative sampling process procedure in FAST, in which each sample was randomly sampled for 1000 times, and the draw closest to medium OTU richness was picked.

2.4. Soil Fungal Classification

Each fungal OTU was assigned to a functional guild using FUNGuild [25] to examine whether fungal functional guilds differed among soil fungal communities. FUNGuild v1.0 is a database hosted by Github (https://github.com/UMNFuN/FUNGuild, accessed on 30 May 2019). The database currently contains a total of 9476 entries, with 66% at the genus level and 34% at the species level. Only OTUs with a confidence ranking of “highly probable” or “probable” were retained in our analysis as per Cregger and Veach [40]. We classified our entries into three broad functional groupings referred to as trophic modes: pathotroph (i.e., plant pathogens), symbiotroph (i.e., mutualist), and saprotroph [16].

2.5. Data Analysis

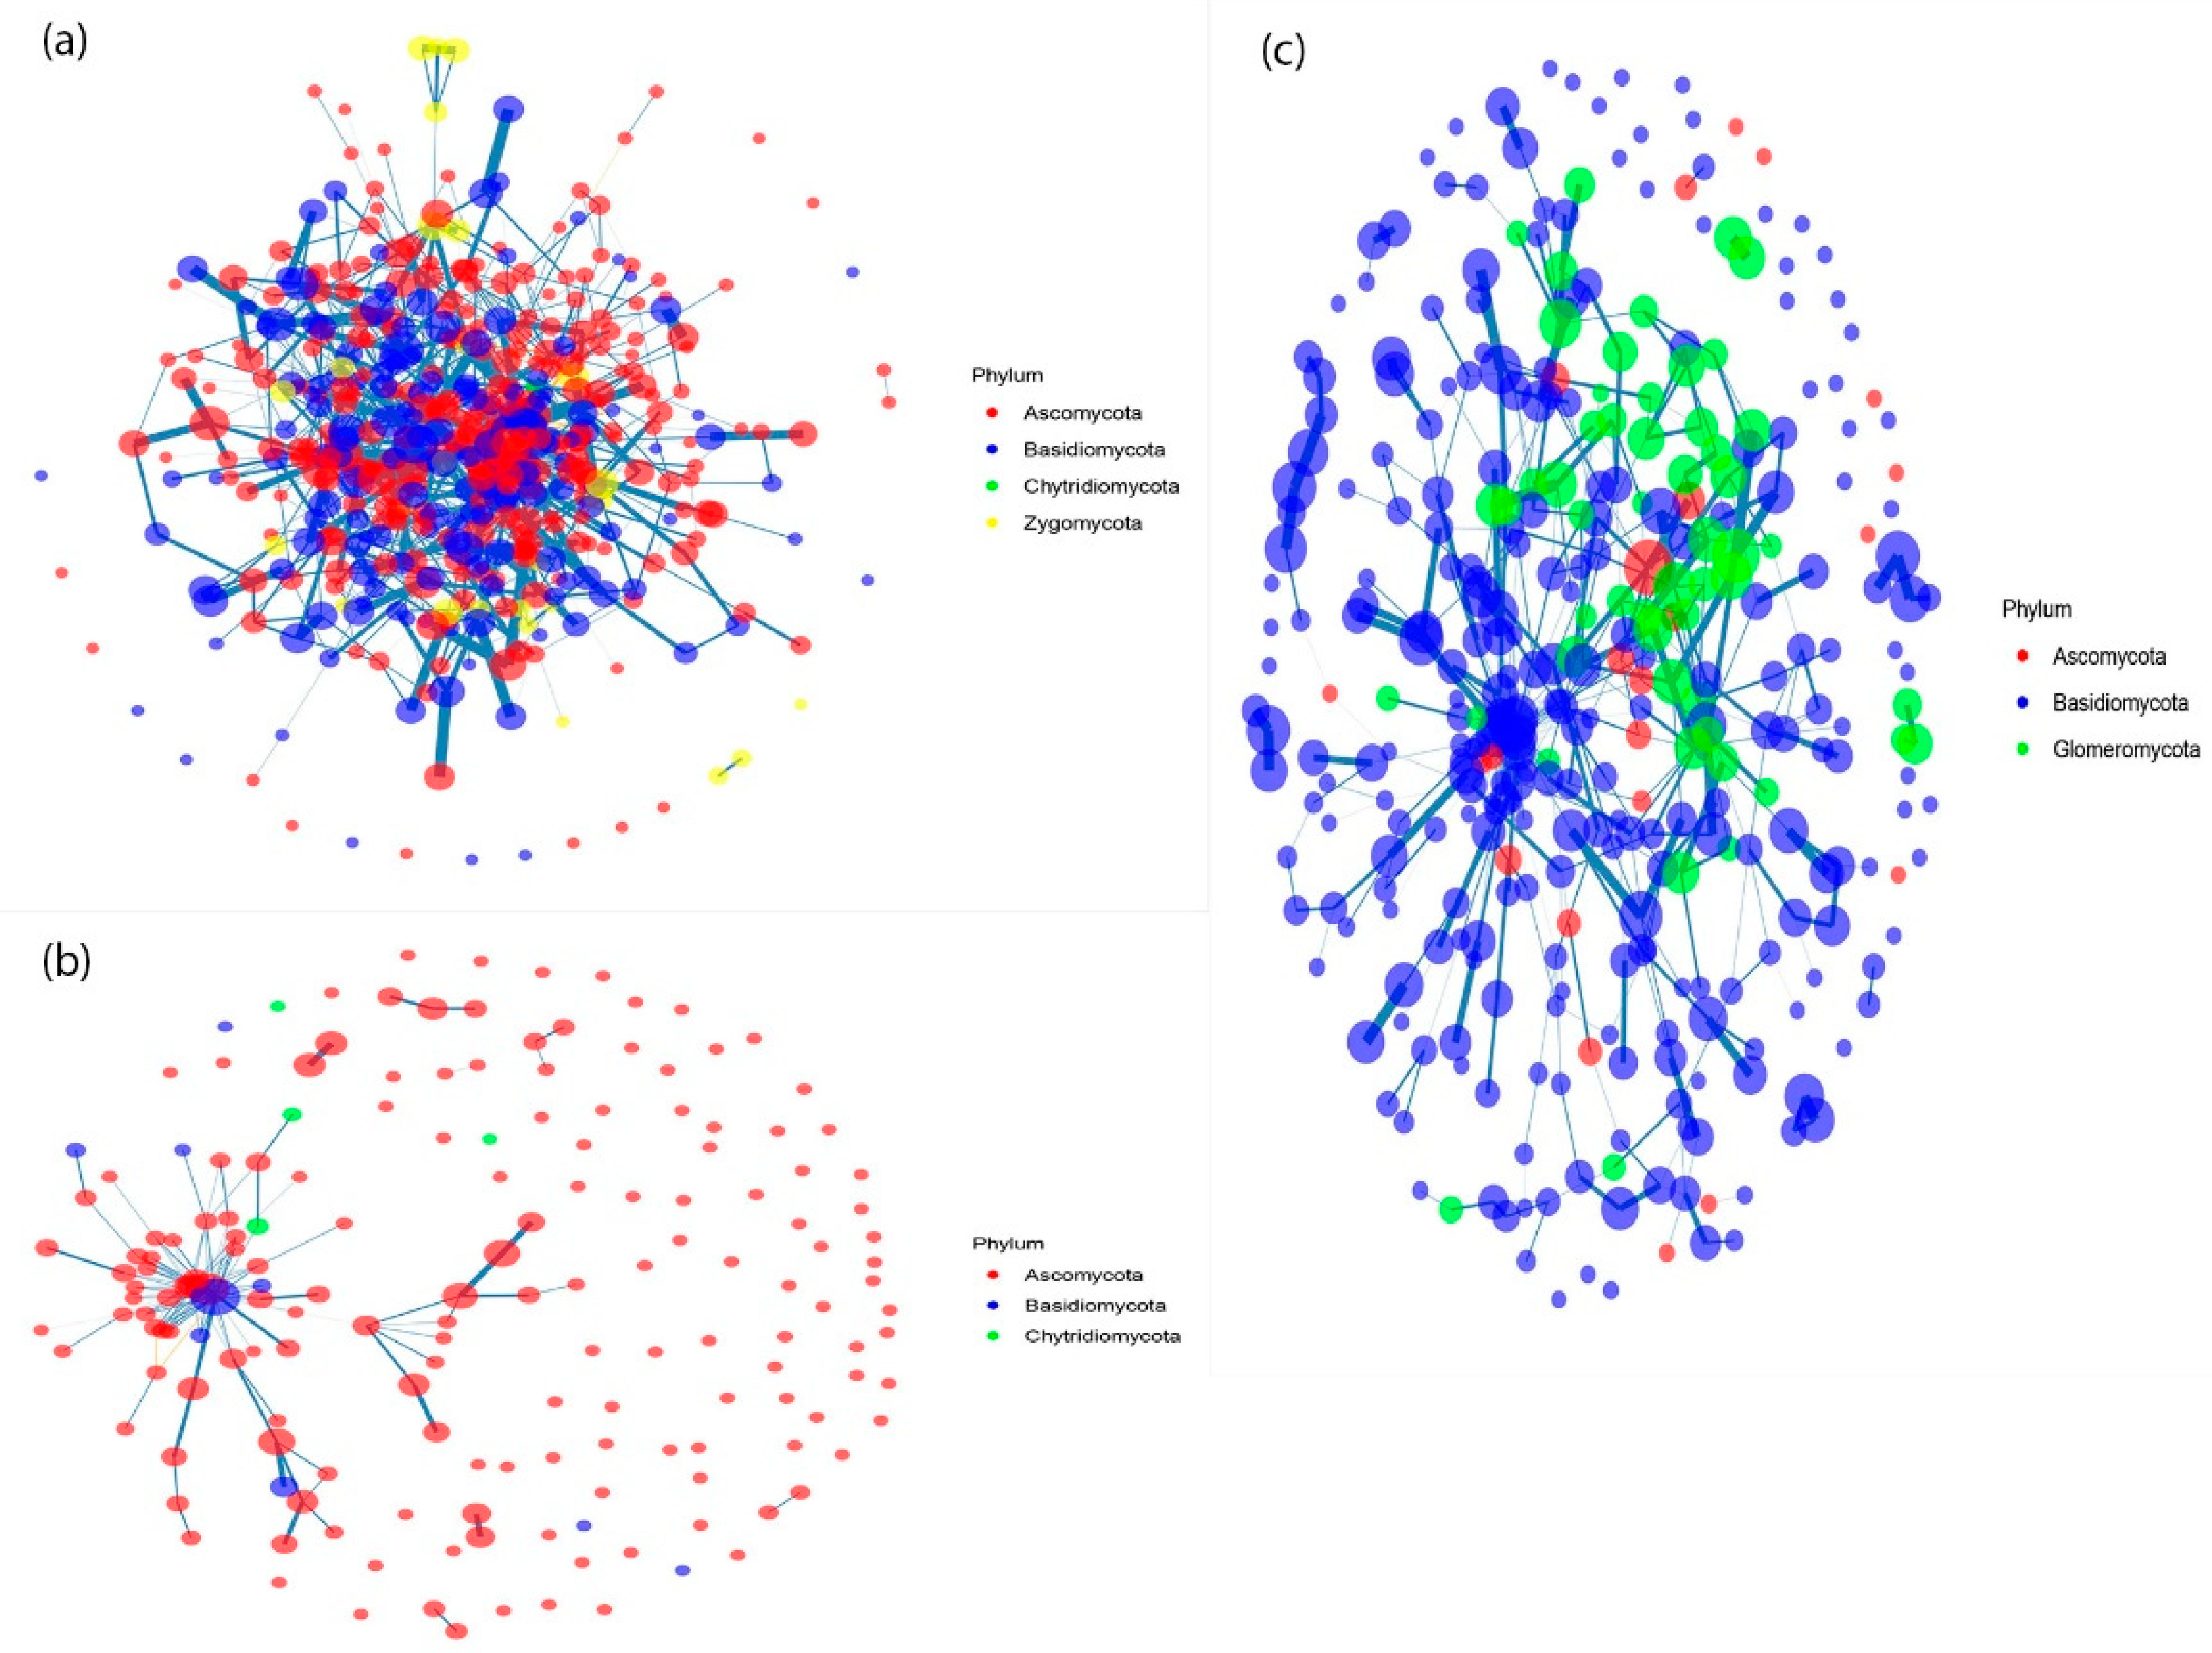
Co-occurrence networks were constructed to investigate the soil fungal communities. The interactions between fungal taxa were determined through a network structure to decipher the complexity of fungal communities in the 20 ha forest plot. Co-occurrence networks of fungal communities were constructed based on OTU relative abundances and inferred by calculating the Spearman correlation matrix between OTUs. The network was explored using the igraph package [41]. To describe the network topology, the number of nodes and edges was calculated. In the network diagrams, each node represents an OTU indicating an individual taxon, whereas the edges between every two nodes indicates significant correlations between those two taxa.
To estimate distance–decay of similarity (DDS), the Bray–Curtis dissimilarity index was calculated to describe the pairwise dissimilarity between samples. DDS was assessed in a logarithmic transformed space to enhance the linear fitting, according to Nekola and White [42], using the formula:
log(Scom) = log(a) + β × log(D)
where Scom is the community similarity, a is the intercept parameter, D is the geographic distance, and β is the slope of DDS. Pairwise geographic distances between samples were calculated using the x and y coordinates implemented in the vegan package [43] and were plotted against the pairwise Bray–Curtis dissimilarities using the plot function in base R.
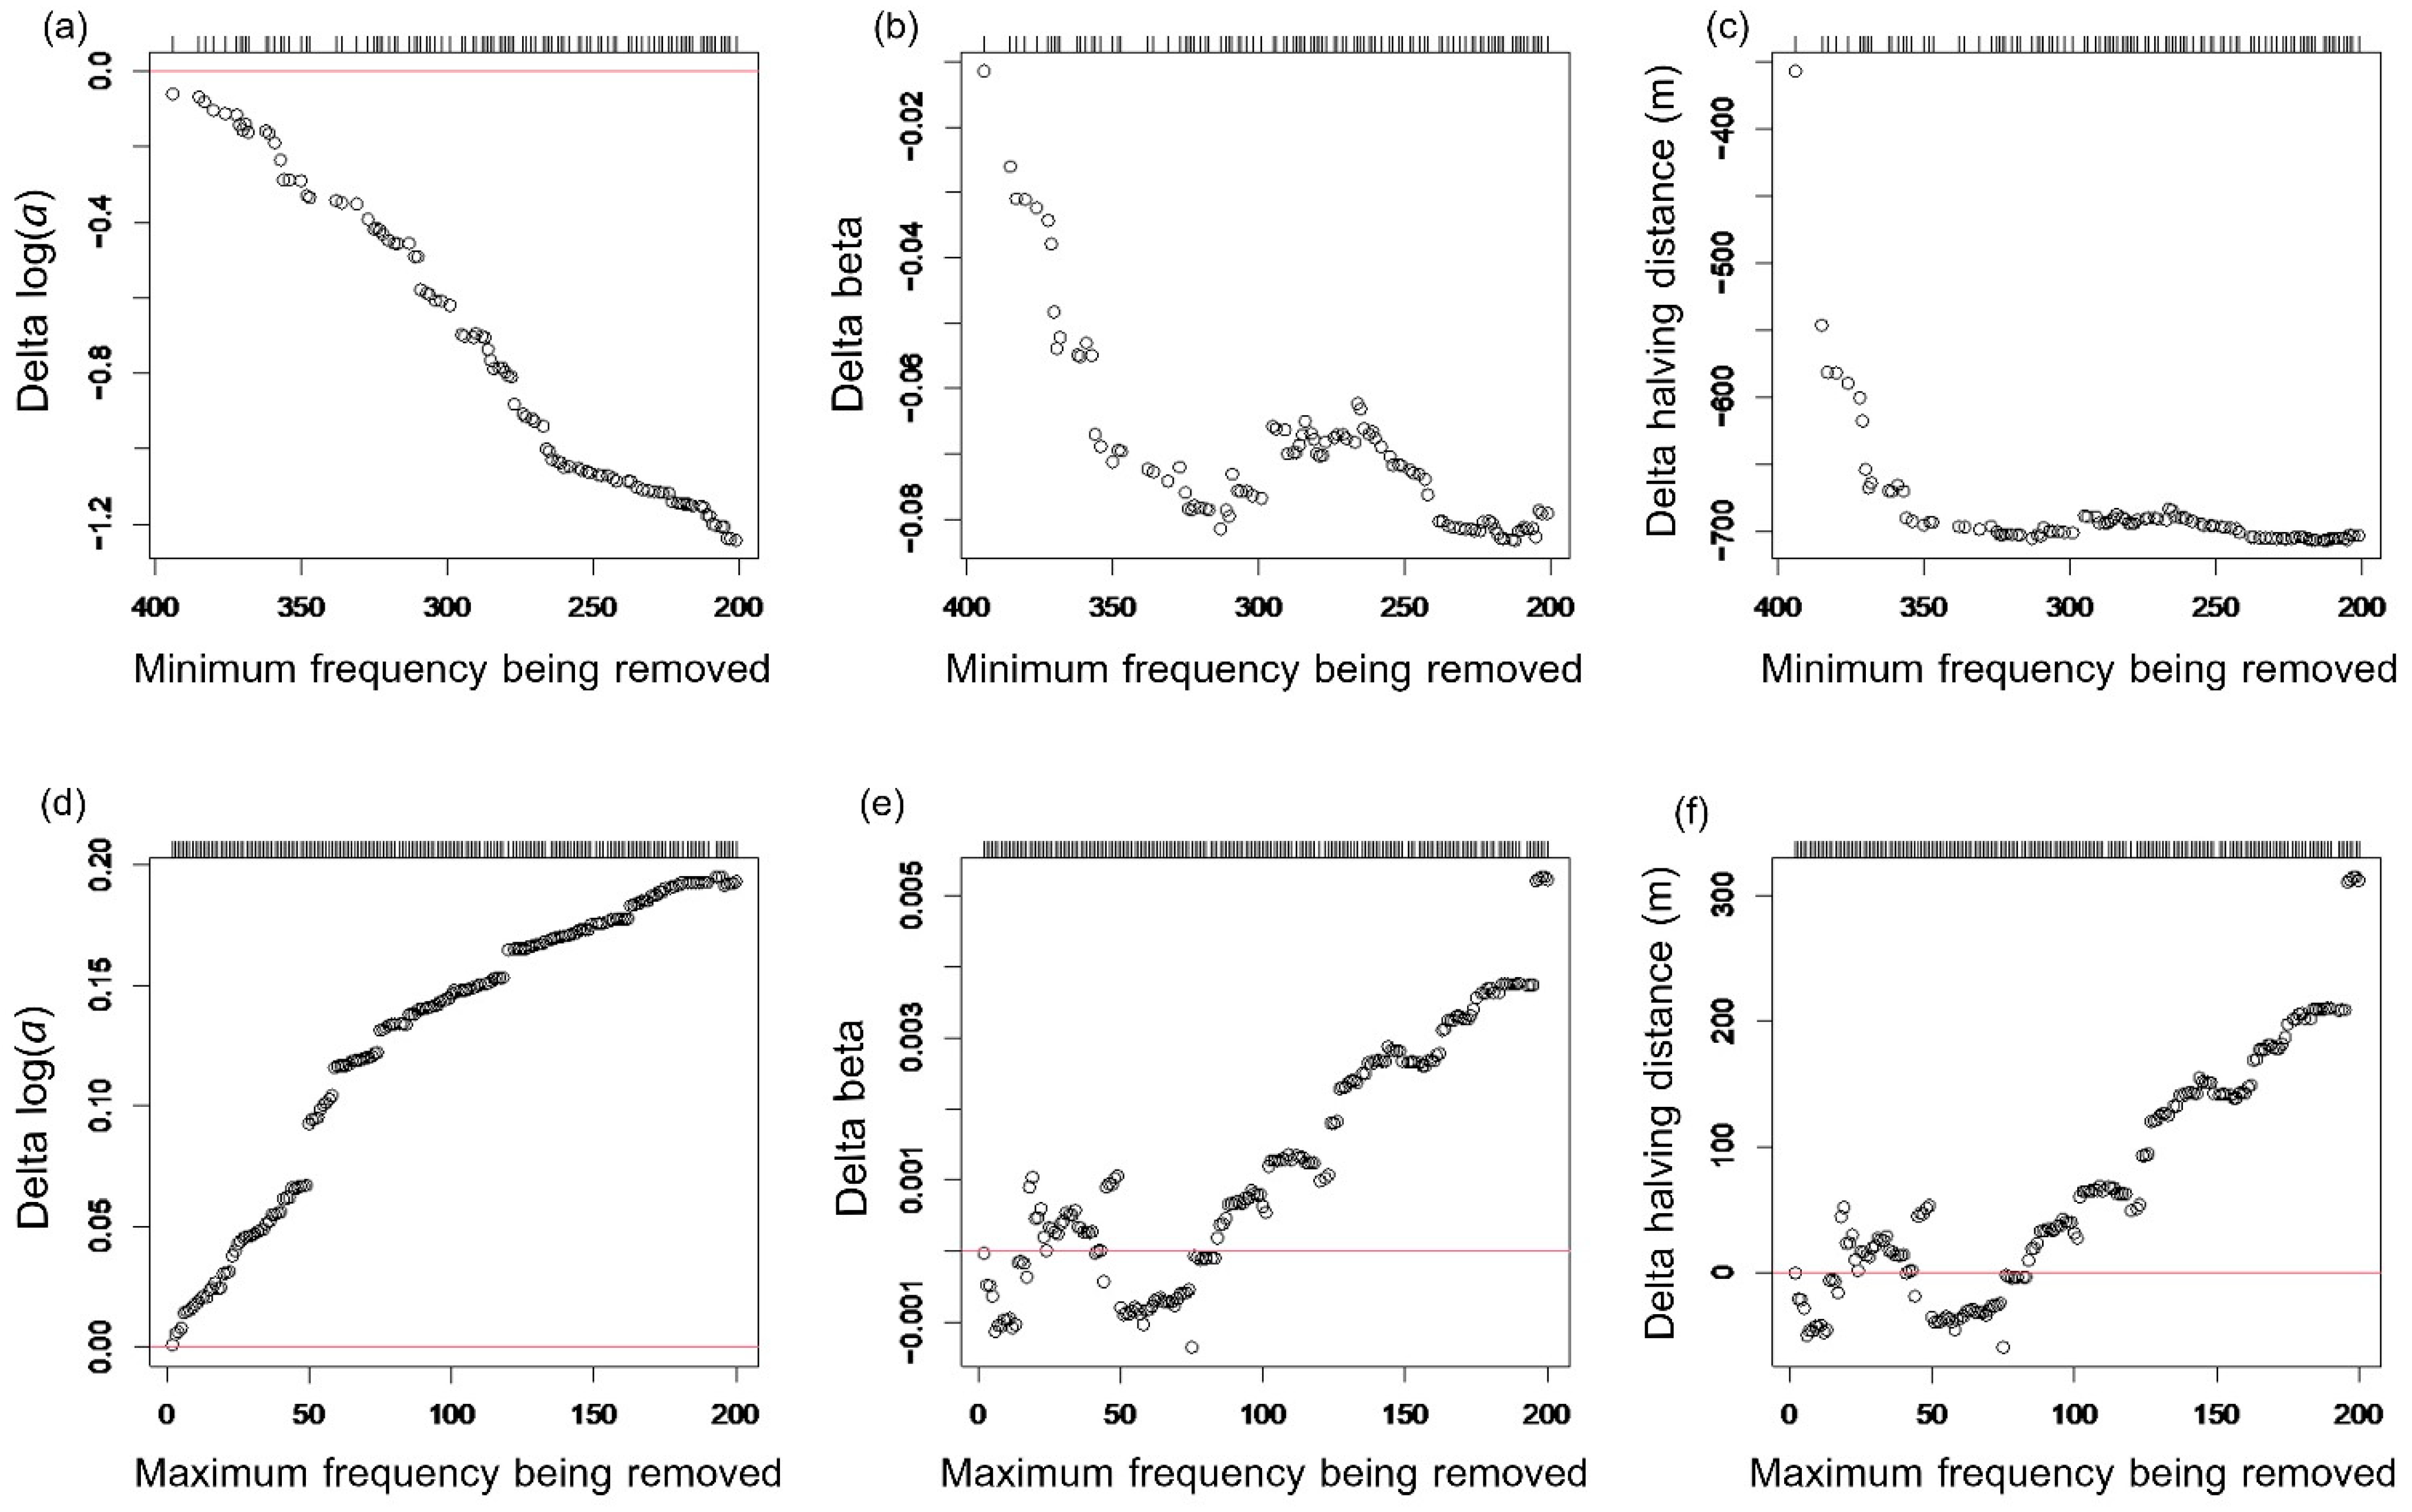
The impacts of specialists and generalists on the distance–decay of similarity were assessed by removing minimum frequency and removing maximum frequency OTUs, respectively. To compare the estimates of parameters obtained using different approaches for these data, three distance–decay models were fitted: (1) linear regression of Delta log(a) or initial similarity, (2) linear regression of Delta beta, and (3) linear regression of the Delta halving distance (m). The halving distance (how much farther apart sites would have to be to halve the similarity) was calculated by noting similar halves whenever the separation distance, d, was increased by the amount:
d0.5 = −log(0.5)/β = 0.693/β
where d0.5 denotes the halving distance [44]. Equation (2) does not depend on d itself, but only on the increase in d.
Partitioning of beta diversity, as proposed by Baselga (2010) [45], was used for calculating beta diversity components. Turnover, nestedness, slope of DDS, and initial similarity were calculated to estimate the impact of specialists or generalists for the three functional guilds. All beta diversity measures were calculated using the betapart package [46]. Additionally, triangular plots (simplex) were generated to describe the distributions of abundant OTUs concerning the partitive components of beta diversity for Jaccard similarity in all OTUs and the three functional guilds. All statistical analyses were performed in the R software version 4.0.3 (accessed on 6 June 2022) [47].

3. Results

3.1. The Co-Occurrence Network of Soil Fungal Communities

Across all the 396 soil samples, a total of 3182 fungal OTUs (singletons removed) were obtained from high-throughput sequencing datasets. Among them, 1,552,685 reads and 468 OTUs of undefined saprotrophs, 56,732 reads and 170 OTUs of plant pathogens, and 985,544 reads and 349 OTUs of mutualists were found. Ascomycota and Basidiomycota accounted for the largest proportion of nodes in soil fungal communities. The co-occurrence network of soil fungal communities was more complex in undefined saprotrophs than in mutualist and plant pathogens (Figure 2). The composition of nodes and edges also varied within each network. The undefined saprotroph was the most represented functional guild and was dominated by taxa from both Ascomycota and Basidiomycota (Figure 2a). The plant pathogen network had the least number of nodes and significant correlations among nodes and was dominated by Ascomycota (Figure 2b). Meanwhile, the mutualist network was relatively more complex than plant pathogen network and was dominated by members from Basidiomycota (Figure 2c).

3.2. Distance-Decay Relationships on Soil Fungal Communities

The removal of specialists and generalists had opposite effects on the change in slope, initial similarity, and halving distance of DDS (Figure 3). The initial similarity, DDS slope, and halving distance all decreased when specialists were removed (Figure 3a–c). In contrast, the removal of generalists resulted in increased initial similarity, DDS slope, and halving distance (Figure 3d–f). Similarly, the removal of specialists and generalists also had opposite effects on the change in slope, initial similarity, and halving distance of DDS of undefined soil saprotrophs, plant mutualists, and pathogen communities (Supplementary Material Figures S1–S3).

3.3. Beta Diversity Partitioning

Turnover and nestedness contributions to beta diversity were similar in both specialists and generalists across functional guilds. Turnover was relatively higher in generalists than in specialists (Figure 4a), whereas nestedness was relatively higher in specialists than in generalists (Figure 4b). Nevertheless, turnover was higher and nestedness was lower for both specialists and generalists and turnover was the greater contributor to overall beta diversity across functional guilds for both specialists and generalists (Figure 4a,b). Slope of DDS was relatively higher in specialists than in generalists, except in pathogen specialists (Figure 4c). Meanwhile, initial similarity was relatively higher in specialists than in generalists in all functional guilds (Figure 4d).
Similarly, the triangular plots show that the beta diversity was high for the overall fungal community, as well as the individual functional guilds (Figure 5). Of the three components, species replacement dominated for the overall fungal community and all functional guilds. In the overall fungal community and undefined saprotrophs, the Jaccard similarity component was higher than the richness difference component. In contrast, the richness difference component was higher than the Jaccard similarity component for plant pathogens and mutualists. In all cases, the sum of species replacement and richness difference components was higher than the Jaccard similarity component, i.e., the beta diversity among samples was higher than the similarity (Figure 5).

4. Discussion

Despite recent attempts to disentangle the distribution of fungal community assembly, few studies have focused on the contribution of soil fungal specialists and generalists in shaping distance–decay of similarity. Here, the co-occurrence networks and the characteristics of soil fungal specialists and generalists in terms of beta diversity and the underlying mechanisms of biogeographic patterns were investigated. The results show that (1) fungal co-occurrence networks showed significantly distinct structural properties in undefined saprotrophs, pathogens, and plant mutualists; (2) specialists and generalists contributed differently to the DDS slope, initial similarity, and halving distance within each of the three fungal guilds; and (3) turnover was the greater contributor to overall beta diversity across functional guilds for both specialists and generalists—however, generalists had a greater turnover rate than specialists within each of the three fungal guilds whereas specialists had a higher nestedness rate than generalists. These findings would bring new insights into how these two groups contribute to the diversity of the community and add knowledge on predicting soil fungal biogeographic community patterns among different fungal guilds.

4.1. Soil Fungal Community Diversity and Composition

Network analysis showed that fungal communities in the subtropical forest were non-randomly distributed. Fungal co-occurrence networks have considerably different structural properties in undefined saprotrophs, pathogens, and plant mutualists. The undefined saprotroph network showed a much more complicated structure than the plant mutualist and pathogen networks. It has been proposed that a highly connected network provides more functional redundancy [48]. Therefore, this suggests that the complex fungal network in undefined saprotrophs would lead to greater community stability and thus may enhance the decomposition of organic matter [49]. Ascomycota and Basidiomycota were the two most abundant phyla. Consistent with our study, Shi et al. [50] found that Ascomycota was the dominant phylum in forest soil and was better able to endure environmental pressures. Ascomycota is the most diverse group of saprotrophic fungi [51]; thus, differences in the composition within the Ascomycota may play a role in keeping similar saprotrophic functions operating [52]. Basidiomycota is reported to be ubiquitous in forest soils [16,53]. Many ectomycorrhiza (EcMF) and endomycorrhiza (EMF) belonging to the phyla Ascomycota and Basidiomycota, e.g., Elaphomyces muricatus and Russula cyanoxantha, were found to dominate in tropical and subtropical forests [50,54,55]. Our results show that the phyla Ascomycota and Basidiomycota dominated the fungal communities in subtropical forest soils.

4.2. Distance–Decay Relationships of Soil Fungal Communities

Removal of generalist and specialist taxa had opposite effects on DDS. Numerous studies have reported that generalist and specialist microbial taxa typically have distinctive distribution patterns and functional traits [56,57,58]. Consequently, they could have unique, possibly contrasting, influence on distance–decay relationships of species. Generalists, which live in a wide range of environmental conditions, and specialists, which require more specific environmental conditions, are thought to be governed by contrasting assembly processes and thus contribute to overall diversity in different ways [59,60]. The contribution of generalists or specialists is still limited when attempting to predict and explain spatial patterns of biodiversity.
Our observations revealed the significant effects of the removal of specialists and generalists on distance–decay of similarity in soil fungal communities. We found that the removal of specialists from the entire community resulted in a decrease in distance–decay relationships. In contrast, the removal of generalists from the entire community resulted in an increase in distance–decay relationships. The removal of generalists had the effect of increasing the change in slope, initial similarity, and halving distance of DDS, indicating impacts of dispersal limitation [61]. Dispersal limitation is one of the most important stochastic processes influencing microbial community assembly [30]. In contrast, the removal of specialists had the effect of decreasing the change in slope, initial similarity, and halving distance of DDS, and could have been influenced by deterministic processes. These results are consistent with a previous study that showed that the assembly of generalists was driven by stochastic processes due to their general indifference to changes in habitat conditions, whereas the assembly of specialists are more affected by deterministic processes due to their preferences for specific environmental conditions [62]. Our results are also consistent with a recent study [60] that also showed slightly weakened distance–decay relationships when specialists were removed and increase in the slope of distance–decay relationships with the removal of generalists. They found that generalists contributed more to stochastic processes in community assembly whereas specialists mainly contributed to the deterministic processes [60]. Due to dispersal limitation and environmental filtering, the removal of generalists and specialists having opposite effects on the change in slope, initial similarity, and halving distance of DDS may result in a change in the turnover of beta diversity.

4.3. Beta Diversity Partitioning

Species turnover almost entirely explained the fungal beta diversity rather than nestedness, indicating that the fungal beta diversity may mainly arise from the species turnover component. The specialists may have a greater turnover rate because they adapt to environmental changes more quickly [63]. Generalists are predicted to minimize species turnover and beta diversity, which represents the loss or replacement of species due to dispersal limitation and environmental filtering [60]. Recent studies have revealed that beta diversity and species turnover of fungal communities significantly increased with increasing geographic distance [64]. They also found that fungal beta diversity was almost entirely driven by species turnover rather than species nestedness [64]. We expected turnover to predominate because nestedness was much lower, but nestedness was also involved in contributing to beta diversity. We found that distance–decay relationships of fungal guilds in the subtropical forest of Southwest China are different. Such differences should be reflected in either turnover or nestedness in species and/or trait composition among the three functional guilds. Our results show that the impact of specialists and generalists contributed primarily to the spatial turnover and nestedness of soil fungal beta diversity in our study.
The triangular plots (simplex) showed that soil fungal communities among the samples were more dissimilar than similar. Beta diversity was high and was more associated with the highest species replacement rate for all OTU and three functional guilds. This suggests that no cosmopolitan generalist fungal taxa were present in most of the samples [65]. A high rate of fungal OTU replacement or turnover could indicate either restricted fungal niches and strong environmental filtering [66], strong interspecific competitive exclusion [65], or historical contingencies with priority effects that allow early colonizers to prevent latecomers from colonizing [67,68]. At local scales, habitat heterogeneity may be high in the subtropical forest dynamics plot and could be causing the high turnover patterns. It would have been ideal to identify biotic and abiotic factors shaping soil fungal community beta diversity, but those are currently outside of the scope of this research.

5. Conclusions

This study provides insights on local soil fungal distance–decay of similarity in a subtropical forest. Through next generation sequencing and co-occurrence network analysis, we described soil fungal communities from different functional guilds. In addition, by removing low- and high-frequency fungal OTUs, the respective effects of specialist and generalist fungi on DDS were quantified. The results demonstrated that the phyla Ascomycota and Basidiomycota dominated the entire fungal community and the undefined saprotroph. Ascomycota dominated plant pathogen communities and Basidiomycota dominated the mutualist communities. Undefined soil saprotroph co-occurrence networks were more complex than plant mutualist and pathogen networks. The removal of specialists or generalists had significant and contrasting effects on the change in slope, initial similarity, and halving distance of soil fungal DDS. The removal of specialists resulted in the weakening whereas the removal of generalists resulted in the strengthening of soil fungal DDS. These observed patterns were consistent for the entire soil fungal community and across the fungal guilds. Lastly, fungal beta diversity was derived almost entirely from species turnover rather than from species nestedness across functional guilds for both specialists and generalists. Although it is difficult to disentangle the underlying mechanisms of soil fungal community assembly, the results could be used as a tool to study fungal biogeographic patterns through time and to predict future changes that might be damaging to forests.

Supplementary Materials

The following supporting information can be downloaded at: https://www.mdpi.com/article/10.3390/f13081188/s1, Figure S1. Effect of removal of specialists (top) and generalists (bottom) on initial similarity (a,d), slope (b,e), and halving distance (c,f) of distance–decay of similarity in soil undefined saprotrophs. Figure S2. Effect of removal of specialists (top) and generalists (bottom) on initial similarity (a,d), slope (b,e), and halving distance (c,f) of distance–decay of similarity in plant mutualists. Figure S3. Effect of removal of specialists (top) and generalists (bottom) on initial similarity (a,d), slope (b,e), and halving distance (c,f) of distance–decay of similarity in pathogens.

Author Contributions

Conceptualization, P.C. and Y.-H.H.; data collection, Y.-H.H.; data analysis, Y.-H.H.; writing—original draft preparation, P.C., M.J.M.A. and Y.-H.H.; writing—review and editing, P.C., Y.-H.H., L.S. and M.J.M.A.; funding acquisition, Y.-H.H. All authors have read and agreed to the published version of the manuscript.

Funding

This research was supported by the National Natural Science Foundation of China (31570380, 31300358), the Yunnan Fundamental Research Projects (2015FB185), the CAS 135 program (No. 2017XTBG-T01), and the WestLight Foundation of the Chinese Academy of Sciences to Yue-Hua Hu.

Acknowledgments

We thank Mengesha Asefa for his constructive advice during manuscript revision. P.C. was sponsored by the CAS “The Belt and Road” Master Fellowship Program and CAS President’s International Fellowship Initiative (PIFI) and M.J.M.A. by the CAS-TWAS President’s Fellowship for International Doctoral Students.

Conflicts of Interest

The authors declare no competing financial or any other potential conflict of interest.

References

  1. Soininen, J.; McDonald, R.; Hillebrand, H. The distance decay of similarity in ecological communities. Ecography 2007, 30, 3–12. [Google Scholar] [CrossRef]
  2. Tobler, W.R. A computer movie simulating urban growth in the Detroit region. Econ. Geogr. 1970, 46 (Suppl. 1), 234–240. [Google Scholar] [CrossRef]
  3. Hanson, C.A.; Fuhrman, J.A.; Horner-Devine, M.C.; Martiny, J.B. Beyond biogeographic patterns: Processes shaping the microbial landscape. Nat. Rev. Microbiol. 2012, 10, 497–506. [Google Scholar] [CrossRef] [PubMed]
  4. Talbot, J.M.; Bruns, T.D.; Taylor, J.W.; Smith, D.P.; Branco, S.; Glassman, S.I.; Erlandson, S.; Vilgalys, R.; Liao, H.L.; Smith, M.E.; et al. Endemism and functional convergence across the North American soil mycobiome. Proc. Natl. Acad. Sci. USA 2014, 111, 6341–6346. [Google Scholar] [CrossRef] [Green Version]
  5. Bahram, M.; Koljalg, U.; Courty, P.E.; Diedhiou, A.G.; Kjøller, R.; Polme, S.; Ryberg, M.; Veldre, V.; Tedersoo, L. The distance decay of similarity in communities of ectomycorrhizal fungi in different ecosystems and scales. J. Ecol. 2013, 101, 1335–1344. [Google Scholar] [CrossRef]
  6. Green, J.L.; Holmes, A.J.; Westoby, M.; Oliver, I.; Briscoe, D.; Dangerfield, M.; Gillings, M.; Beattie, A.J. Spatial scaling of microbial eukaryote diversity. Nature 2004, 432, 747–750. [Google Scholar] [CrossRef]
  7. Qian, H.; Ricklefs, R.E.; White, P.S. Beta diversity of angiosperms in temperate floras of eastern Asia and eastern North America. Ecol. Lett. 2005, 8, 15–22. [Google Scholar] [CrossRef]
  8. Hu, Y.H.; Johnson, D.J.; Mi, X.C.; Wang, X.G.; Ye, W.H.; De Li, Y.; Lian, J.Y.; Cao, M. The relative importance of space compared to topography increases from rare to common tree species across latitude. J. Biogeogr. 2018, 45, 2520–2532. [Google Scholar] [CrossRef]
  9. Pandit, S.N.; Kolasa, J.; Cottenie, K. Contrasts between habitat generalists and specialists: An empirical extension to the basic metacommunity framework. Ecology 2009, 90, 2253–2262. [Google Scholar] [CrossRef] [Green Version]
  10. Siqueira, T.; Bini, L.M.; Roque, F.O.; Marques Couceiro, S.R.; Trivinho-Strixino, S.; Cottenie, K. Common and rare species respond to similar niche processes in macroinvertebrate metacommunities. Ecography 2012, 35, 183–192. [Google Scholar] [CrossRef]
  11. Morlon, H.; Chuyong, G.; Condit, R.; Hubbell, S.; Kenfack, D.; Thomas, D.; Valencia, R.; Green, J.L. A general framework for the distance–decay of similarity in ecological communities. Ecol. Lett. 2008, 11, 904–917. [Google Scholar] [CrossRef] [PubMed] [Green Version]
  12. Oono, R.; Rasmussen, A.; Lefèvre, E. Distance decay relationships in foliar fungal endophytes are driven by rare taxa. Environ. Microbiol. 2017, 19, 2794–2805. [Google Scholar] [CrossRef] [PubMed]
  13. Zinger, L.; Boetius, A.; Ramette, A. Bacterial taxa–area and distance–decay relationships in marine environments. Mol. Ecol. 2014, 23, 954–964. [Google Scholar] [CrossRef] [PubMed]
  14. Gloor, G.B.; Macklaim, J.M.; Pawlowsky-Glahn, V.; Egozcue, J.J. Microbiome datasets are compositional: And this is not optional. Front. Microbiol. 2017, 8, 2224. [Google Scholar] [CrossRef] [PubMed] [Green Version]
  15. Li, P.; Li, W.; Dumbrell, A.J.; Liu, M.; Li, G.; Wu, M.; Jiang, C.; Li, Z. Spatial variation in soil fungal communities across paddy fields in subtropical China. mSystems 2020, 5, e00704-19. [Google Scholar] [CrossRef] [PubMed] [Green Version]
  16. Tedersoo, L.; Bahram, M.; Põlme, S.; Kõljalg, U.; Yorou, N.S.; Wijesundera, R.; Ruiz, L.V.; Vasco-Palacios, A.M.; Thu, P.Q.; Suija, A. Global diversity and geography of soil fungi. Science 2014, 346, 1256688. [Google Scholar] [CrossRef] [Green Version]
  17. Peay, K.G.; Kennedy, P.G.; Talbot, J.M. Dimensions of biodiversity in the Earth mycobiome. Nat. Rev. Microbiol. 2016, 14, 434–447. [Google Scholar] [CrossRef]
  18. Chen, L.; Swenson, N.G.; Ji, N.; Mi, X.; Ren, H.; Guo, L.; Ma, K. Differential soil fungus accumulation and density dependence of trees in a subtropical forest. Science 2019, 366, 124–128. [Google Scholar] [CrossRef]
  19. Floudas, D.; Binder, M.; Riley, R.; Barry, K.; Blanchette, R.A.; Henrissat, B.; Martinez, A.T.; Otil-lar, R.; Spatafora, J.W.; Yadav, J.S.; et al. The Paleozoic origin of enzymatic lignin decomposition reconstructed from 31 fungal genomes. Science 2012, 336, 1715–1719. [Google Scholar] [CrossRef] [Green Version]
  20. Saikkonen, K.; Mikola, J.; Helander, M. Endophytic phyllosphere fungi and nutrient cycling in terrestrial ecosystems. Curr. Sci. 2015, 109, 121–126. [Google Scholar]
  21. Zhang, B.; Zhang, J.; Liu, Y.; Shi, P.; Wei, G. Co-occurrence patterns of soybean rhizosphere microbiome at a continental scale. Soil Biol. Biochem. 2018, 118, 178–186. [Google Scholar] [CrossRef]
  22. Li, S.; Wu, F. Diversity and co-occurrence patterns of soil bacterial and fungal communities in seven intercropping systems. Front. Microbiol. 2018, 9, 1521. [Google Scholar] [CrossRef] [PubMed]
  23. Bowman, E.A.; Arnold, A.E. Drivers and implications of distance decay differ for ectomycorrhizal and foliar endophytic fungi across an anciently fragmented landscape. ISME J. 2021, 15, 3437–3454. [Google Scholar] [CrossRef]
  24. Jiang, Y.; Liang, Y.; Li, C.; Wang, F.; Sui, Y.; Suvannang, N.; Zhou, J.; Sun, B. Crop rotations alter bacterial and fungal diversity in paddy soils across East Asia. Soil Biol. Biochem. 2016, 95, 250–261. [Google Scholar] [CrossRef] [Green Version]
  25. Nguyen, N.H.; Song, Z.W.; Bates, S.T.; Branco, S.; Tedersoo, L.; Menke, J.; Schilling, J.S.; Kennedy, P.G. FUNGuild: An open annotation tool for parsing fungal community datasets by ecological guild. Fungal Ecol. 2016, 20, 241–248. [Google Scholar] [CrossRef]
  26. Sterkenburg, E.; Bahr, A.; Brandström Durling, M.; Clemmensen, K.E.; Lindahl, B.D. Changes in fungal communities along a boreal forest soil fertility gradient. New Phytol. 2015, 207, 1145–1158. [Google Scholar] [CrossRef] [Green Version]
  27. Viana, D.S.; Chase, J.M. Spatial scale modulates the inference of metacommunity assembly processes. Ecology 2019, 100, e02576. [Google Scholar] [CrossRef] [PubMed]
  28. Schröter, K.; Wemheuer, B.; Pena, R.; Schöning, I.; Ehbrecht, M.; Schall, P.; Ammer, C.; Daniel, R.; Polle, A. Assembly processes of trophic guilds in the root mycobiome of temperate forests. Mol. Ecol. 2019, 28, 348–364. [Google Scholar] [CrossRef]
  29. Zhao, Z.; Ma, Y.; Feng, T.; Kong, X.; Wang, Z.; Zheng, W.; Zhai, B. Assembly processes of abundant and rare microbial communities in orchard soil under a cover crop at different periods. Geoderma 2022, 406, 115543. [Google Scholar] [CrossRef]
  30. Jiao, S.; Lu, Y. Abundant fungi adapt to broader environmental gradients than rare fungi in agricultural fields. Glob. Chang. Biol. 2020, 26, 4506–4520. [Google Scholar] [CrossRef]
  31. Wen, H.D.; Lin, L.X.; Yang, J.; Hu, Y.H.; Cao, M.; Liu, Y.H.; Lu, Z.Y.; Xie, Y.N. Species composition and community structure of a 20 hm2 plot of mid-mountain moist evergreen broad-leaved forest on the Mts. Ailaoshan, Yunnan Province, China. Chin. J. Plant Ecol. 2018, 42, 419–429. (In Chinese) [Google Scholar]
  32. Gong, H.D.; Zhang, Y.P.; Lei, Y.B.; Liu, Y.H.; Yang, G.P.; Lu, Z.Y. Evergreen broad-leaved forest improves soil water status compared with tea tree plantation in Ailao Mountains, Southwest China. Acta Agric. Scand. 2011, 61, 384–388. [Google Scholar] [CrossRef]
  33. Wu, C.S.; Zhang, Y.P.; Xu, X.L.; Sha, L.Q.; You, G.Y.; Liu, Y.H.; Xie, Y.N. Influence of interactions between litter decomposition and rhizosphere activity on soil respiration and on the temperature sensitivity in a subtropical montane forest in SW China. Plant Soil 2014, 381, 215–224. [Google Scholar] [CrossRef]
  34. Chan, O.C.; Yang, X.; Fu, Y.; Feng, Z.; Sha, L.; Casper, P.; Zou, X. 16S rRNA gene analyses of bacterial community structures in the soils of evergreen broad-leaved forests in south-west China. FEMS Microbiol. Ecol. 2006, 58, 247–259. [Google Scholar] [CrossRef] [Green Version]
  35. Gohl, D.M.; Vangay, P.; Garbe, J.; MacLean, A.; Hauge, A.; Becker, A.; Gould, T.J.; Clayton, J.B.; Johnson, T.J.; Hunter, R.; et al. Systematic improvement of amplicon marker gene methods for increased accuracy in microbiome studies. Nat. Biotechnol. 2016, 34, 942–949. [Google Scholar] [CrossRef] [Green Version]
  36. Martin, M. Cutadapt removes adapter sequences from high-throughput sequencing reads. EMBnet J. 2011, 17, 10–12. [Google Scholar] [CrossRef]
  37. Zhang, X.Y.; Tang, G.L.; Xu, X.Y.; Nong, X.H.; Qi, S.H. Insights into deep-sea sediment fungal communities from the East Indian Ocean using targeted environmental sequencing combined with traditional cultivation. PLoS ONE 2014, 9, e109118. [Google Scholar] [CrossRef] [PubMed] [Green Version]
  38. Bengtsson-Palme, J.; Ryberg, M.; Hartmann, M.; Branco, S.; Wang, Z.; Godhe, A.; De Wit, P.; Sanchez-Garcia, M.; Ebersberger, I.; De Sousa, F.; et al. Improved software detection and extraction of ITS1 and ITS 2 from ribosomal ITS sequences of fungi and other eukaryotes for analysis of environmental sequencing data. Methods Ecol. Evol. 2013, 4, 914–919. [Google Scholar] [CrossRef]
  39. Al-Ghalith, G.A.; Montassier, E.; Ward, H.N.; Knights, D. NINJA-OPS: Fast accurate marker gene alignment using concatenated ribosomes. PLoS Comput. Biol. 2016, 12, e1004658. [Google Scholar] [CrossRef]
  40. Cregger, M.A.; Veach, A.M.; Yang, Z.K.; Crouch, M.J.; Vilgalys, R.; Tuskan, G.A.; Schadt, C.W. The Populus holobiont: Dissecting the effects of plant niches and genotype on the microbiome. Microbiome 2018, 6, 1–14. [Google Scholar] [CrossRef]
  41. Csardi, G.; Nepusz, T. The igraph software package for complex network research. Int. J. Complex. 2006, 1695, 1–9. [Google Scholar]
  42. Nekola, J.C.; White, P.S. The distance decay of similarity in biogeography and ecology. J. Biogeogr. 1999, 26, 867–878. [Google Scholar] [CrossRef] [Green Version]
  43. Oksanen, J.; Blanchet, F.G.; Friendly, M.; Kindt, R.; Legendre, P.; McGlinn, D.; Wagner, H. Vegan: Community Ecology Package. R Package Version 2.4–3. 2017. Available online: https://cran.r-project.org/package=vegan (accessed on 8 February 2021).
  44. Millar, R.B.; Anderson, M.J.; Tolimieri, N. Much ado about nothings: Using zero similarity points in distance-decay curves. Ecology 2011, 92, 1717–1722. [Google Scholar] [CrossRef] [Green Version]
  45. Baselga, A. Partitioning the turnover and nestedness components of beta diversity. Glob. Ecol. Biogeogr. 2010, 19, 134–143. [Google Scholar] [CrossRef]
  46. Baselga, A.; Orme, C.D.L. betapart: An R package for the study of beta diversity. Methods Ecol. Evol. 2012, 3, 808–812. [Google Scholar] [CrossRef]
  47. R Development Core Team. R: A Language and Environment for Statistical Computing; R Foundation for Statistical Computing: Vienna, Austria, 2017; Available online: https://www.r-project.org/ (accessed on 26 July 2022).
  48. Mougi, A.; Kondoh, M. Diversity of Interaction Types and Ecological Community Stability. Science 2012, 337, 349–351. [Google Scholar] [CrossRef]
  49. Deacon, L.J.; Pryce-Miller, E.J.; Frankland, J.C.; Bainbridge, B.W.; Moore, P.D.; Robinson, C.H. Diversity and function of decomposer fungi from a grassland soil. Soil Biol. Biochem. 2006, 38, 7–20. [Google Scholar] [CrossRef]
  50. Shi, L.L.; Mortimer, P.E.; Slik, J.F.; Zou, X.M.; Xu, J.; Feng, W.T.; Qiao, L. Variation in forest soil fungal diversity along a latitudinal gradient. Fungal Divers. 2014, 64, 305–315. [Google Scholar] [CrossRef]
  51. Xiong, J.; Peng, F.; Sun, H.; Xue, X.; Chu, H. Divergent Responses of Soil Fungi Functional Groups to Short-term Warming. Microb. Ecol. 2014, 68, 708–715. [Google Scholar] [CrossRef]
  52. Tatsumi, C.; Azuma, W.A.; Ogawa, Y.; Komada, N. Nitrogen Availability and Microbial Communities of Canopy Soils in a Large Cercidiphyllum japonicum Tree of a Cool-Temperate Old Growth Forest. Microb. Ecol. 2021, 82, 919–931. [Google Scholar] [CrossRef]
  53. Cairney, J.W. Basidiomycete mycelia in forest soils: Dimensions, dynamics and roles in nutrient distribution. Mycol. Res. 2005, 109, 7–20. [Google Scholar] [CrossRef] [PubMed] [Green Version]
  54. Konstantinidis, G.; Kaounas, V. Elaphomyces muricatus and Fischerula macrospora, two interesting hypogeous fungi from Greece. Ascomycete 2012, 4, 95–98. [Google Scholar]
  55. Zsigmond, A.R.; Kántor, I.; May, Z.; Urák, I.; Héberger, K. Elemental composition of Russula cyanoxantha along an urbanizationgradient in Cluj-Napoca (Romania). Chemosphere 2020, 238, 124566. [Google Scholar] [CrossRef] [PubMed]
  56. Wu, W.; Logares, R.; Huang, B.; Hsieh, C.H. Abundant and rare picoeukaryotic sub-communities present contrasting patterns in the epipelagic waters of marginal seas in the northwestern Pacific Ocean. Environ. Microbiol. 2017, 19, 287–300. [Google Scholar] [CrossRef] [PubMed]
  57. Jiao, S.; Lu, Y. Soil pH and temperature regulate assembly processes of abundant and rare bacterial communities in agricultural ecosystems. Environ. Microbiol. 2020, 22, 1052–1065. [Google Scholar] [CrossRef]
  58. Liang, Y.; Xiao, X.; Nuccio, E.E.; Yuan, M.; Zhang, N.; Xue, K.; Cohan, F.M.; Zhou, J.; Sun, B. Differentiation strategies of soil rare and abundant microbial taxa in response to changing climatic regimes. Environ. Microbiol. 2020, 22, 1327–1340. [Google Scholar] [CrossRef] [PubMed]
  59. Szekely, A.J.; Langenheder, S. The importance of species sorting differs between habitat generalists and specialists in bacterial communities. FEMS Microbiol. Ecol. 2014, 87, 102–112. [Google Scholar] [CrossRef]
  60. Xu, Q.; Vandenkoornhuyse, P.; Li, L.; Guo, J.; Zhu, C.; Guo, S.; Ling, N.; Shen, Q. Microbial generalists and specialists differently contribute to the community diversity in farmland soils. J. Adv. Res. 2021; in press. [Google Scholar]
  61. Liu, L.; Yang, J.; Yu, Z.; Wilkinson, D.M. The biogeography of abundant and rare bacterioplankton in the lakes and reservoirs of China. ISME J. 2015, 9, 2068–2077. [Google Scholar] [CrossRef]
  62. Liao, J.; Cao, X.; Zhao, L.; Wang, J.; Gao, Z.; Wang, M.C.; Huang, Y. The importance of neutral and niche processes for bacterial community assembly differs between habitat generalists and specialists. FEMS Microbiol. Ecol. 2016, 92, fiw174. [Google Scholar] [CrossRef] [Green Version]
  63. Rosenzweig, M.L. Species Diversity in Space and Time; Cambridge University Press (CUP): Cambridge, UK, 1995. [Google Scholar]
  64. Wang, J.; Zhang, T.; Li, L.; Li, J.; Feng, Y.; Lu, Q. The patterns and drivers of bacterial and fun-gal β-diversity in a typical dryland ecosystem of northwest China. Front. Microbiol. 2017, 8, 2126. [Google Scholar] [CrossRef] [PubMed] [Green Version]
  65. Genevieve, L.; Pierre-Luc, C.; Roxanne, G.-T.; Amélie, M.; Danny, B.; Vincent, M.; Hugo, G. Estimation of fungal diversity and identification of major abiotic drivers influencing fungal richness and communities in northern temperate and boreal Quebec forests. Forests 2019, 10, 1096. [Google Scholar] [CrossRef] [Green Version]
  66. Buckley, L.B.; Jetz, W. Linking global turnover of species and environments. Proc. Natl. Acad. Sci. USA 2008, 105, 17836–17841. [Google Scholar] [CrossRef] [Green Version]
  67. Podani, J.; Schmera, D. A new conceptual and methodological framework for exploring and ex-plaining pattern in presence–absence data. Oikos 2011, 120, 1625–1638. [Google Scholar] [CrossRef]
  68. Legendre, P. Interpreting the replacement and richness difference components of beta diversity. Glob. Ecol. Biogeogr. 2014, 23, 1324–1334. [Google Scholar] [CrossRef]
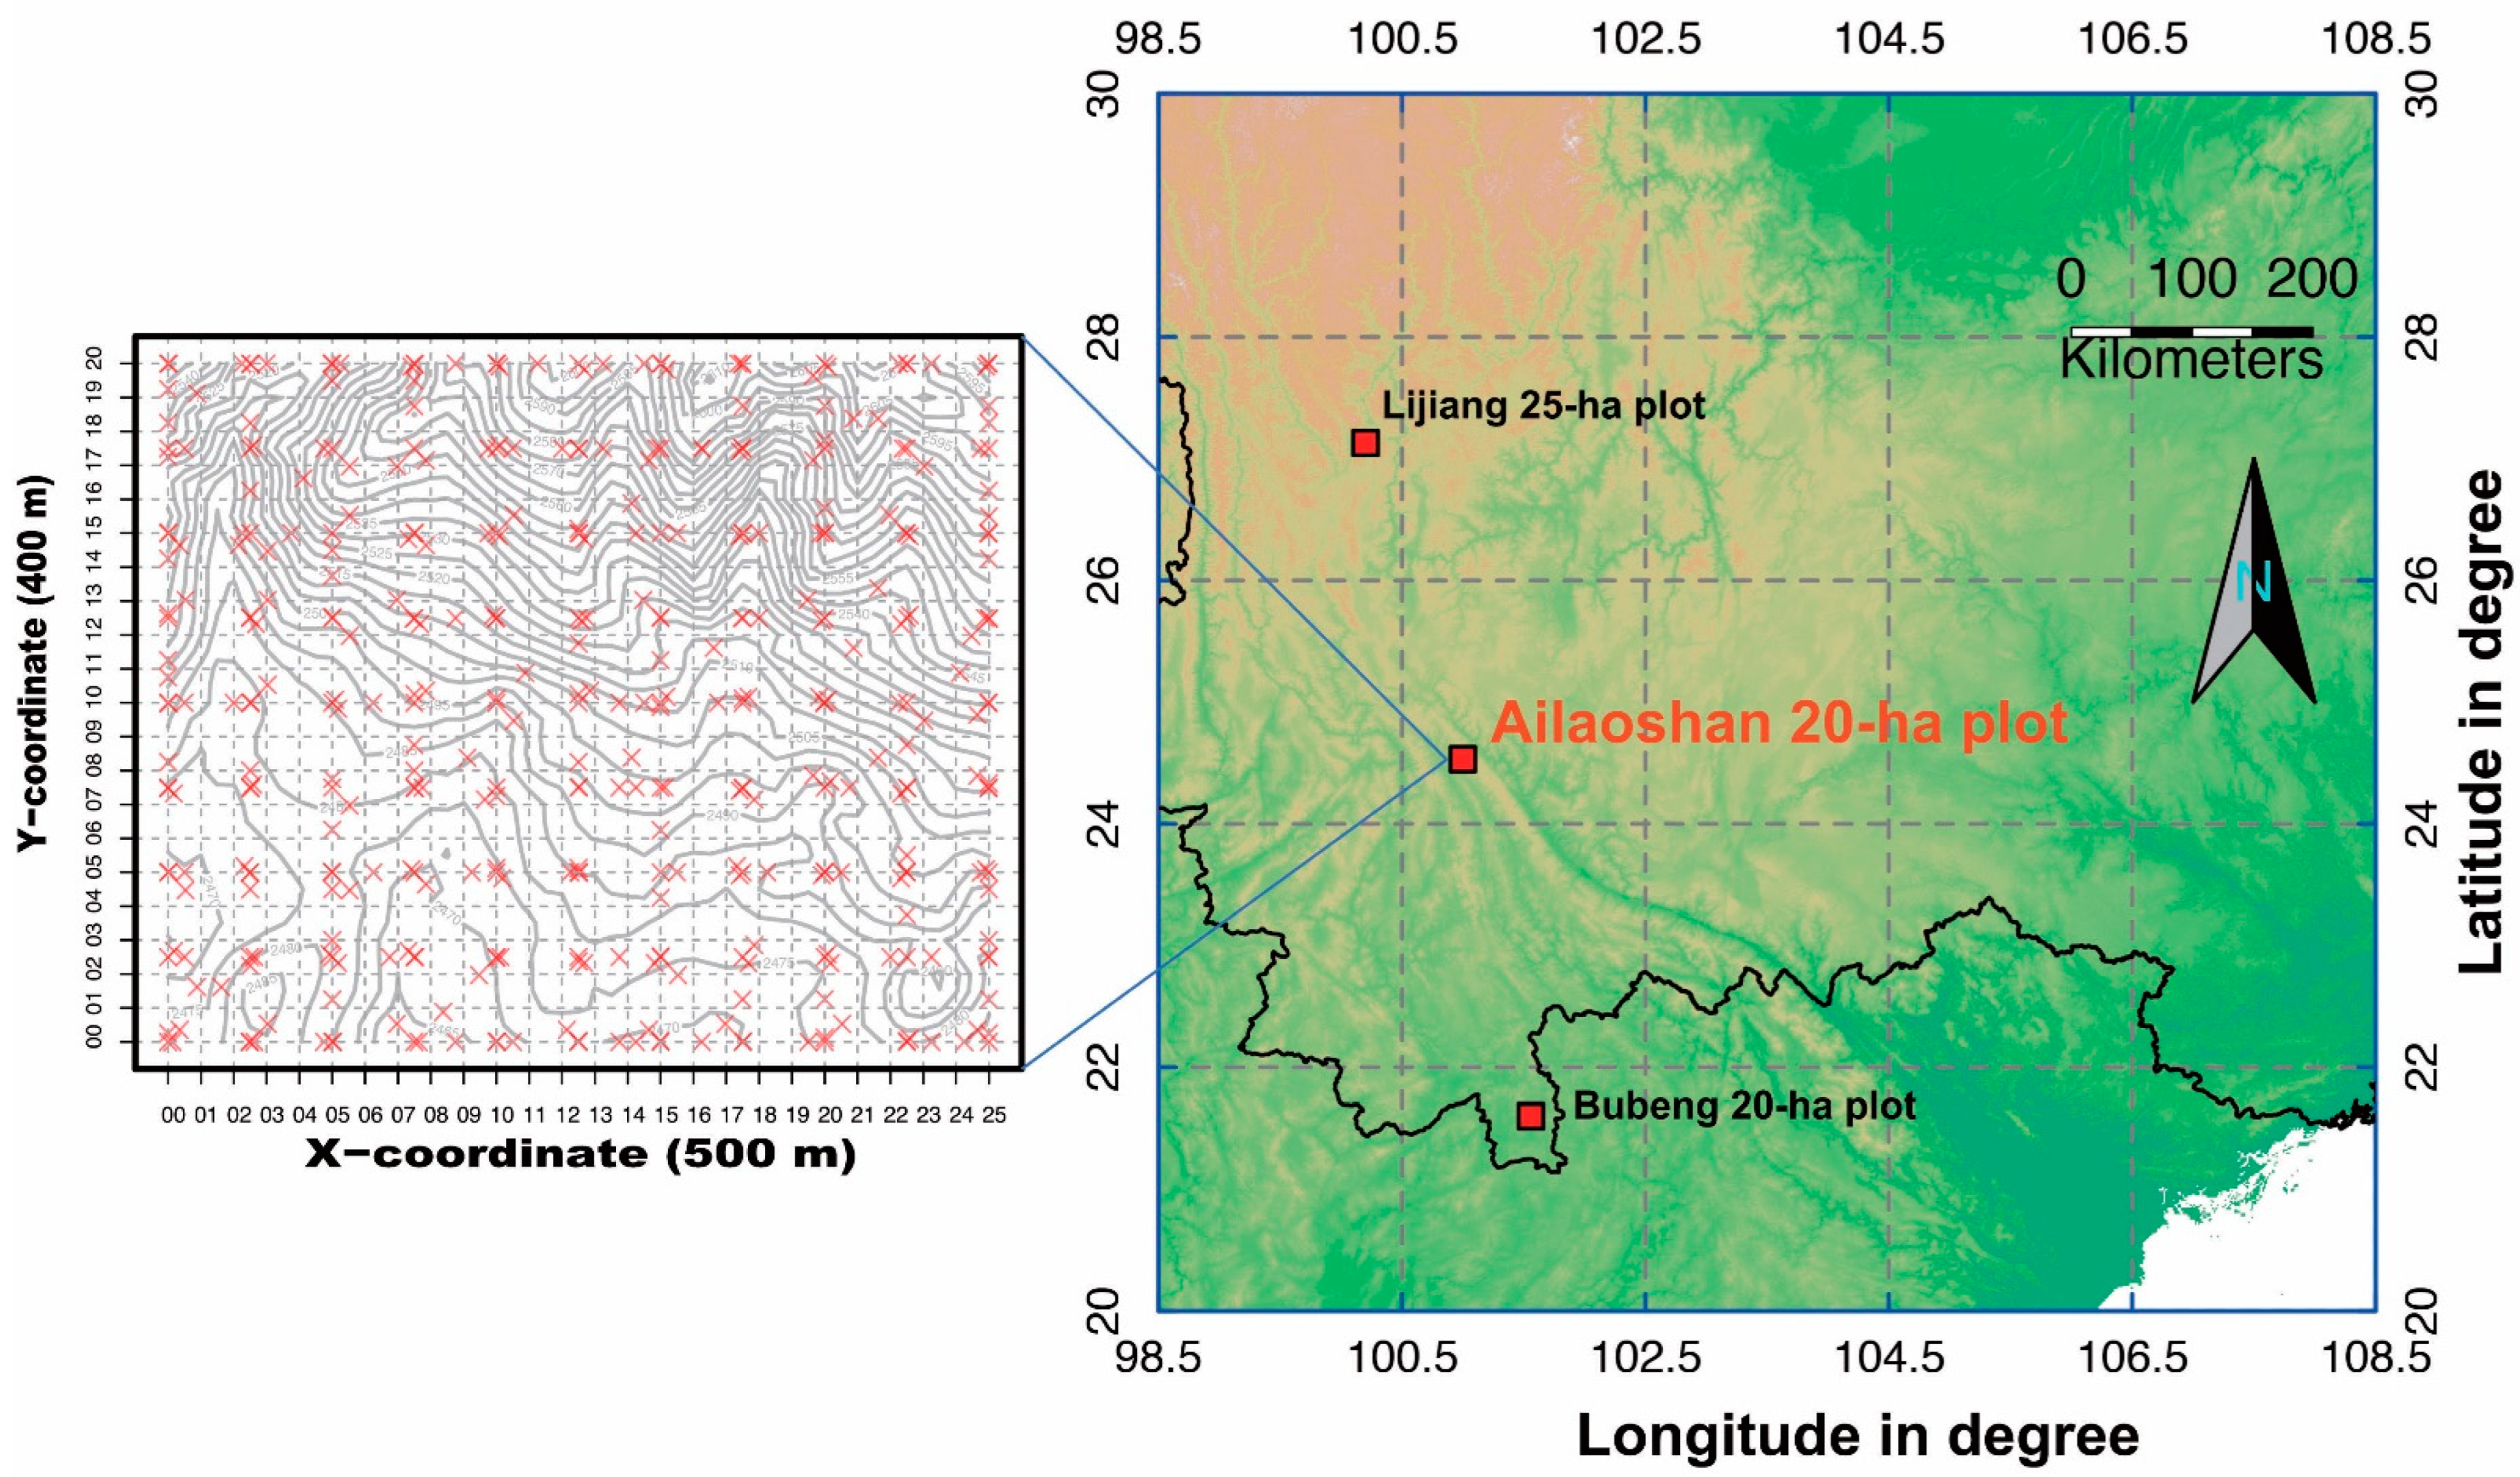
Figure 1. The location and distribution of soil samples (left) in the 20 ha Ailaoshan forest dynamics plot (right) in Southwest China. The red crosses in the left panel represent the soil samples. Grey lines are contour lines.
Forests 13 01188 g001
Figure 2. Co-occurrence networks of soil fungal communities in undefined saprotrophs (a), plant pathogens (b) and mutualists (c). OTUs are represented as nodes and correlations as edges. The node sizes are correlated to the OTU abundances, node color indicates the corresponding taxonomic assignment at phylum level, and edge width indicates the correlation strength.
Forests 13 01188 g002
Figure 3. Effect of removal of specialists (top) and generalists (bottom) on initial similarity (a,d), slope (b,e), and halving distance (c,f) of distance–decay of similarity.
Forests 13 01188 g003
Figure 4. Comparison of turnover (a), nestedness (b), β (c), and log(a) (d) between the original fungal functional guild communities and communities where specialists and generalists had been removed. The boxplots show the distributions of the four features in each of the fungal functional guild communities. A red star stands for an observed feature in a community. p.sp: specialists were removed for the putative plant pathogen community; m.sp: specialists were removed for the mutualistic community; u.sp: generalists were removed for the undefined saprotroph community; p.co: generalists were removed for the mutualistic community; m.co: generalists were removed for the mutualistic community; u.co: generalists were removed for the undefined saprotroph community.
Forests 13 01188 g004
Figure 5. Triangular plots (simplex) of the beta diversity partition for all OTU and three functional guilds. RichDiff = richness difference; Repl = species replacement. The bold numbers are median values.
Forests 13 01188 g005
Publisher’s Note: MDPI stays neutral with regard to jurisdictional claims in published maps and institutional affiliations.