Abstract
Abiotic stress is one of the environmental conditions that effects plant survival and growth. As a vital model plant and papermaking raw material, it is very important to identify the differentially expressed genes of Populus trichocarpa Torr. & A.Gray ex Hook under abiotic stress in order to cultivate stress-tolerant plants. We analyzed the whole transcription spectrum and potential differentially expressed genes of 54 groups of roots and stem-xylem sequencing sample data under cold, drought, heat and salt stress for different durations. Gene Ontology (GO) enrichment analysis showed that molecular function played a stronger role in stems’ response to abiotic stress, and genes in roots could barely respond to both cold stress and heat stress. Degree and betweenness centrality were used to identify transcription factors. It was considered that intermediate centrality is more suitable to determine whether the transcription factor is a hub gene. DNA binding was the biggest enrichment, while transcription factors responded to the abiotic stress. The multipronged approach identified in the roots and stems provides a genetic basis for resistance and more targeted genetic improvement of Populus trichocarpa. The comparison of two centralities can more effectively analyze the importance of complex gene network nodes in plants under corresponding abiotic stresses.
1. Introduction
In the process of plant growth, abiotic stresses caused by environmental changes, including cold, heat, drought, salt stress and so on, are often harmful to the survival and growth of plants; sometimes they even lead to injury, destruction and death [1]. More than that, environmental stress can disrupt cellular structures and impair key physiological functions [2]. Droughts combined with heat and large evaporative demand are thought to be the main causes responsible for observed increases in tree mortality globally among all environment extremes [3]. A good example of unfavorableness with prolonged heat stress is a drop in germination and vigor, which is accompanied by a reduction in the content of carbohydrates, lipids and proteins in Dalbergia nigra [4]. The contents of soluble sugar and soluble protein increased with the dropping temperature in broad-leaved woody plants [5]. Salt adversely impacts plant growth and development as it holds water and nutrients in the soil at high tension, making these components unavailable for plants in the root zone [6]. In order to survive in different harsh living environments, plants have evolved regulatory pathways to resist the corresponding stress. Therefore, the study of the effects of abiotic stresses on plant genes can help us understand how plants resist external environmental stresses, and it also plays a crucial role in improving the stress resistance of plants.
Populus trichocarpa Torr. & A.Gray ex Hook is the only species with a complete genome sequence in the genus Populus [7]. As a model plant in woody transgenic plants, P. trichocarpa has a relatively small genome. Therefore, the gene regulatory network of P. trichocarpa is more conducive to analyzing the cell function of woody dicotyledons when we study and analyze abiotic stress. Meanwhile, as an economic crop with the potential for bioenergy production, this study is also helpful in ameliorating the raw materials of bioenergy and understand the possible changes in plants caused by climate change.
In the present study, we proposed the differentially expressed genes (DEGs) in roots and stems of P. trichocarpa in response to cold, heat, drought and salt stress. Then, the DEGs were classified according to their functions to achieve the purpose of gene annotation and classification through enrichment analysis. These results will deepen our understanding of the gene expression changes of P. trichocarpa under different stress, different duration and different parts. They also provide a molecular basis for improving resistance and genetic improvement of P. trichocarpa.
2. Materials and Methods
2.1. RNA-seq Data Processing
The original gene expression data of Populus trichocarpa were downloaded from project PRJEB19784 in the NCBI database [8]. In the above-mentioned experiment, approximately 3-month-old plants of Western poplar (P. trichocarpa, clone Nisqually 1) were propagated from stem cuttings and grown in 2 L pots at 12 h day/12 h night photo cycles with light intensity 300 of µmoles/m2/s. For heat stress, plants were treated at 39 °C for 12 h (short term) or 7 days (prolonged). For cold stress, plants were subjected to 4 °C (night) and 12 °C (day) for 24 h (short term) or 7 days (prolonged). For drought treatment, watering was withheld until the moisture of the soil reached 0.1 m3/m3, and it was maintained at the level of 0.06–0.1 m3/m3. For a short-term drought, stress plants were grown for 5 days after water withholding (an initial leaf wilting point) or for 7 days after initial leaf wilting (prolonged treatment, 12 days after withholding water). For high salinity, stress plants were treated with 100 mM sodium chloride solution for 24 h (short term) or for 7 days (prolonged). For the high-resolution heat-cold stress, time course plants were subjected to the 24 h heat treatment (42 °C) followed by the 24 h incubation at 4 °C. Leaf tissues were collected at 0, 2, 4, 6, 8,10 and 24 h time points during the interval of each treatment. Each tissue from both short- and long-term treatments was collected in three independent biological replicates. Controls represented the same tissue types of untreated plants [8].
After removing low-quality reads with trimmomatic’s [9] default parameter, RNA-seq was compared to the reference genome of P. trichocarpa using bowtie2 [10]. Then, the RNA-seq data were analyzed by RSEM pipeline [11] and processed through paired-end sequencing mode. In this experiment, edgeR [12] software package in R was used for identification. The gene expression level was standardized and filtered with the trimmed mean of the M-values (TMM) and CPM (count per million) value. The conditions for filtering low expression samples were as follows: the minimum number of duplicate samples was 2, and each value was at least 1 per million.
2.2. Identification of Differentially Expressed Genes
When the absolute value of fold change between the mean expression of the processed sample and the mean expression of the normal sample was >2 and FDR <0.05, the gene was considered a DEG in this experiment. The results of each stress were shown on a volcanic map. Then, we identified the consensus DEGs under the same stress in a different term or several stresses at the same time. The results are exhibited by Venn diagram.
2.3. Construction of Gene Regulatory Network
Differential gene regulatory networks were constructed with the Genie3 package [13] in R whose threshold was set to 0.035. Then, they were visualized using Cytoscape (version 3.7.1) [14]. The degree of a gene represents the number of edges (interactions) that are connected to a given TF. TFs that were used to identify came from the PlantTFDB database [15]. The degree of genes showed the number of edges (interactions) that linked to another gene. The betweenness of genes refers to the number of times a given node (gene) acts as the shortest connection between other nodes. We calculated the betweenness of each TF and selected the hub genes whose betweenness or degree is beyond 0.005 after standardization.
2.4. GO Enrichment Analysis
Go enrichment analysis was performed on a given gene set using AgriGO [16] and Fisher’s exact test. The GO terms of the biological process (BP), cellular component (CC) and molecular function (MF) with FDR < 0.05 were considered to be significant.
3. Results
3.1. Illumuna-Seq and Mapping
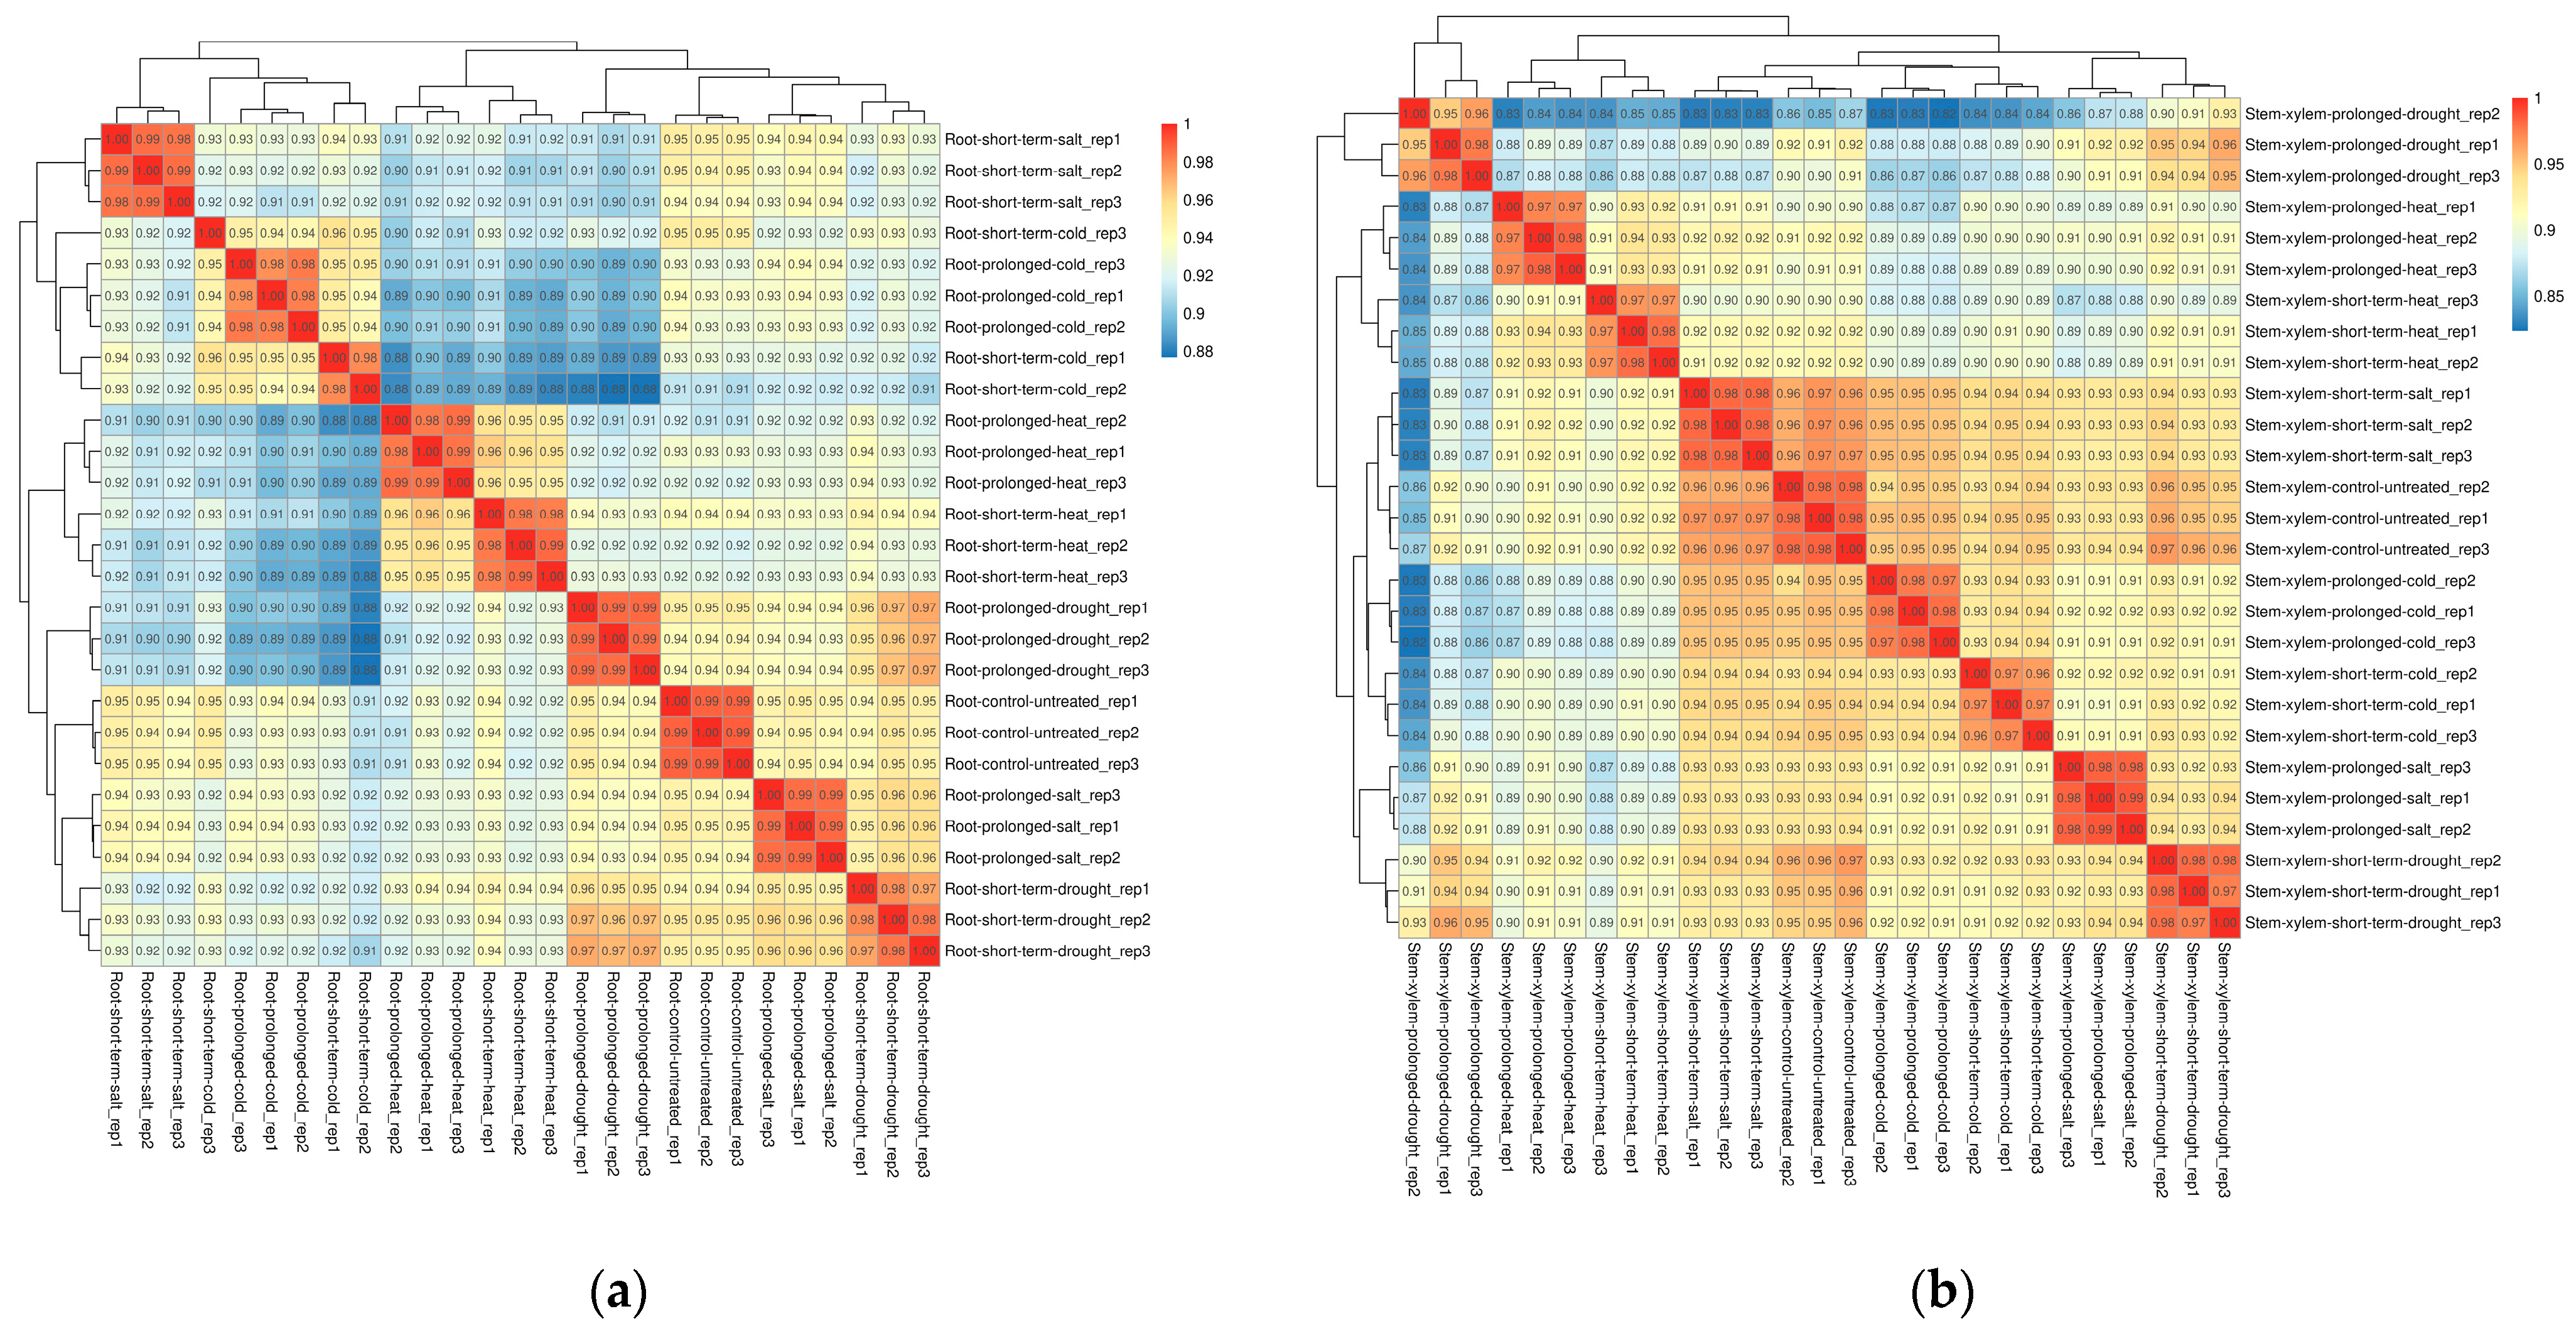
The RNA-seq data were downloaded from the SRA database of NCBI (National Center of Biotechnology Information), which includes 27 samples [8]. Roots and stems of Populus trichocarpa were subjected to four abiotic stresses, which are cold, heat, drought and salt stress. Each abiotic stress includes both prolonged and short-term treatments. Tissues of roots and stems from different treatments were collected in three independent biological replicates. The same tissue types of three untreated plants were used as controls. A total of 34,699 transcripts were identified in roots and stems using the RNA-seq data (Table S1). Spearman correlation coefficients were calculated, and the results indicated a high correlation between each of the three biological replicates, with coefficients ranging from 0.85 to 1 (Figure 1).

Figure 1.
Spearman correlation between 27 samples in roots (a) and stems (b). Decimals represent correlation coefficients. The red background represents a greater correlation coefficient.
Meanwhile, the prolonged and short-term heat stress samples in roots were most closely related. The correlation between long-term salt stress and drought stress is higher than that with short-term salt stress. Both the samples of long-term and short-term heat stress are weakly related to that of cold stress, which is the lowest correlation coefficient among these groups of abiotic stress. In stems, short-term salt stress is the most related to the control group, followed by cold stress. The correlation coefficient between prolonged salt stress and short-term drought stress is still higher than that with prolonged drought stress, short-term salt stress or other abiotic stress samples. The correspondence between prolonged and short-term drought stress is not as close as that between the two phases of other same abiotic stress.
3.2. Analysis of Differentially Expressed Genes (DEGs) in Roots and Stems
In order to further understand the transcriptomic characteristics of P. trichocarpa in response to abiotic stress, DEGs in tissues of roots and stems under cold, drought, heat and salt stress were identified (Tables S2 and S3). The number of DEGs obtained is shown in Table 1. According to the DEG numbers, we found that prolonged heat stress most affected gene expression in stems, which included 7913 DEGs. At the same time, the total number of DEGs under prolonged and short-term heat stress was much more than that under other stresses. In addition, the DEGs of stems under other stress conditions and roots under all conditions were between 4000 and 7000, except for long-term cold, short-term drought and short-term salt stress. The up-regulation and down-regulation of genes under various abiotic stresses are displayed in Table 2 and the volcano diagrams in Figure S1. The results showed that for the DEGs in roots, we identified 2679 and 2294 up-regulated genes and 2666 and 1687 down-regulated genes in short-term cold and short-term salt stress, respectively. The down-regulated genes were more than the highly expressed genes and the reverse applied under other conditions. Similarly, more highly expressed genes were found in stems under prolonged drought, short-term drought and prolonged salt stress, while the reverse was applied under other stress conditions.

Table 1.
Numbers of DEGs in roots and stems under different abiotic stresses.
Table 2.
Number of down-regulated and up-regulated DEGs in roots or stems.
The Venn diagrams show the number of consensus and different genes between long-term and short-term DEGs in each abiotic stress of the same tissue (Figure 2). A total of 2786 (44.60%) and 2060 (32.98%) DEGs in stems under cold stress was the only group with more specific genes for short-term stress than that for prolonged stress. Prolonged drought stress-specific genes were much more than short-term drought-specific genes and their consistent genes. A similar situation also occurs in DEGs under salt stress. A total of 1052 DEGs were differentially expressed in both prolonged and short-term salt stress, accounting for 54.37% of short-term salt stress DEGs. A total of 45.63% of short-term salt stress DEGs were specific. Under long-term salt stress, 4268 (80.23%) DEGs were specific, which was four times as much as the consistent DEGs and far more than the short-term salt-specific genes. In addition, the number of specific genes under prolonged heat stress, consistent genes and specific genes under short-term heat stress decreased successively, with 4207, 3706 and 2953 genes, respectively. The prolonged specific genes were about 1.42 times that of short-term specific genes. On the contrary, when the root was affected by abiotic stress, the distribution of specific genes of two durations was more balanced than that in stems. In roots, there were 2682 (33.38%) co-expressed genes under different cold stress (1089 were co-induced genes, 1544 were co-expressed genes and 49 genes were oppositely expressed), 2603 (41.06%) DEGs were co-expressed under drought stress (1003 were co-induced, 1560 were co-expressed genes and 40 genes were oppositely expressed), 3892 (45.65%) co-expressed genes under heat stress (1373 were co-induced genes, 2439 were co-expressed genes and 80 genes were oppositely expressed) and 1743 (25.99%) co-expressed genes under salt stress (651 were co-induced, 867 were co-repressed and 225 were oppositely expressed). The results showed that the proportion of genes co-repressed (60.35%) was about 1.7 times that of co-induced genes (35.27%) in roots. Moreover, the percentage of opposite expression in salt stress (12.91%) was much higher than that in other abiotic stresses (cold stress 1.83%, drought 1.54% and heat 2.06%). In stems, there were 1401 (22.43%) co-expressed genes under different durations of cold stress (393 were co-induced genes, 773 were co-repressed genes and 235 genes were oppositely expressed genes). A total of 2152 (28.56%) DEGs under drought stress were co-expressed (1272 were co-induced, 851 were co-repressed, and 29 genes were oppositely expressed). Among 3706 (34.11%) co-expressed DEGs under heat stress, 1375 were co-induced genes, 2169 genes were co-expressed and 162 genes were oppositely expressed. There were 1052 (17.10%) co-expressed genes under salt stress (387 co-induced genes, 456 co-expressed genes and 209 genes were oppositely expressed). Much of the down-regulated genes of stems under abiotic stresses were more than the up-regulated genes, apart from the down-regulated genes in the drought environment, which were fewer than the up-regulated genes. Moreover, the amount of opposite expressed genes in drought stress is the least among all DEGs, which was expressed inversely.
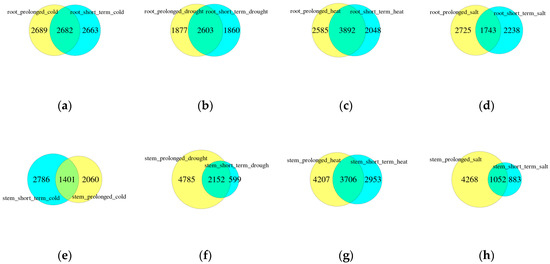
Figure 2.
Venn diagram representing the number of overlapping DEGs between different durations of each abiotic stress in roots (a–d) and stems (e–h). The circle on the left indicates having more DEGs.
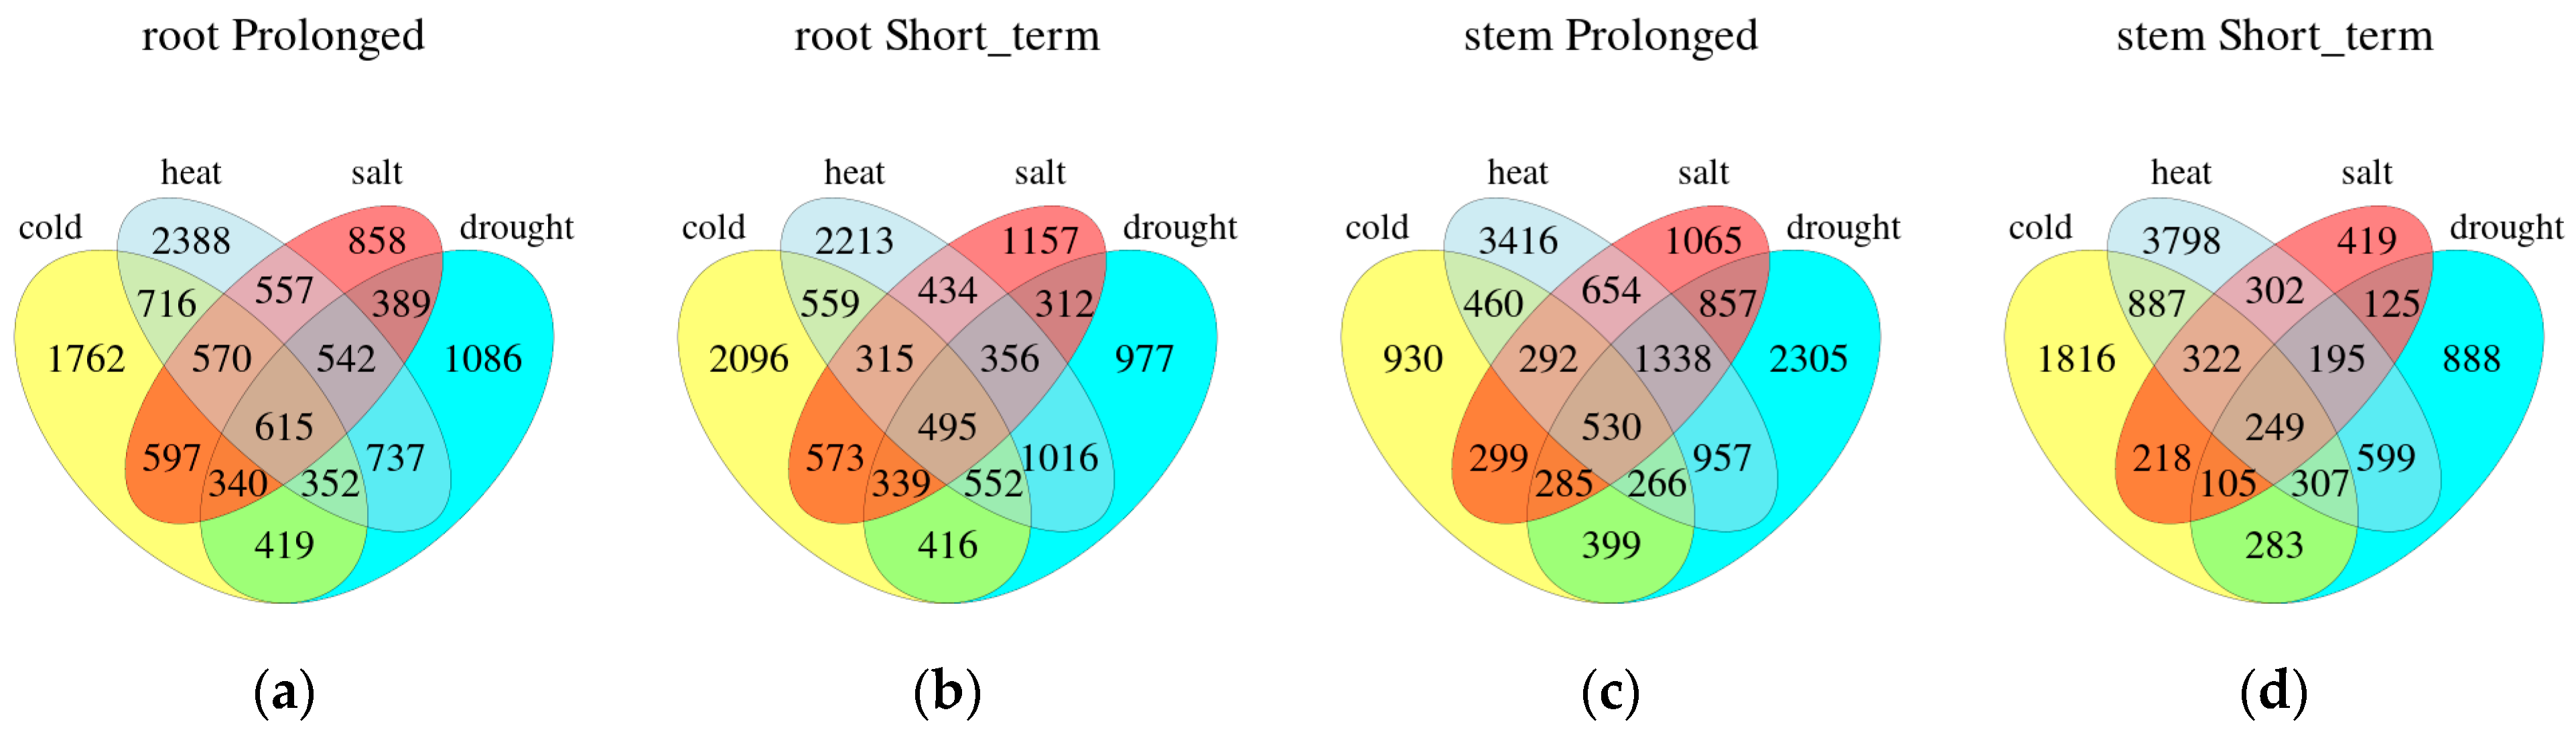
We also compare different stresses for the same duration in one organization (Figure 3). On the basis of the Venn plots, there were 615 (5.16%) common DEGs in roots and 530 (3.77%) in stems under four long-term stresses. In four short-term stress conditions, 495 (4.19%) DEGs were in roots and 249 (2.37%) in stems. Regardless of the duration, the number of common DEGs in roots was more than that in stems. There were more co-expressed DEGs in roots under heat and drought stress, which were 737 DEGs with prolonged stress and 1016 DEGs with short-term stress. Under long-term abiotic stress, roots had 1762, 2388, 858 and 1086 DEGs, while stems had 930, 3416, 1065 and 2305 DEGs specific to cold, heat, salt and drought stress, respectively. In short-term stress, 2096, 2213, 1157 and 977 DEGs in roots had the specificity of cold, heat, salt and drought stress, and 1816, 3798, 419 and 888 DEGs in stems also had the specificity of these stresses, respectively.

Figure 3.
Comparison of each stress treatment during the prolonged (a,c) or short-term (b,d) phases within the same tissue type. Venn diagram illustrating the overlap of genes that are stress-regulated expressed differentially.
3.3. GO Enrichment Analysis
For the purpose of studying the biological function of common genes under the same abiotic stress in roots or stems, we performed a GO enrichment analysis. The number and name of biological process (BP), molecular function (MF) and cellular component (CC) categories in root and stems of P. trichocarpa that were significantly affected by abiotic stress are shown in Table 3 and Figure S2. We found that in the same abiotic stress, the content of DEGs and the number of enrichments in roots and stems were different. Interestingly, although the total number of DEGs in stems was much higher than that in roots under heat stress, the number of significant enrichments in stems and roots was contrary to the results. A total of 23 BP, 21 MF and 6 CC metabolic categories were affected in roots, while 17 BP, 3 MF and 0 CC metabolic categories were significantly enriched in stems of P. trichocarpa.
Table 3.
Numbers of GO terms assigned to DEGs in roots and stems.
In roots, “oxidation reduction” in MF categories and “oxidoreductase activity” in BP categories were the common enrichment of four abiotic stresses. Together with “iron ion binding”, they were the top three significant enrichments in drought, high temperature and salt stress. Under drought and high-temperature stress, the degree of “oxidation reduction” was slightly lower than “iron ion binding” under salt stress. The two enrichments related to the oxygen reaction mentioned above were also the only enrichments between heat stress and cold stress. Cold, drought and salt stress also shared significant enrichments of “transcription regulator activity” and “transcription factor activity”. Among them, the common enrichments of cold and salt stress also included the “regulation of biosynthetic process”, “regulation of cellular metallic process” and 20 other terms. Meanwhile, “oxidation reduction” was the second-most enriched category among GO terms, which ranked behind “oxidative activity” in MF categories under drought and heat stress. “Transcription regulator activity”, “regulation of biosynthetic process”, “regulation of macroscopic biosynthetic process and regulation of cellular biosynthetic process” were the main enriched GO term in cold stress. The common significant enrichments of heat and drought stress were the highest, including 5 BPs (“response to biological stimulus”, “microtubule based process”, etc.), 19 MFs (“cation binding”, “ion binding”, etc.) and 2 CC categories (“chromosomal part”, “chromosome”). “Electron carrier activity”, “heme binding”, “tetrapyrrole binding”, “antioxidant activity”, etc., were significantly enriched among drought, heat and salt stress. In addition, there were no other common significant enrichments under heat and salt stress. There were five common enrichments such as “response to chemical stimulus”, “transcription factor activity”, “transcription regulator activity”. The enrichment of “metal ion transport” and so on was only significantly affected by salt stress.
The results implied that the most significant enrichments in stems were basically concentrated in MF categories, in which transcription factor activity was most significantly enriched in drought and cold stress. It was also the main enrichment in salt stress. There were not many significant terms in heat stress, and the top two were “small molecular biological process” and “protein folding” in BP terms. Moreover, there was almost no common enrichment between heat and any other stress. The “microtubule based process” was the only enrichment between heat and drought stress. Obviously, four abiotic stresses had no common enrichment in stems, and all the same enrichment between cold and drought stress were almost the same as that among cold, drought and salt stress; that is, the DEGs significantly enriched by cold and drought are almost also significantly affected by salt stress, such as the regulation of transcription, DNA dependent, transcription regulator activity, etc. Undoubtedly, there were still many genes that were over-expressed only in a certain abiotic stress, such as “regulating fat acid synthase activity”, which only exists in the rich concentration in response to cold stress, indicating that these genes may only participate in signal transduction pathways or other regulatory networks in response to this stress.
3.4. Functional Enrichment Analysis of TFs in Response to Abiotic Stress
The abundance of experiments shows that different transcription factors play different and important regulatory roles in plant response to various abiotic stresses. In order to study the overall trend of transcriptome regulation mechanism in roots and stems of P. trichocarpa under abiotic stress, we identified the TFs of all DEGs in each abiotic stress within the same tissue type and displayed the network with TFs and target genes in Figure S3. The number of transcription factors significantly expressed is shown in Table 4 and Table S4. The hub genes that have a betweenness >0.005 in stems and roots of P. trichocarpa are shown in Table S5. All stresses treatment within the same tissue type induced both unique and common subsets of enrichments (Figure 4).
Table 4.
Numbers of TFs related to DEGs in roots and stems.

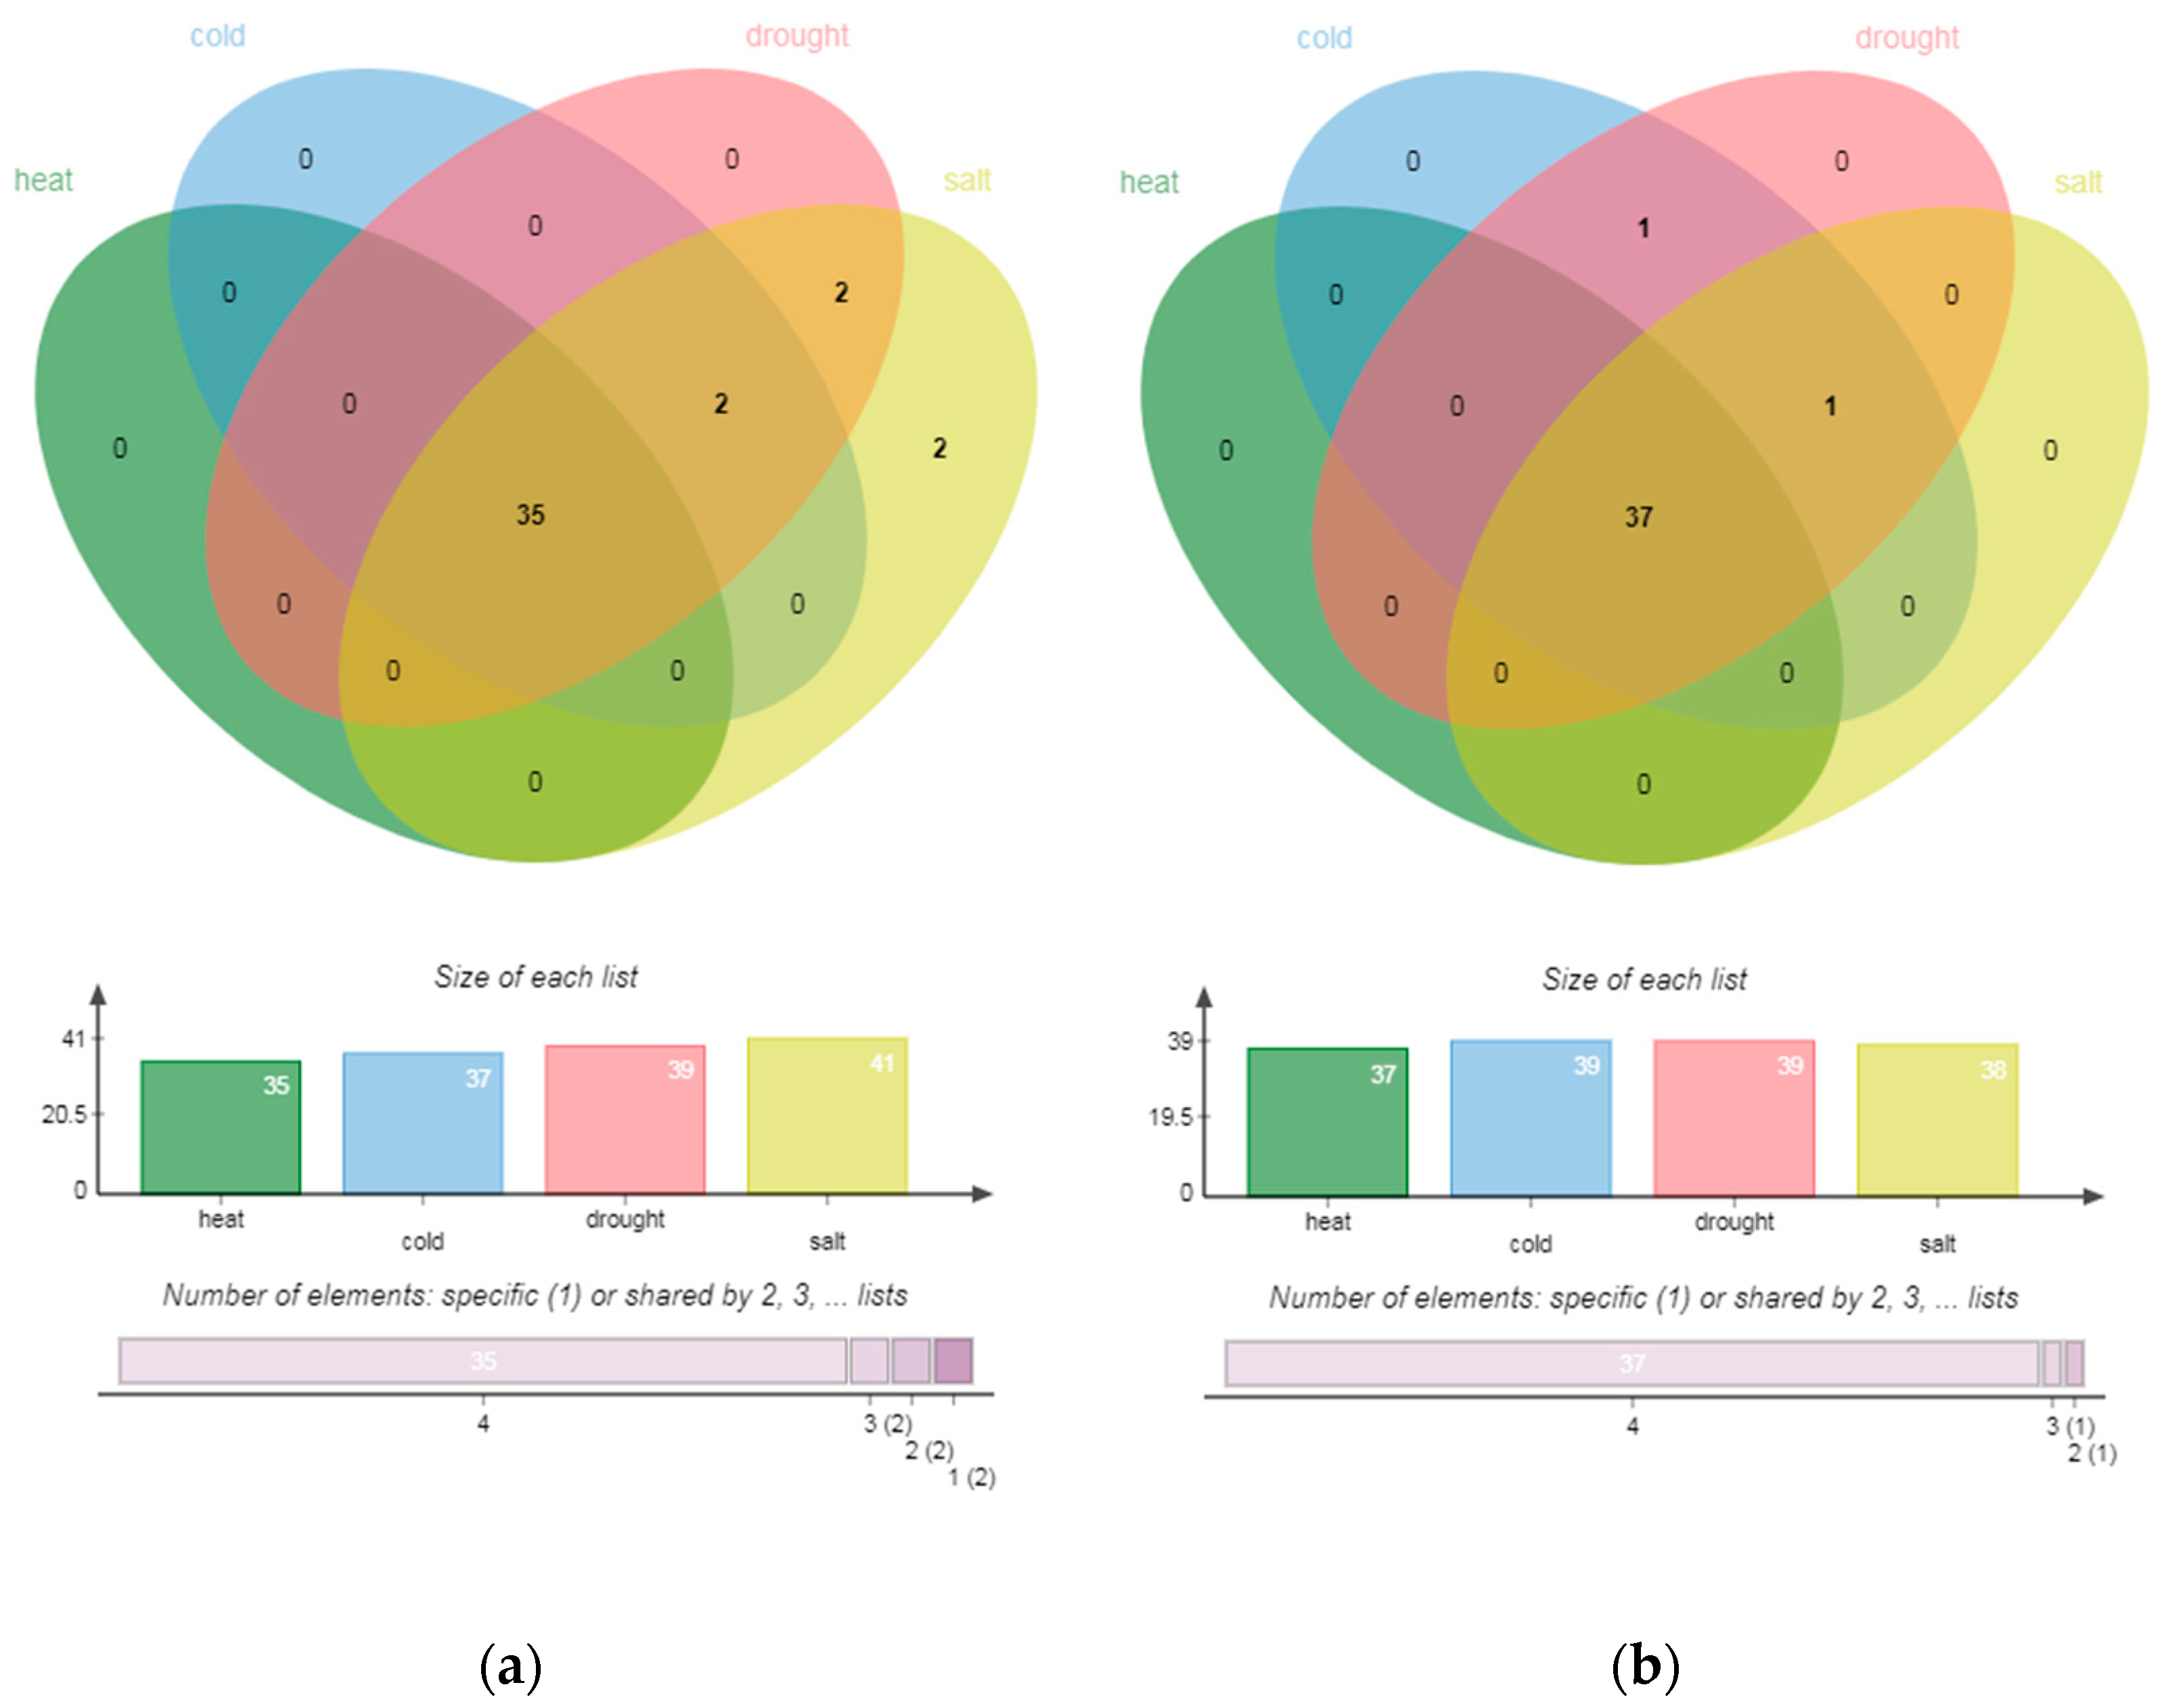
Figure 4.
Venn diagrams showing the intersection among GO enrichments of each stress treatment from roots (a) and stems (b). Both short-term and prolonged treatments were combined for each stress type.
There were five common hub genes in roots under temperature stresses; cold and salt stress also had five; drought and salt had two; drought and cold had one. In the groups, temperature stresses, cold and salt, drought and heat, each had two common hub genes in stems. Moreover, one common hub gene existed among cold, heat and salt stress. Strangely, the degree of each transcription factor was not very high. Thus, there was no hub gene obtained through degree centrality. Most of the enrichments regulated by hub genes in the two parts of P. trichocarpa came from BP, but the weight (−log10 (p-value)) of some MF terms were very high in each environment. Moreover, there was no enrichment of CC categories. The Venn diagram of enrichments under each abiotic stress is shown in the figure. In roots, there were 35 enrichments under heat stress, of which 31 were BP terms and 4 were MF terms. These were also the enrichments regulated by hub genes in all abiotic stresses, of which the most significant enrichment was “DNA binding”. Common GO terms in cold, drought and salt stress were “binding” and “sequence-specific DNA binding”. “Cellular process” and “metallic process” were only enriched in drought and salt stress. “Protein dimerization activity” is specifically expressed in roots, indicating the tissue-specific mechanism of salt resistance of P. trichocarpa.
In stems, 39 hub genes were under cold stress, 39 were under drought stress, 3 were under heat stress and 10 were under salt stress. The common enrichments of the four abiotic stresses in stems were still the same as the total enrichments of heat stress, including 31 BP terms and 6 MF terms, which were also mainly enriched in “DNA binding”. The enriched common MF terms also included “transcription regulator activity”, “nuclear acid binding”, “sequence specific DNA binding” and “binding”. Biological processes related to all these stresses, including “regulation of RNA metabolic process”, “regulation of transcription” and “regulation of transcription, DNA-dependent” were the mainly enriched BP terms. The common enrichment of low temperature, drought and salt stress was also the “cellular process” of BP. In addition to the enrichment mentioned above, cold and drought had another common enrichment, which was “metabolic process” from BP. The four abiotic stresses had no specific enrichment.
4. Discussion
4.1. Correlation Characteristics of Original Data
Feature selection can not only make the multivariable prediction more accurate but also provide some ideas for judging the relationship between gene expression. The regulatory mechanism of roots in response to these two stresses may not be very similar because the correlation coefficient of temperature stress is the lowest among several groups of abiotic stress.
In stems, the correlation between long-term drought stress and short-term drought stress is not as good as their correlation with other stresses, indicating that the stems genes of Populus trichocarpa may change greatly with the extension of drought duration.
4.2. Differential Gene Expression between Roots and Stems
Compared with stems, more DEGs were detected in roots under cold stress, short-term drought stress and short-term salt stress. These results show that the expression of genes in roots is more sensitive in the above-mentioned abiotic stresses and more stable in other stresses than that in stems. However, both plant tissues are generally more vigorous in long-term heat stress. DEGs in short-term cold stress only were more than that in long-term ones.
Most of the root genes showed co-up-regulation or co-down-regulation in the same abiotic stress, and only a few DEGs displayed opposite expression profiles in the two time periods, indicating that the P. trichocarpa may be highly coordinated through similar biological processes to optimize the adaptation of root tissue to the whole process of abiotic stress. In addition, the number of common DEGs in roots of P. trichocarpa under heat and drought stress was the most among all the long-term abiotic stress, suggesting that the probability of similar cooperative mechanisms and biological processes in roots in response to the two abiotic stresses is greater than that of other abiotic stresses. Under drought stress, the genes jointly inhibited were far more than the genes jointly induced, which was contrary to the results of stems under drought stress. Furthermore, both the opposite expression profiles of DEGs in the two parts were very few, which revealed that if new co-expressed DEGs appear, their expression patterns are more likely to be down-regulated within two time periods while they may be up-regulated in stems.
Short-term high salt concentrations make the differentially expressed genes in stems far fewer than those in other stresses, indicating that the expression profiles of most genes, in this case, are more stable than those under others. The specific genes of long-term drought stress were much more than the co-expressed DEGs and the specific genes of short-term drought stress. Moreover, most (78.23%) DEGs under short-term drought stress were consistent with the long-term drought stress DEG, implying that most genes responding to short-term drought will run through the whole drought resistance process. However, with the extension of drought time, there will be more genes involved in the drought resistance process. The same conclusion may also be applicable to DEGs of stems under salt stress.
4.3. Functional Classification of Differentially Expressed Genes
After GO annotation, we identified the most dominant terms. There was no same enrichment under temperature stresses except for the common enrichment of the four stresses, implying that there are not many similar strategies for the root genes of P. trichocarpa in response to these two stresses, which is consistent with the conclusion reached in the previous similarity test. High salt, cold injury and heat injury will lead to oxidative stress and then affect plant development. In our study, their common significant enrichments were mostly related to “oxidative reaction and photosynthesis”. High salinity leads to ionic toxicity dominated by sodium ions. Low K+, excess Mg2+ and high pH (low H+) produce cytoplasmic Ca2+ signals, which will activate sos3 (cbl4)/schabp8 (cbl10)-sos2 (cipk24), CBL1/9-cipk23, cbl2/3-cipk3/9/23/26 and schabp1 (cbl2)-pks5/24 (cipk11/14), phosphorylate and regulate Sos1 (Na+/H+ reverse transport), AKT1 (K+ channel), potential Mg2+ transporter and H+-ATPase activity [17]. The results proved that the salt resistance of Populus trichocarpa is closely related to metal ion transport.
Obviously, genes of stems significantly affected by abiotic stress acted as a pivotal part in the MF category. The results implied that these GO genes related to regulating various processes are more likely involved in the regulation of stem stress resistance. The genes regulating protein folding, analytical structure development, analytical structure morphogenesis, cell morphogenesis, the cellular development process and cellular amino acid biological process were affected by heat stress, suggesting that they may participate in the adaptation of stems and roots to heat stress, but do not change much in response to other stresses. Several studies have revealed that histone dynamics took part in the heat-stress response [18,19]. In general, the principal function of heat shock proteins (HSPs) is to regulate protein folding and unfolding, in conjunction with their subcellular localization and the degradation of unfolded and denatured proteins. Almost all genes of root and stems responding to abiotic stress have the “oxidoreductase activity” term, or at least “oxidoreductase activity” of “acting on paired doners, with incorporation or reduction of molecular oxygen” term. These results are similar to some previous studies, ROS and transcription factors play key regulatory roles in response to abiotic stress [20], indicating the conserved function of various plant species in response to abiotic stress. Recently, many studies have revealed that the dismutation of reactive oxygen species (ROS) and dehydrin genes cooperate to improve the tolerance of plants to different stresses [21,22,23]. Plants exposed to abiotic stress exhibit enhanced levels of ROS, which are highly reactive and toxic and affect the biosynthesis of chlorophyll, photosynthetic capacity, carbohydrates, proteins, lipids and antioxidant enzyme activities [24].
4.4. Centrality Analysis Method of TFs Importance and Its Role in Abiotic Stress Response
Transcription factors are vital factors that play regulatory roles in the process of biological life activities. They were characterized by containing one or more DNA binding domains (DBDs). By combining these binding domains with DNA sequences near genes, many various response pathways and functions of plants under abiotic stress are regulated. Therefore, when P. trichocarpa receives various abiotic stress stimuli in the experiment, transcription factors regulate the corresponding gene expression and combine with the gene template chain. The biggest enrichment is “DNA binding”. The enrichment coincidence regulated by transcription factors was very high in different abiotic stresses, which also suggested that transcription factors may have many similarities in response to abiotic stresses. Transcription factor action is finely modulated by mechanisms involving their synthesis, subcellular location and activity, usually through interaction with other proteins and/or posttranslational modifications [25]. Moreover, microRNAs (miRNAs) and long non-coding RNAs (lncRNAs) are known to react defensively throughout varied stress conditions [26]. The miRNA expression analysis by GO and KEGG in cucumber (Cucumis sativus L.) showed that the target genes of the miRNAs were involved within the four KEGG pathways under heat stress, together with ribosome biogenesis in eukaryotes (ko03008), RNA degradation (ko03018), RNA transport (ko03013), the mRNA surveil-lance pathway (ko03015) and other metabolites [27]. MiR-164, miR-396 and its family with their target genes play a key role in responding to cold stress in cassava [28]. On account of the highly enriched TFs in this study, the “regulation of RNA metabolic process” can be considered important for P. trichocarpa abiotic tolerance.
It is not difficult to find that the regulation network of P. trichocarpa in response to abiotic stress is very complex from the transcription factor regulation map. In the process of studying the centrality of transcription factors, we noticed that the degree of centrality of each transcription factor was not high enough to be seen as a hub gene, while the use of betweenness centrality leads to more effective results. After analysis, it is considered that the gene expression regulation network can be formed due to the mutual regulation of multiple genes. Degree centrality [29] describes the most direct importance of a gene in the network, while betweenness describes the difficulty of nodes passing through other nodes in the network [30]. The simpler the path of a gene regulating other genes through this node (gene), the more crucial the gene is in the network. In the complicated regulatory network of P. trichocarpa, the regulatory role of a single transcription factor is relatively small, while the overall cooperation of transcription factors is more obvious. Hence, the results of betweenness centrality are not only more ideal than those of degree centrality but also can have a better reflection on the global structure of the network.
5. Conclusions
In this study, we analyzed the DEGs of roots and stems under four abiotic stresses in different durations and identified the tissue-specific abiotic response genes and TFs horizontally and vertically. The results provided the common and specific characteristics of transcriptomes in responding to these stresses comprehensively and macroscopically. The extensive enrichment of “oxidoreductase activity” in roots and genes that transcript various processes in stems verified the conserved functions of distinct plant species under abiotic stress. Genes in the roots of Populus trichocarpa did not have many similar strategies in response to cold and heat stress. We likewise identified the enrichments of TFs, which were seen as hub genes and considered that the betweenness centrality was more suitable for the determination of whether TFs were hub genes. Honestly, our study has limitations that are based on bioinformatics analysis. Overall, the list of roots and stems response transcripts increases our understanding of the aboveground and underground biological characteristics of P. trichocarpa under abiotic stress.
Supplementary Materials
The following supporting information can be downloaded at: https://www.mdpi.com/article/10.3390/f13081300/s1, Table S1: The TMM of the transcripts in roots and stem-xylem; Table S2: The expression profile of the transcripts in roots; Table S3: The expression profile of the transcripts in stem-xylem; Table S4: The transcription factors significantly expressed in each stress treatment within roots and stems; Table S5: The hub genes with betweenness >0.005 in stems and roots; Figure S1: Volcano plot of DEGs in roots and stems indicating the expression changes of transcripts across all the treatments during prolonged and short-term durations. Red and green dots represent the up-regulated and down-regulated transcripts, respectively; Figure S2: Bar charts of GO terms assigned to DEGs in roots and stems; Figure S3: Network with TFs and DEGs of each stress treatment within roots and stems. Lists of target genes were combined across short-term and prolonged treatments.
Author Contributions
Conceptualization, W.J.; Formal analysis and visualization, R.T.; Project Administration, Y.L. and R.T.; Writing—original draft, R.T.; Writing—review and editing, Y.L. and R.T. All authors have read and agreed to the published version of the manuscript.
Funding
This research was funded by the Fundamental Research Funds for the Central Universities, grant number 2572018AB34.
Institutional Review Board Statement
The study did not require ethical approval.
Informed Consent Statement
The study did not involve humans.
Data Availability Statement
Not applicable.
Acknowledgments
We thank the reviewers and editors for their work. We also thank the team of Pankaj Jaiswal for their excellent work, which provided the materials used for this experiment.
Conflicts of Interest
The authors declare no conflict of interest.
References
- Krasensky, J.; Jonak, C. Drought, salt, and temperature stress-induced metabolic rearrangements and regulatory networks. J. Exp. Bot. 2012, 63, 1593. [Google Scholar] [CrossRef] [PubMed]
- Larcher, W. Physiological Plant Ecology. Ecophysiology and Stress Physiology of Functional Groups, 4th ed.; Springer Science & Business Media: New York, NY, USA, 2003; Volume 47, p. 500. [Google Scholar]
- Allen, C.D.; Breshears, D.D.; Mcdowell, N.G. On underestimation of global vulnerability to tree mortality and forest die-off from hotter drought in the Anthropocene. Ecosphere 2015, 6, 1–55. [Google Scholar] [CrossRef]
- Ingridh, M.S.; Julcinara, O.B.; Thuanny, L.; Tamyris, D.M.; Palacio, D.; Muniz, D.; Benvindo, D.; Bestete, D.; Vinicius, W.; Wagner, C.O. Heat Stress Affects the Physiological and Biochemical Quality of Dalbergia nigra Seeds in vitro. For. Sci. 2021, 67, 731–739. [Google Scholar]
- Sifan, L.I.; Mengyan, L.I.; Zhang, R.; Leng, P.; Shen, M.J. The Comparison of Cold tolerance of Three Species of Evergreen Broad-leaved Woody Plants. Agric. Biotechnol. 2021, 10, 6. [Google Scholar]
- Song, Q.; Joshi, M.; Joshi, V. Transcriptomic Analysis of Short-Term Salt Stress Response in Watermelon Seedlings. Int. J. Mol. Sci. 2020, 21, 6036. [Google Scholar] [CrossRef]
- Tuskan, G.A.; DiFazio, S.; Jansson, S.; Bohlmann, J.; Grigoriev, I.; Hellsten, U.; Putnam, N.; Ralph, S.; Rombauts, S.; Salamov, A.; et al. The Genome of Black Cottonwood, Populus trichocarpa (Torr. & Gray). Science 2006, 313, 1596–1604. [Google Scholar] [CrossRef]
- Filichkin, S.A.; Michael, H.; Dharmawardhana, P.D.; Singh, S.K.; Christopher, S.; Asa, B.H.; Reddy, A.S.N.; Pankaj, J. Abiotic Stresses Modulate Landscape of Poplar Transcriptome via Alternative Splicing, Differential Intron Retention, and Isoform Ratio Switching. Front. Plant Sci. 2018, 9, 5. [Google Scholar] [CrossRef]
- Edgar, R.C. Search and clustering orders of magnitude faster than BLAST. Bioinformatics 2010, 26, 2460–2461. [Google Scholar] [CrossRef]
- Langmead, B.; Salzberg, S.L. Fast gapped-read alignment with Bowtie 2. Nat. Methods 2012, 9, 357–359. [Google Scholar] [CrossRef]
- Li, B.; Dewey, C.N. RSEM: Accurate transcript quantification from RNA-Seq data with or without a reference genome. BMC Bioinform. 2011, 12, 323. [Google Scholar] [CrossRef]
- Robinson, M.; Mccarthy, D.; Smyth, G.K. Nursing, p. edgeR: Differential expression analysis of digital gene expression data. Bioinformatics 2010, 26, 139. [Google Scholar] [CrossRef] [PubMed]
- Huynh-Thu, V.A.; Irrthum, A.; Wehenkel, L.; Geurts, P. Inferring Regulatory Networks from Expression Data Using Tree-Based Methods. PLoS ONE 2010, 5, e12776. [Google Scholar] [CrossRef] [PubMed]
- Shannon, P. Cytoscape: A Software Environment for Integrated Models of Biomolecular Interaction Networks. Genome Res. 2003, 13, 2498–2504. [Google Scholar] [CrossRef]
- Jin, J.; Feng, T.; De-Chang, Y.; Yu-Qi, M.; Lei, K.; Luo, J.; Gao, G. PlantTFDB 4.0: Toward a central hub for transcription factors and regulatory interactions in plants. Nucleic Acids Res. 2017, 45, D1040–D1045. [Google Scholar] [CrossRef]
- Tian, T.; Yue, L.; Hengyu, Y.; Qi, Y.; Xin, Y.; Zhou, D.; Wenying, X.; Zhen, S. AgriGO v2.0: A GO analysis toolkit for the agricultural community, 2017 update. Nucleic Acids Res. 2017, 45, W122–W129. [Google Scholar] [CrossRef] [PubMed]
- Zhu, J.K. Abiotic Stress Signaling and Responses in Plants. Cell 2016, 167, 313–324. [Google Scholar] [CrossRef]
- Yang, C.; Shen, W.; Chen, H.; Chu, L.; Xu, Y.; Zhou, X.; Liu, C.; Chen, C.; Zeng, J.; Li, Q.; et al. Characterization and subcellular localization of histone deacetylases and their roles in response to abiotic stresses in soybean. BMC Plant Biol. 2018, 18, 226. [Google Scholar] [CrossRef]
- Lamke, J.; Brzenzinka, K.; Altmann, S.; Baurle, I. A hit-and-run heat shock factor governs sustained histone methylation and transcriptional stress memory. EMBO J. 2016, 35, 162–175. [Google Scholar] [CrossRef]
- Mittler, R. Oxidative stress, antioxidants and stress tolerance. Trends Plant Sci. 2002, 7, 405–410. [Google Scholar] [CrossRef]
- Halder, T.; Upadhyaya, G.; Basak, C.; Das, A.; Chakraborty, C.; Ray, S. Dehydrins Impart Protection against Oxidative Stress in Transgenic Tobacco Plants. Front. Plant Sci. 2018, 9, 136. [Google Scholar] [CrossRef]
- Halder, T.; Agarwal, T.; Ray, S. Isolation, cloning, and characterization of a novel Sorghum dehydrin (SbDhn2) protein. Protoplasma 2016, 253, 1475–1488. [Google Scholar] [CrossRef] [PubMed]
- Xu, H.X.; Li, X.Y.; Xu, C.J.; Chen, J.W. Overexpression of Loquat Dehydrin Gene EjDHN1 Promotes Cold Tolerance in Transgenic Tobacco. Russ. J. Plant Physiol. 2018, 65, 69–77. [Google Scholar] [CrossRef]
- Anwar, A.; Kim, J.K. Transgenic Breeding Approaches for Improving Abiotic Stress Tolerance: Recent Progress and Future Perspectives. Int. J. Mol. Sci. 2020, 21, 2695. [Google Scholar] [CrossRef] [PubMed]
- Gonzalez, D.H. Introduction to Transcription Factor Structure and Function. In Plant Transcription Factors; Academic Press: Cambridge, MA, USA, 2016; pp. 3–11. [Google Scholar] [CrossRef]
- Biswas, A.; Sen, B.; Bandyopadhyay, S.; Mal, C. Co-regulatory functions of miRNA and lncRNA in adapting biotic and abiotic stress in economically important dicot plants. Plant Gene 2021, 26, 100275. [Google Scholar] [CrossRef]
- He, X.; Guo, S.; Wang, Y.; Wang, L.; Sun, J. Systematic identification and analysis of heat-stress-responsive lncRNAs, circRNAs and miRNAs with associated co-expression and ceRNA networks in cucumber (Cucumis sativus L.). Physiol. Plant 2020, 168, 736–754. [Google Scholar] [CrossRef]
- Li, S.; Cheng, Z.; Peng, M. Genome-wide identification of miRNAs targets involved in cold response in cassava. Plant Omics 2020, 13, 57–64. [Google Scholar] [CrossRef]
- Opsahl, T.; Agneessens, F.; Skvoretz, J. Node centrality in weighted networks: Generalizing degree and shortest paths. Soc. Networks 2010, 32, 245–251. [Google Scholar] [CrossRef]
- Freeman, L.C. Centrality in social networks conceptual clarification. Soc. Netw. 1978, 1, 215–239. [Google Scholar] [CrossRef]

Publisher’s Note: MDPI stays neutral with regard to jurisdictional claims in published maps and institutional affiliations. |
© 2022 by the authors. Licensee MDPI, Basel, Switzerland. This article is an open access article distributed under the terms and conditions of the Creative Commons Attribution (CC BY) license (https://creativecommons.org/licenses/by/4.0/).