Article

Comparison of Soil Microbial Community between Managed and Natural Vegetation Restoration along a Climatic Gradient in Karst Regions

1
College of Environment and Ecology, Hunan Agricultural University, Changsha 410128, China
2
Key Laboratory of Agro-Ecological Processes in Subtropical Region, Institute of Subtropical Agriculture, Chinese Academy of Sciences, Changsha 410125, China
3
Huanjiang Observation and Research Station for Karst Ecosystems, Huangjiang 547100, China
4
Guangxi Key Laboratory of Karst Ecological Processes and Services, Huangjiang 547100, China
5
Guangxi Industrial Technology Research Institute for Karst Rocky Desertification Control, Nanning 530201, China
*
Authors to whom correspondence should be addressed.
Forests 2023, 14(10), 1980; https://doi.org/10.3390/f14101980
Submission received: 29 August 2023 / Revised: 21 September 2023 / Accepted: 27 September 2023 / Published: 30 September 2023

Abstract

:
Managed and natural vegetation restorations are two vital measures of land restoration; however, their effects on soil microbial communities at a large scale are not clearly understood. Hence, changes in the microbial community composition after 15 years of vegetation restoration along a climatic gradient in the subtropical karst region of Southwest China were assessed based on phospholipid fatty acids (PLFAs) profiles. Managed (plantation forest) and natural (naturally recovered to shrubbery) vegetation restoration types were compared, with cropland and mature forest serving as controls. Soil microbial community abundance was significantly higher under the two vegetation restoration types than in the cropland; however, it was lower than in the mature forest. The abundance, composition, and structure of soil microbial communities did not differ significantly between plantation forest and shrubbery. Soil organic carbon or total nitrogen was the primary factor positively affecting soil microbial abundance, whereas the mean annual temperature (MAT) was recognized as the primary factor contributing to the variation in the soil microbial community structure. Moreover, temperature had opposite effects on different indicators of microbial community structure. That is, it positively and negatively affected the ratios of gram-positive to gram-negative bacterial PLFAs (GP:GN) and fungal to bacterial PLFAs (F:B), respectively. Our results show that both vegetation restoration types have the ability to improve soil productivity in karst areas. Furthermore, shifts in soil microbial community structure (GP:GN and F:B ratios) induced by warming are likely to lead to a higher proportion of labile carbon, which is sensitive to soil tillage. Hence, more attention should be paid to ecological restoration in warmer karst areas to alleviate the severe loss of soil carbon in croplands.

1. Introduction

Increasing attention has been paid to ecological restoration as a focus of global environmental policies [1]. One of the United Nations Convention on Biological Diversity’s 20 targets is to restore 15% of the world’s degraded ecosystems [2]. According to a recent study, one-third of the world’s vegetated lands are becoming greener, and ecological restoration is a key driver of the Greening Earth initiative [3]. The ultimate goal of ecological restoration is to enhance biological diversity, ecosystem function, and soil fertility of degraded lands [4]. However, the improvement of soil fertility (e.g., soil carbon and nitrogen accumulation) often lags behind plant production [5]. The soil microbial community is thought to be an alternative key indicator of soil fertility or health in response to vegetation restoration within a relatively short period [6], mainly because changes in soil microbial communities usually can precede detectable changes in soil physicochemical properties [7]. In addition, soil microbiota is considered to be a game-changers in the restoration of degraded lands [8]. Hence, knowledge of soil microbial community dynamics following vegetation restoration can provide valuable clues to assess the extent to which soil functions can be enhanced by vegetation restoration.
Soil microbial communities are influenced by various abiotic and biotic factors. For example, abiotic factors, including soil pH [9], soil moisture and temperature [10,11], and substrate quantity and quality [12], and biotic factors, such as plant diversity, composition, and traits [13,14], can influence soil microbial community abundance, composition, and structure. Vegetation restoration affects all of these abiotic and biotic factors, and they in turn influence the soil microbial community, which depends on the ecosystem type and spatial scale.
The influences of vegetation restoration on soil microbial communities have been extensively studied [15,16,17,18]; however, the patterns and drivers of soil microbial communities during vegetation restoration have not been fully elucidated. Managed (e.g., tree plantation) and natural (e.g., abandonment) vegetation restoration are two important measures to restore degraded lands. Previous studies mainly focused on one type of vegetation restoration, that is, either managed (e.g., tree plantation) [15,18,19] or natural (e.g., abandonment) [20] vegetation restoration. As the management, microclimate, species composition, and root quantity and quality differ between these two restoration measures [21,22,23,24], soil microbial community composition may vary. In addition, in the context of global warming, changes in temperature and precipitation patterns are expected to have an impact on soil microbial communities [25], and further the response of terrestrial ecosystems to global climate change [26], and they may result in failure or limited success of vegetation restoration [27]. However, few studies have investigated the effects of regional climatic factors on soil belowground properties upon vegetation restoration [28]. A deeper understanding of soil microbial community responses to the combined effects of vegetation restoration types and climatic factors at a regional scale is critical in predicting ecosystem responses and carbon budget in a particular region under ecological restoration.
Karst ecosystems, which develop on carbonate rocks, represent nearly 15% of the Earth’s land surface [29]. The highly sensitive and vulnerable karst ecosystems in Southwest China cover roughly approximately 5.8% of the country [30]. As agricultural activity has increased in intensity, a huge proportion of the karst ecosystems has been seriously hampered. In the context of the “Grain for Green” project, most of the severely degraded farmland has been restored through natural vegetation restoration and active tree planting [31]. At an ecosystem level in a subtropical karst region, vegetation restoration has been found to enhance soil microbial community abundance and thus improve soil fertility [32]. Nevertheless, because of the limited research scale, it remains unclear whether the soil microbial community patterns observed upon vegetation restoration are also relevant on a regional scale in karst areas. In addition, long-term continuous data indicated that the risk and severity degree of extreme weather events in Southwest China are increasing [33]. However, it is not clear how soil microbial communities respond to climate change in the karst region, which increases the difficulty of predicting the recovery performance of these ecologically fragile areas.
In the current study, we hypothesized that soil microbial community abundance and structure under managed and natural vegetation restoration would differ significantly (Hypothesis I), given that the two vegetation restoration strategies are associated with distinct microhabitats and soil carbon accumulation rates [34,35]. In addition, we assumed that soil microbial community dynamics would be influenced by both temperature and precipitation because of their dominant roles in substrate availability and soil microbe activity (Hypothesis II). To test these hypotheses, microbial community characteristics in soils undergoing two vegetation restoration strategies, i.e., managed (plantation forest) and natural (naturally recovered to shrubbery) vegetation restoration, were investigated along a typical climatic gradient in a subtropical karst region in Southwest China and compared with those in cropland and mature forest. Our objectives were to (1) assess the characteristics of soil microbial communities under different vegetation restoration types; (2) investigate the spatial patterns of soil microbial communities along the climatic gradient; and (3) identify the regulatory factors that significantly drive the dynamics of soil microbial communities at the regional scale.

2. Methods and Materials
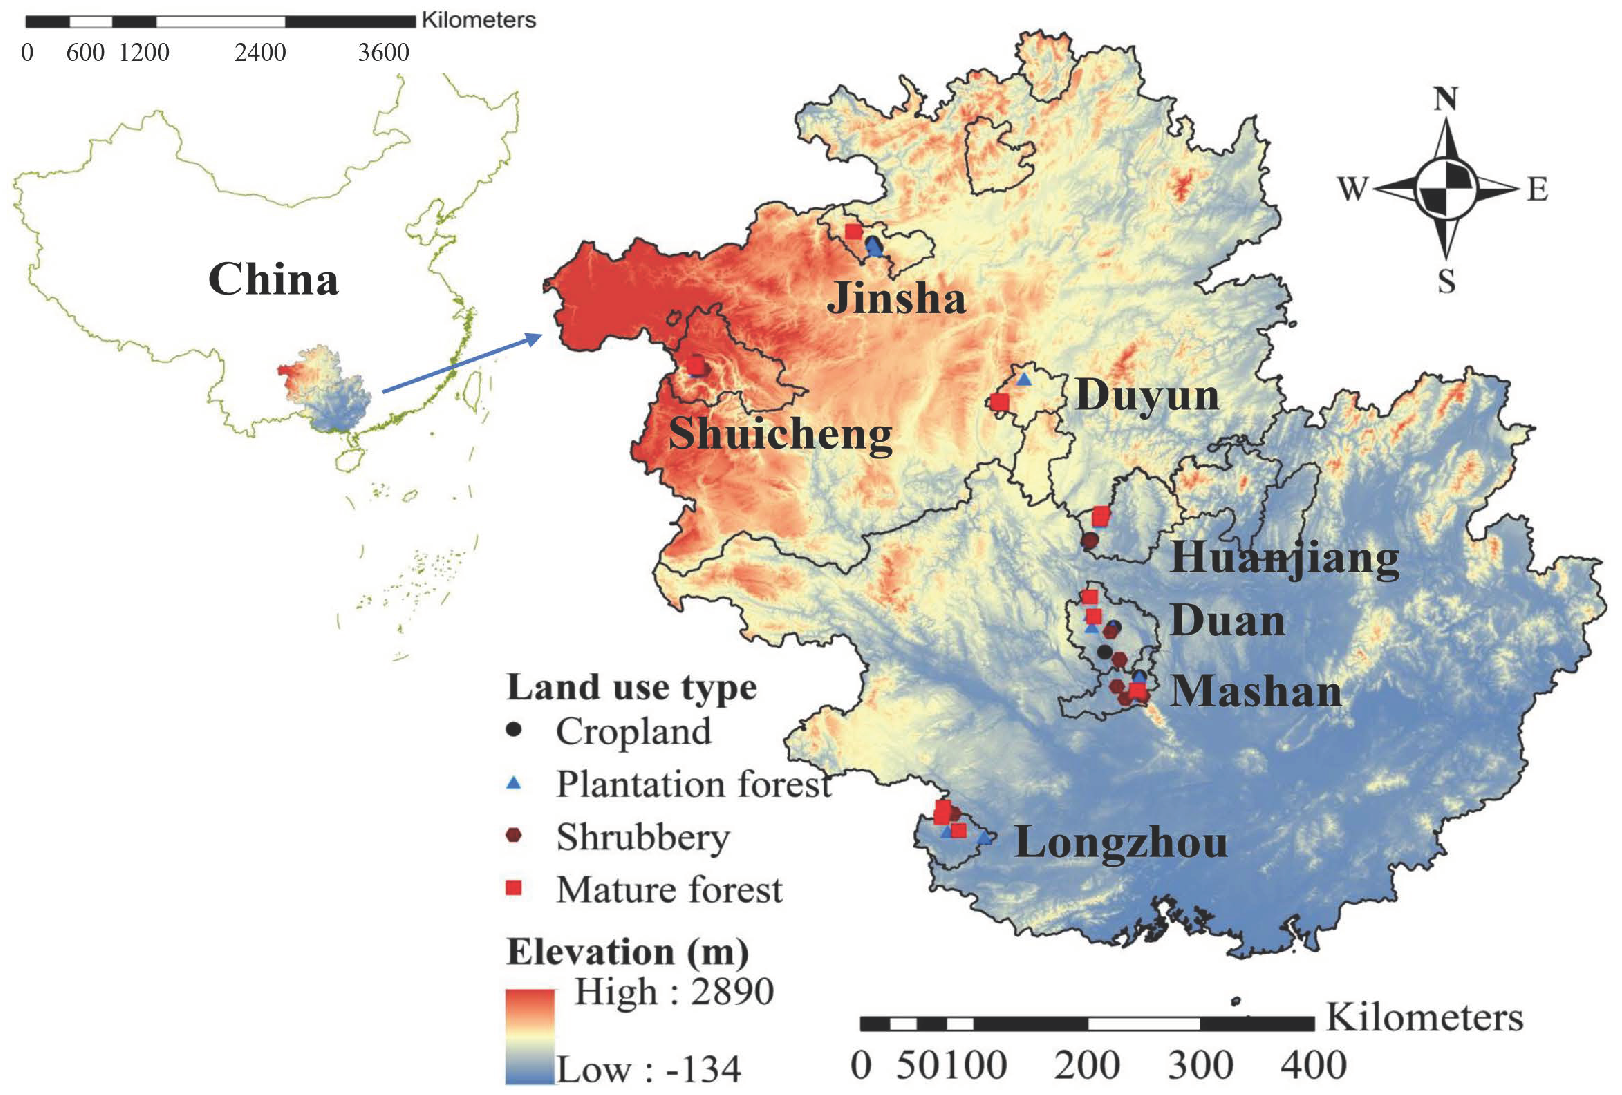
2.1. Study Region

The study area (22°42′ N to 27°53′ N and 104°82′ E to 108°37′ E) is located in Guizhou and Guangxi Provinces and is a typical karst region of Southwest China (Figure 1). The sampling region exhibits a large variation in elevation, ranging from 142 m above sea level in the south to 2264 m above sea level in the north. The temperature in the area increases from north to south. In the study, the mean annual temperature (MAT) ranges from 12.6 °C to 21.8 °C, and the mean annual precipitation (MAP) ranges from 1013 to 1607 mm. Climate data for the period 2000–2015 were obtained from China’s National Meteorological Information Center (http://data.cma.cn/). Dolomite, limestone, and their mixes dominate the lithology of the karst regions. The soil is classified as calcareous lithosol (limestone soil), according to the FAO/UNESCO classification system.
Before the 1990s, severe degradation of the ecosystems occurred in this region because of over farming. Since 2002, as a part of the “Grain for Green” project, the ecological restoration of the degraded croplands has been implemented in a majority of karst areas, through either managed (plantation forest) or natural vegetation restoration (naturally recovered to shrubbery after 15 years of cropland abandonment).

2.2. Experimental Design

Based on the climate data recorded by the National Meteorological Information Center of China, 7 counties located along a temperature gradient belt were selected as the study areas, 3 (Duyun, Shuicheng, Jinsha) in Guizhou province, and 4 (Duan, Huanjiang, Longzhou, and Mashan) in Guangxi province (Figure 1, Table 1). Each area included 4 different land use types, i.e., cropland (CR), plantation forest (PF), shrubbery (SH), and mature forest (MF). For each land use type, 3 sites (replicates) were included. The distance between any two sites in the same county was normally no more than 10 km, except in some special circumstances where the distances were approximately 50 km. In total, 84 sampling sites (i.e., 4 land use types × 3 replicates × 7 counties) were selected (Figure 1). The following criteria were used to choose the various land use types: (1) the geochemical prehistory and soil types are the same; (2) the duration of a given land use type is the same among different sample sites; and (3) the slope aspect and gradient for each land use type are similar [36]. The local forestry administrations provided the history of land use. Plantation forest (PF) and shrubbery (SH) were selected as managed and natural vegetation restoration types, respectively. The PF and SH sites were previously cropland (CR) and have been under restoration since 2002–2003. Thus, the duration of both vegetation restoration types was approximately 15 years up to the time of sampling. In addition, CR and mature forest (MF) were selected to represent degraded land and long-term undisturbed land, respectively, and compared with the two vegetation restoration types. The CR sites were under maize cultivation and have been cultivated for at least 100 years until now. The MF was estimated to be 60 ± 5 years old.
Field surveying and soil samplings were conducted from late August to early October 2018. At each land use site, a 30 m × 30 m plot was established. In each plot, mineral soil samples (0–15 cm) were collected with a 3.8 cm inner diameter corer at 20 points. The sampling points were all at least 1 m away from the tree trunks and were randomly located in the plot. A total number of 84 soil samples were collected. After removing the visible stones and roots, the soils were sieved through a 2 mm mesh. A series of subsamples were kept at −20 °C prior to performing the phospholipid fatty acid (PLFA) analysis. Another series of subsamples was kept at 4 °C prior to the examination of soil inorganic nitrogen. The third series of subsamples for soil physical and chemical properties analyses were air-dried and then sieved through a 0.15 mm screen.

2.3. PLFA Analysis

Soil samples were weighed before and after oven drying at 105 °C to achieve constant weight, which was used to evaluate soil moisture content. The PLFAs were isolated from 8 g of fresh soil and detected according to Bossio and Scow’s instructions [37]. The total abundance of i14:0, i15:0, a15:0, i16:0, 16:1ω7c, 17:0, i17:0, a17:0, cy17:0, 18:0, 18:1ω7c, and cy19:0 was used to compute the abundance of bacterial PLFAs [18]. Gram-positive bacterial abundance was represented by the sum of i14:0, a15:0, i15:0, i16:0, a17:0, and i17:0, whereas gram-negative bacterial abundance was represented by the sum of 16:1ω7c, cy17:0, 18:1ω7c, and cy19:0 [18]. The sum abundance of 18:1ω9c and 18:2ω6,9c was used to represent the abundance of fungal PLFAs [38]. The sum of 10 Me 16:0, 10 Me 17:0, and 10 Me 18:0 was used as an indicator of actinomycete PLFAs [39]. Arbuscular mycorrhizal fungi (AMF) were represented by 16:1ω5c [40]. Other PLFAs, such as 16:0, 14:0, and 17:1ω8c, were also used to analyze microbial community composition. Total soil microbial community PLFAs were calculated as the sum of all the 21 PLFAs. To assess soil microbial community structure, the ratios of fungal to bacterial PLFAs (F:B) and gram-positive to gram-negative bacterial PLFAs (GP:GN) were computed.

2.4. Soil Physicochemical Analyses

A subsample of 10 g of each fresh soil sample was extracted with 50 mL of 2 M KCl solution. The concentrations of nitrate (NO3) and ammonium (NH4+) in the filtered extracts were analyzed using an auto-analyzer (FIA star 5000; FOSS, Höganäs, Sweden). Soil organic carbon (SOC) content was measured by wet oxidation using the dichromate redox colorimetric method [41]. Soil total nitrogen (TN) content was detected using an elemental analyzer (Vario MAX; Elementar, Langenselnold, Hesse, Germany). Soil pH (10 g soil to 25 mL water) was detected using a pH meter (FE20K; Mettler Toledo, Greifensee, Switzerland).

2.5. Statistical Analysis

Prior to analysis, the data were checked for normal distribution and variance homogeneity. To test the effects of land use types on soil physicochemical properties and soil microbial communities, a one-way analysis of variance with least square difference multiple comparisons was used. The associations between climatic (MAP and MAT) and edaphic factors were determined using correlation and regression analyses (pH, SOC, TN, C:N, NH4+, and NO3) with soil microbial community related variables. SPSS 26 (SPSS Inc., Chicago, IL, USA) and OriginPro2022 were used for the statistical analyses (OriginLab, Hampton, MA, USA).
Principal component analysis (PCA) was used to determine the differences in soil microbial community composition [39]. All 21 fatty acids were included in the PCA. Redundancy analysis (RDA) and forward selection process were used to explore the explanatory variables that contributed significantly to the changes in the soil microbial community (p < 0.05). The statistical significance of RDA results was determined using the Monte Carlo permutation method (999 runs with randomized data) and implemented using Canoco5.0 for Windows (Centre for Biometry, Wageningen, The Netherlands).

3. Results

3.1. Soil Properties

Compared to CR, the SOC content was significantly elevated by 48% and 63% on average in the sites of PF and SH, respectively, but lower compared to MF by an average of 71% and 55%, respectively (Table 2). Similarly, the TN content of PF and SH sites increased by 34% and 42%, respectively, compared to CR, but was 63% and 53% lower than that of the MF, respectively (Table 2). The soil pH has no significant difference among the four land use types. The soil C:N ratio and NH4+, soil BD content increased after vegetation restoration, whereas the soil NO3 content showed the opposite trend. All the soil variables have no remarkable difference among the managed and natural vegetation restoration types.

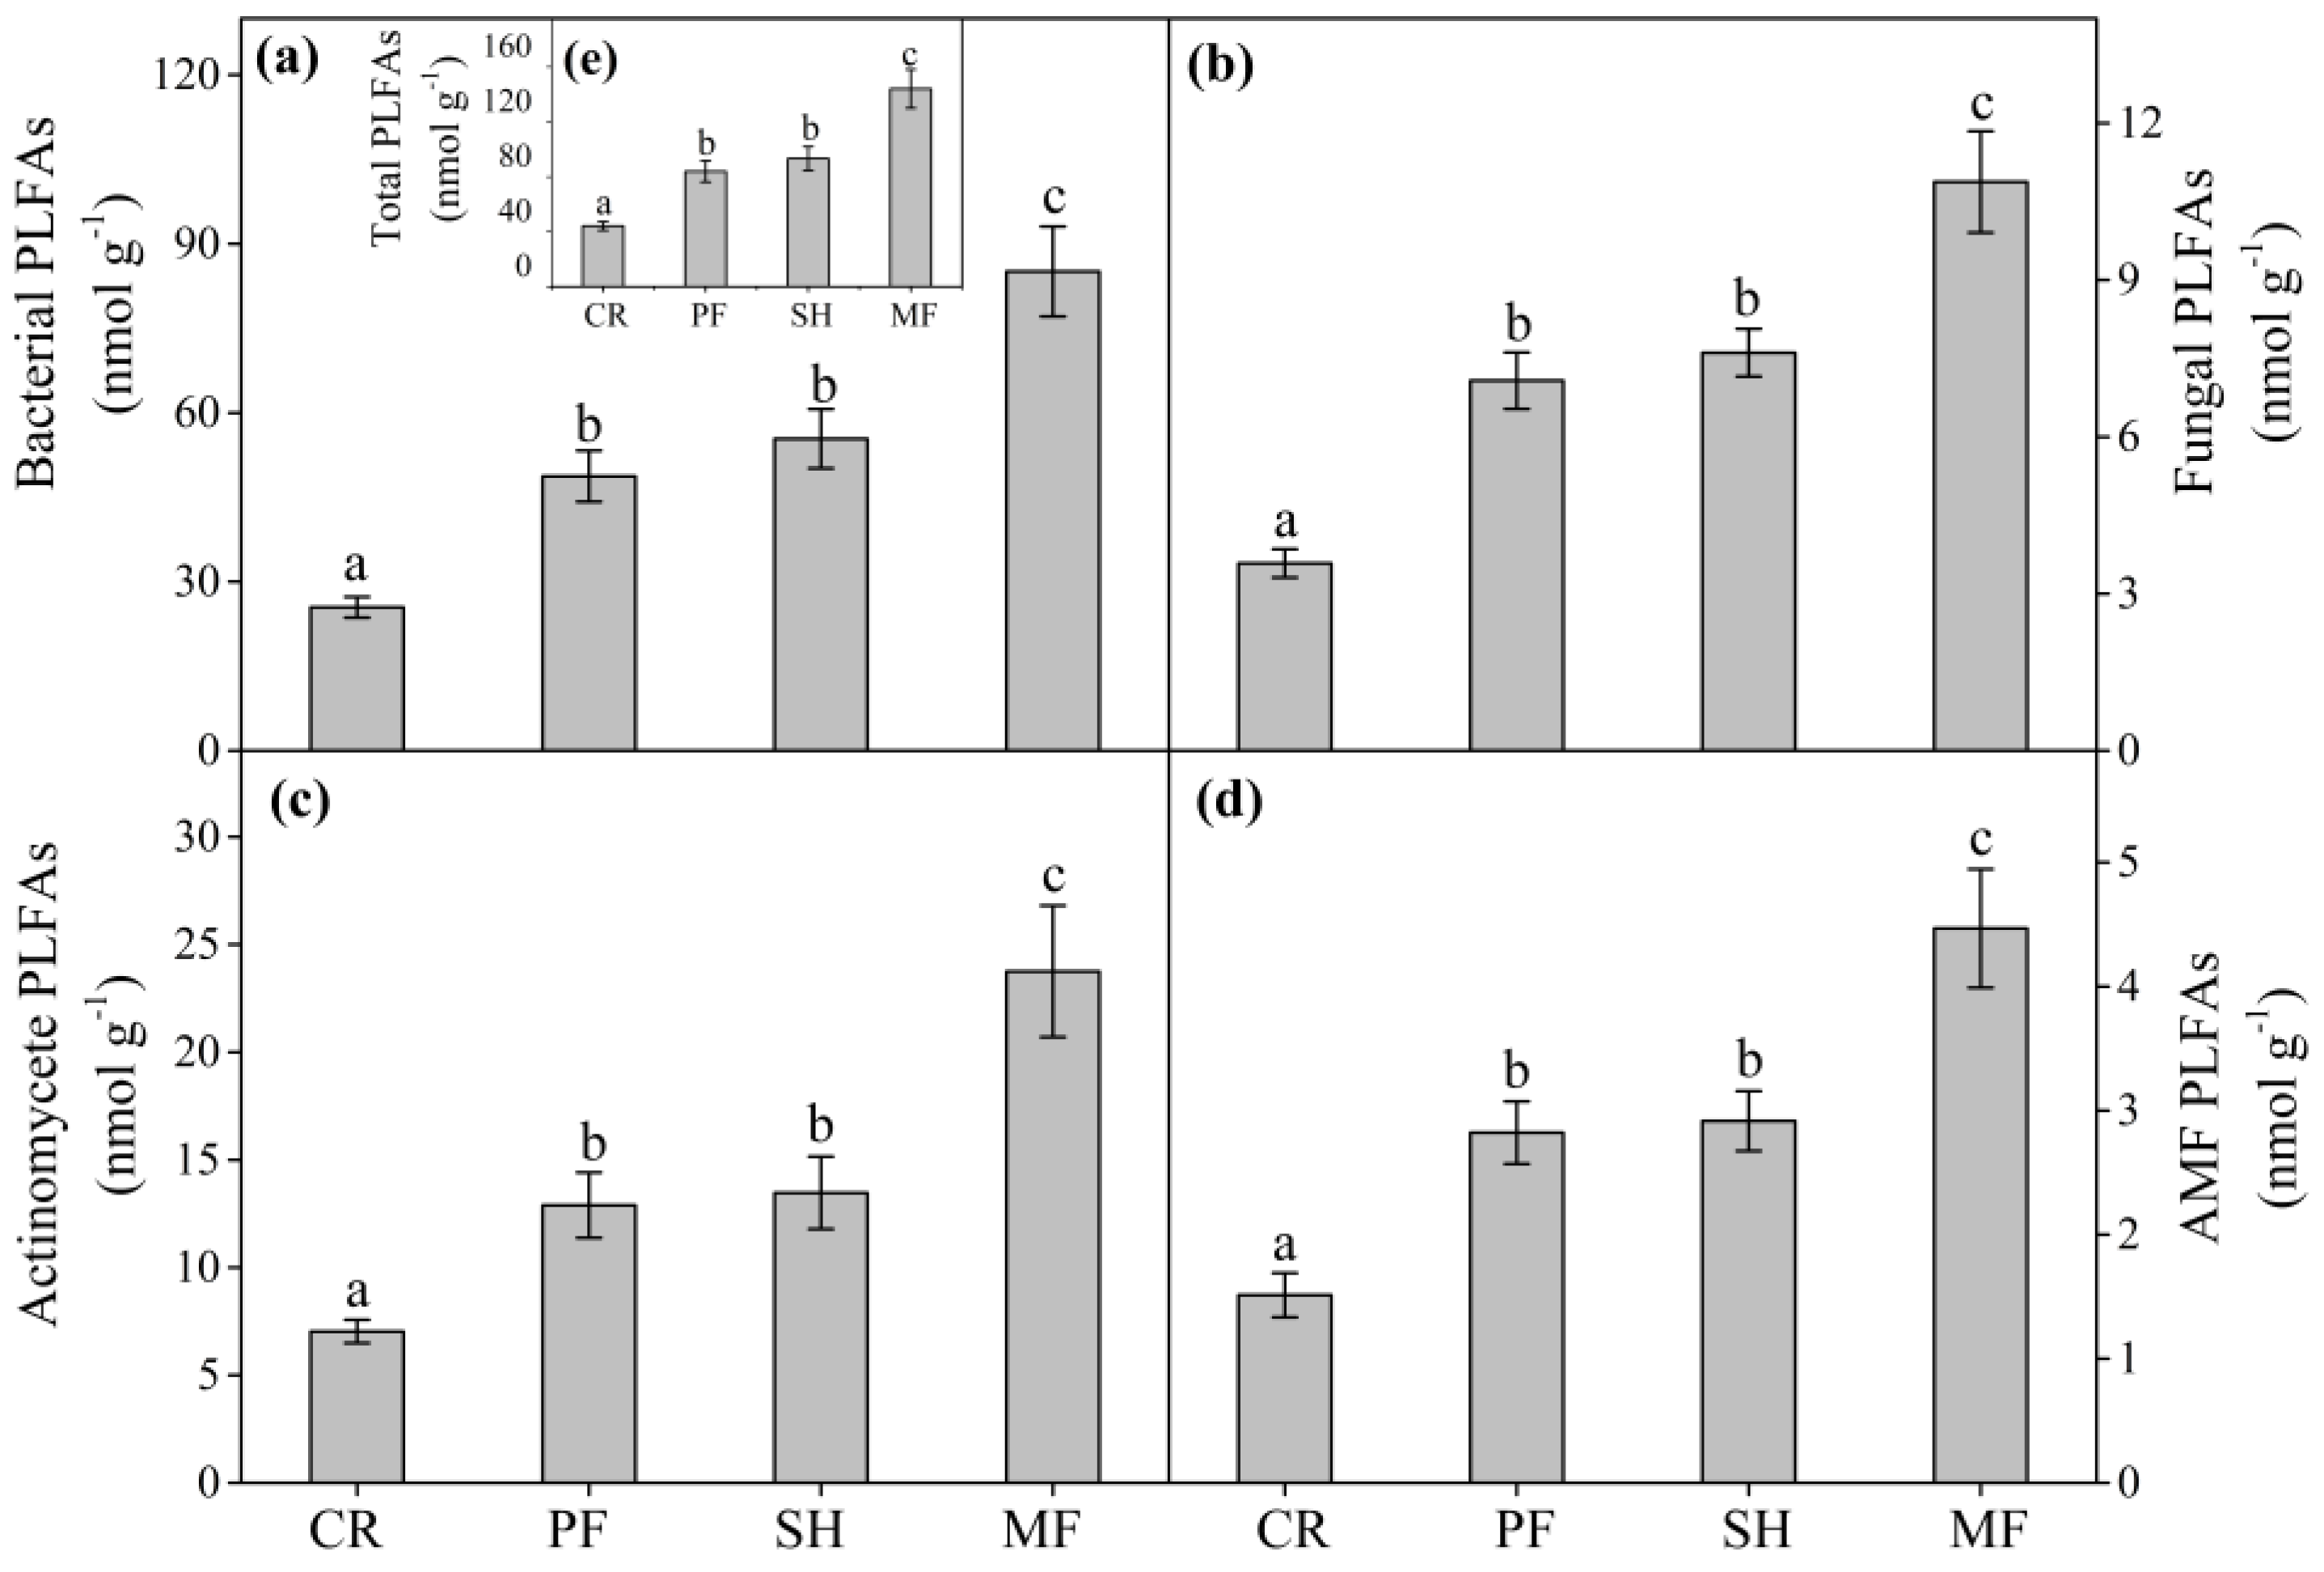
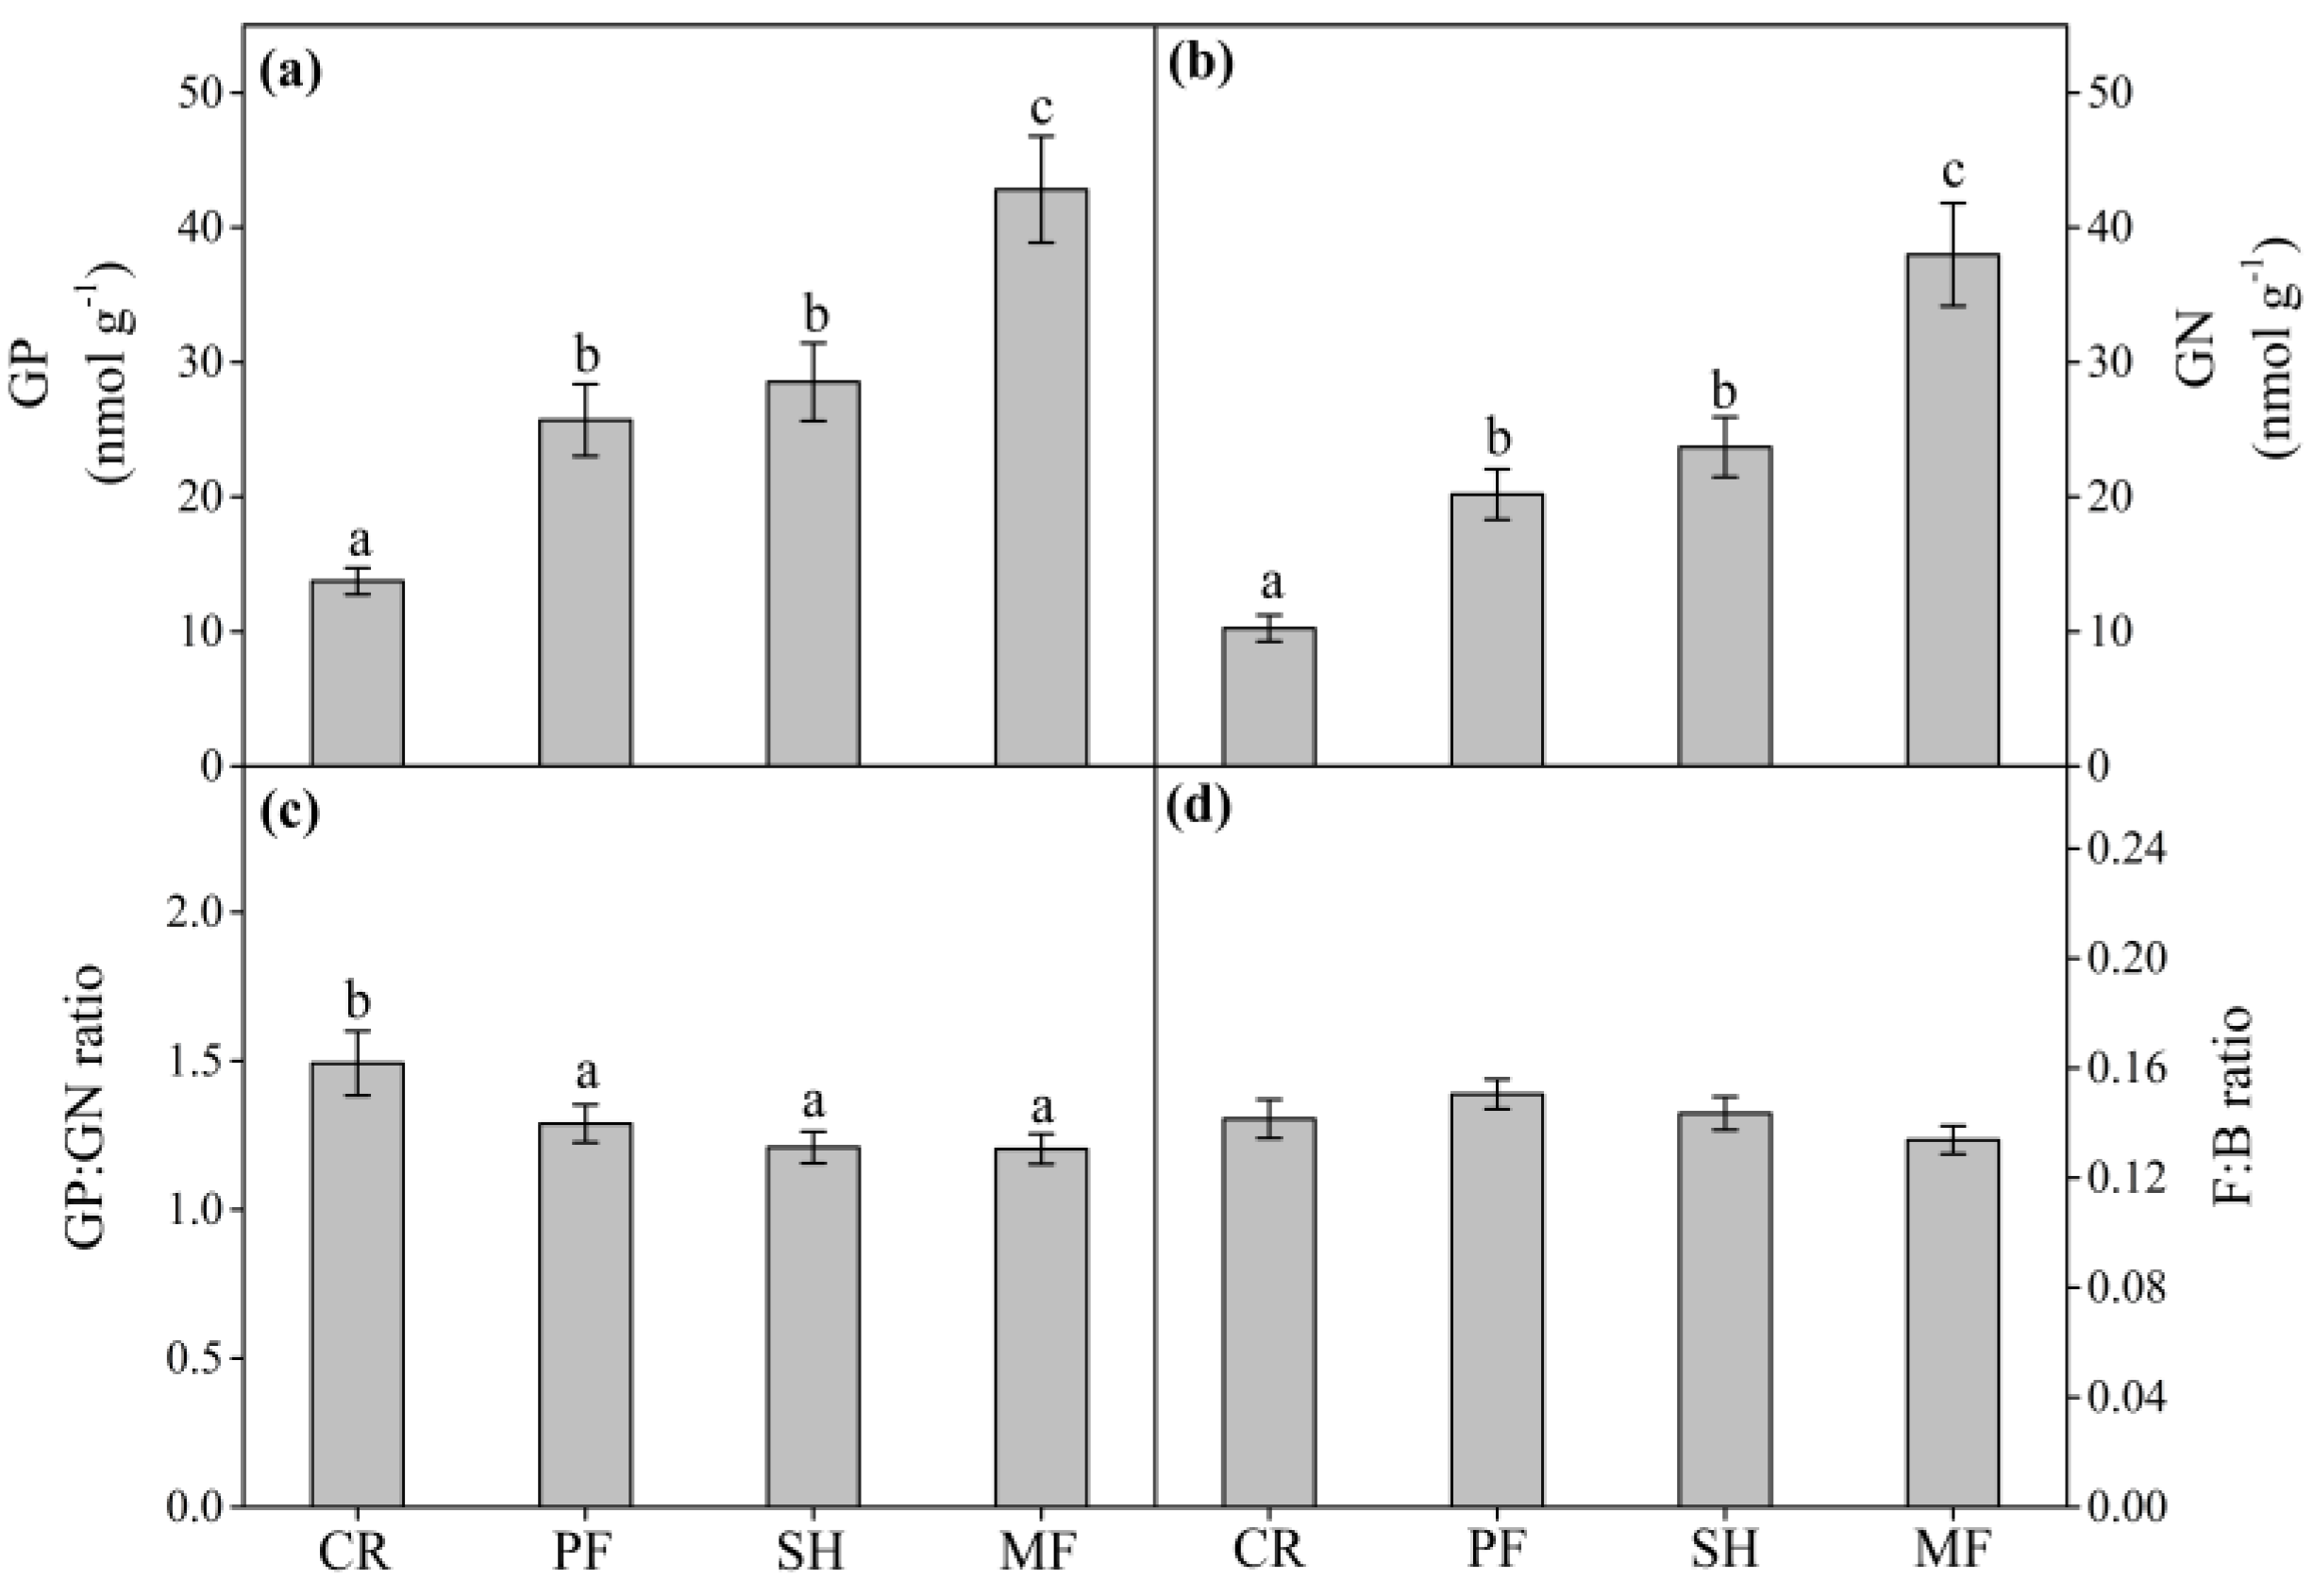
3.2. Soil Microbial Community Abundance, Structure, and Composition

THE abundance of the total PLFAs and subgroups of microbial PLFAs exhibited similar patterns under the four land use types (Figure 2). The abundance of total PLFAs and subgroups of microbial PLFAs under PF and SH were significantly higher than CR and lower than MF, but no significance was detected between PF and SH (Figure 2).
The PLFAs of two subgroups of bacterial PLFAs, gram-positive bacteria and gram-negative bacteria, showed a similar trend to total bacterial PLFAs. The abundances of gram-positive bacterial PLFAs and gram-negative bacterial PLFAs under PF and SH were significantly higher than those under CR and lower than those under MF, and no significance was detected between PF and SH (Figure 3a,b). However, compared with CR, the GP:GN ratios under PF, SH, and MF were significantly lower, but no significant difference was detected among these three land use types (Figure 3c). There was no significant difference in F:B ratio among the four land use types (Figure 3d).
PCA analysis of 21 PLFAs showed that land use type had a significant effect on soil microbial community composition (Figure 4). In PC1, the microbial community composition in PF was significantly different from that in CR, while it was significantly different in SH than in MF. In PC2, the microbial community composition in PF and SH was significantly different from that in CR and MF. Additionally, the microbial community composition in PF was not significantly distinct from that in SH in PC1 or PC2.

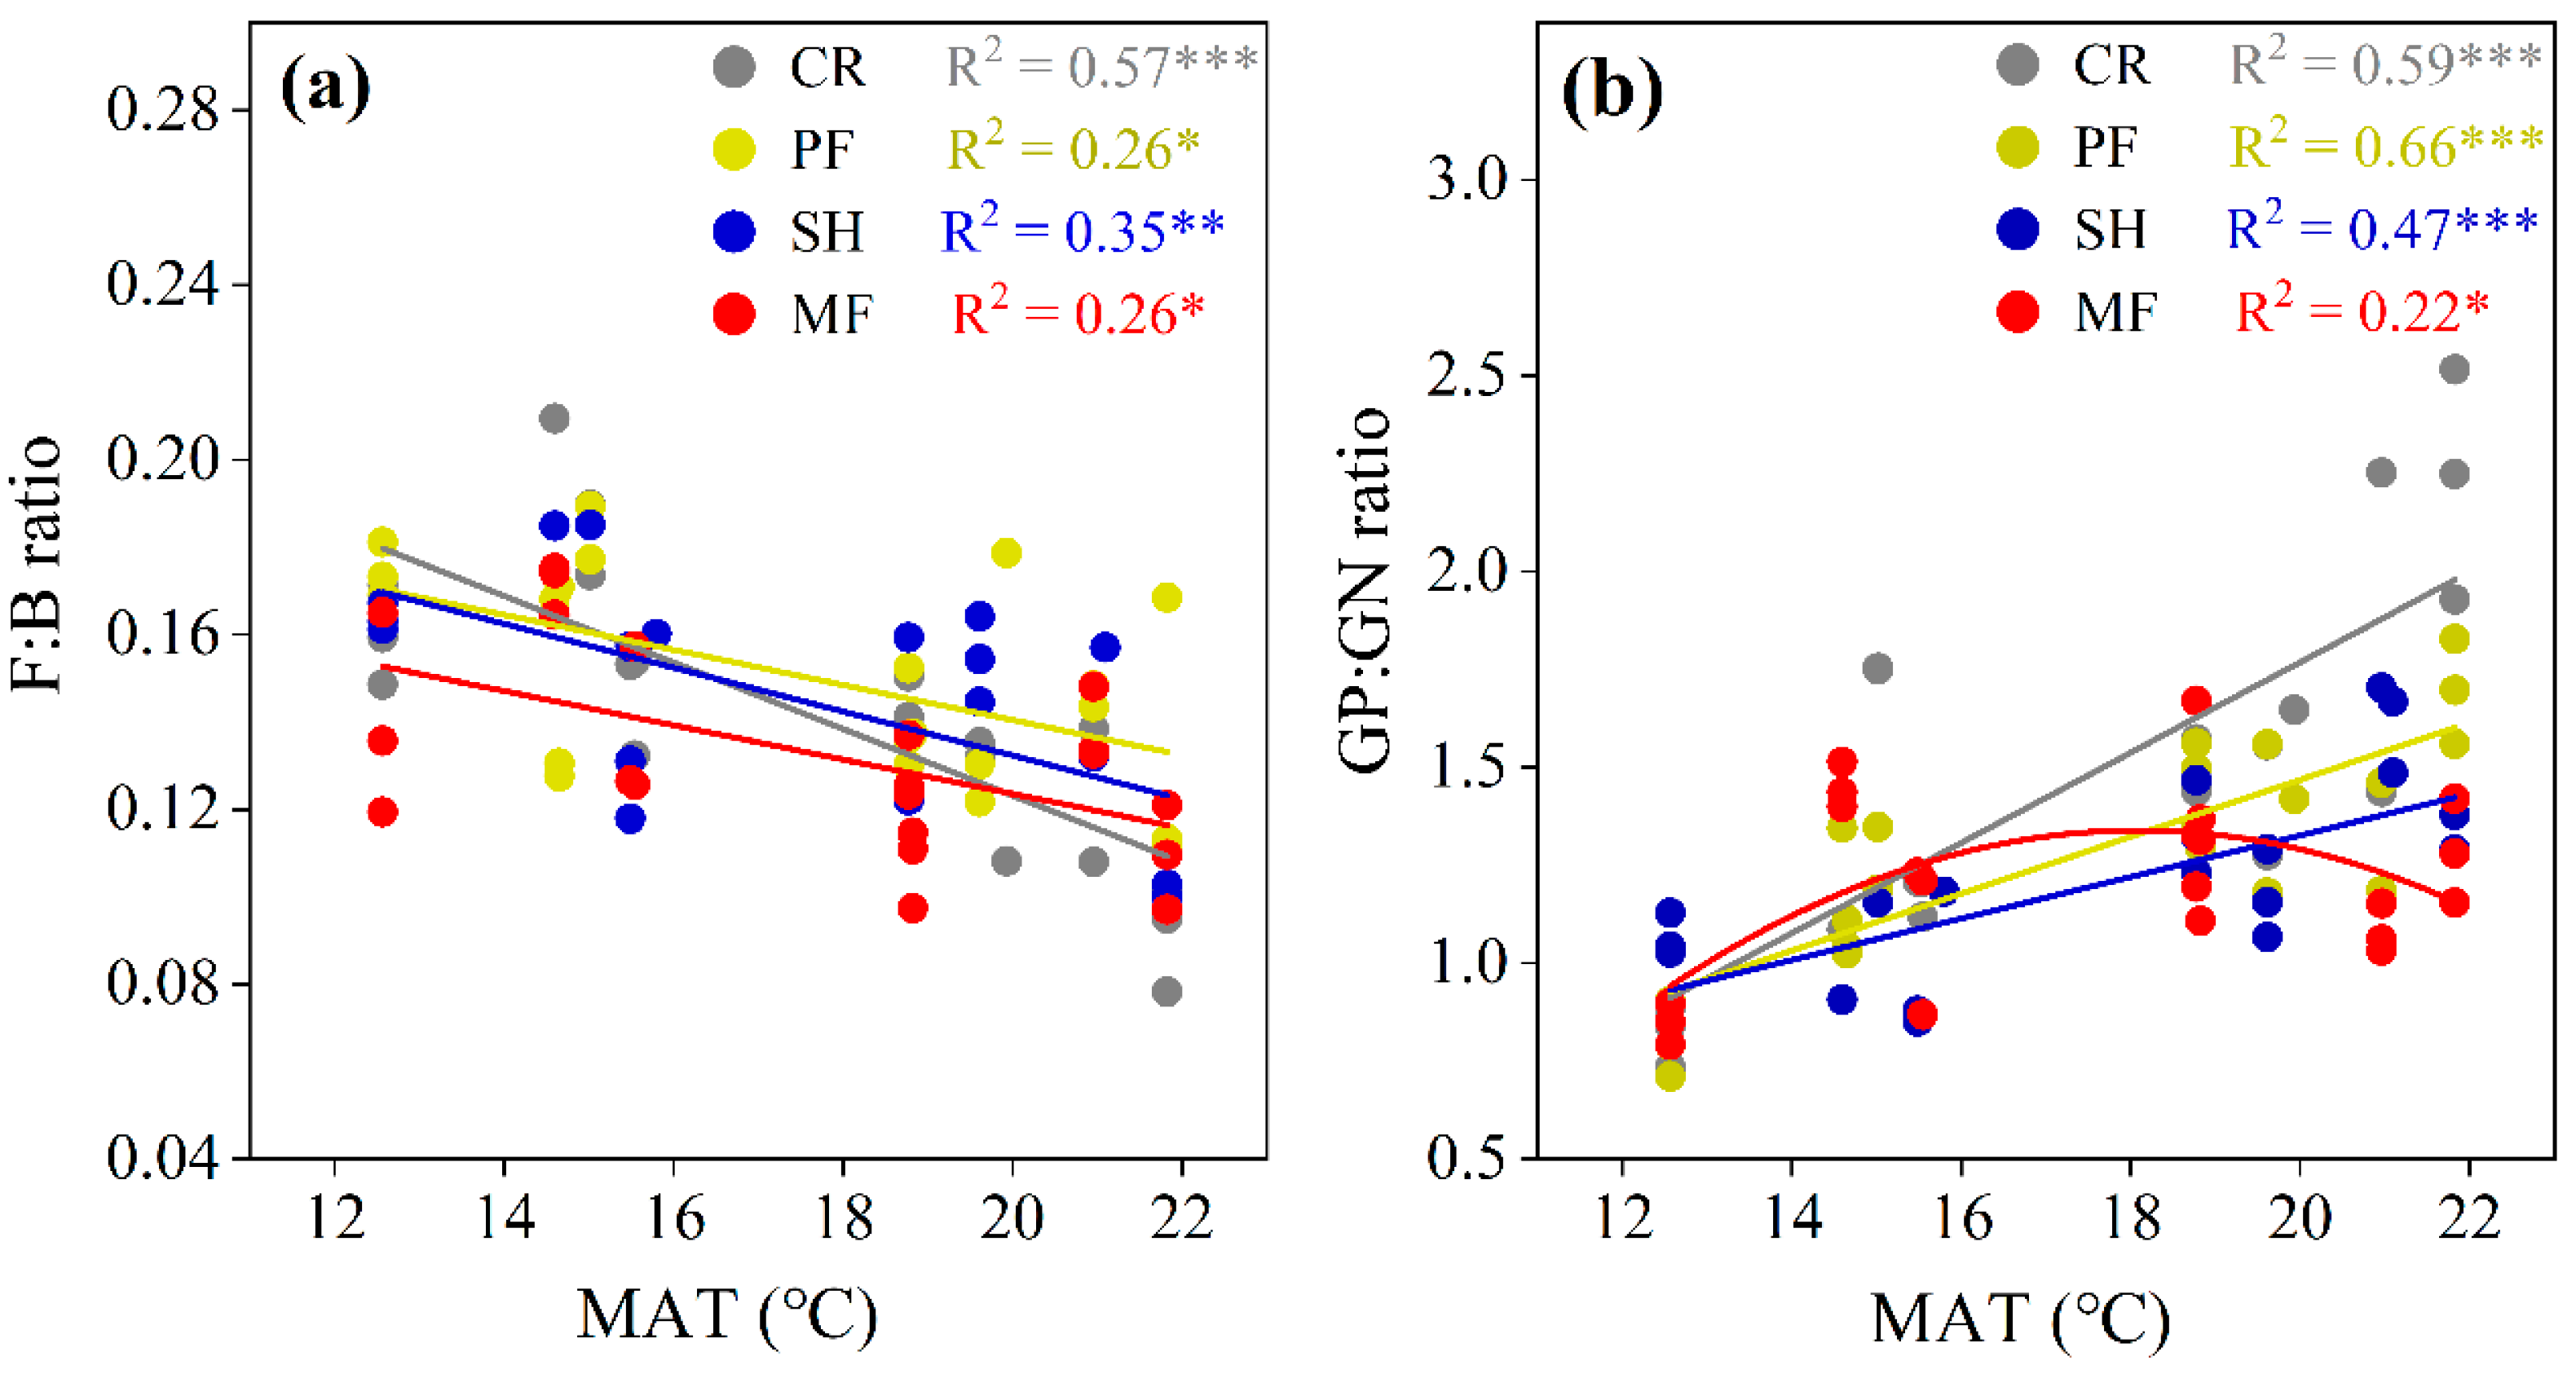
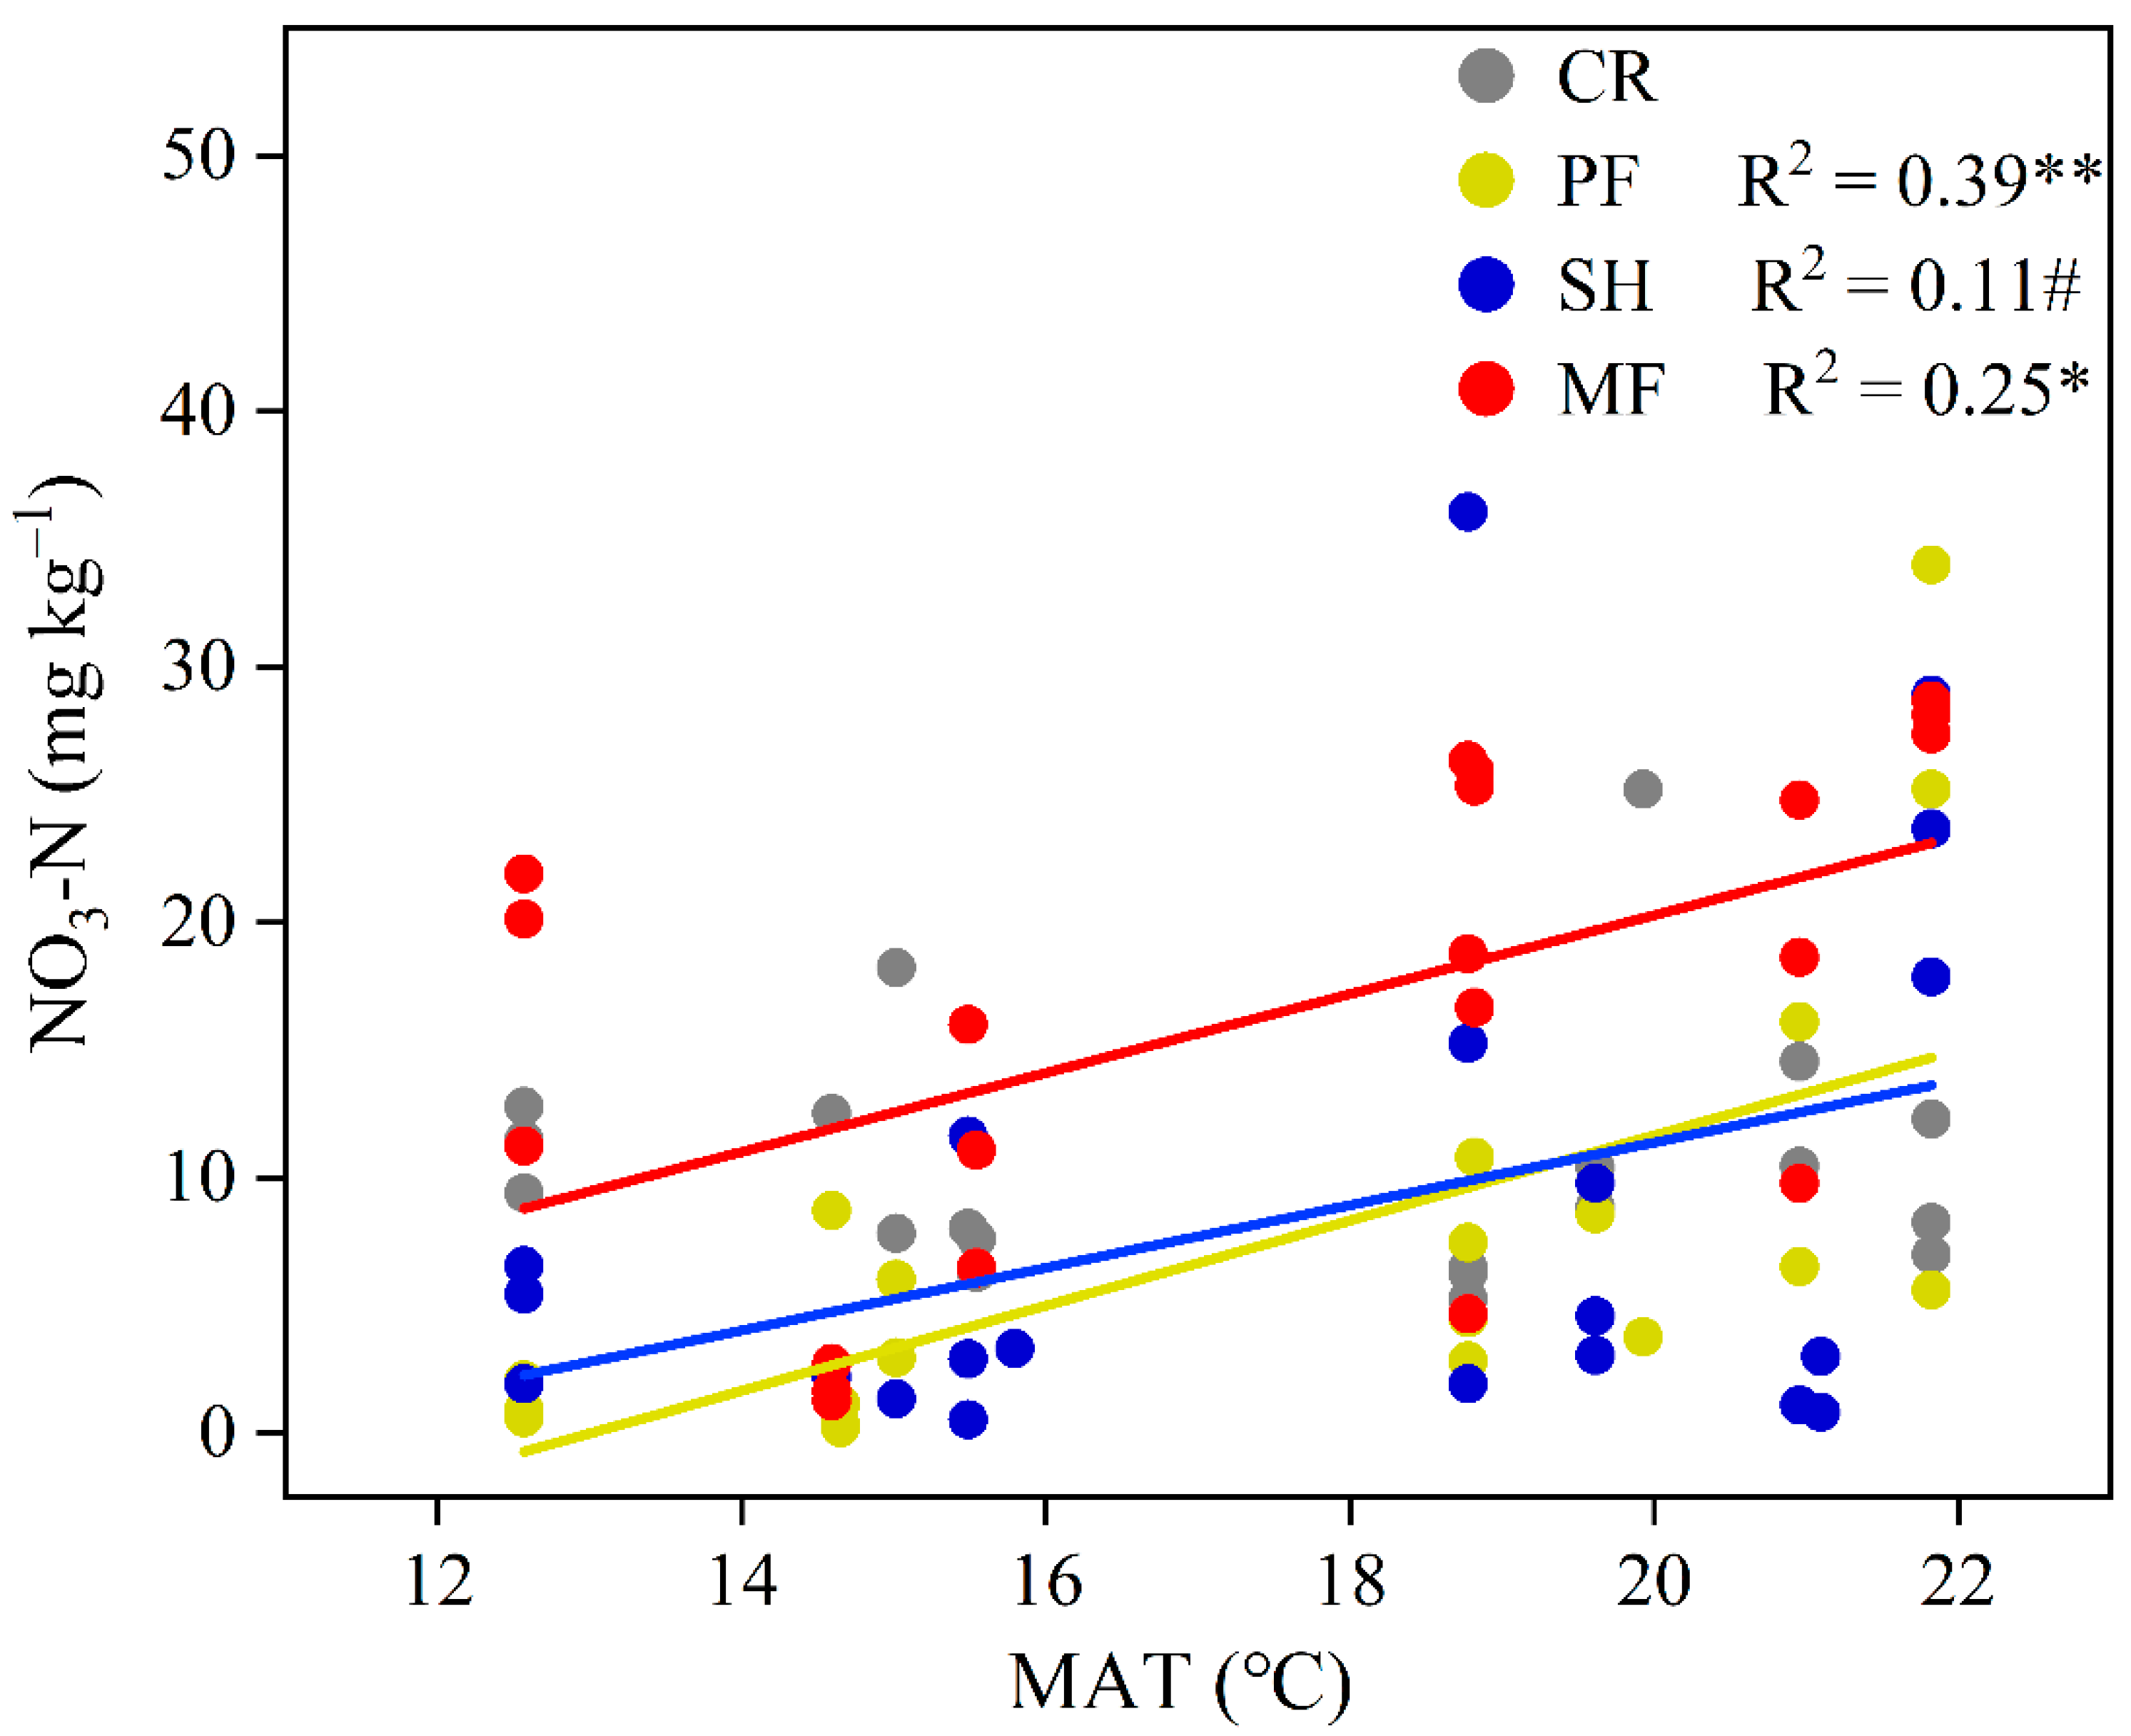
3.3. Soil Microbial Community along Precipitation and Temperature Gradients

The correlations between soil microbial community abundance and climate variables (MAP and MAT) varied across the land use types (Table 3). In contrast, the soil microbial community structure, that is, the GP:GN and F:B ratios, showed a spatial pattern consistent with the MAT within all the four land use types. Specifically, the F:B ratio significantly decreased with increasing MAT (Figure 5a), whereas the GP:GN ratio obviously increased with the MAT within each land use type (Figure 5b).

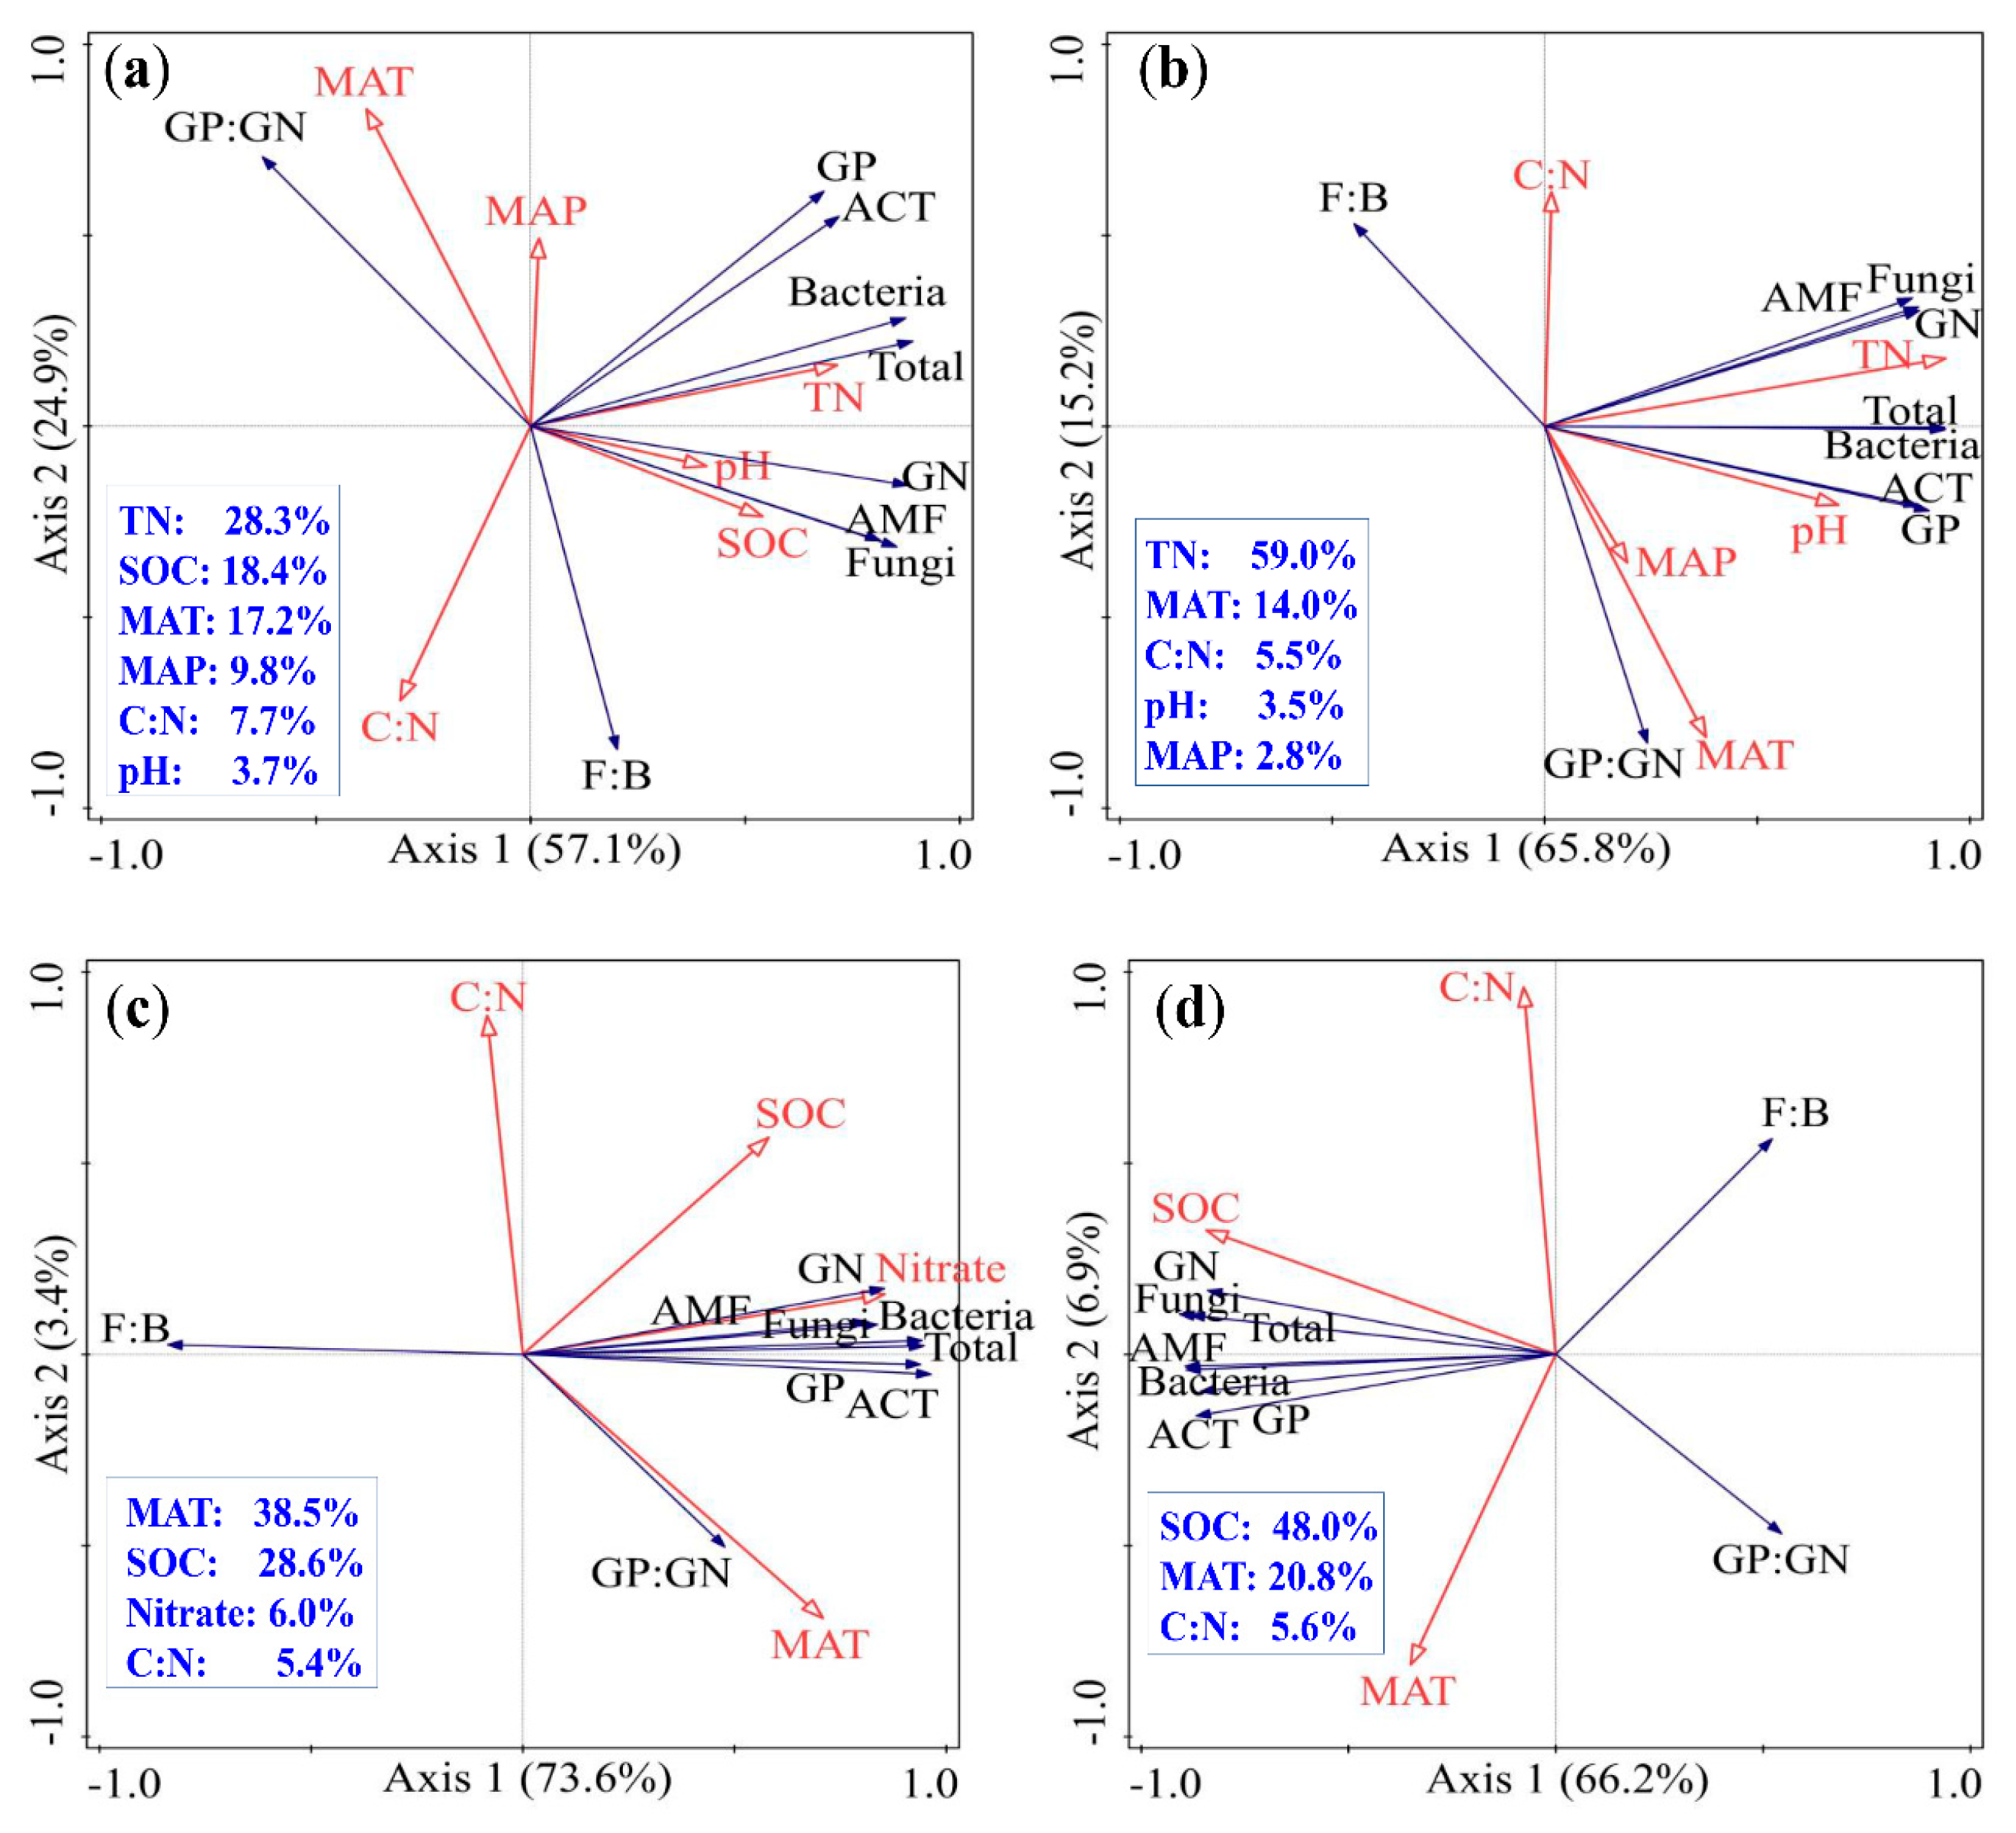
3.4. Factors Affecting the Variation of Soil Microbial Community

Climate and edaphic variables had the greatest impact on soil microbial communities (Table 3). According to the RDA result, edaphic factors such as SOC, TN, or C:N ratio, which are closely related to SOM quantity and quality, and climatic factors such as MAT were identified as the most crucial factors affecting the variation in soil microbial community within each land use type (Figure 6). Specifically, SOC or TN was the main factor positively affecting the abundances of total PLFAs and subgroups of microbial PLFAs, whereas the MAT was the major factor contributing to the variation in microbial structure; that is, it positively and negatively affected the F:B ratio and GP:GN ratio, respectively (Figure 6).

4. Discussion

4.1. Effect of Vegetation Restoration on Soil Microbial Community

Our analysis indicated that soil microbial abundance increased significantly in two vegetation restoration types after 15 years of cropland abandonment (Figure 2). This is consistent with the findings of numerous studies [16,42,43]. The abundance of soil microbial communities is proportional to soil organic matter (SOM) as it provides a substrate for the growth of soil microorganisms [15,44,45]. Indeed, as two major SOM components, both SOC and TN exhibited variation patterns similar to those of the soil microbial community abundance among the four land use types, that is, the SOC and TN content was the highest in mature forest, intermediate between the two types of vegetation restoration, and lowest in cropland. As proxies of SOM, SOC and TN were positively associated with the abundances of total PLFAs and PLFAs of the four functional groups (Table 3). The RDA results with forward selection confirmed that SOC or TN was the most important edaphic factor affecting soil microbial abundance in each land use type (Figure 6). As a result, higher levels of SOM are primarily responsible for increased soil microbial abundance, which is consistent with other studies’ findings [46,47].
The soil microbial community structure in the present study was assessed based on the GP:GN and F:B ratios. The GP:GN ratio was significantly decreased upon vegetation restoration (Figure 3c). Ma et al. [11] found that gram-positive bacteria are more resistant to disruption than gram-negative bacteria. Consequently, tillage cessation and vegetation restoration would increase the relative abundance of gram-negative bacteria and reduce that of gram-positive bacteria, thus, reducing the GP:GN ratio. The F:B ratio did not significantly differ among the four land use types (Figure 3d). However, Drenovsky et al. [48] and Ma et al. [11] have reported that fungi are more sensitive to disturbance than bacteria. Therefore, the F:B ratio would theoretically increase upon vegetation restoration because fungal abundance may increase more significantly than that of bacteria when tillage is ceased [20]. The constant F:B ratio among the four types of land use suggests that other factors may offset the effects of tillage cessation. For example, fungal activity is higher in warmer and drier environments, whereas bacterial activity is higher in cooler and moister environments [15,49,50]. Relatively higher moisture and lower soil temperature under the stable canopy structures in restored vegetation and mature forest likely contribute to higher bacterial activity. Consequently, these processes may counterbalance the variation in the F:B ratio.
In the latest research, no significant variations in soil microbial community abundance, structure, or composition were discovered between managed and natural vegetation restoration (Figure 2, Figure 3 and Figure 4), which is inconsistent with Hypothesis I. This might be mainly related to marginal differences in SOC and TN between the two restored vegetation types (Table 2). However, our prior investigations revealed that, at a catchment scale in the karst region, after approximately 9 years of vegetation restoration, natural vegetation restoration had significantly greater SOC content than that of managed vegetation restoration [35]. This may be mainly due to the fact that most of the carbon fixed by photosynthesis in plantation forests may be retained in vegetation biomass during the initial phases of restoration rather than being sequestered in the soil [51]. With the increase of vegetation biomass, when the carbon input from vegetation is sufficient to compensate for soil carbon decomposition, the soil organic carbon of the plantation will increase [22]. Therefore, with the increase of vegetation restoration years, SOC and TN contents, and thus soil microbial communities in plantation forests, gradually reached the level of natural restoration sites.

4.2. Influence of Climatic Factors on Soil Microbial Community

Previous studies have shown that both MAT and MAP influence soil microbial communities by affecting soil properties and vegetation growth [25,45]. However, in the present study, it was mainly MAT rather than MAP that influenced soil microbial community structure (Figure 6), which partly supports Hypothesis II. This may be mainly attributed to the climatic characteristics of the study sites. For example, the amount of precipitation in the sites is optimal for soil microbial growth, whereas the temperature range (12.6 °C–21.8 °C) is broad owing to the wide altitudinal range (Table 1). The findings contradict the correlations between soil microbial community and MAT. For instance, Hu et al. [45] and Chen et al. [52] reported significant negative correlations between soil microbial community abundance/structure and MAT in temperate grasslands, whereas positive correlations were observed in the Tibetan Plateau [25]. These conflicting findings were attributed to differences in temperature and vegetation types in the study regions.
Our findings demonstrate that temperature can substantially change the structure of the soil microbial community throughout vegetation restoration in the karst region (Figure 5). The decrease in the F:B ratio with increasing MAT upon vegetation restoration can be largely attributed to the nitrogen-rich environment in sites with higher temperatures. Higher soil nitrogen availability may promote bacterial growth over fungal growth, as bacteria are generally considered to require more soil nitrogen [53]. In the present study, bacterial abundance was positively correlated with soil TN and NO3 (Table 3 and Figure 7), and higher NO3 concentration was associated with higher MAT (Figure 8). Consequently, higher soil nitrogen availability in higher MAT sites would increase the abundance of bacteria and thus reduce the F:B ratio. In contrast, the GP:GN ratio was positively correlated with the MAT (Figure 5b). Consistent herewith, an experiment on field warming showed that soil warming significantly improved the GP:GN ratio [54]. The ability of gram-positive bacteria to sporulate may allow them to rapidly adapt to changing environmental conditions [8]. Therefore, it is rational to assume that the GP:GN ratio would increase when temperature increases. However, the mechanisms underlying the shift in soil microbial community structure in answer to temperature need further study.

4.3. Implications for Vegetation Restoration

Changes in the soil microbial community structure with temperature may have significant effects on carbon storage and fluxes [55,56]. For example, the storage of soil carbon is expected to be more persistent when mediated by fungi and more labile when mediated by bacteria [55]. Additionally, fungal hyphae can enmesh soil microaggregates into stable macroaggregates, which can contribute to SOC protection [49]. Thus, the decrease in the F:B ratio with increasing MAT may lead to less recalcitrant, but more labile carbon in the higher temperature regions of karst areas. This hypothesis is also supported by the positive correlation between the GP:GN ratio and MAT in the present study. Gram-positive bacteria prefer older organic matter, whereas gram-negative bacteria preferentially utilize simple organic compounds [57]. As older carbon is composed of complex or recalcitrant compounds, the increased decomposition rate of older carbon induced by gram-positive bacteria is likely to produce a higher proportion of labile carbon in the total soil carbon content. Thus, the increased GP:GN likely facilitated the decomposition of stable SOC, as more than 90% of organic carbon in karst soils is non-labile carbon [58]. Consequently, the decrease in the F:B ratio and the increase in the GP:GN ratio with increasing MAT likely led to more labile fractions of carbon. Stabilized carbon usually has longer mean residence times, whereas labile carbon tends to have higher decomposition rates and is more sensitive to land use change [51]. As soil labile carbon is strongly influenced by management practices [59], soil tillage in warmer karst regions could result in substantial SOC loss. This was confirmed by the significant inverse relationship between SOC and MAT in the croplands (Table 4). To combat severe cropland degradation and attenuate the efflux of CO2 from the soil, vegetation restoration in this warmer karst region is particularly necessary.

5. Conclusions

PLFA-based soil microbial communities varied after 15 years of vegetation restoration along a climatic gradient in the subtropical karst region of Southwest China. Compared with those of the cropland, both managed and natural vegetation restoration significantly enhanced the abundance of soil microbial communities and affected their composition. Soil microbial community abundance, structure, and composition did not significantly differ between the two restoration types. Soil microbial abundance was mainly positively affected by SOC or TN content, whereas the change in soil microbial community structure was primarily affected by MAT. Specifically, the GP:GN ratio increased with increasing MAT, while the F:B ratio decreased accordingly. These findings provide empirical evidence that both managed and natural vegetation restoration can improve soil fertility in karst regions. Additionally, shifts in the soil microbial community structure induced by higher temperatures are likely to lead to a higher proportion of labile carbon, which is sensitive to soil tillage. Taken together, vegetation restoration is particularly needed in the warmer karst regions to alleviate the high risk of SOC losses in cropland.

Author Contributions

Conceptualization, K.W. and W.Z.; methodology, Y.Y., D.X. and P.H.; software, Z.S. and P.H.; formal analysis, Z.S. and Y.Y.; investigation, resources, K.W., W.Z. and Y.Y. and P.H.; data curation, P.H., Y.Y. and K.W.; writing—original draft preparation, Z.S., Y.Y. and P.H.; writing—review and editing, W.Z., K.W. and D.Z.; visualization, Z.S. and, P.H.; supervision, K.W. and, Y.Y.; project administration, K.W., W.Z. and Y.Y. and P.H.; funding acquisition, K.W., W.Z., Y.Y. and P.H. All authors have read and agreed to the published version of the manuscript.

Funding

This work was supported by the State Key Program of the National Natural Science Foundation of China [41930652]; the Joint Funds of the National Natural Science Foundation of China [U20A2011]; the National Natural Science Foundation of China [42001049]; the National Natural Science Foundation of China [42007423]; and the National Natural Science Foundation of Guangxi Province [2020GXNSFBA297016].

Data Availability Statement

Not applicable.

Conflicts of Interest

The authors declare no conflict of interest.

References

  1. Jacobs, D.; Oliet, J.; Aronson, J.; Bolte, A.; Bullock, J.; Donoso, P.; Landhäusser, S.; Madsen, P.; Peng, S.; Rey-Benayas, J.; et al. Restoring Forests: What Constitutes Success in the Twenty-First Century? New For. 2015, 46, 601–614. [Google Scholar] [CrossRef]
  2. Convention on Biological Diversity. Aichi Biodiversity Targets; Convention on Biological Diversity: Montreal, QC, Canada, 2010. [Google Scholar]
  3. Chen, C.; Park, T.; Wang, X.; Piao, S.; Xu, B.; Chaturvedi, R.K.; Fuchs, R.; Brovkin, V.; Ciais, P.; Fensholt, R.; et al. China and India Lead in Greening of the World through Land-Use Management. Nat. Sustain. 2019, 2, 122–129. [Google Scholar] [CrossRef]
  4. Angelini, C.; Altieri, A.H.; Silliman, B.R.; Bertness, M.D. Interactions among Foundation Species and Their Consequences for Community Organization, Biodiversity, and Conservation. BioScience 2011, 61, 782–789. [Google Scholar] [CrossRef]
  5. Li, D.; Niu, S.; Luo, Y. Global Patterns of the Dynamics of Soil Carbon and Nitrogen Stocks Following Afforestation: A meta-analysis. New Phytol. 2012, 195, 172–181. [Google Scholar] [CrossRef] [PubMed]
  6. Trivedi, P.; Delgado-Baquerizo, M.; Anderson, I.C.; Singh, B.K. Response of Soil Properties and Microbial Communities to Agriculture: Implications for primary productivity and soil health indicators. Front. Plant Sci. 2016, 7, 990. [Google Scholar] [CrossRef] [PubMed]
  7. Nielsen, M.N.; Winding, A.; Binnerup, S.; Hansen, B. Microorganisms as Indicators of Soil Health; NERI Technical Report No. 388; National Environmental Research Institute: Roskilde, Denmark, 2002; 82p. [Google Scholar]
  8. Coban, O.; De Deyn, G.B.; van der Ploeg, M. Soil Microbiota as Game-Changers in Restoration of Degraded Lands. Science 2022, 375, abe0725. [Google Scholar] [CrossRef]
  9. Fernández-Calviño, D.; Rousk, J.; Brookes, P.C.; Bååth, E. Bacterial PH-Optima for Growth Track Soil pH, but are Higher than Expected at Low pH. Soil Biol. Biochem. 2011, 43, 1569–1575. [Google Scholar] [CrossRef]
  10. Fierer, N.; Strickland, M.S.; Liptzin, D.; Bradford, M.A.; Cleveland, C.C. Global Patterns in Belowground Communities. Ecol. Lett. 2009, 12, 1238–1249. [Google Scholar] [CrossRef]
  11. Ma, L.; Guo, C.; Lü, X.; Yuan, S.; Wang, R. Soil Moisture and Land Use Are Major Determinants of Soil Microbial Community Composition and Biomass at a Regional Scale in Northeastern China. Biogeosciences 2015, 12, 2585–2596. [Google Scholar] [CrossRef]
  12. Feng, X.; Simpson, M.J. Temperature and Substrate Controls on Microbial Phospholipid Fatty Acid Composition during Incubation of Grassland Soils Contrasting in Organic Matter Quality. Soil Biol. Biochem. 2009, 41, 804–812. [Google Scholar] [CrossRef]
  13. De Vries, F.T.; Manning, P.; Tallowin, J.R.B.; Mortimer, S.R.; Pilgrim, E.S.; Harrison, K.A.; Hobbs, P.J.; Quirk, H.; Shipley, B.; Cornelissen, J.H.C.; et al. Abiotic Drivers and Plant Traits Explain Landscape-Scale Patterns in Soil Microbial Communities. Ecol. Lett. 2012, 15, 1230–1239. [Google Scholar] [CrossRef] [PubMed]
  14. Huang, X.; Liu, S.; Wang, H.; Hu, Z.; Li, Z.; You, Y. Changes of Soil Microbial Biomass Carbon and Community Composition through Mixing Nitrogen-Fixing Species with Eucalyptus urophylla in Subtropical China. Soil Biol. Biochem. 2014, 73, 42–48. [Google Scholar] [CrossRef]
  15. Deng, Q.; Cheng, X.; Hui, D.; Zhang, Q.; Li, M.; Zhang, Q. Soil Microbial Community and Its Interaction with Soil Carbon and Nitrogen Dynamics Following Afforestation in Central China. Sci. Total Environ. 2016, 541, 230–237. [Google Scholar] [CrossRef] [PubMed]
  16. Zhang, Q.; Wu, J.; Yang, F.; Lei, Y.; Zhang, Q.; Cheng, X. Alterations in Soil Microbial Community Composition and Biomass Following Agricultural Land Use Change. Sci. Rep. 2016, 6, 36587. [Google Scholar] [CrossRef] [PubMed]
  17. Strickland, M.S.; Callaham, M.A.; Gardiner, E.S.; Stanturf, J.A.; Leff, J.W.; Fierer, N.; Bradford, M.A. Response of Soil Microbial Community Composition and Function to a Bottomland Forest Restoration Intensity Gradient. Appl. Soil Ecol. 2017, 119, 317–326. [Google Scholar] [CrossRef]
  18. Li, D.; Wen, L.; Jiang, S.; Song, T.; Wang, K. Responses of Soil Nutrients and Microbial Communities to Three Restoration Strategies in a Karst Area, Southwest China. J. Environ. Manag. 2018, 207, 456–464. [Google Scholar] [CrossRef]
  19. Bonner, M.T.L.; Herbohn, J.; Gregorio, N.; Pasa, A.; Avela, M.S.; Solano, C.; Moreno, M.O.M.; Almendras-Ferraren, A.; Wills, J.; Shoo, L.P.; et al. Soil Organic Carbon Recovery in Tropical Tree Plantations May Depend on Restoration of Soil Microbial Composition and Function. Geoderma 2019, 353, 70–80. [Google Scholar] [CrossRef]
  20. Zornoza, R.; Guerrero, C.; Mataix-Solera, J.; Scow, K.M.; Arcenegui, V.; Mataix-Beneyto, J. Changes in Soil Microbial Community Structure Following the Abandonment of Agricultural Terraces in Mountainous Areas of Eastern Spain. Appl. Soil Ecol. 2009, 42, 315–323. [Google Scholar] [CrossRef]
  21. Del Galdo, I.; Six, J.; Peressotti, A.; Francesca Cotrufo, M. Assessing the Impact of Land-Use Change on Soil C Sequestration in Agricultural Soils by Means of Organic Matter Fractionation and Stable C Isotopes. Glob. Chang. Biol. 2003, 9, 1204–1213. [Google Scholar] [CrossRef]
  22. Laganiere, J.; Angers, D.A.; Para, D. Carbon Accumulation in Agricultural Soils after Afforestation: A meta-analysis. Glob. Chang. Biol. 2010, 16, 439–453. [Google Scholar] [CrossRef]
  23. Shi, S.; Zhang, W.; Zhang, P.; Yu, Y.; Ding, F. A Synthesis of Change in Deep Soil Organic Carbon Stores with Afforestation of Agricultural Soils. Forest Ecol. Manag. 2013, 296, 53–63. [Google Scholar] [CrossRef]
  24. Solly, E.; Schöning, I.; Boch, S.; Kandeler, E.; Marhan, S.; Michalzik, B.; Müller, J.; Zscheischler, J.; Trumbore, S.; Schrumpf, M. Factors Controlling Decomposition Rates of Fine Root Litter in Temperate Forests and Grasslands. Plant Soil 2014, 382, 203–218. [Google Scholar] [CrossRef]
  25. Chen, Y.L.; Ding, J.Z.; Peng, Y.F.; Li, F.; Yang, G.B.; Liu, L.; Qin, S.Q.; Fang, K.; Yang, Y.H. Patterns and Drivers of Soil Microbial Communities in Tibetan Alpine and Global Terrestrial Ecosystems. J. Biogeogr. 2016, 43, 2027–2039. [Google Scholar] [CrossRef]
  26. Bardgett, R.D.; van der Putten, W.H. Belowground Biodiversity and Ecosystem Functioning. Nature 2014, 515, 505–511. [Google Scholar] [CrossRef] [PubMed]
  27. Asmelash, F.; Bekele, T.; Birhane, E. The Potential Role of Arbuscular Mycorrhizal Fungi in the Restoration of Degraded Lands. Front. Microbiol. 2016, 7, 1095. [Google Scholar] [CrossRef]
  28. Nielsen, U.N.; Ball, B.A. Impacts of Altered Precipitation Regimes on Soil Communities and Biogeochemistry in Arid and Semi-Arid Ecosystems. Glob. Chang. Biol. 2015, 21, 1407–1421. [Google Scholar] [CrossRef]
  29. Gombert, P. Role of Karstic Dissolution in Global Carbon Cycle. Glob. Planet Chang. 2002, 33, 177–184. [Google Scholar] [CrossRef]
  30. Jiang, Z.; Lian, Y.; Qin, X. Rocky Desertification in Southwest China: Impacts, causes, and restoration. Earth Sci. Rev. 2014, 132, 1–12. [Google Scholar] [CrossRef]
  31. Tong, X.; Brandt, M.; Yue, Y.; Horion, S.; Wang, K.; Keersmaecker, W.; Tian, F.; Schurgers, G.; Xiao, X.; Luo, Y.; et al. Increased Vegetation Growth and Carbon Stock in China Karst via Ecological Engineering. Nat. Sustain. 2018, 1, 44–50. [Google Scholar] [CrossRef]
  32. Hu, P.; Xiao, J.; Zhang, W.; Xiao, L.; Yang, R.; Xiao, D.; Zhao, J.; Wang, K. Response of Soil Microbial Communities to Natural and Managed Vegetation Restoration in a Subtropical Karst Region. Catena 2020, 195, 104849. [Google Scholar] [CrossRef]
  33. Liu, M.; Xu, X.; Sun, A.Y.; Wang, K.; Liu, W.; Zhang, X. Is Southwestern China Experiencing More Frequent Precipitation Extremes? Environ. Res. Lett. 2014, 9, 064002. [Google Scholar] [CrossRef]
  34. Lozano-García, B.; Parras-Alcántara, L.; Brevik, E.C. Impact of Topographic Aspect and Vegetation (Native and Reforested Areas) on Soil Organic Carbon and Nitrogen Budgets in Mediterranean Natural Areas. Sci. Total Environ. 2016, 544, 963–970. [Google Scholar] [CrossRef] [PubMed]
  35. Hu, P.; Liu, S.; Ye, Y.; Zhang, W.; Wang, K.; Su, Y. Effects of Environmental Factors on Soil Organic Carbon under Natural or Managed Vegetation Restoration. Land Degrad. Dev. 2018, 29, 387–397. [Google Scholar] [CrossRef]
  36. Hu, P.; Zhang, W.; Chen, H.; Li, D.; Zhao, Y.; Zhao, J.; Xiao, J.; Wu, F.; He, X.; Luo, Y.; et al. Soil Carbon Accumulation with Increasing Temperature under Both Managed and Natural Vegetation Restoration in Calcareous Soils. Sci. Total Environ. 2021, 767, 145298. [Google Scholar] [CrossRef]
  37. Bossio, D.A.; Scow, K.M. Impacts of Carbon and Flooding on Soil Microbial Communities: Phospholipid fatty acid profiles and substrate utilization patterns. Microb. Ecol. 1998, 35, 265–278. [Google Scholar] [CrossRef]
  38. Chung, H.; Zak, D.R.; Reich, P.B.; Ellsworth, D.S. Plant Species Richness, Elevated CO2, and Atmospheric Nitrogen Deposition Alter Soil Microbial Community Composition and Function. Glob. Chang. Biol. 2007, 13, 980–989. [Google Scholar] [CrossRef]
  39. Zhao, J.; Zeng, Z.; He, X.; Chen, H.; Wang, K. Effects of Monoculture and Mixed Culture of Grass and Legume Forage Species on Soil Microbial Community Structure under Different Levels of Nitrogen Fertilization. Eur. J. Soil Biol. 2015, 68, 61–68. [Google Scholar] [CrossRef]
  40. Olsson, P.A. Signature Fatty Acids Provide Tools for Determination of the Distribution and Interactions of Mycorrhizal Fungi in Soil. Fems Microbiol. Ecol. 1999, 29, 303–310. [Google Scholar] [CrossRef]
  41. Nelson, D.W.; Sommers, L.E.; Sparks, D.L.; Page, A.L.; Helmke, P.A.; Loeppert, R.H.; Soltanpour, P.N.; Tabatabai, M.A.; Johnston, C.T.; Sumner, M.E.; et al. Total carbon, organic carbon, and organic matter. Methods Soil Anal. 1996, 9, 961–1010. [Google Scholar]
  42. Xiao, L.; Liu, G.; Zhang, J.; Xue, S. Long-Term Effects of Vegetational Restoration on Soil Microbial Communities on the Loess Plateau of China: Revegetation on soil microbial communities. Restor. Ecol. 2016, 24, 794–804. [Google Scholar] [CrossRef]
  43. Hamonts, K.; Bissett, A.; Macdonald, B.C.T.; Barton, P.S.; Manning, A.D.; Young, A. Effects of Ecological Restoration on Soil Microbial Diversity in a Temperate Grassy Woodland. Appl. Soil Ecol. 2017, 117, 117–128. [Google Scholar] [CrossRef]
  44. Moscatelli, M.C.; Di Tizio, A.; Marinari, S.; Grego, S. Microbial Indicators Related to Soil Carbon in Mediterranean Land Use Systems. Soil Till. Res. 2007, 97, 51–59. [Google Scholar] [CrossRef]
  45. Hu, Y.; Xiang, D.; Veresoglou, S.D.; Chen, F.; Chen, Y.; Hao, Z.; Zhang, X.; Chen, B. Soil Organic Carbon and Soil Structure Are Driving Microbial Abundance and Community Composition across the Arid and Semi-Arid Grasslands in Northern China. Soil Biol. Biochem. 2014, 77, 51–57. [Google Scholar] [CrossRef]
  46. Stevenson, B.A.; Sarmah, A.K.; Smernik, R.; Hunter, D.W.F.; Fraser, S. Soil Carbon Characterization and Nutrient Ratios across Land Uses on Two Contrasting Soils: Their Relationships to Microbial Biomass and Function. Soil Biol. Biochem. 2016, 97, 50–62. [Google Scholar] [CrossRef]
  47. Ren, C.; Wang, T.; Xu, Y.; Deng, J.; Zhao, F.; Yang, G.; Han, X.; Feng, Y.; Ren, G. Differential Soil Microbial Community Responses to the Linkage of Soil Organic Carbon Fractions with Respiration across Land-Use Changes. Forest Ecol. Manag. 2018, 409, 170–178. [Google Scholar] [CrossRef]
  48. Drenovsky, R.E.; Steenwerth, K.L.; Jackson, L.E.; Scow, K.M. Land Use and Climatic Factors Structure Regional Patterns in Soil Microbial Communities: Biogeography of Soil Microbial Communities. Glob. Ecol. Biogeogr. 2010, 19, 27–39. [Google Scholar] [CrossRef]
  49. Zhang, W.; Parker, K.M.; Luo, Y.; Wan, S.; Wallace, L.L.; Hu, S. Soil Microbial Responses to Experimental Warming and Clipping in a Tallgrass Prairie. Glob. Chang. Biol. 2005, 11, 266–277. [Google Scholar] [CrossRef]
  50. Stromberger, M.; Shah, Z.; Westfall, D. Soil Microbial Communities of No-till Dryland Agroecosystems across an Evapotranspiration Gradient. Appl. Soil Ecol. 2007, 35, 94–106. [Google Scholar] [CrossRef]
  51. Eclesia, R.P.; Jobbagy, E.G.; Jackson, R.B.; Rizzotto, M.; Piñeiro, G. Stabilization of New Carbon Inputs Rather than Old Carbon Decomposition Determines Soil Organic Carbon Shifts Following Woody or Herbaceous Vegetation Transitions. Plant Soil 2016, 409, 99–116. [Google Scholar] [CrossRef]
  52. Chen, D.; Mi, J.; Chu, P.; Cheng, J.; Zhang, L.; Pan, Q.; Xie, Y.; Bai, Y. Patterns and Drivers of Soil Microbial Communities along a Precipitation Gradient on the Mongolian Plateau. Landsc. Ecol. 2015, 30, 1669–1682. [Google Scholar] [CrossRef]
  53. Six, J.; Frey, S.D.; Thiet, R.K.; Batten, K.M. Bacterial and Fungal Contributions to Carbon Sequestration in Agroecosystems. Soil Sci. Soc. Am. J. 2006, 70, 555–569. [Google Scholar] [CrossRef]
  54. Jing, Y.; Wang, Y.; Liu, S.; Zhang, X.; Wang, Q.; Liu, K.; Yin, Y.; Deng, J. Interactive Effects of Soil Warming, Throughfall Reduction, and Root Exclusion on Soil Microbial Community and Residues in Warm-Temperate Oak Forests. Appl. Soil Ecol. 2019, 142, 52–58. [Google Scholar] [CrossRef]
  55. Bailey, V.L.; Smith, J.L.; Bolton, H. Fungal-to-Bacterial Ratios in Soils Investigated for Enhanced C Sequestration. Soil Biol. Biochem. 2002, 34, 997–1007. [Google Scholar] [CrossRef]
  56. Waring, B.G.; Averill, C.; Hawkes, C.V. Differences in Fungal and Bacterial Physiology Alter Soil Carbon and Nitrogen Cycling: Insights from meta-analysis and theoretical models. Ecol. Lett. 2013, 16, 887–894. [Google Scholar] [CrossRef]
  57. Börjesson, G.; Menichetti, L.; Kirchmann, H.; Kätterer, T. Soil Microbial Community Structure Affected by 53 Years of Nitrogen Fertilisation and Different Organic Amendments. Biol. Fertil. Soils 2012, 48, 245–257. [Google Scholar] [CrossRef]
  58. Wen, L.; Li, D.; Chen, H.; Wang, K. Dynamics of Soil Organic Carbon in Density Fractions during Post-Agricultural Succession over Two Lithology Types, Southwest China. J. Environ. Manag. 2017, 201, 199–206. [Google Scholar] [CrossRef]
  59. Six, J.; Conant, R.T.; Paul, E.A.; Paustian, K. Stabilization Mechanisms of Soil organic Matter: Implications for C-saturation of soils. Plant Soil 2002, 241, 155–176. [Google Scholar] [CrossRef]
Figure 1. Geographical distribution of field sample locations in the southwest Chinese karst region of Guizhou and Guangxi Provinces.
Forests 14 01980 g001
Figure 2. Effect of vegetation restoration on the abundance of soil microbial phospholipid fatty acids (PLFAs) of (a) bacteria, (b) fungi, (c) actinomycetes, and (d) arbuscular mycorrhizal fungi (AMF). The inserted panel (e) shows the abundance of total PLFAs. The bars represent mean ± standard error. At p < 0.05, different letters indicate a significant distinction between land use types. CR, cropland; PF, plantation forest (managed vegetation restoration); SH, shrubbery (natural vegetation restoration); and MF, mature forest.
Forests 14 01980 g002
Figure 3. Effects of vegetation restoration on the abundance of soil microbial phospholipid fatty acids (PLFAs) of (a) gram-positive bacterial (GP), (b) gram-negative bacterial (GN), (c) the ratio of gram-positive to gram-negative bacterial PLFAs (GP:GN), and (d) the ratio of fungal to bacterial PLFAs (F:B). The bars represent mean ± standard error. Divergent symbols represent significant differences between land use types at p < 0.05. CR, cropland; PF, plantation forest (managed vegetation restoration); SH, shrubbery (natural vegetation restoration); MF, mature forest.
Forests 14 01980 g003
Figure 4. Principle component analysis (PCA) plot displaying PC1 and PC2 scores under different land-use types. Scatter represents mean ± standard error. Different uppercase and lowercase letters symbolize significant differences in the PC1 and PC2 values, including both, between the land use types at p < 0.05.
Forests 14 01980 g004
Figure 5. Relationships of (a) the ratio of fungal to bacterial PLFAs (F:B) and (b) the ratio of gram-positive to gram-negative bacterial PLFAs (GP:GN) with mean annual temperature (MAT) within each land use type. * p < 0.05, ** p < 0.01, and *** p < 0.01. CR, cropland; PF, plantation forest (managed vegetation restoration); SH, shrubbery (natural vegetation restoration); MF, mature forest.
Forests 14 01980 g005
Figure 6. Redundancy analysis (RDA) with forward selection of phospholipid fatty acid (PLFA)-correlative variables restricted by the marked explanatory variables in (a) cropland, (b) plantation forest, (c) shrubbery, and (d) mature forest. The black arrows represent the PLFA related variables, and the red arrows represent the significant explanatory variables. The explanatory variables include pH, soil organic carbon (SOC), total nitrogen (TN), the ratio of SOC to TN (C:N), ammonium, and nitrate. Only explanatory variables that significantly contributed (p < 0.05) to the variability of PLFA-related variables are shown in the figure to simplify it. The percentage corresponding to the variable in the box indicates its contribution to the variation of PLFA-related variables. MAT, mean annual temperature; MAP, mean annual precipitation; Bacteria, abundance of bacteria; Fungi, abundance of fungi; ACT, abundance of actinomycete; AMF, abundance of arbuscular mycorrhizal fungi; Total, abundance of total soil microbial community; GP, abundance of Gram-positive bacteria; GN, abundance of Gram-negative bacteria; GP:GN, ratio of Gram-positive to Gram-negative bacteria; F:B, ratio of fungi to bacteria.
Forests 14 01980 g006
Figure 7. Correlations between the abundance of bacterial PLFAs and soil nitrate nitrogen (NO3N) within the four land use types. ** p < 0.01 and *** p < 0.001. CR, cropland; PF, plantation forest (managed vegetation restoration); SH, shrubbery (natural vegetation restoration); MF, mature forest.
Forests 14 01980 g007
Figure 8. Correlations between soil nitrate nitrogen (NO3N) and mean annual temperature (MAT) within the four land use types. # p < 0.08, * p < 0.05, and ** p < 0.01. CR, cropland; PF, plantation forest (managed vegetation restoration); SH, shrubbery (natural vegetation restoration); MF, mature forest.
Forests 14 01980 g008
Table 1. Plot characteristics of the four land use types in the present study.
CountyLand Use TypesNMAT (°C)MAP (mm)Altitude (m)
ShuichengCR312.612082195–2233
PF312.612082118–2241
SH312.612082186–2264
MF312.612082001–2146
JinshaCR314.610131119–1188
PF314.610131150–1181
SH314.610131006–1127
MF314.610131030–1041
DuyunCR315.512481028–1067
PF314.712201016–1098
SH315.512731098–1127
MF315.512481035–1077
HuanjiangCR318.81371305–392
PF318.81371288–377
SH318.81371388–428
MF318.81371349–496
DuanCR319.61607293–303
PF319.61607350–392
SH319.61607402–428
MF318.81516367–422
MashanCR321.01594276–331
PF321.01594292–367
SH321.01594245–375
MF321.01594558–598
LongzhouCR321.81296347–362
PF321.81296252–378
SH321.81296395–413
MF321.81296359–436
N, number of plots surveyed in each county for each land use type; MAT, mean annual temperature; MAP, mean annual precipitation; CR, cropland; SH, shrubbery (natural vegetation restoration); PF, plantation forest (managed vegetation restoration); MF, mature forest.
Table 2. Soil properties under different land use types.
CRPFSHMF
pH6.51(0.20)6.63(0.16)6.42(0.15)6.47(0.17)
SOC (g kg–1)20.13(1.72) a29.85(2.76) b32.85(2.64) b50.96(4.60) c
TN (g kg–1)2.14(0.19) a2.85(0.22) b3.04(0.25) b4.65(0.39) c
C:N9.57(0.31) a10.45(0.38) ab10.84(0.435) b11.01(0.33) b
NH4+ (mg kg–1)4.47(0.42) a8.11(0.95) b8.67(0.84) b7.65(0.77) b
NO3 (mg kg–1)10.45(1.06) b7.53(1.85) a8.66(2.21) a16.54(2.05) b
CR, cropland; PF, plantation forest (managed vegetation restoration); SH, shrubbery (natural vegetation restoration); MF, mature forest; pH, soil pH; SOC, soil organic carbon; TN, soil total nitrogen; C:N, the ratio of SOC to TN; NH4+, ammonium; NO3, nitrate. The results are shown as means with standard deviations. Various letters represent substantial variation between the four land use types at p < 0.05.
Table 3. Correlations between phospholipid fatty acid (PLFA) signatures and climatic and edaphic variables within each land use type.
Climatic
Variable
Edaphic Variable
MAPMATpHSOCTNC:NNH4+NO3
CRBacteria0.13−0.110.290.420.68 **−0.46 *0.430.12
Fungi−0.20−0.60 **0.370.55 *0.58 **−0.030.46 *0.08
ACT0.280.220.370.190.56 **−0.67 **0.190.24
AMF−0.02−0.56 *0.370.58 **0.57 **−0.020.400.04
Total0.11−0.160.330.430.68 **−0.430.420.14
GP0.260.260.240.160.54 *−0.65 **0.260.15
GN−0.05−0.51 *0.280.61 **0.67 **−0.130.51 *0.06
F:B−0.58 **−0.76 **0.280.24−0.010.50 *0.110.07
GP:GN0.220.78 **−0.35−0.41−0.24−0.32−0.260.01
PFBacteria0.160.350.63 **0.80 **0.89 **0.030.360.57 **
Fungi0.020.110.60 **0.89 **0.90 **0.140.320.32
ACT0.210.50 *0.65 **0.66 **0.79 **−0.110.270.60 **
AMF0.140.120.60 **0.87 **0.87 **0.160.220.39
Total0.170.360.65 **0.80 **0.89 **0.010.340.56 **
GP0.200.51 *0.66 **0.68 **0.82 **−0.110.370.66 **
GN0.070.050.50 *0.88 **0.87 **0.240.290.36
F:B−0.45 *−0.55 *−0.27−0.13−0.280.15−0.12−0.60 **
GP:GN0.280.83 **0.47 *−0.160.11−0.64 **0.260.52 *
SHBacteria0.200.56 **0.340.58 **0.64 **0.01−0.230.82 **
Fungi0.320.52 *0.45 *0.55 *0.55 **0.08−0.170.62 **
ACT0.190.58 **0.49 *0.57 **0.68 **−0.14−0.370.90 **
AMF0.240.400.50 *0.65 **0.68 **0.03−0.360.69 **
Total0.220.57 **0.390.58 **0.65 **−0.02−0.260.83 **
GP0.260.64 **0.390.55 *0.64 **−0.09−0.210.83 **
GN0.090.390.260.61 **0.61 **0.15−0.270.75 **
F:B−0.30−0.63 **−0.15−0.42−0.50 *0.080.16−0.77 **
GP:GN0.51 *0.71 **0.24−0.130.06−0.50 *0.290.19
MFBacteria0.53 *0.350.74 **0.73 **0.77 **0.03−0.52 *0.82 **
Fungi0.46 *0.200.66 **0.73 **0.69 **0.25−0.310.64 **
ACT0.49 *0.410.80 **0.67 **0.72 **−0.01−0.55 *0.79 **
AMF0.52 *0.260.78 **0.78 **0.76 **0.19−0.49 *0.75 **
Total0.52 *0.360.76 **0.73 **0.76 **0.05−0.51 *0.81 **
GP0.56 **0.46 *0.75 **0.65 **0.73 **−0.07−0.54 *0.85 **
GN0.47 *0.210.70 **0.80 **0.79 **0.16−0.47 *0.75 **
F:B−0.58 **−0.58 **−0.56 **−0.33−0.54 *0.56 **0.84 **−0.81 **
GP:GN−0.150.29−0.29−0.71 **−0.58 **−0.430.12−0.32
MAP, mean annual precipitation; MAT, mean annual temperature; pH, soil pH; SOC, soil organic carbon; TN, soil total nitrogen; C:N, the ratio of SOC to TN; NH4+, ammonium; NO3, nitrate; CR, cropland; PF, plantation forest (managed vegetation restoration); SH, shrubbery (natural vegetation restoration); MF: mature forest; Bacteria, abundance of bacterial; Fungi, abundance of fungi; ACT, abundance of actinomycete; AMF, abundance of arbuscular mycorrhizal fungi; Total, abundance of total soil microbial community; GP, abundance of Gram-positive bacteria; GN, abundance of Gram-negative bacteria; F:B, ratio of fungi to bacteria; GP:GN, ratio of Gram-positive to Gram-negative bacteria. * and ** denote significance at p < 0.05 and p < 0.01, respectively.
Table 4. Correlations between edaphic variables and climatic factors within each land use type.
pHSOCTNC:NNH4+NO3
CRMAP0.33−0.49 *−0.29−0.47 *−0.57 **0.13
MAT0.07−0.67 **−0.37−0.54 *−0.58 **0.01
PFMAP0.57 **−0.170.06−0.61 **−0.280.21
MAT0.72 **−0.140.20−0.77 **0.210.65 **
SHMAP0.45 *−0.080.07−0.38−0.050.02
MAT0.48 *−0.110.18−0.62 **0.100.40
MFMAP0.66 **0.270.36−0.23−0.59 **0.52 *
MAT0.58 **−0.170.07−0.63 **−0.61 **0.54 *
pH, soil pH; SOC, soil organic carbon; TN, soil total nitrogen; C:N, the ratio of SOC to TN; NO3, nitrate; NH4+, ammonium; MAT, mean annual temperature; MAP, mean annual precipitation; CR, cropland; PF, plantation forest (managed vegetation restoration); SH, shrubbery (natural vegetation restoration); MF, mature forest. * and ** denote significance at p < 0.05 and p < 0.01, respectively.
Disclaimer/Publisher’s Note: The statements, opinions and data contained in all publications are solely those of the individual author(s) and contributor(s) and not of MDPI and/or the editor(s). MDPI and/or the editor(s) disclaim responsibility for any injury to people or property resulting from any ideas, methods, instructions or products referred to in the content.

