


Monitoring the Condition of Wetlands in the Syr Darya Floodplain—How Healthy Are the Tugai Forests in Kazakhstan?

Abstract
:1. Introduction
2. Materials and Methods
2.1. Study Area
2.2. Data
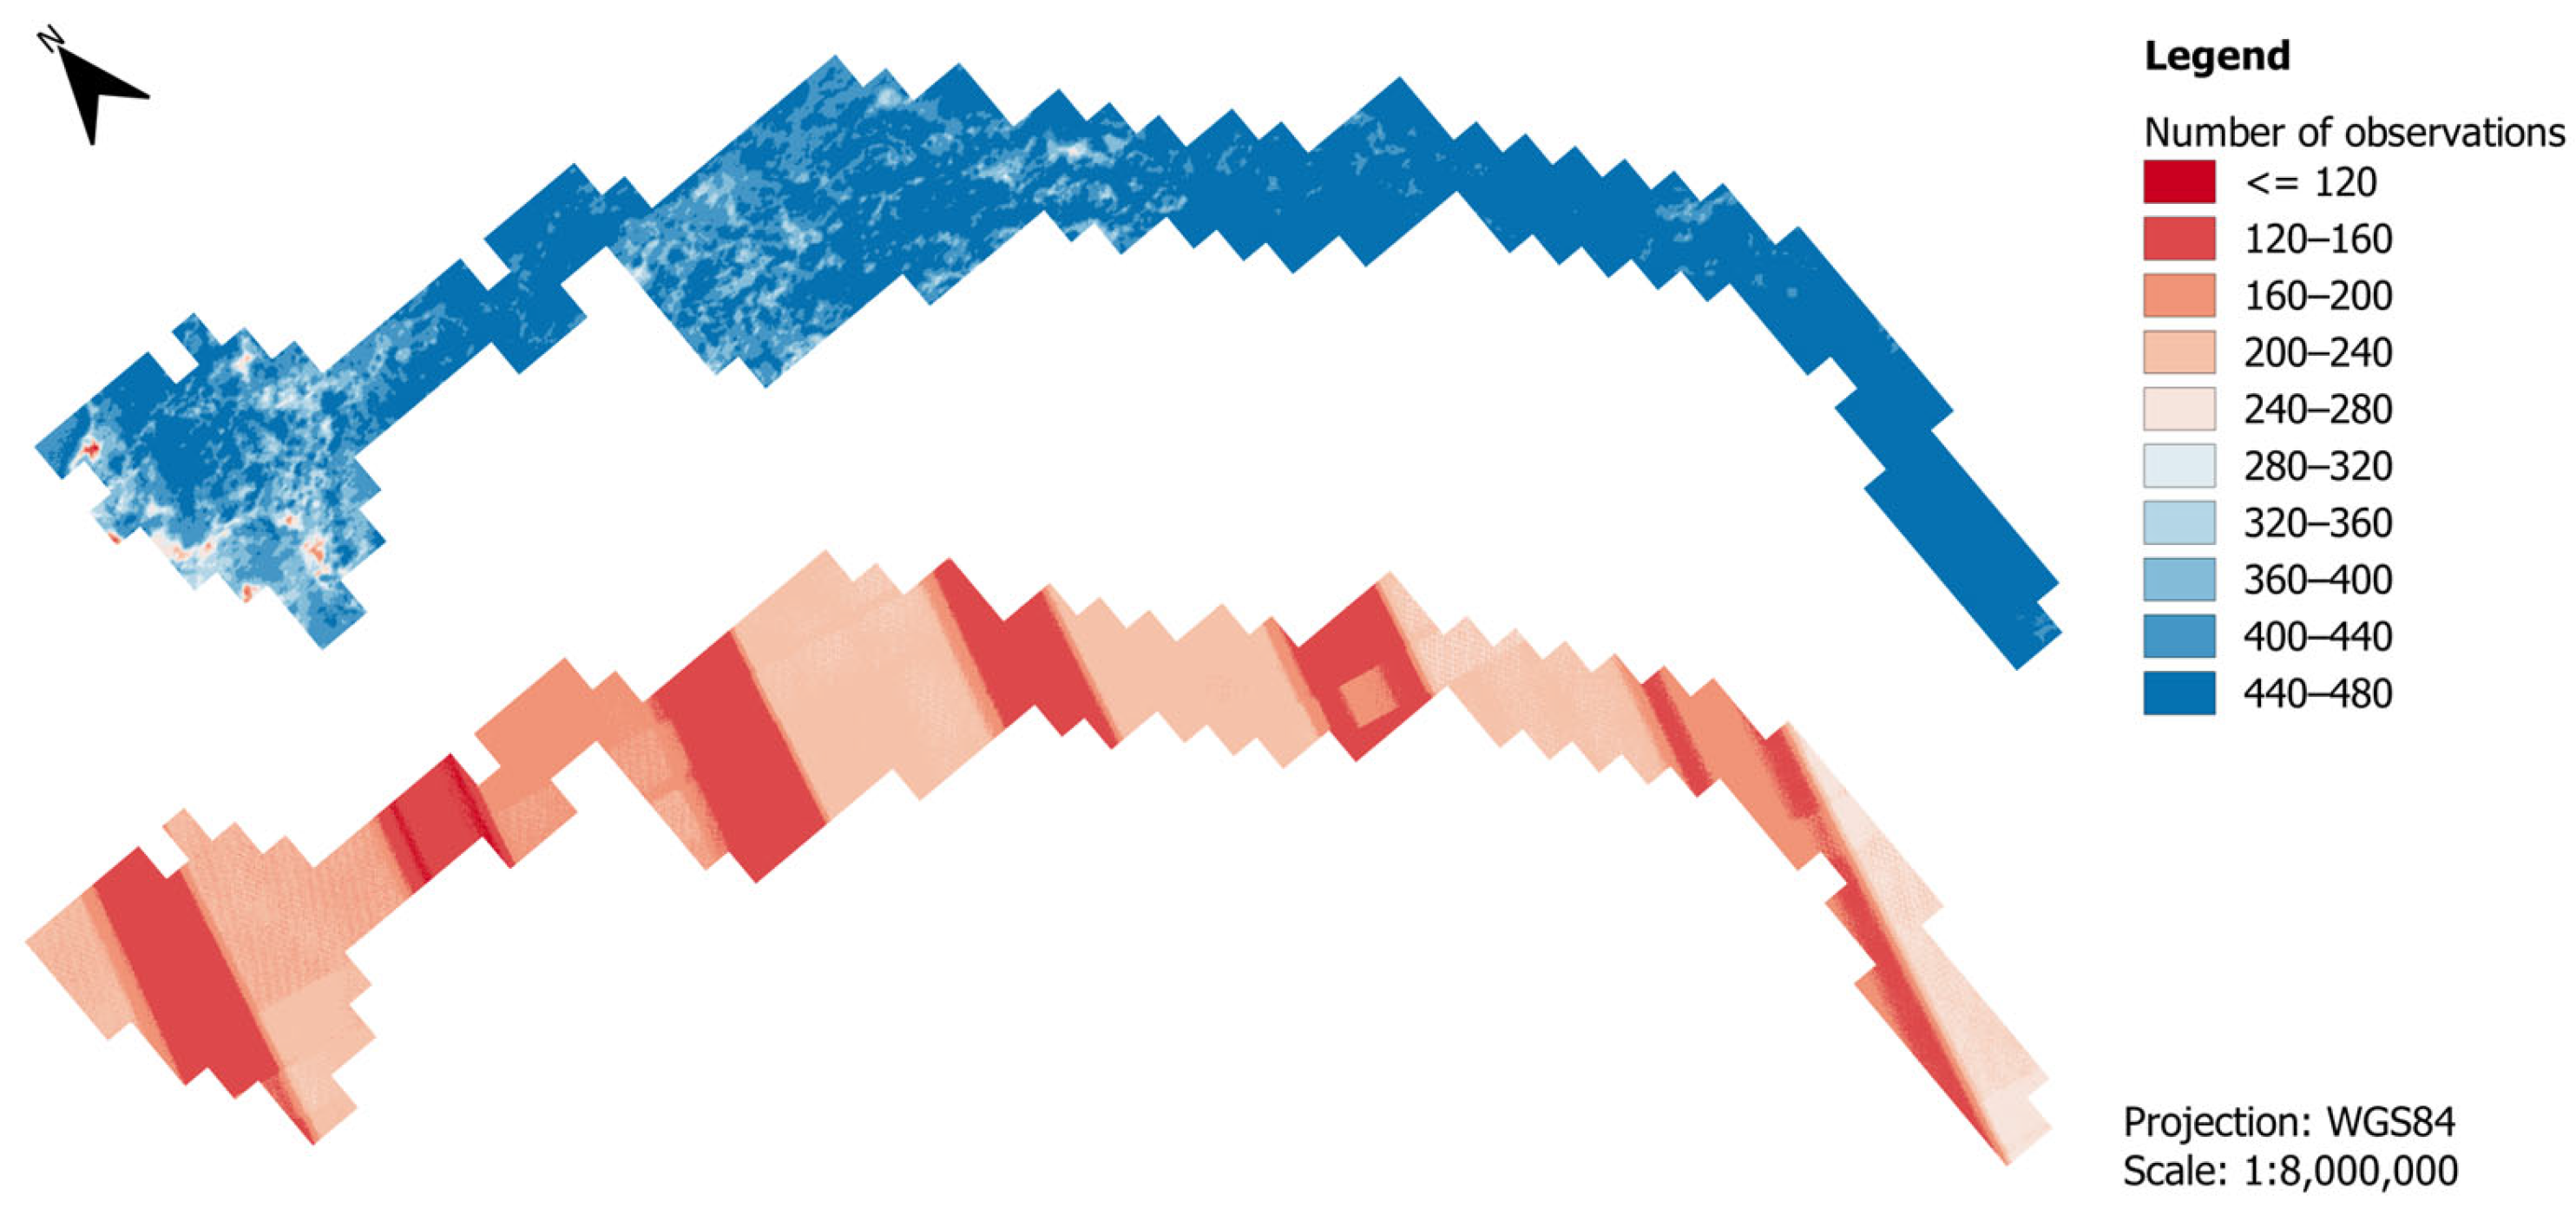
2.2.1. Satellite Imagery
2.2.2. Validation Data
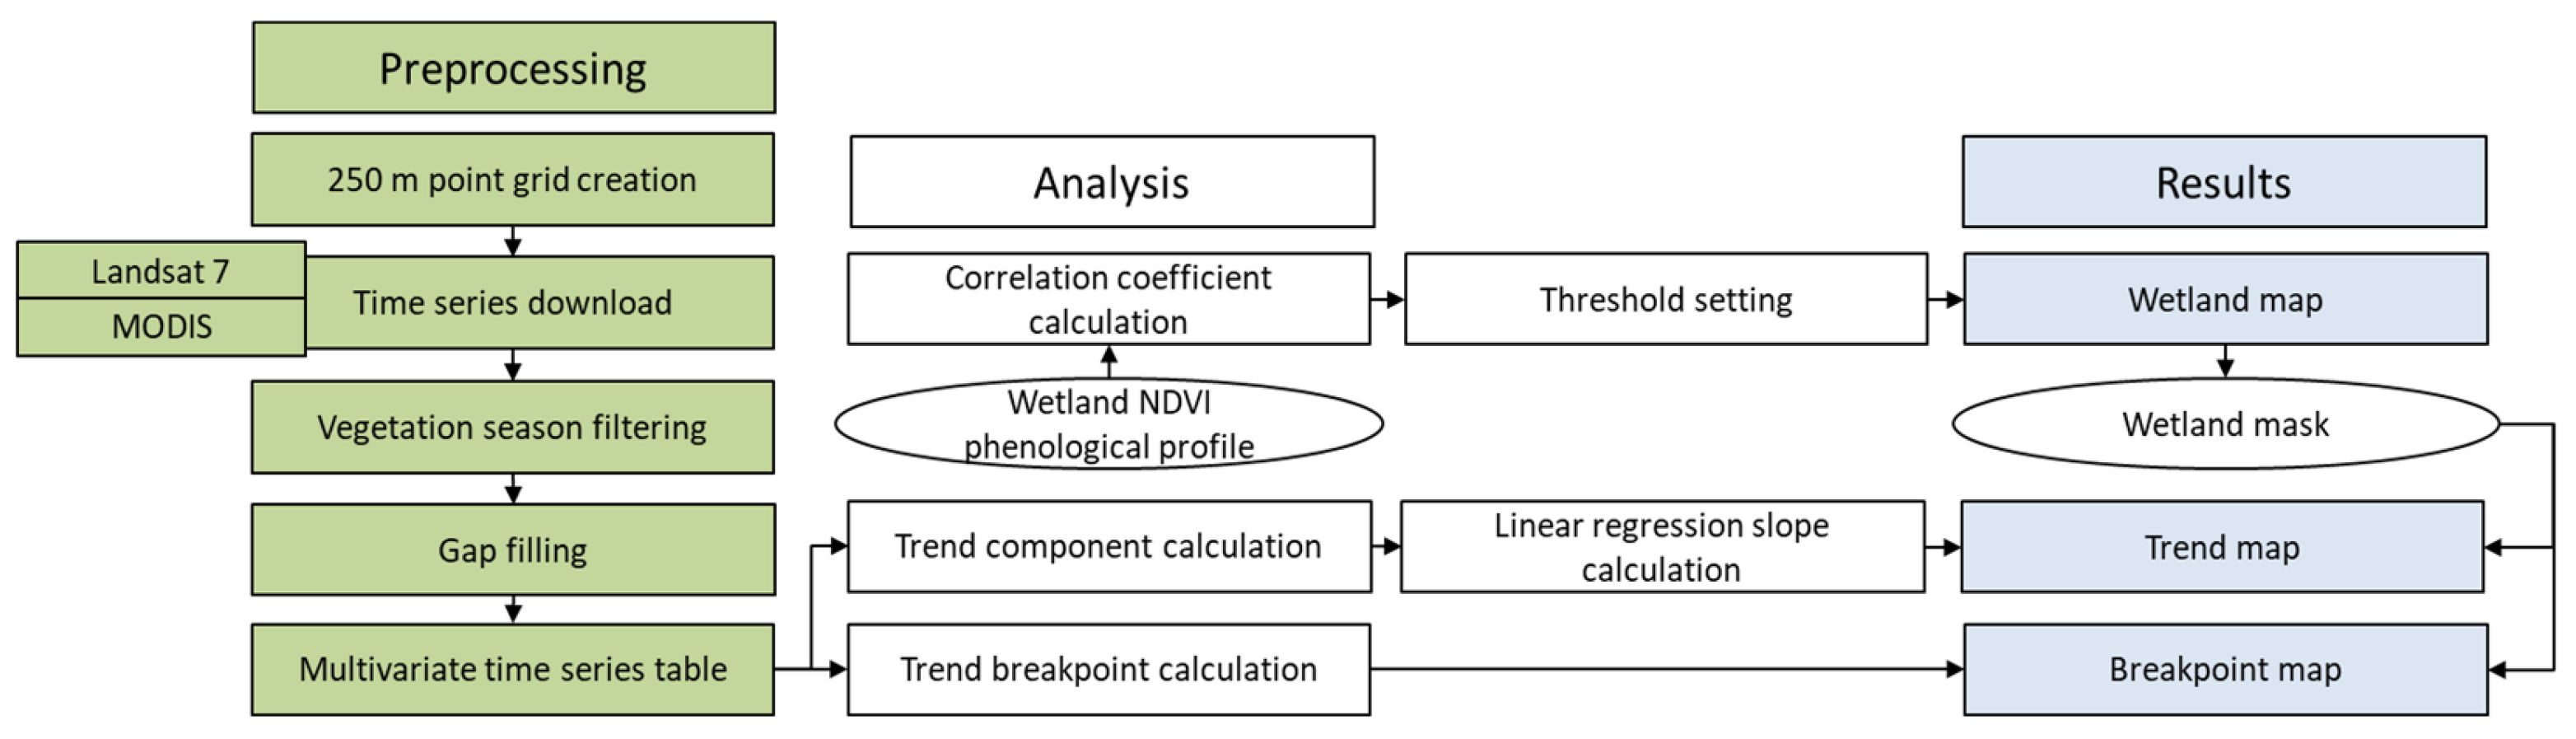
2.3. Methods
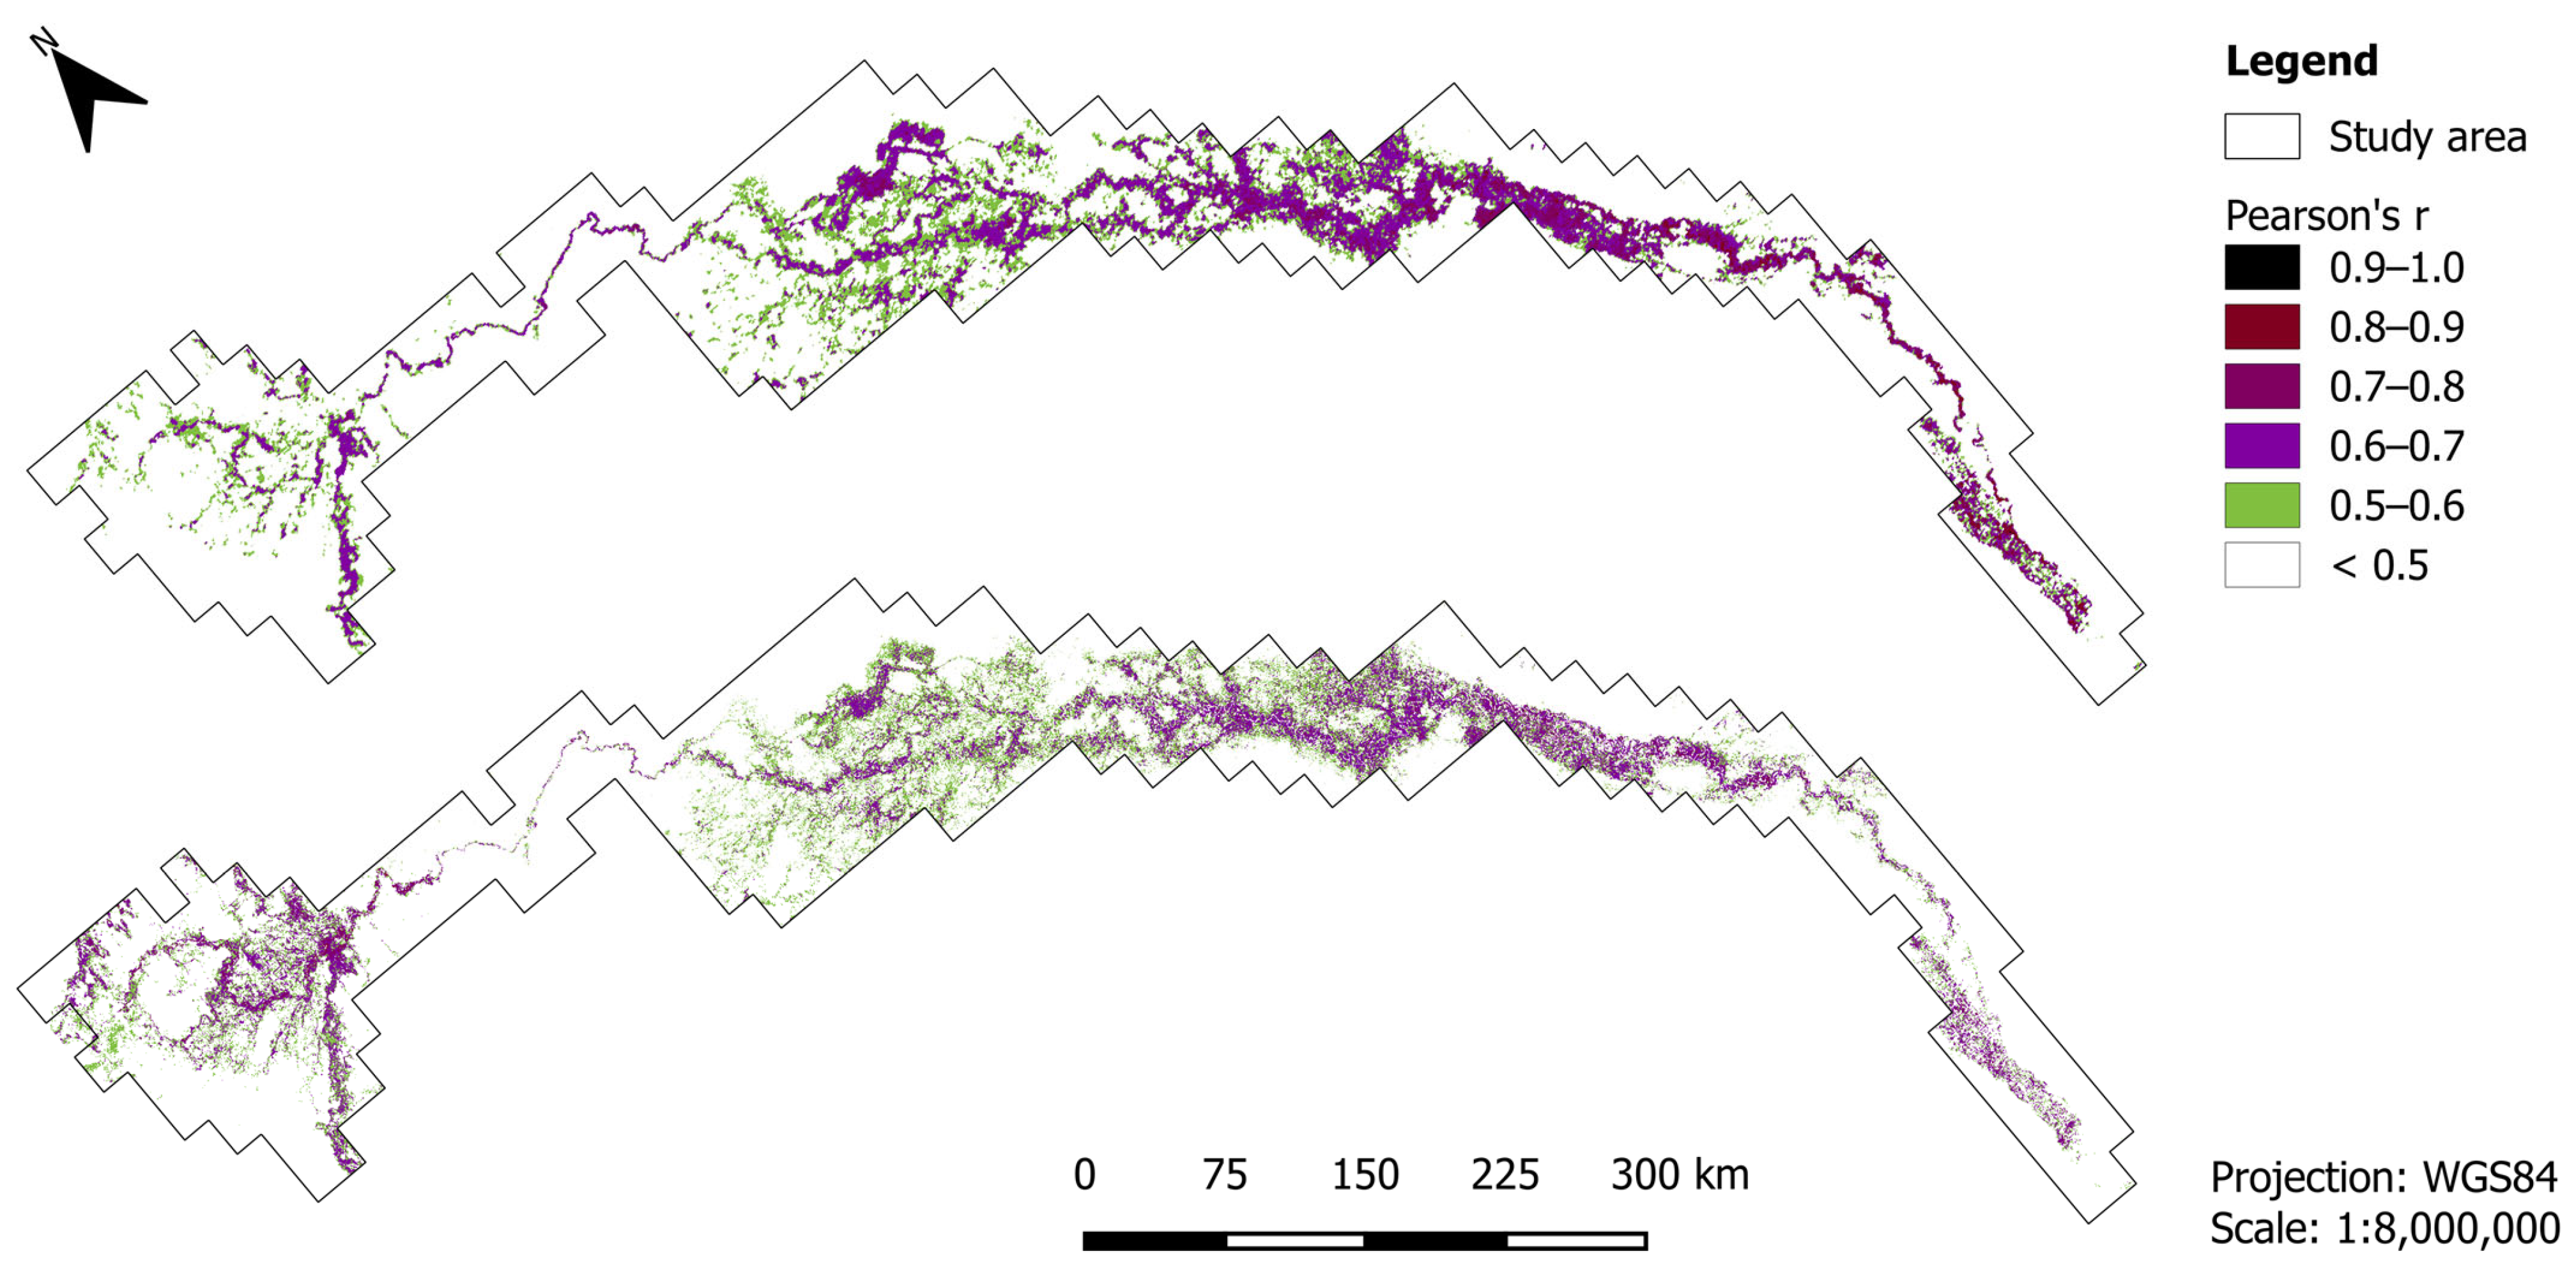
2.3.1. Linear-Regression-Based Wetland Mask Creation
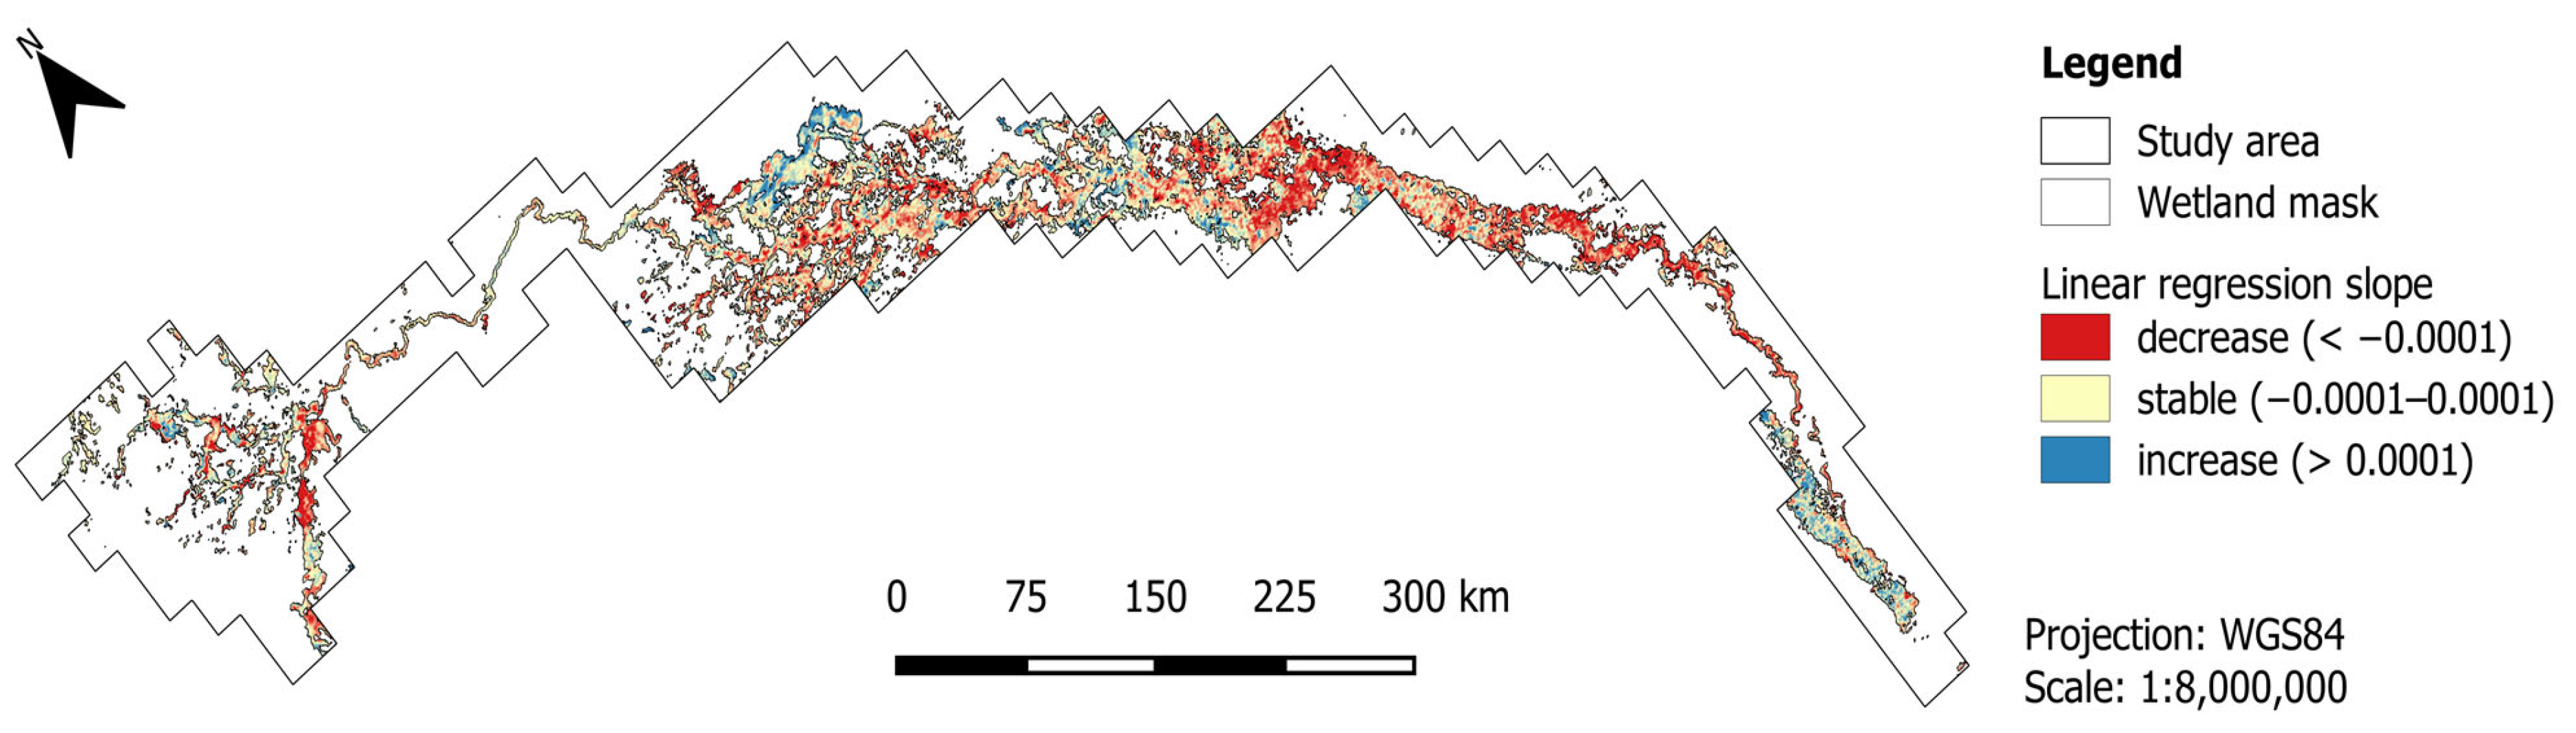
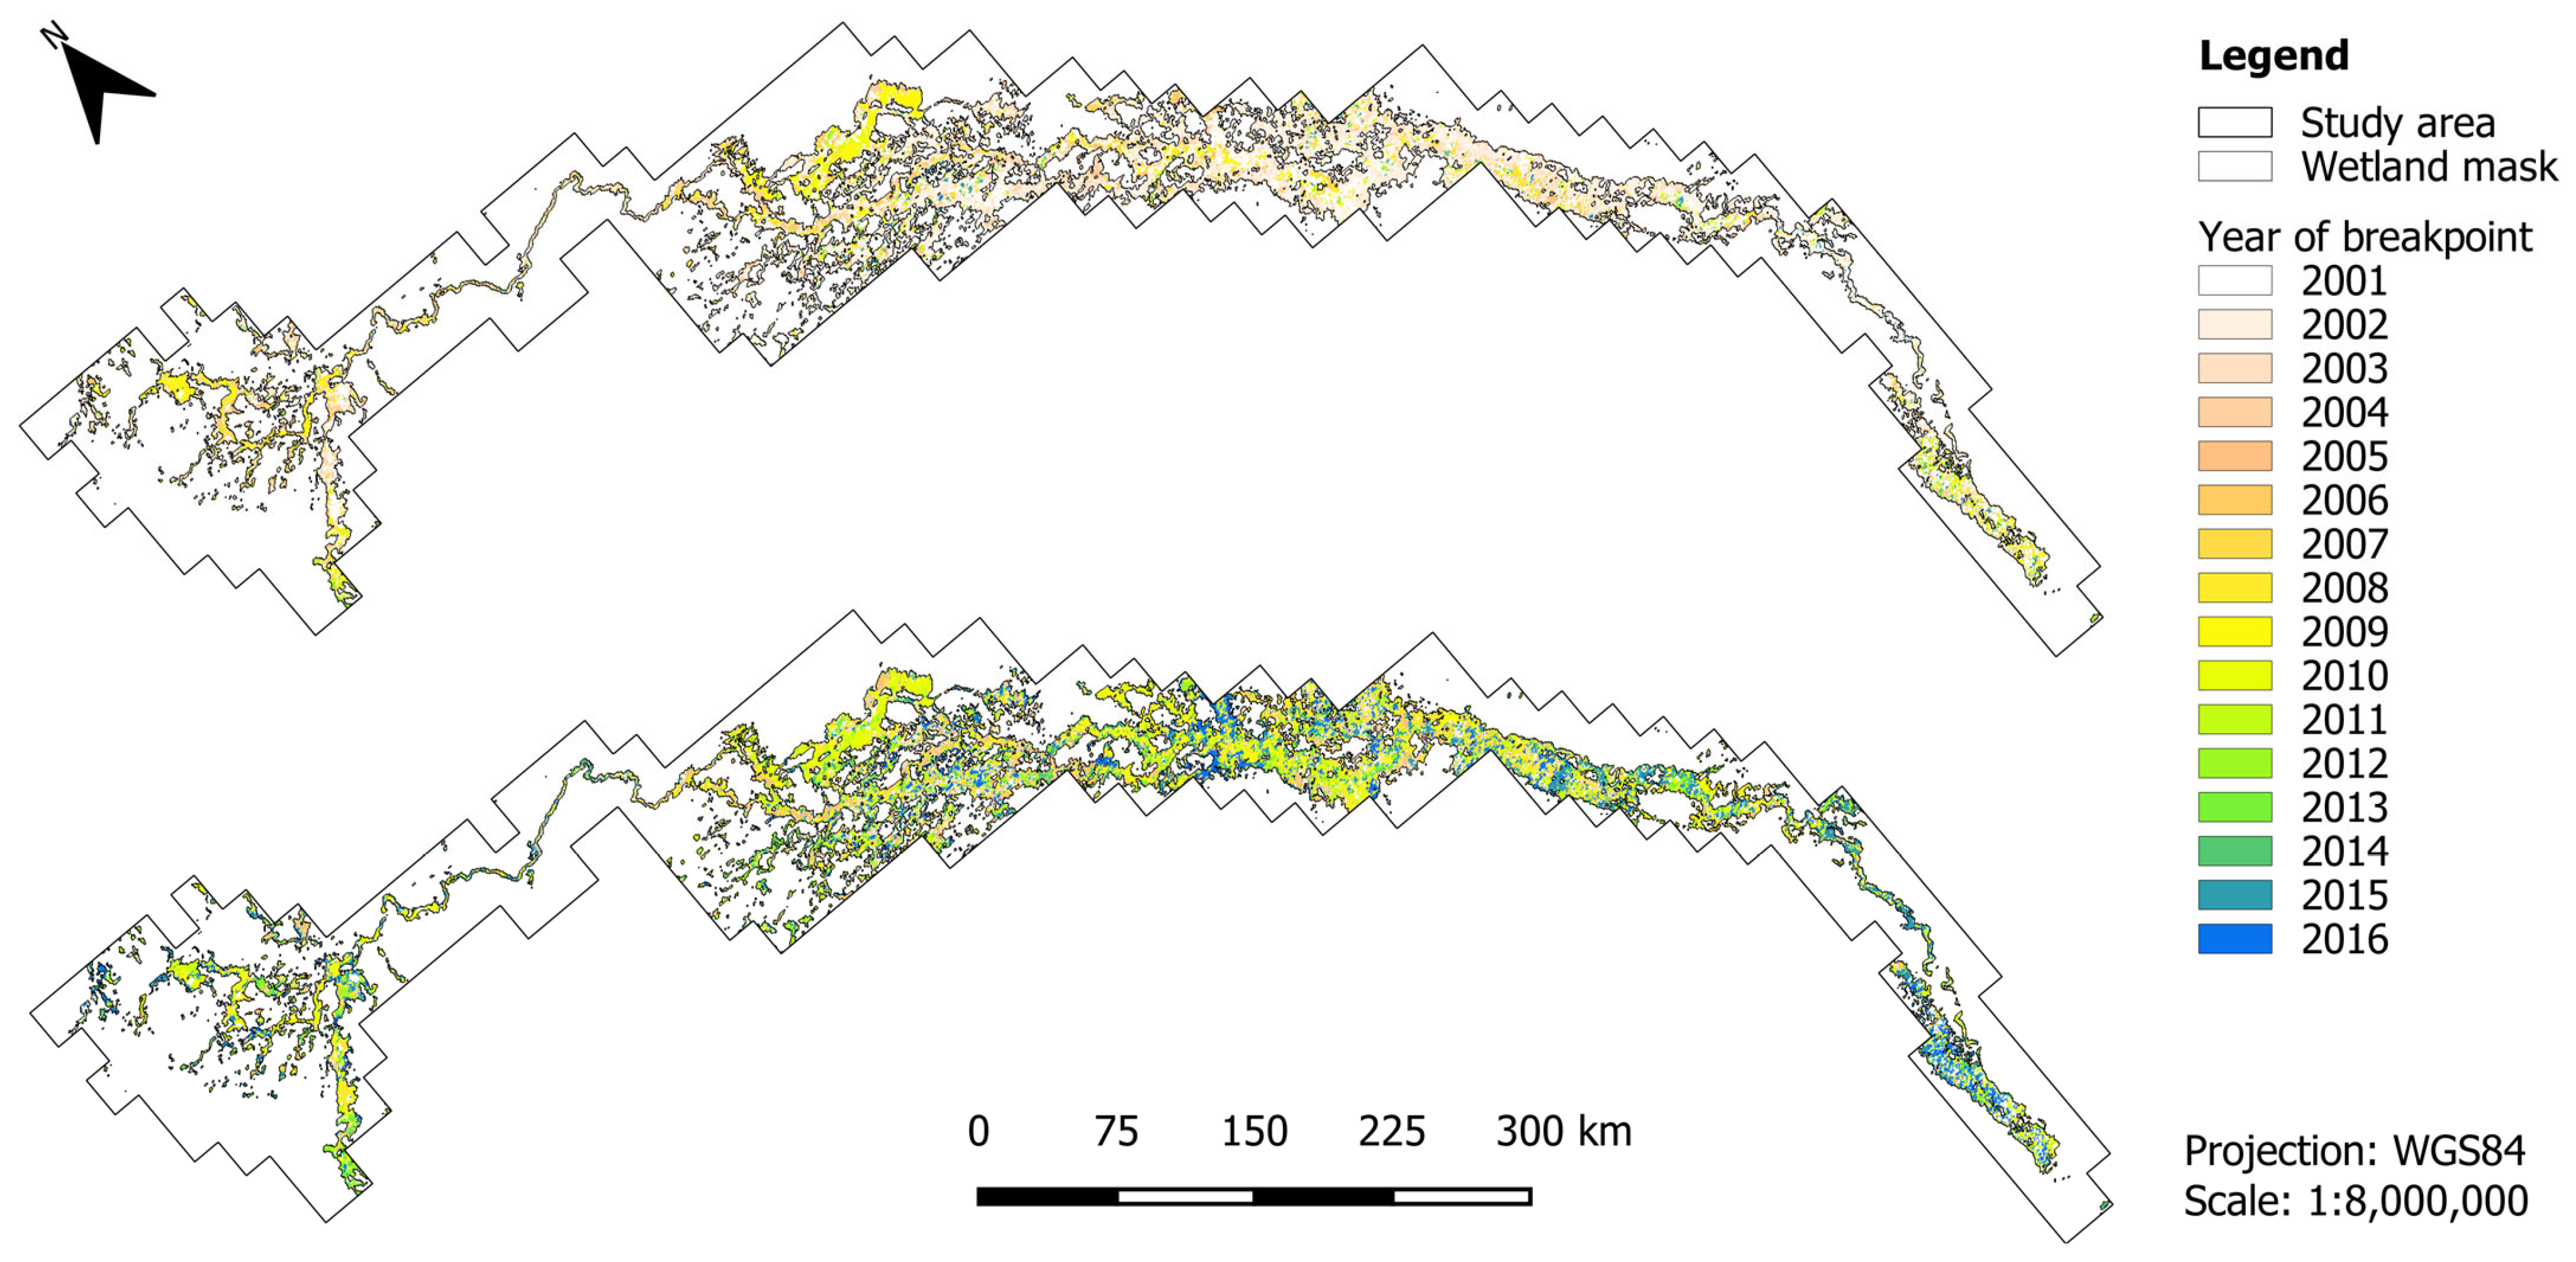
2.3.2. Trend and Breakpoint Detection
3. Results
3.1. Wetland Masks and Accuracy Assessment
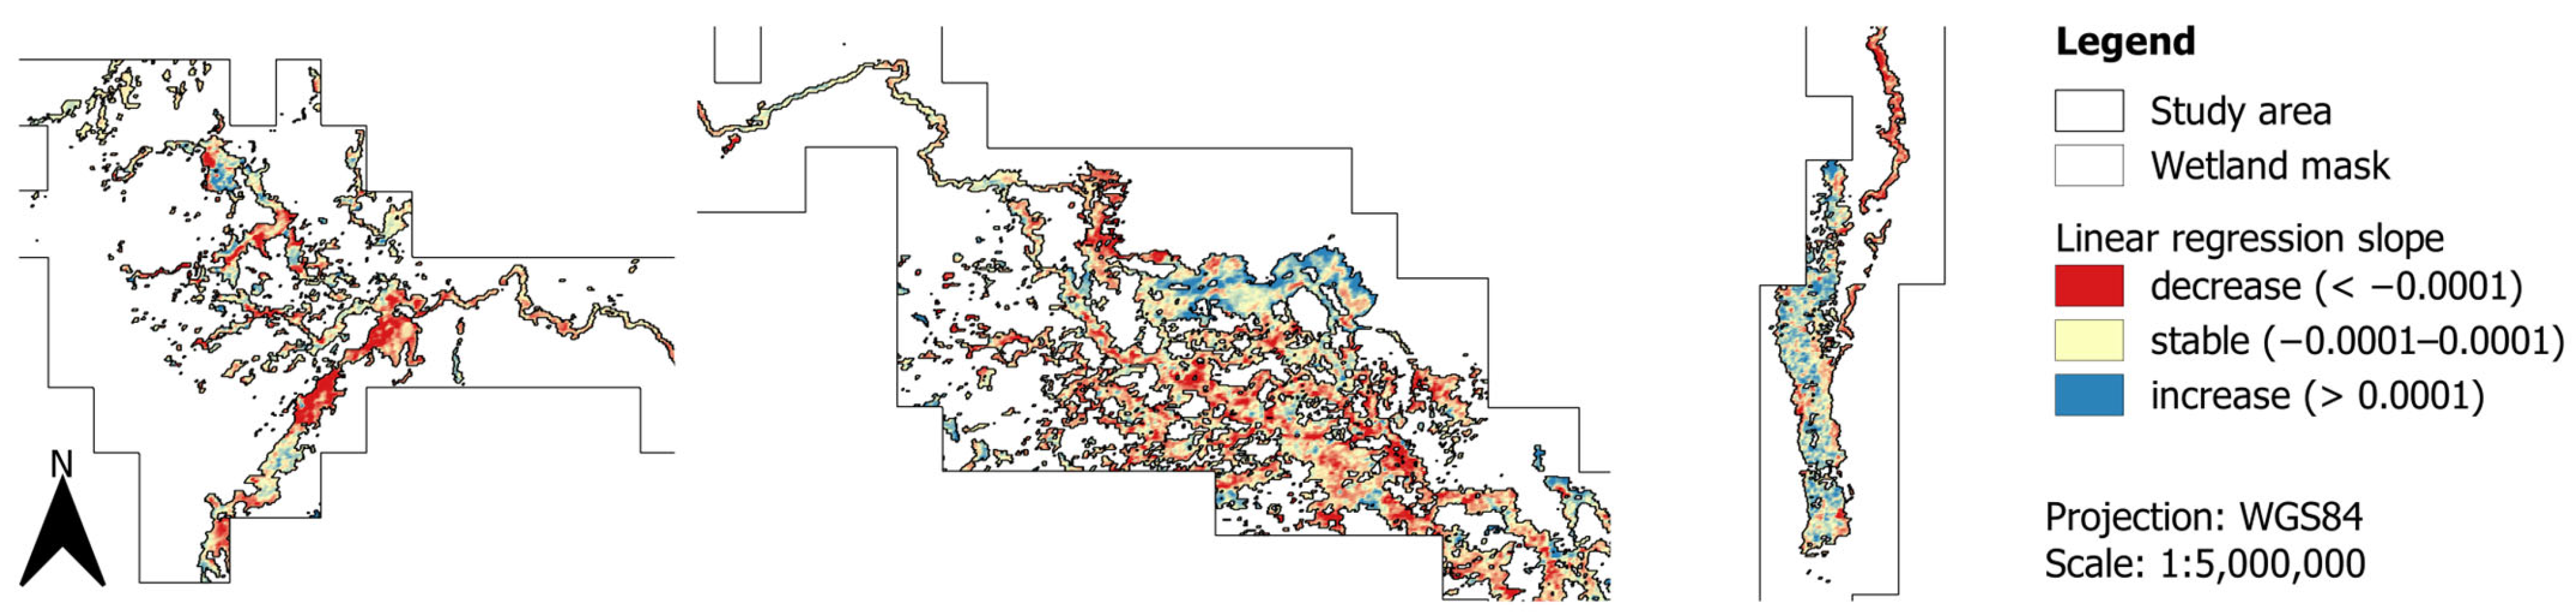
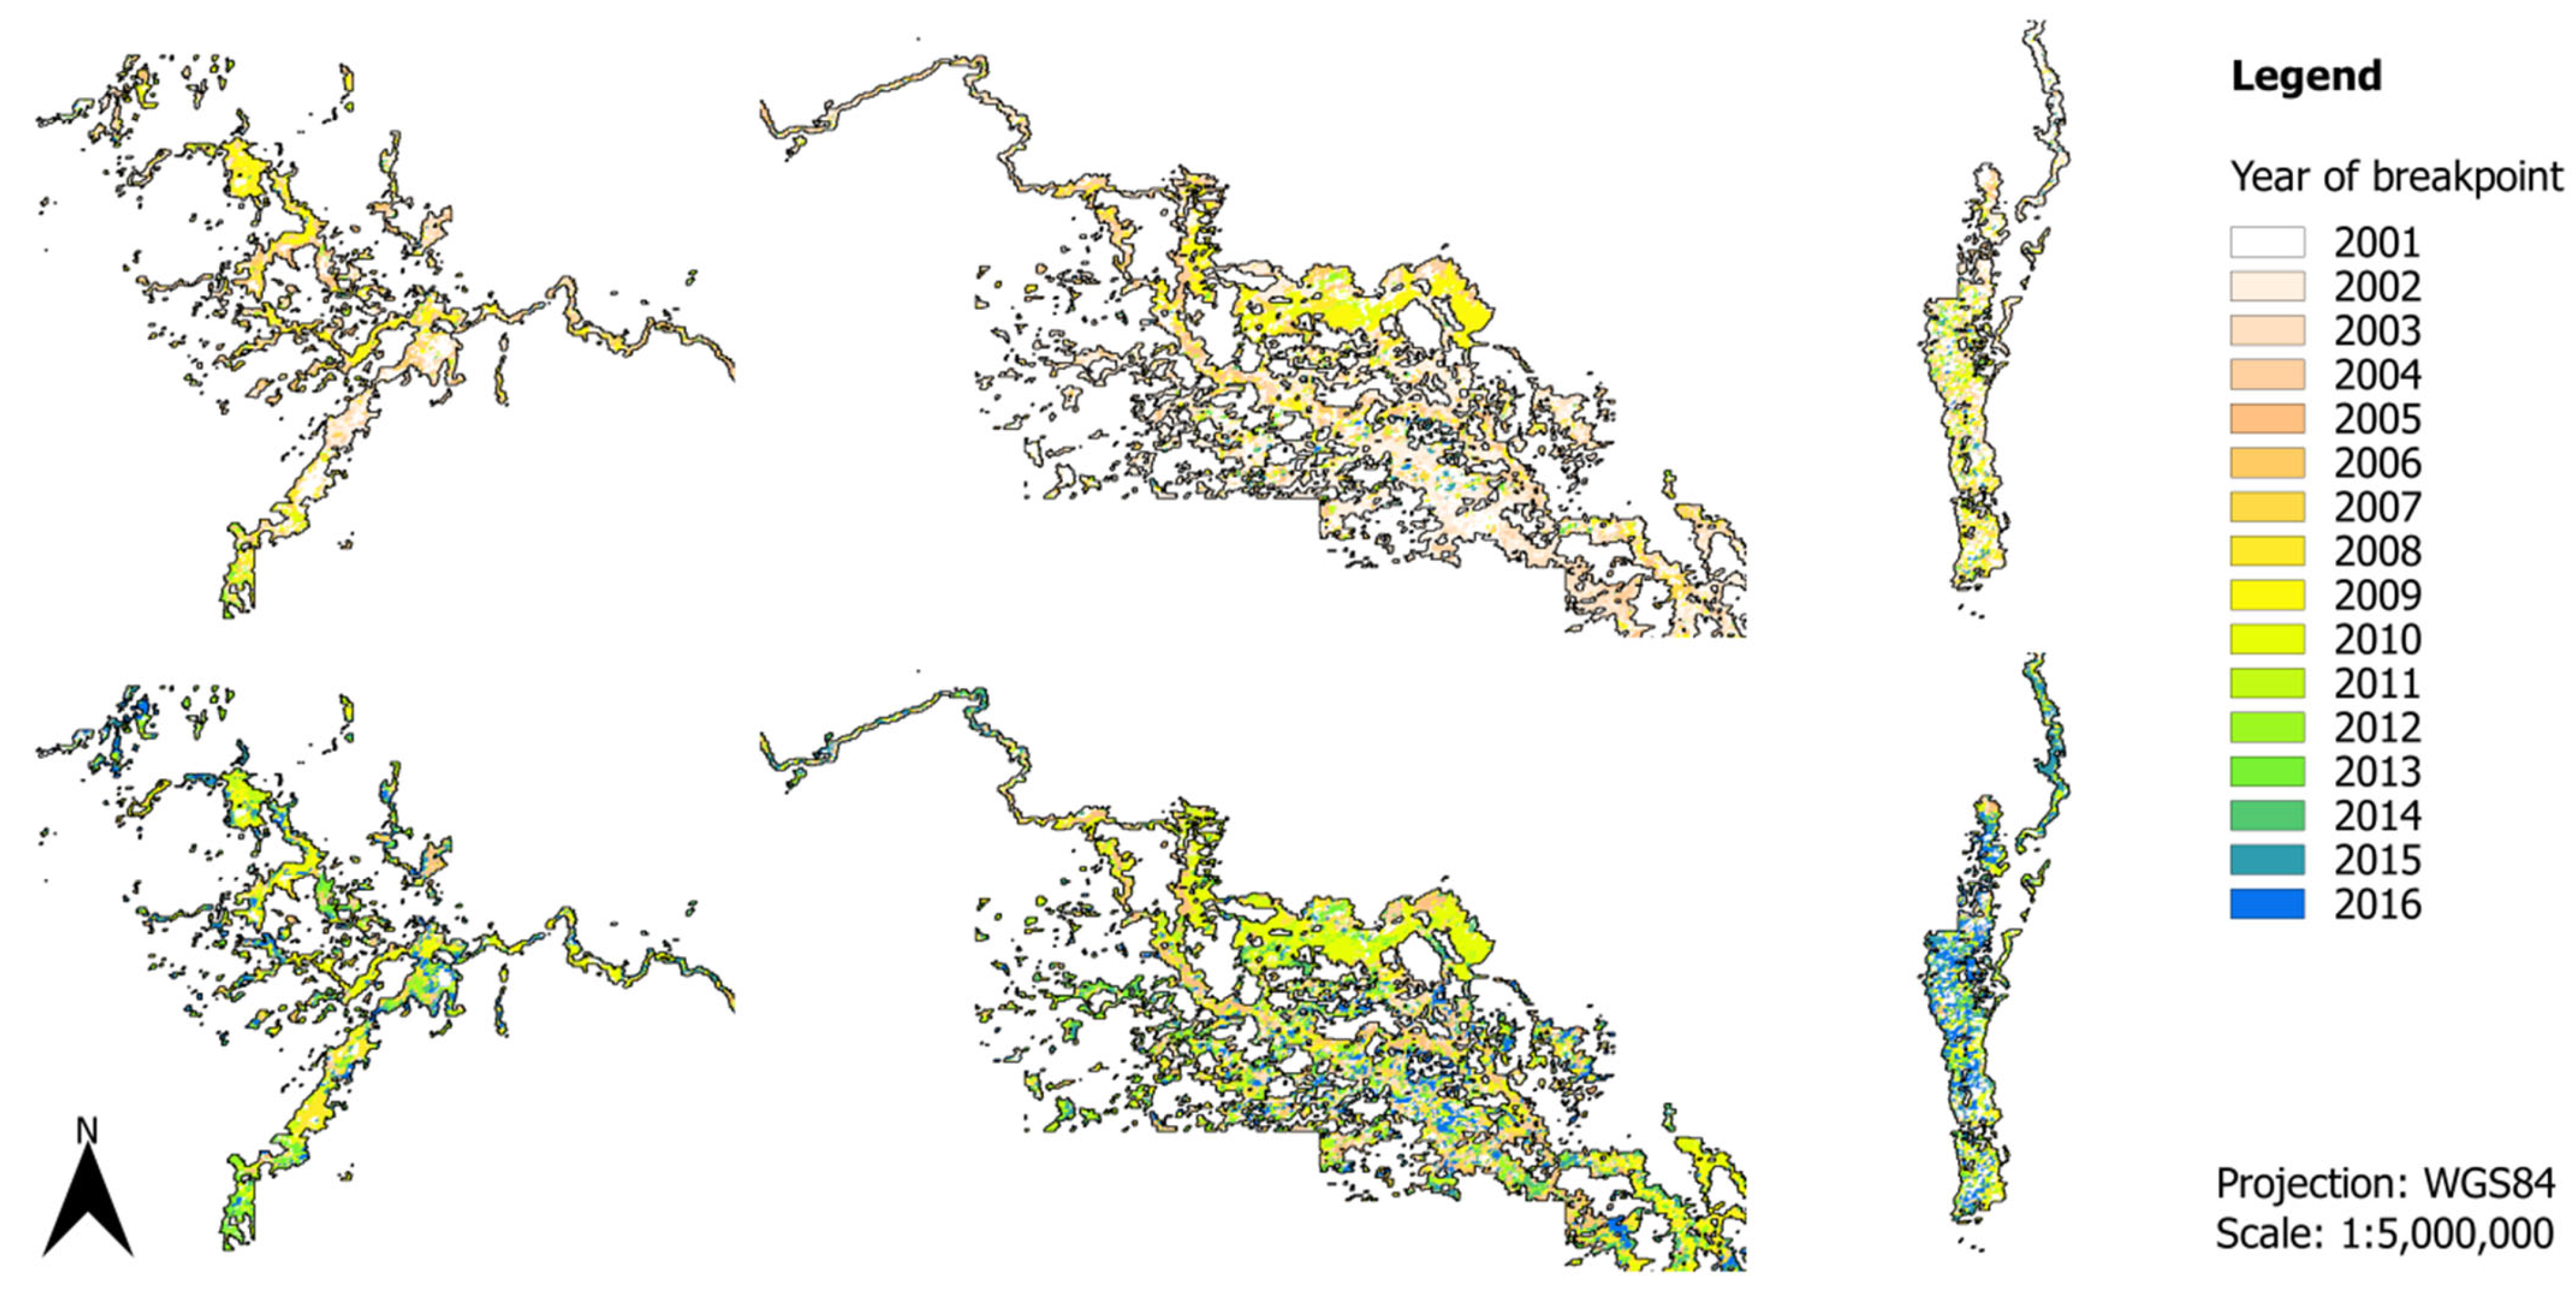
3.2. Trend and Breakpoint Detection
4. Discussion
4.1. Wetland Detection and Masking
4.2. Trend and Breakpoint Detection
5. Conclusions
Author Contributions
Funding
Data Availability Statement
Acknowledgments
Conflicts of Interest
Appendix A

| Name | Country | River System | Source(s) |
|---|---|---|---|
| Syr Darya–Turkestan State Regional Park (P. pruinosa) | KZ | Syr Darya Middle Reaches | [*] |
| Syr Darya near Zhanakorgan (P. pruinosa, P. euphratica) | KZ | Syr Darya Middle Reaches | [*] |
| Amudarya State Nature Reserve (P. pruinosa, P. euphratica) | TM | Amu Darya | [12] |
| Lower Amu Darya State Biosphere Reserve (Badai-Tugai Nature Reserve) (P. euphratica, P. pruinosa) | UZ | Lower Amu Darya | [5,67] |
| Northern Amu Darya Delta (P. euphratica, P. pruinosa) | UZ | Amu Darya Delta | [68] |
| Ili River Zheltorangy Genetic Reserve (P. pruinosa) | KZ | Ili River Delta | [*], [3] |
| Ili River near Topar (P. euphratica, P. pruinosa) | KZ | Ili River Delta | [*], [3] |
| Ili River near West Shonzy (P. pruinosa, P. euphratica) | KZ | Ili River Lower Reaches | [*] |
| Ili River near South Koktal (P. pruinosa, P. euphratica) | KZ | Ili River Lower Reaches | [*] |
| Tarim Huyanglin Nature Reserve (Tarim Euphrates Poplar National Nature Reserve) (P. euphratica) | CN | Tarim River Middle and Lower Reaches | [1,2,7,11,39,42,69,70] |
| Yingbazar (P. euphratica) | CN | Tarim River Upper Reaches | [10,71] |
| Argan (P. euphratica) | CN | Tarim Lower Reaches | [10,72] |
| Ebinur Lake (P. euphratica) | CN | Boro-Tala River | [8,10] |
| Ekhiin-Gol Oasis (Great Gobi A) (P. euphratica) | MN | Gobi Lakes Valley | [73] |
| Ejin Diversifolius Poplar Forest National Nature Reserve (Heihe Oasis/East Junyan Lake/Ejina Oasis) (P. euphratica) | CN | Heihe River Basin/Ejina River | [74,75,76] |
| Lower Chu River (Populus sp.) | KZ | Lower Chu Reaches | [77] |
| Inner Mongolia, Gansu, Qinghai, Ningxia (Populus sp.) | CN | - | [4] |


| wetland | non-wetland | |||||||
|---|---|---|---|---|---|---|---|---|
| forest1 | forest2 | forest1 | forest2 | forest1 | forest2 | forest1 | forest2 | |
| wetland | 585 | 168 | 371 | 440 | 230 | 52 | 6 | 87 |
| non-wetland | 194 | 8 | 101 | 52 | 233 | 50 | 439 | 395 |
| PA | 75.1% | 95.5% | 78.6% | 89.4% | 50.3% | 49.0% | 98.7% | 82.9% |
| PA2 | 81.5% | 74.9% | ||||||
| OA | 78.6% | |||||||
| wetland | non-wetland | |||||||
|---|---|---|---|---|---|---|---|---|
| forest1 | forest2 | water | wetland | cropland1 | cropland2 | dryland | settlement | |
| wetland | 429 | 104 | 11 | 258 | 70 | 20 | 2 | 52 |
| non-wetland | 350 | 72 | 461 | 234 | 393 | 82 | 443 | 430 |
| PA | 55.1% | 59.1% | 0.2% | 52.4% | 84.9% | 80.4% | 99.6% | 89.2% |
| PA2 | 41.8% | 90.3% | ||||||
| OA | 63.0% | |||||||
References
- Ding, J.; Zhao, W. Comparing Chinese and International Studies of Riparian Forests: A Bibliometric Survey (1981–2014). Acta Ecol. Sin. 2016, 36, 377–385. [Google Scholar] [CrossRef]
- Schäfer, P.; Saleh, M.; Yu, R.; Zhang, X.; Thomas, F.M. Decrease in Growth Increment of Populus euphratica upon Defoliation by Lepidopteran Larvae in a Central-Asian Floodplain Forest. J. Arid. Environ. 2017, 146, 99–102. [Google Scholar] [CrossRef]
- Immentai, A.; Thevs, N.; Schmidt, S.; Nurtazin, S.; Salmurzauli, R. Vegetation, fauna, and biodiversity of the Ile Delta and southern Lake Balkhash—A review. J. Great Lakes Res. 2015, 41, 688–696. [Google Scholar] [CrossRef]
- Thevs, N. Tugay Vegetation in the Middle Reaches of the Tarim River—Vegetation Types and Their Ecology. Arch. Naturschutz Landschaftsforschung 2005, 44, 63–84. [Google Scholar]
- Tesch, N.; Thevs, N. Wetland Distribution Trends in Central Asia. Cent. Asian J. Water Res. 2020, 6, 39–65. [Google Scholar] [CrossRef]
- Millennium Ecosystem Assessment. Ecosystems and Human Well-Being: Synthesis; World Resources Institute: Washington, DC, USA, 2005. [Google Scholar]
- Olson, D.M.; Dinerstein, E.; Wikramanayake, E.D.; Burgess, N.D.; Powell, G.V.N.; Underwood, E.C.; D’amico, J.A.; Itoua, I.; Strand, H.E.; Morrison, J.C.; et al. Terrestrial Ecoregions of the World: A New Map of Life on Earth. BioScience 2001, 51, 933. [Google Scholar] [CrossRef]
- Säumel, I.; Ziche, D.; Yu, R.; Kowarik, I.; Overdieck, D. Grazing as a Driver for Populus euphratica Woodland Degradation in the Semi-Arid Aibi Hu Region, Northwestern China. J. Arid. Environ. 2011, 75, 265–269. [Google Scholar] [CrossRef]
- Wang, J.; Li, Z.; Guo, Q.; Ren, G.; Wu, Y. Genetic Variation within and between Populations of a Desert Poplar (Populus euphratica) Revealed by SSR Markers. Ann. For. Sci. 2011, 68, 1143. [Google Scholar] [CrossRef]
- Kramp, K.; Schmitt, T.; Lang, P.; Jeschke, M.; Schäfer, P.; Kulanek, D.; Zhang, X.; Yu, R.; Thomas, F.M. Clones or No Clones: Genetic Structure of Riparian Populus euphratica Forests in Central Asia. J. Arid. Land 2018, 10, 750–766. [Google Scholar] [CrossRef]
- Lang, P.; Ahlborn, J.; Schäfer, P.; Wommelsdorf, T.; Jeschke, M.; Zhang, X.; Thomas, F.M. Growth and Water Use of Populus euphratica Trees and Stands with Different Water Supply along the Tarim River, NW China. For. Ecol. Manag. 2016, 380, 139–148. [Google Scholar] [CrossRef]
- Thevs, N.; Buras, A.; Zerbe, S.; Kuhnel, E.; Abdusalih, N.; Ovezberdiyeva, A. Structure and Wood Biomass of Near-Natural Floodplain Forests along the Central Asian Rivers Tarim and Amu Darya. Forestry 2012, 85, 193–202. [Google Scholar] [CrossRef]
- Scheffer, M.; Bascompte, J.; Brock, W.A.; Brovkin, V.; Carpenter, S.R.; Dakos, V.; Held, H.; Van Nes, E.H.; Rietkerk, M.; Sugihara, G. Early-Warning Signals for Critical Transitions. Nature 2009, 461, 53–59. [Google Scholar] [CrossRef] [PubMed]
- Xu, C.; Van Nes, E.H.; Holmgren, M.; Kéfi, S.; Scheffer, M. Local Facilitation May Cause Tipping Points on a Landscape Level Preceded by Early-Warning Indicators. Am. Nat. 2015, 186, E81–E90. [Google Scholar] [CrossRef] [PubMed]
- Brook, B.W.; Ellis, E.C.; Perring, M.P.; Mackay, A.W.; Blomqvist, L. Does the Terrestrial Biosphere Have Planetary Tipping Points? Trends Ecol. Evol. 2013, 28, 396–401. [Google Scholar] [CrossRef] [PubMed]
- Ban, Y.; Yousif, O. Change Detection Techniques: A Review. In Multitemporal Remote Sensing; Ban, Y., Ed.; Springer International Publishing: Cham, Switzerland, 2016; Volume 20, pp. 19–43. ISBN 9783319470351. [Google Scholar]
- Zhu, Z. Change Detection Using Landsat Time Series: A Review of Frequencies, Preprocessing, Algorithms, and Applications. ISPRS J. Photogramm. Remote Sens. 2017, 130, 370–384. [Google Scholar] [CrossRef]
- Kuenzer, C.; Dech, S.; Wagner, W. Remote Sensing Time Series Revealing Land Surface Dynamics: Status Quo and the Pathway Ahead; Remote Sensing Time Series; Kuenzer, C., Dech, S., Wagner, W., Eds.; Springer International Publishing: Cham, Switzerland, 2015; Volume 22, pp. 1–24. ISBN 9783319159669. [Google Scholar]
- Hansen, M.C.; Potapov, P.V.; Moore, R.; Hancher, M.; Turubanova, S.A.; Tyukavina, A.; Thau, D.; Stehman, S.V.; Goetz, S.J.; Loveland, T.R.; et al. High-Resolution Global Maps of 21st-Century Forest Cover Change. Science 2013, 342, 850–853. [Google Scholar] [CrossRef] [PubMed]
- Friedl, M.A.; Sulla-Menashe, D.; Tan, B.; Schneider, A.; Ramankutty, N.; Sibley, A.; Huang, X. MODIS Collection 5 Global Land Cover: Algorithm Refinements and Characterization of New Datasets. Remote Sens. Environ. 2010, 114, 168–182. [Google Scholar] [CrossRef]
- Jun, C.; Ban, Y.; Li, S. Open Access to Earth Land-Cover Map. Nature 2014, 514, 434. [Google Scholar] [CrossRef]
- European Space Agency ESA CCI Global Land Cover Maps v2.0.7. Available online: https://www.esa-landcover-cci.org/ (accessed on 1 December 2020).
- Bastin, J.-F.; Berrahmouni, N.; Grainger, A.; Maniatis, D.; Mollicone, D.; Moore, R.; Patriarca, C.; Picard, N.; Sparrow, B.; Abraham, E.M.; et al. The Extent of Forest in Dryland Biomes. Science 2017, 356, 635–638. [Google Scholar] [CrossRef]
- Conrad, C.; Rudloff, M.; Abdullaev, I.; Thiel, M.; Löw, F.; Lamers, J.P.A. Measuring Rural Settlement Expansion in Uzbekistan Using Remote Sensing to Support Spatial Planning. Appl. Geogr. 2015, 62, 29–43. [Google Scholar] [CrossRef]
- Bohovic, R.; Dobrovolny, P.; Klein, D. The Spatial and Temporal Dynamics of Remotely-Sensed Vegetation Phenology in Central Asia in the 1982–2011 Period. Eur. J. Remote Sens. 2016, 49, 279–299. [Google Scholar] [CrossRef]
- Eisfelder, C.; Klein, I.; Niklaus, M.; Kuenzer, C. Net Primary Productivity in Kazakhstan, Its Spatio-Temporal Patterns and Relation to Meteorological Variables. J. Arid. Environ. 2014, 103, 17–30. [Google Scholar] [CrossRef]
- Eckert, S.; Hüsler, F.; Liniger, H.; Hodel, E. Trend Analysis of MODIS NDVI Time Series for Detecting Land Degradation and Regeneration in Mongolia. J. Arid. Environ. 2015, 113, 16–28. [Google Scholar] [CrossRef]
- Eisfelder, C.; Klein, I.; Bekkuliyeva, A.; Kuenzer, C.; Buchroithner, M.F.; Dech, S. Above-Ground Biomass Estimation Based on NPP Time-Series—A Novel Approach for Biomass Estimation in Semi-Arid Kazakhstan. Ecol. Ind. 2017, 72, 13–22. [Google Scholar] [CrossRef]
- Jiang, L.; Jiapaer, G.; Bao, A.; Guo, H.; Ndayisaba, F. Vegetation Dynamics and Responses to Climate Change and Human Activities in Central Asia. Sci. Total Environ. 2017, 599–600, 967–980. [Google Scholar] [CrossRef]
- Xu, H.; Wang, X.; Yang, T. Trend Shifts in Satellite-Derived Vegetation Growth in Central Eurasia, 1982–2013. Sci. Total Environ. 2017, 579, 1658–1674. [Google Scholar] [CrossRef] [PubMed]
- Yin, H.; Khamzina, A.; Pflugmacher, D.; Martius, C. Forest Cover Mapping in Post-Soviet Central Asia Using Multi-Resolution Remote Sensing Imagery. Sci. Rep. 2017, 7, 1375. [Google Scholar] [CrossRef]
- Klein, I.; Gessner, U.; Künzer, C. Generation of Up to Date Land Cover Maps for Central Asia. In Novel Measurement and Assessment Tools for Monitoring and Management of Land and Water Resources in Agricultural Landscapes of Central Asia; Mueller, L., Saparov, A., Lischeid, G., Eds.; Springer International Publishing: Cham, Switzerland, 2014; pp. 329–346. ISBN 9783319010168. [Google Scholar]
- Hermosilla, T.; Wulder, M.A.; White, J.C.; Coops, N.C.; Hobart, G.W.; Campbell, L.B. Mass Data Processing of Time Series Landsat Imagery: Pixels to Data Products for Forest Monitoring. Int. J. Digit. Earth 2016, 9, 1035–1054. [Google Scholar] [CrossRef]
- Cai, Z.; Jönsson, P.; Jin, H.; Eklundh, L. Performance of Smoothing Methods for Reconstructing NDVI Time-Series and Estimating Vegetation Phenology from MODIS Data. Remote Sens. 2017, 9, 1271. [Google Scholar] [CrossRef]
- Oeser, J.; Pflugmacher, D.; Senf, C.; Heurich, M.; Hostert, P. Using Intra-Annual Landsat Time Series for Attributing Forest Disturbance Agents in Central Europe. Forests 2017, 8, 251. [Google Scholar] [CrossRef]
- Jönsson, P.; Eklundh, L. TIMESAT—A Program for Analyzing Time-Series of Satellite Sensor Data. Comput. Geosci. 2004, 30, 833–845. [Google Scholar] [CrossRef]
- Čampulová, M.; Čampula, R.; Holešovský, J. An R package for identification of outliers in environmental time series data. Environ. Model. Softw. 2022, 155, 105435. [Google Scholar] [CrossRef]
- Verbesselt, J.; Hyndman, R.; Newnham, G.; Culvenor, D. Detecting Trend and Seasonal Changes in Satellite Image Time Series. Remote Sens. Environ. 2010, 114, 106–115. [Google Scholar] [CrossRef]
- Gärtner, P.; Förster, M.; Kurban, A.; Kleinschmit, B. Object Based Change Detection of Central Asian Tugai Vegetation with Very High Spatial Resolution Satellite Imagery. Int. J. Appl. Earth Obs. Geoinf. 2014, 31, 110–121. [Google Scholar] [CrossRef]
- Gärtner, P. Monitoring Dynamics of Semi-Arid Forests with Multi-Sensor Time Series. Ph.D. Thesis, Technische Universität Berlin, Berlin, Germany, 2017. [Google Scholar]
- Yu, Y.; Pi, Y.; Yu, X.; Ta, Z.; Sun, L.; Disse, M.; Zeng, F.; Li, Y.; Chen, X.; Yu, R. Climate Change, Water Resources and Sustainable Development in the Arid and Semi-Arid Lands of Central Asia in the Past 30 Years. J. Arid Land 2019, 11, 1–14. [Google Scholar] [CrossRef]
- Thevs, N.; Zerbe, S.; Schnittler, M.; Abdusalih, N.; Succow, M. Structure, Reproduction and Flood-Induced Dynamics of Riparian Tugai Forests at the Tarim River in Xinjiang, NW China. Forestry 2008, 81, 45–57. [Google Scholar] [CrossRef]
- Klein, I.; Gessner, U.; Kuenzer, C. Regional Land Cover Mapping and Change Detection in Central Asia Using MODIS Time-Series. Appl. Geogr. 2012, 35, 219–234. [Google Scholar] [CrossRef]
- Rubel, F.; Kottek, M. Observed and Projected Climate Shifts 1901-2100 Depicted by World Maps of the Köppen-Geiger Climate Classification. Meteorol. Z. 2010, 19, 135–141. [Google Scholar] [CrossRef]
- Wegerich, K.; Van Rooijen, D.; Soliev, I.; Mukhamedova, N. Water Security in the Syr Darya Basin. Water 2015, 7, 4657–4684. [Google Scholar] [CrossRef]
- NASA Syr Darya River Overflows. Available online: https://earthobservatory.nasa.gov/images/12739/syr-darya-river-overflows (accessed on 1 December 2020).
- Conrad, C.; Schönbrodt-Stitt, S.; Löw, F.; Sorokin, D.; Paeth, H. Cropping Intensity in the Aral Sea Basin and Its Dependency from the Runoff Formation 2000–2012. Remote Sens. 2016, 8, 630. [Google Scholar] [CrossRef]
- Xiong, X.; Barnes, W. An overview of MODIS radiometric calibration and characterization. Adv. Atmos. Sci. 2006, 23, 69–79. [Google Scholar] [CrossRef]
- Goward, S.N.; Masek, J.G.; Williams, D.L.; Irons, J.R.; Thompson, R.J. The Landsat 7 mission: Terrestrial research and applications for the 21st century. Remote Sens. Environ. 2001, 78, 3–12. [Google Scholar] [CrossRef]
- Rouse, J.W.; Haas, R.H.; Schell, J.A.; Deering, D.W. Monitoring vegetation systems in the great plains with ERTS. In Third Earth Resources Technology Satellite-1 Symposium: Section A-B. Technical Presentations, 1st ed.; Freden, S.C., Mercanti, E.P., Becker, M.A., Eds.; NASA: Washington, DC, USA, 1974; pp. 309–318. [Google Scholar]
- Mayr, S.; Kuenzer, C.; Gessner, U.; Klein, I.; Rutzinger, M. Validation of Earth Observation Time-Series: A Review for Large-Area and Temporally Dense Land Surface Products. Remote Sens. 2019, 11, 2616. [Google Scholar] [CrossRef]
- Gorelick, N.; Hancher, M.; Dixon, M.; Ilyushchenko, S.; Thau, D.; Moore, R. Google Earth Engine: Planetary-Scale Geospatial Analysis for Everyone. Remote Sens. Environ. 2017, 202, 18–27. [Google Scholar] [CrossRef]
- R Core Team. R: A Language and Environment for Statistical Computing, v 3.4.1; R Foundation for Statistical Computing: Vienna, Austria, 2021. [Google Scholar]
- Verger, A.; Baret, F.; Weiss, M.; Kandasamy, S.; Vermote, E. The CACAO Method for Smoothing, Gap Filling, and Characterizing Seasonal Anomalies in Satellite Time Series. IEEE Trans. Geosci. Remote Sens. 2013, 51, 1963–1972. [Google Scholar] [CrossRef]
- Pearson, K. Notes on Regression and Inheritance in the Case of Two Parents. Proc. R. Soc. Lond. 1895, 58, 240–242. [Google Scholar] [CrossRef]
- Shapiro, S.S.; Wilk, M.B. An Analysis of Variance Test for Normality (Complete Samples). Biometrika 1965, 52, 591. [Google Scholar] [CrossRef]
- Yu, Y.; Chen, X.; Disse, M.; Cyffka, B.; Lei, J.; Zhang, H.; Brieden, A.; Welp, M.; Abuduwaili, J.; Li, Y.; et al. Climate Change in Central Asia: Sino-German Cooperative Research Findings. Sci. Bull. 2020, 65, 689–692. [Google Scholar] [CrossRef]
- Liang, J.; Gamarra, J.G.P. The Importance of Sharing Global Forest Data in a World of Crises. Sci. Data 2020, 7, 424. [Google Scholar] [CrossRef]
- Frantz, D.; Stellmes, M.; Röder, A.; Udelhoven, T.; Mader, S.; Hill, J. Improving the Spatial Resolution of Land Surface Phenology by Fusing Medium- and Coarse-Resolution Inputs. IEEE Trans. Geosci. Remote Sens. 2016, 54, 4153–4164. [Google Scholar] [CrossRef]
- Claverie, M.; Ju, J.; Masek, J.G.; Dungan, J.L.; Vermote, E.F.; Roger, J.-C.; Skakun, S.V.; Justice, C. The Harmonized Landsat and Sentinel-2 Surface Reflectance Data Set. Remote Sens. Environ. 2018, 219, 145–161. [Google Scholar] [CrossRef]
- Wulder, M.A.; Loveland, T.R.; Roy, D.P.; Crawford, C.J.; Masek, J.G.; Woodcock, C.E.; Allen, R.G.; Anderson, M.C.; Belward, A.S.; Cohen, W.B.; et al. Current Status of Landsat Program, Science, and Applications. Remote Sens. Environ. 2019, 225, 127–147. [Google Scholar] [CrossRef]
- Weinthal, E. Beyond the State: Transnational Actors, NGOs, and Environmental Protection in Central Asia. In The Transformation of Central Asia: States and Societies from Soviet Rule to Independence; Luong, P., Ed.; Cornell University Press: Ithaca, NY, USA, 2004; pp. 246–270. [Google Scholar]
- NEESPI Meteorological Station Data of Kyzylorda from 1891 to 2006. Station Code: #38062. Available online: https://neespi.sr.unh.edu/cgi-bin/station/meteo_station.pl?id=38062 (accessed on 3 June 2019).
- NEESPI Meteorological Station Data of Kazalinsk from 1881 to 2006. Station Code: #34849. Available online: https://neespi.sr.unh.edu/cgi-bin/station/meteo_station.pl?id=34849 (accessed on 3 June 2019).
- Djanibekov, U.; Dzhakypbekova, K.; Chamberlain, J.; Weyerhaeuser, H.; Zomer, R.J.; Villamor, G.; Xu, J. Agroforestry for Landscape Restoration and Livelihood Development in Central Asia; ICRAF Working Paper; World Agroforestry Centre East and Central Asia: Kunming, China, 2015. [Google Scholar]
- Lioubimtseva, E.; Henebry, G.M. Climate and Environmental Change in Arid Central Asia: Impacts, Vulnerability, and Adaptations. J. Arid. Environ. 2009, 73, 963–977. [Google Scholar] [CrossRef]
- Kupke, L. Riparian Forest Structure and Regeneration in the Lower Amu Darya Biosphere Reserve (Uzbekistan) with Regard to Observed Degradation Factors. Master’s Thesis, Ernst Moritz Arndt University, Greifswald, Germany, 2017. [Google Scholar]
- Rüger, N.; Schlüter, M.; Matthies, M. A Fuzzy Habitat Suitability Index for Populus euphratica in the Northern Amudarya Delta (Uzbekistan). Ecol. Model. 2005, 184, 313–328. [Google Scholar] [CrossRef]
- Gärtner, P.; Förster, M.; Kleinschmit, B. The Benefit of Synthetically Generated RapidEye and Landsat 8 Data Fusion Time Series for Riparian Forest Disturbance Monitoring. Remote Sens. Environ. 2016, 177, 237–247. [Google Scholar] [CrossRef]
- Keyimu, M.; Halik, Ü.; Kurban, A. Estimation of Water Consumption of Riparian Forest in the Lower Reaches of Tarim River, Northwest China. Environ. Earth Sci. 2017, 76, 547. [Google Scholar] [CrossRef]
- Zeng, Y.; Zhao, C.; Kundzewicz, Z.W.; Lv, G. Distribution Pattern of Tugai Forests Species Diversity and Their Relationship to Environmental Factors in an Arid Area of China. PLoS ONE 2020, 15, e0232907. [Google Scholar] [CrossRef]
- Aishan, T.; Halik, Ü.; Betz, F.; Tiyip, T.; Ding, J.; Nuermaimaiti, Y. Stand Structure and Height-Diameter Relationship of a Degraded Populus euphratica Forest in the Lower Reaches of the Tarim River, Northwest China. J. Arid Land 2015, 7, 544–554. [Google Scholar] [CrossRef]
- Tugay. Available online: https://en.wikipedia.org/w/index.php?title=Tugay&oldid=1175204409 (accessed on 3 June 2019).
- Ott, K.; Kerschbaumer, L.; Köbbing, J.F.; Thevs, N. Bringing Sustainability Down to Earth: Heihe River as a Paradigm Case of Sustainable Water Allocation. J. Agric. Environ. Ethics 2016, 29, 835–856. [Google Scholar] [CrossRef]
- Ding, J.; Zhao, W.; Daryanto, S.; Wang, L.; Fan, H.; Feng, Q.; Wang, Y. The Spatial Distribution and Temporal Variation of Desert Riparian Forests and Their Influencing Factors in the Downstream Heihe River Basin, China. Hydrol. Earth Syst. Sci. 2017, 21, 2405–2419. [Google Scholar] [CrossRef]
- Guo, Y.; Li, X.; Zhao, Z.; Wei, H. Modeling the Distribution of Populus euphratica in the Heihe River Basin, an Inland River Basin in an Arid Region of China. Sci. China Earth Sci. 2018, 61, 1669–1684. [Google Scholar] [CrossRef]
- Egger, G.; Rood, S.B.; Becker, I.; Betz, F.; Chepinoga, V.; Deil, U.; Lashchinskiy, N.; Magnússon, B.; Roth, A.; Stewart, G.; et al. Riparian Vegetation of Gravel-bed Rivers—A Global Review. In Encyclopedia of Inland Waters, 2nd ed.; Elsevier: Amsterdam, The Netherlands, 2022; Volume 3, pp. 182–213. [Google Scholar] [CrossRef]


| Image Collection | Full Name | Spatial Extent | Spatial Resolution | Temporal Extent | Temporal Resolution |
|---|---|---|---|---|---|
| MCD43A4_NDVI | MODIS Combined 16-Day NDVI | global | 250 m | 2000–2023 | 8-day |
| LE7_L1T_8DAY_NDVI | Landsat 7 8-Day NDVI Composite | global | 30 m | 1999–2023 | 8-day |
| Main Class | Subclass | Description | n |
|---|---|---|---|
| wetland | forest1 | Riparian forests with Populus euphratica or P. pruinosa | 779 |
| wetland | forest2 | Riparian forests and shrubs with Elaeagnus sp. | 176 |
| wetland | wetland | Riparian shrubs, reeds, and grassland | 492 |
| wetland | water | Rivers, lakes, and ponds | 469 |
| non-wetland | cropland1 | Actively irrigated farmland | 463 |
| non-wetland | cropland2 | Abandoned irrigated farmland | 102 |
| non-wetland | dryland | Open soil, steppe, and dry shrubs | 445 |
| non-wetland | settlement | Cities, built-up | 482 |
Disclaimer/Publisher’s Note: The statements, opinions and data contained in all publications are solely those of the individual author(s) and contributor(s) and not of MDPI and/or the editor(s). MDPI and/or the editor(s) disclaim responsibility for any injury to people or property resulting from any ideas, methods, instructions or products referred to in the content. |
© 2023 by the authors. Licensee MDPI, Basel, Switzerland. This article is an open access article distributed under the terms and conditions of the Creative Commons Attribution (CC BY) license (https://creativecommons.org/licenses/by/4.0/).
Share and Cite
Schulz, C.; Kleinschmit, B. Monitoring the Condition of Wetlands in the Syr Darya Floodplain—How Healthy Are the Tugai Forests in Kazakhstan? Forests 2023, 14, 2305. https://doi.org/10.3390/f14122305
Schulz C, Kleinschmit B. Monitoring the Condition of Wetlands in the Syr Darya Floodplain—How Healthy Are the Tugai Forests in Kazakhstan? Forests. 2023; 14(12):2305. https://doi.org/10.3390/f14122305
Chicago/Turabian StyleSchulz, Christian, and Birgit Kleinschmit. 2023. "Monitoring the Condition of Wetlands in the Syr Darya Floodplain—How Healthy Are the Tugai Forests in Kazakhstan?" Forests 14, no. 12: 2305. https://doi.org/10.3390/f14122305