
Phenological Changes of Woody Plants in the Southern and Northern Regions of Nanling Mountains and Their Relationship with Climatic Factors

 ,
,
Abstract
:1. Introduction
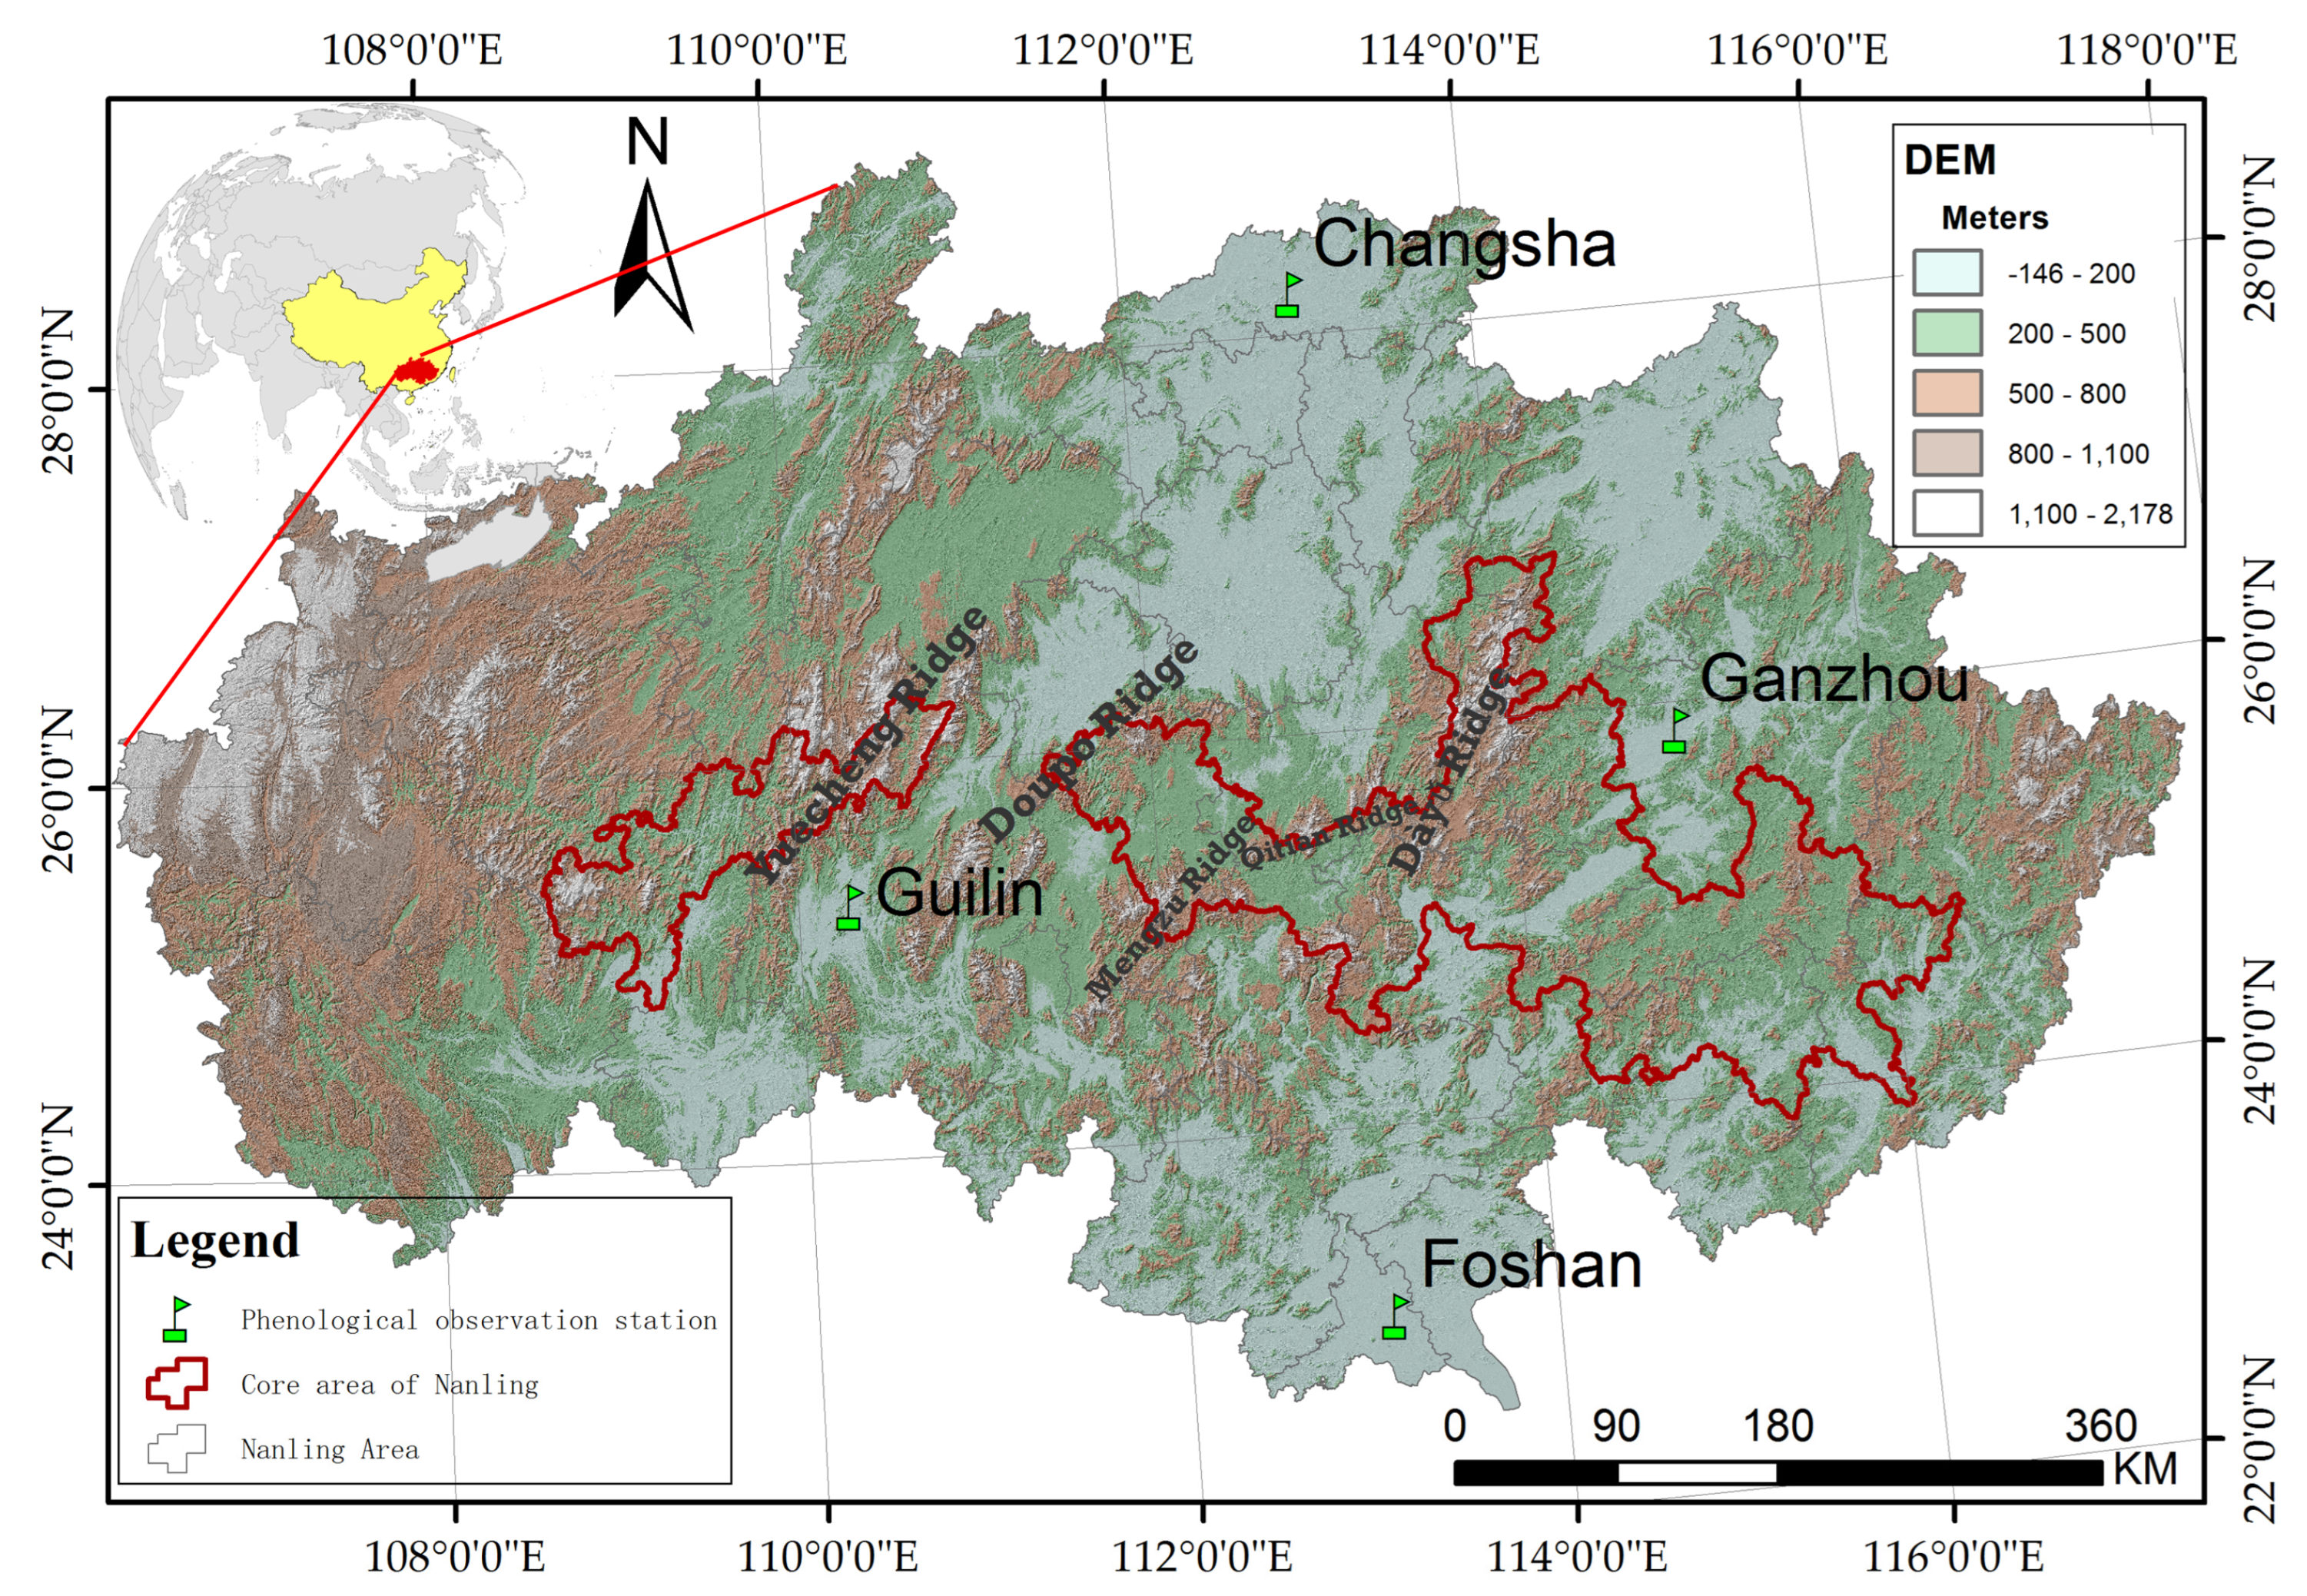
2. Study Area
3. Data and Methods
3.1. Data
3.2. Methods
4. Results
4.1. Characteristics of the Plant Phenology
4.1.1. Characteristics of the Plant Phenology in the Northern Region
4.1.2. Characteristics of Plant Phenology in the Southern Region
4.1.3. Comparison of the Phenological Phases between the Northern and Southern Regions
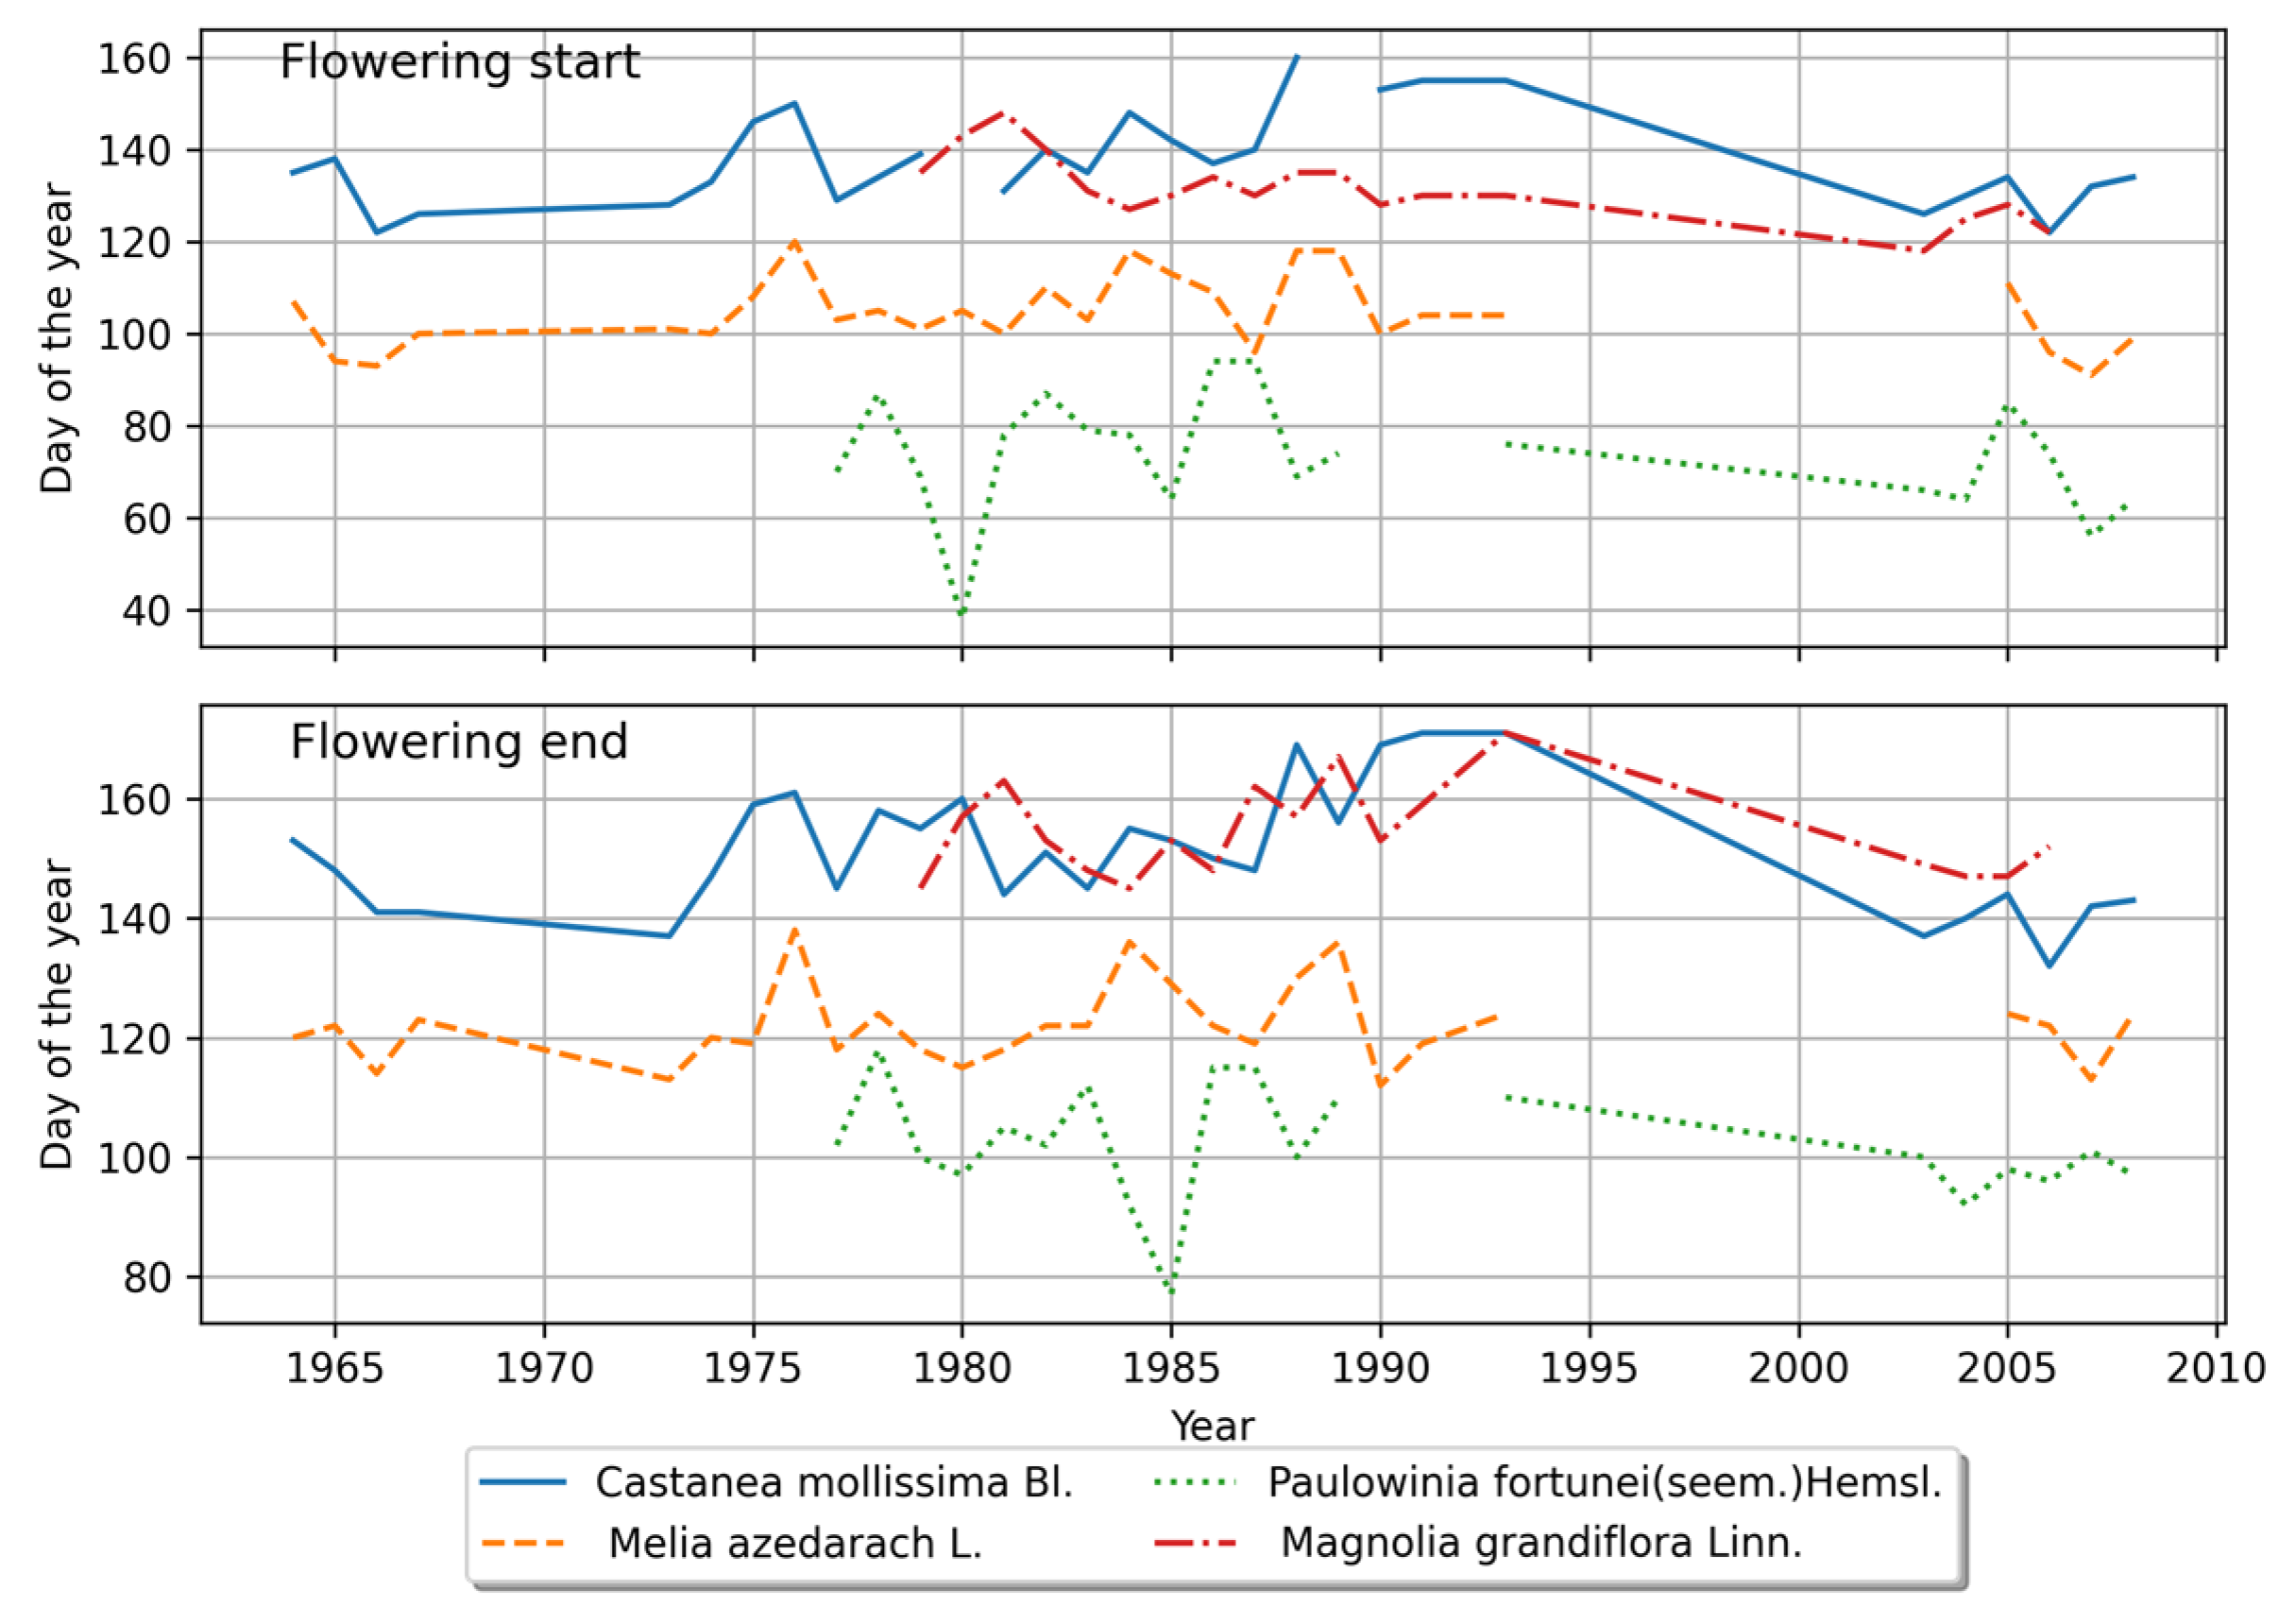
4.2. Interannual Variations of the Plant Phenology
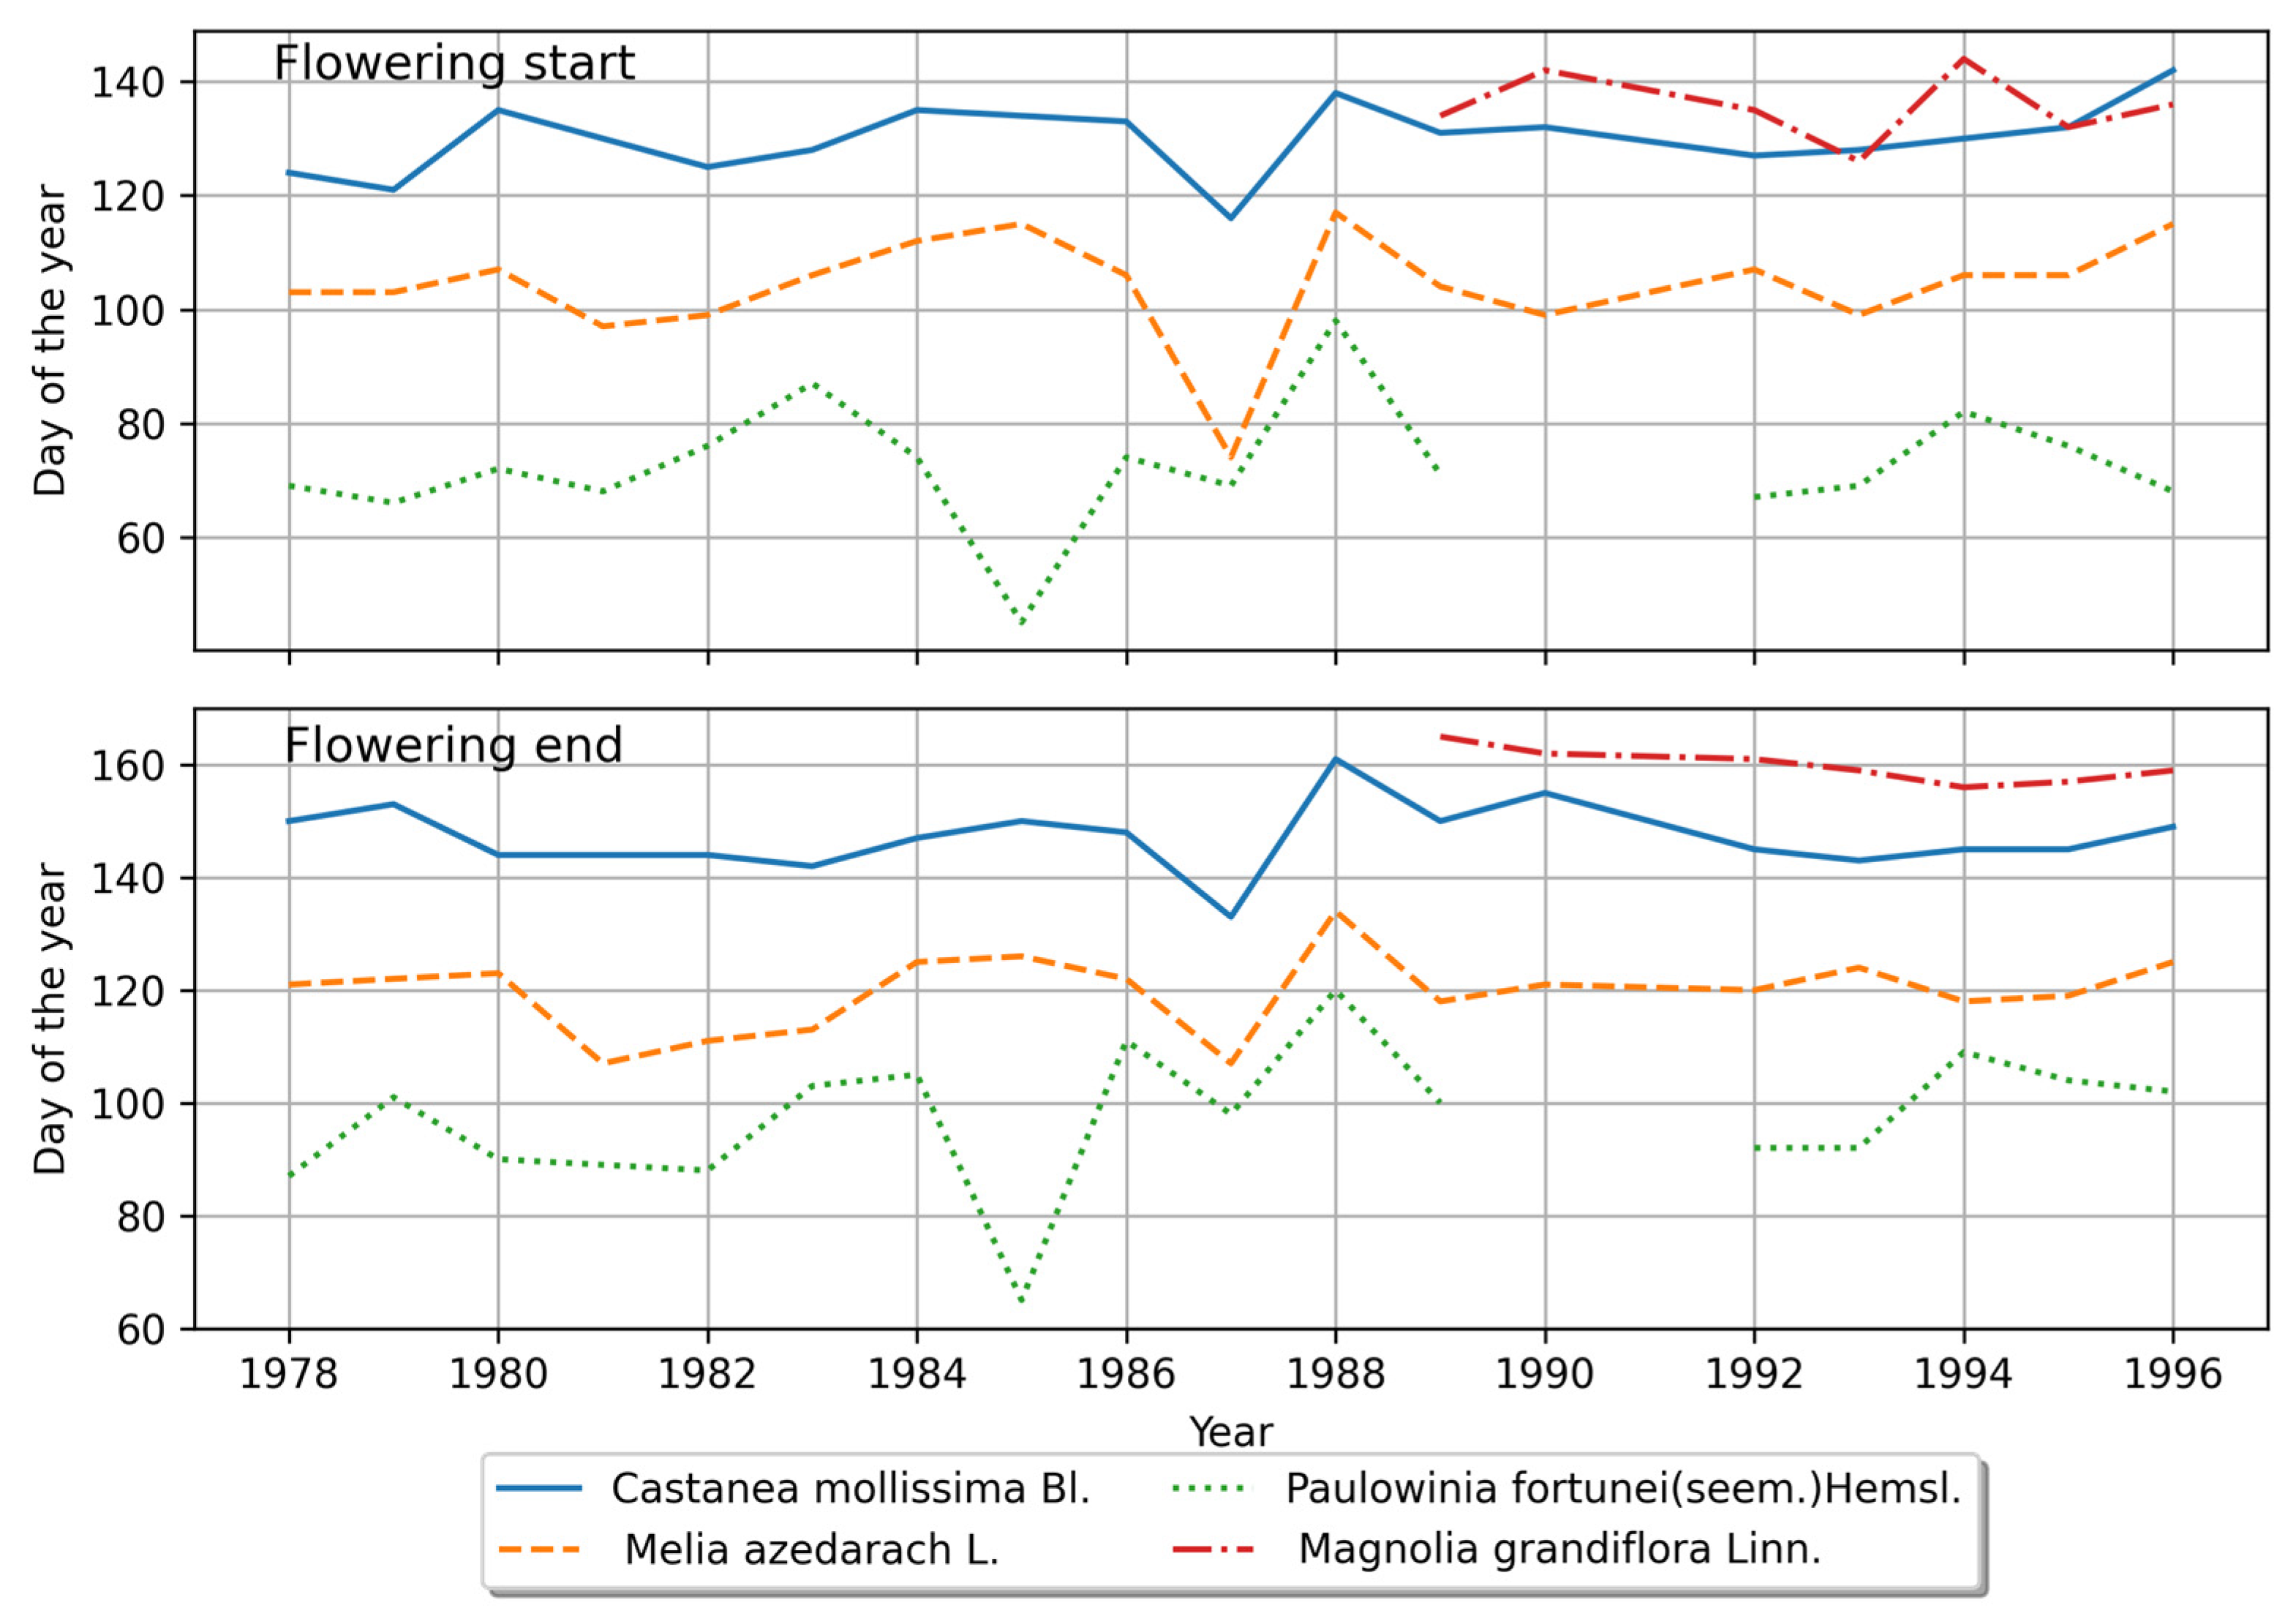
4.2.1. Phenological Stage Variations in the Northern Region
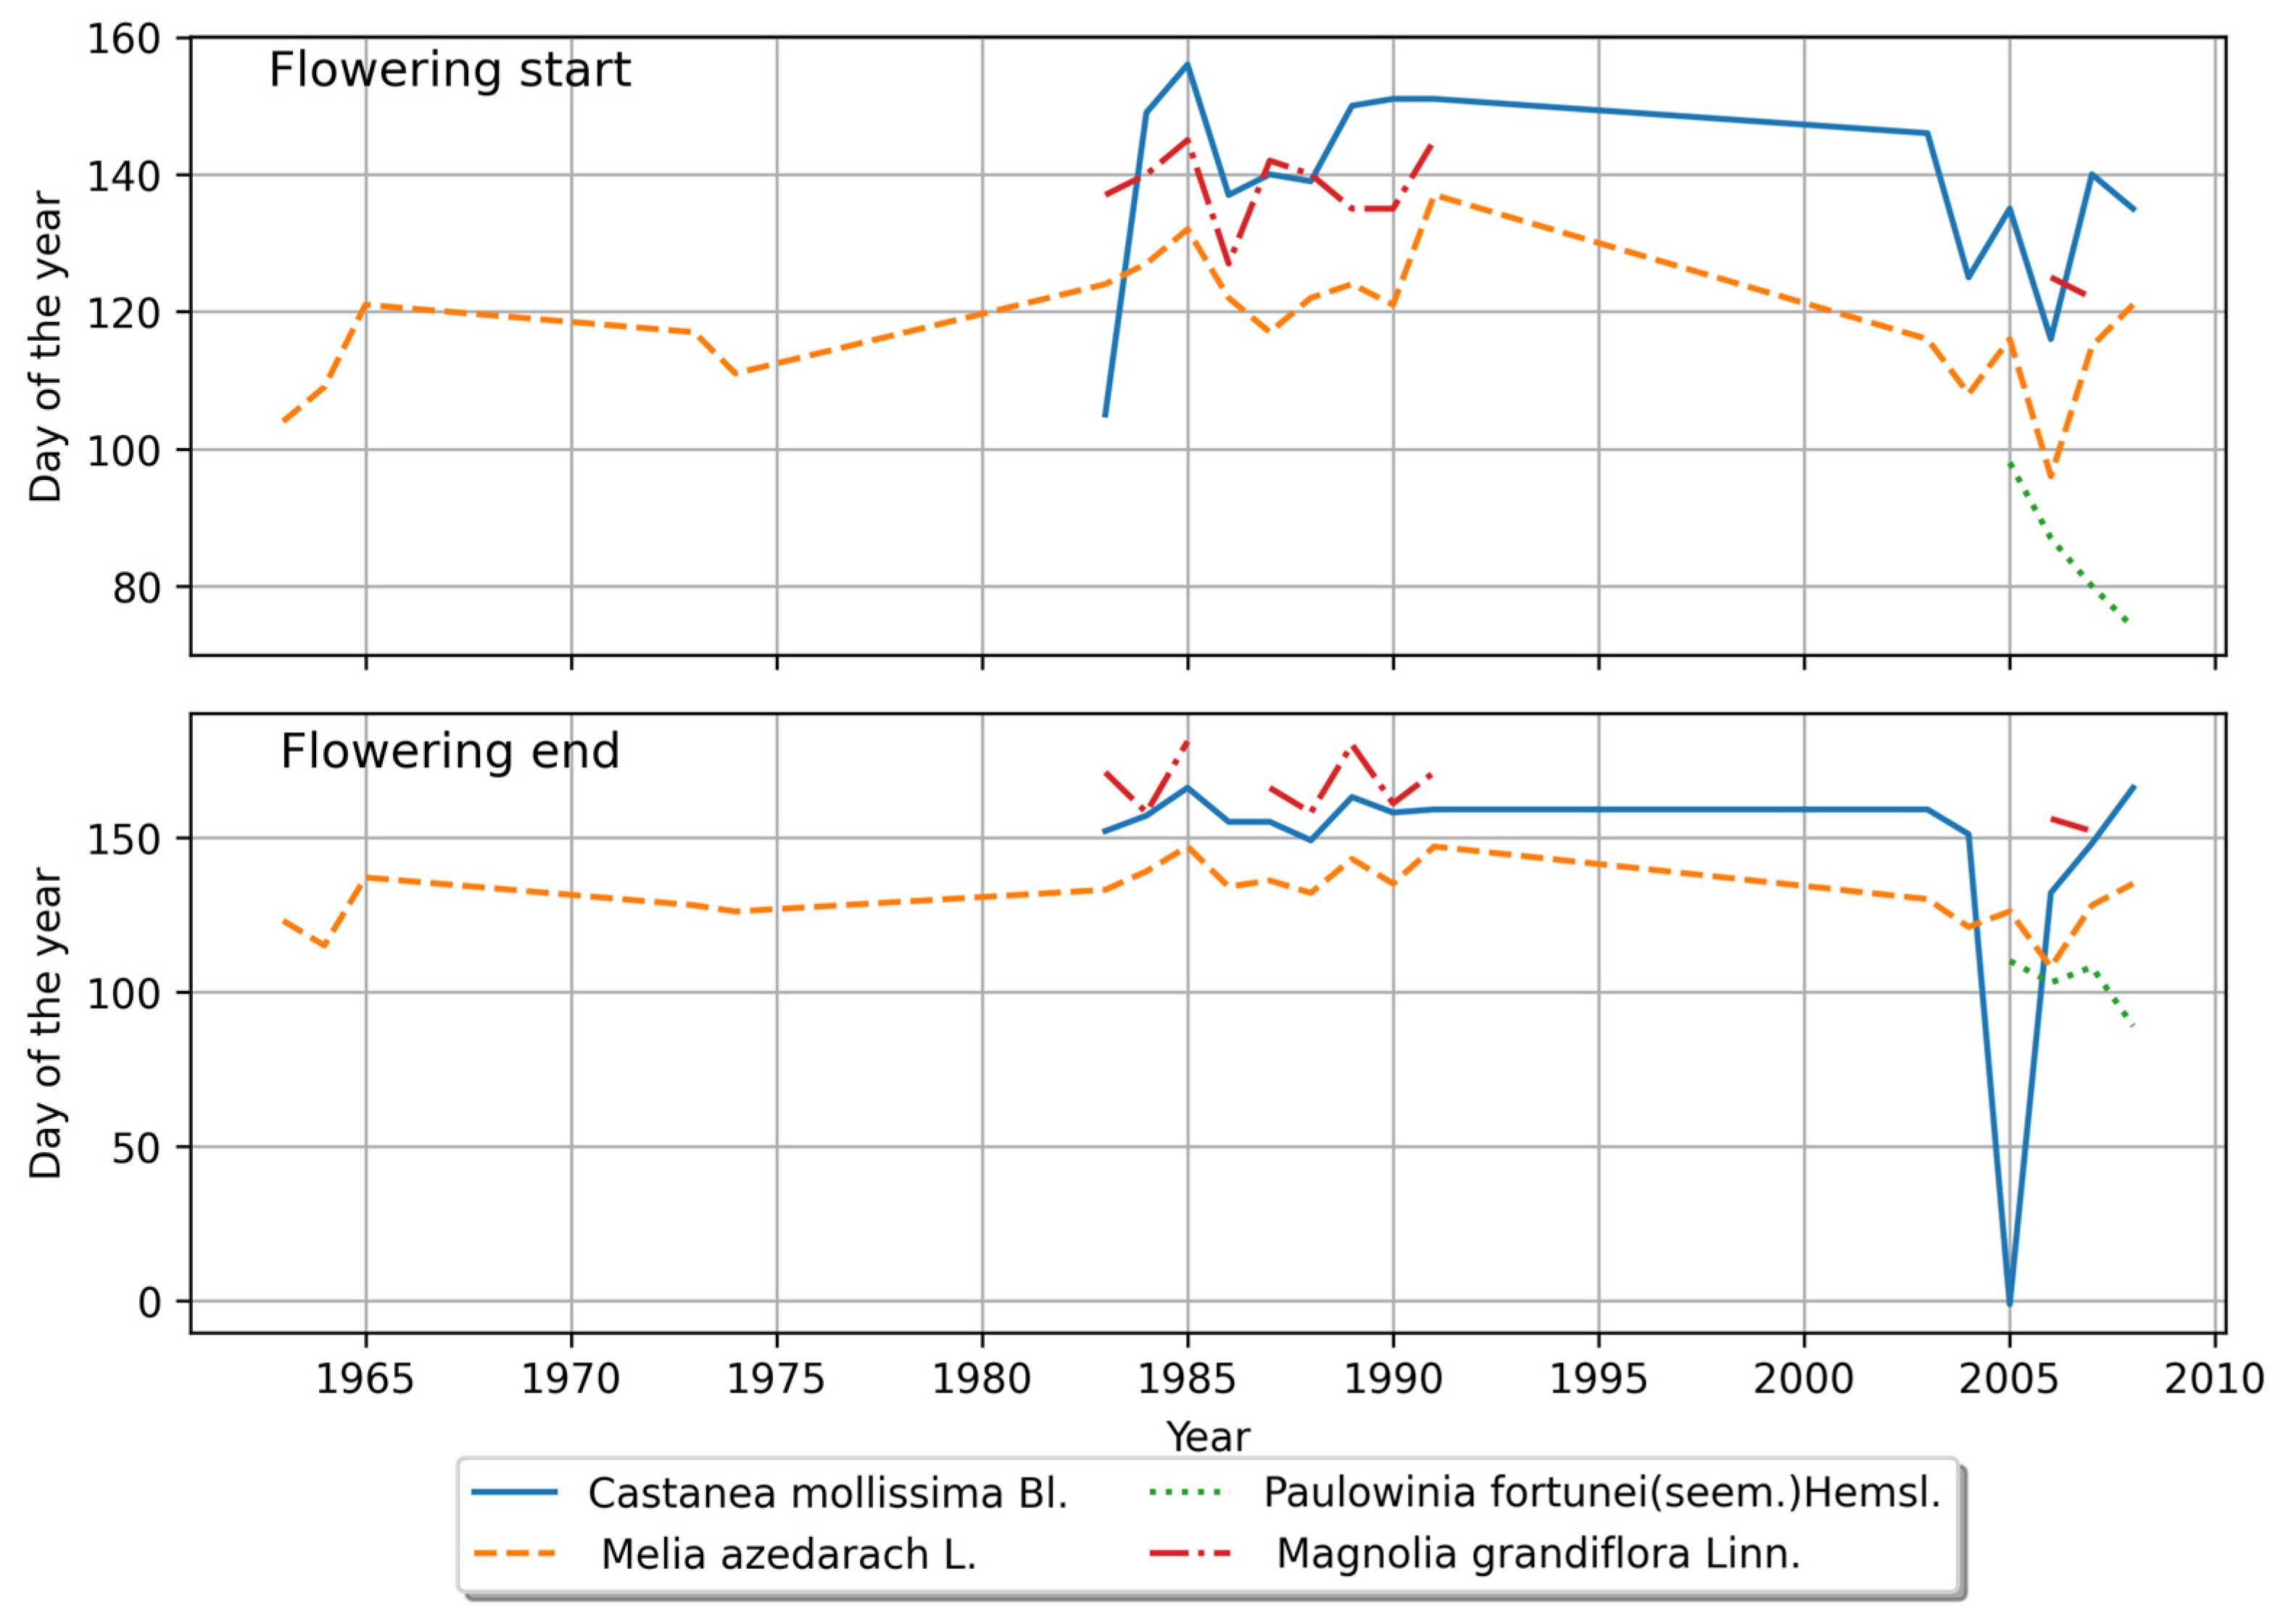
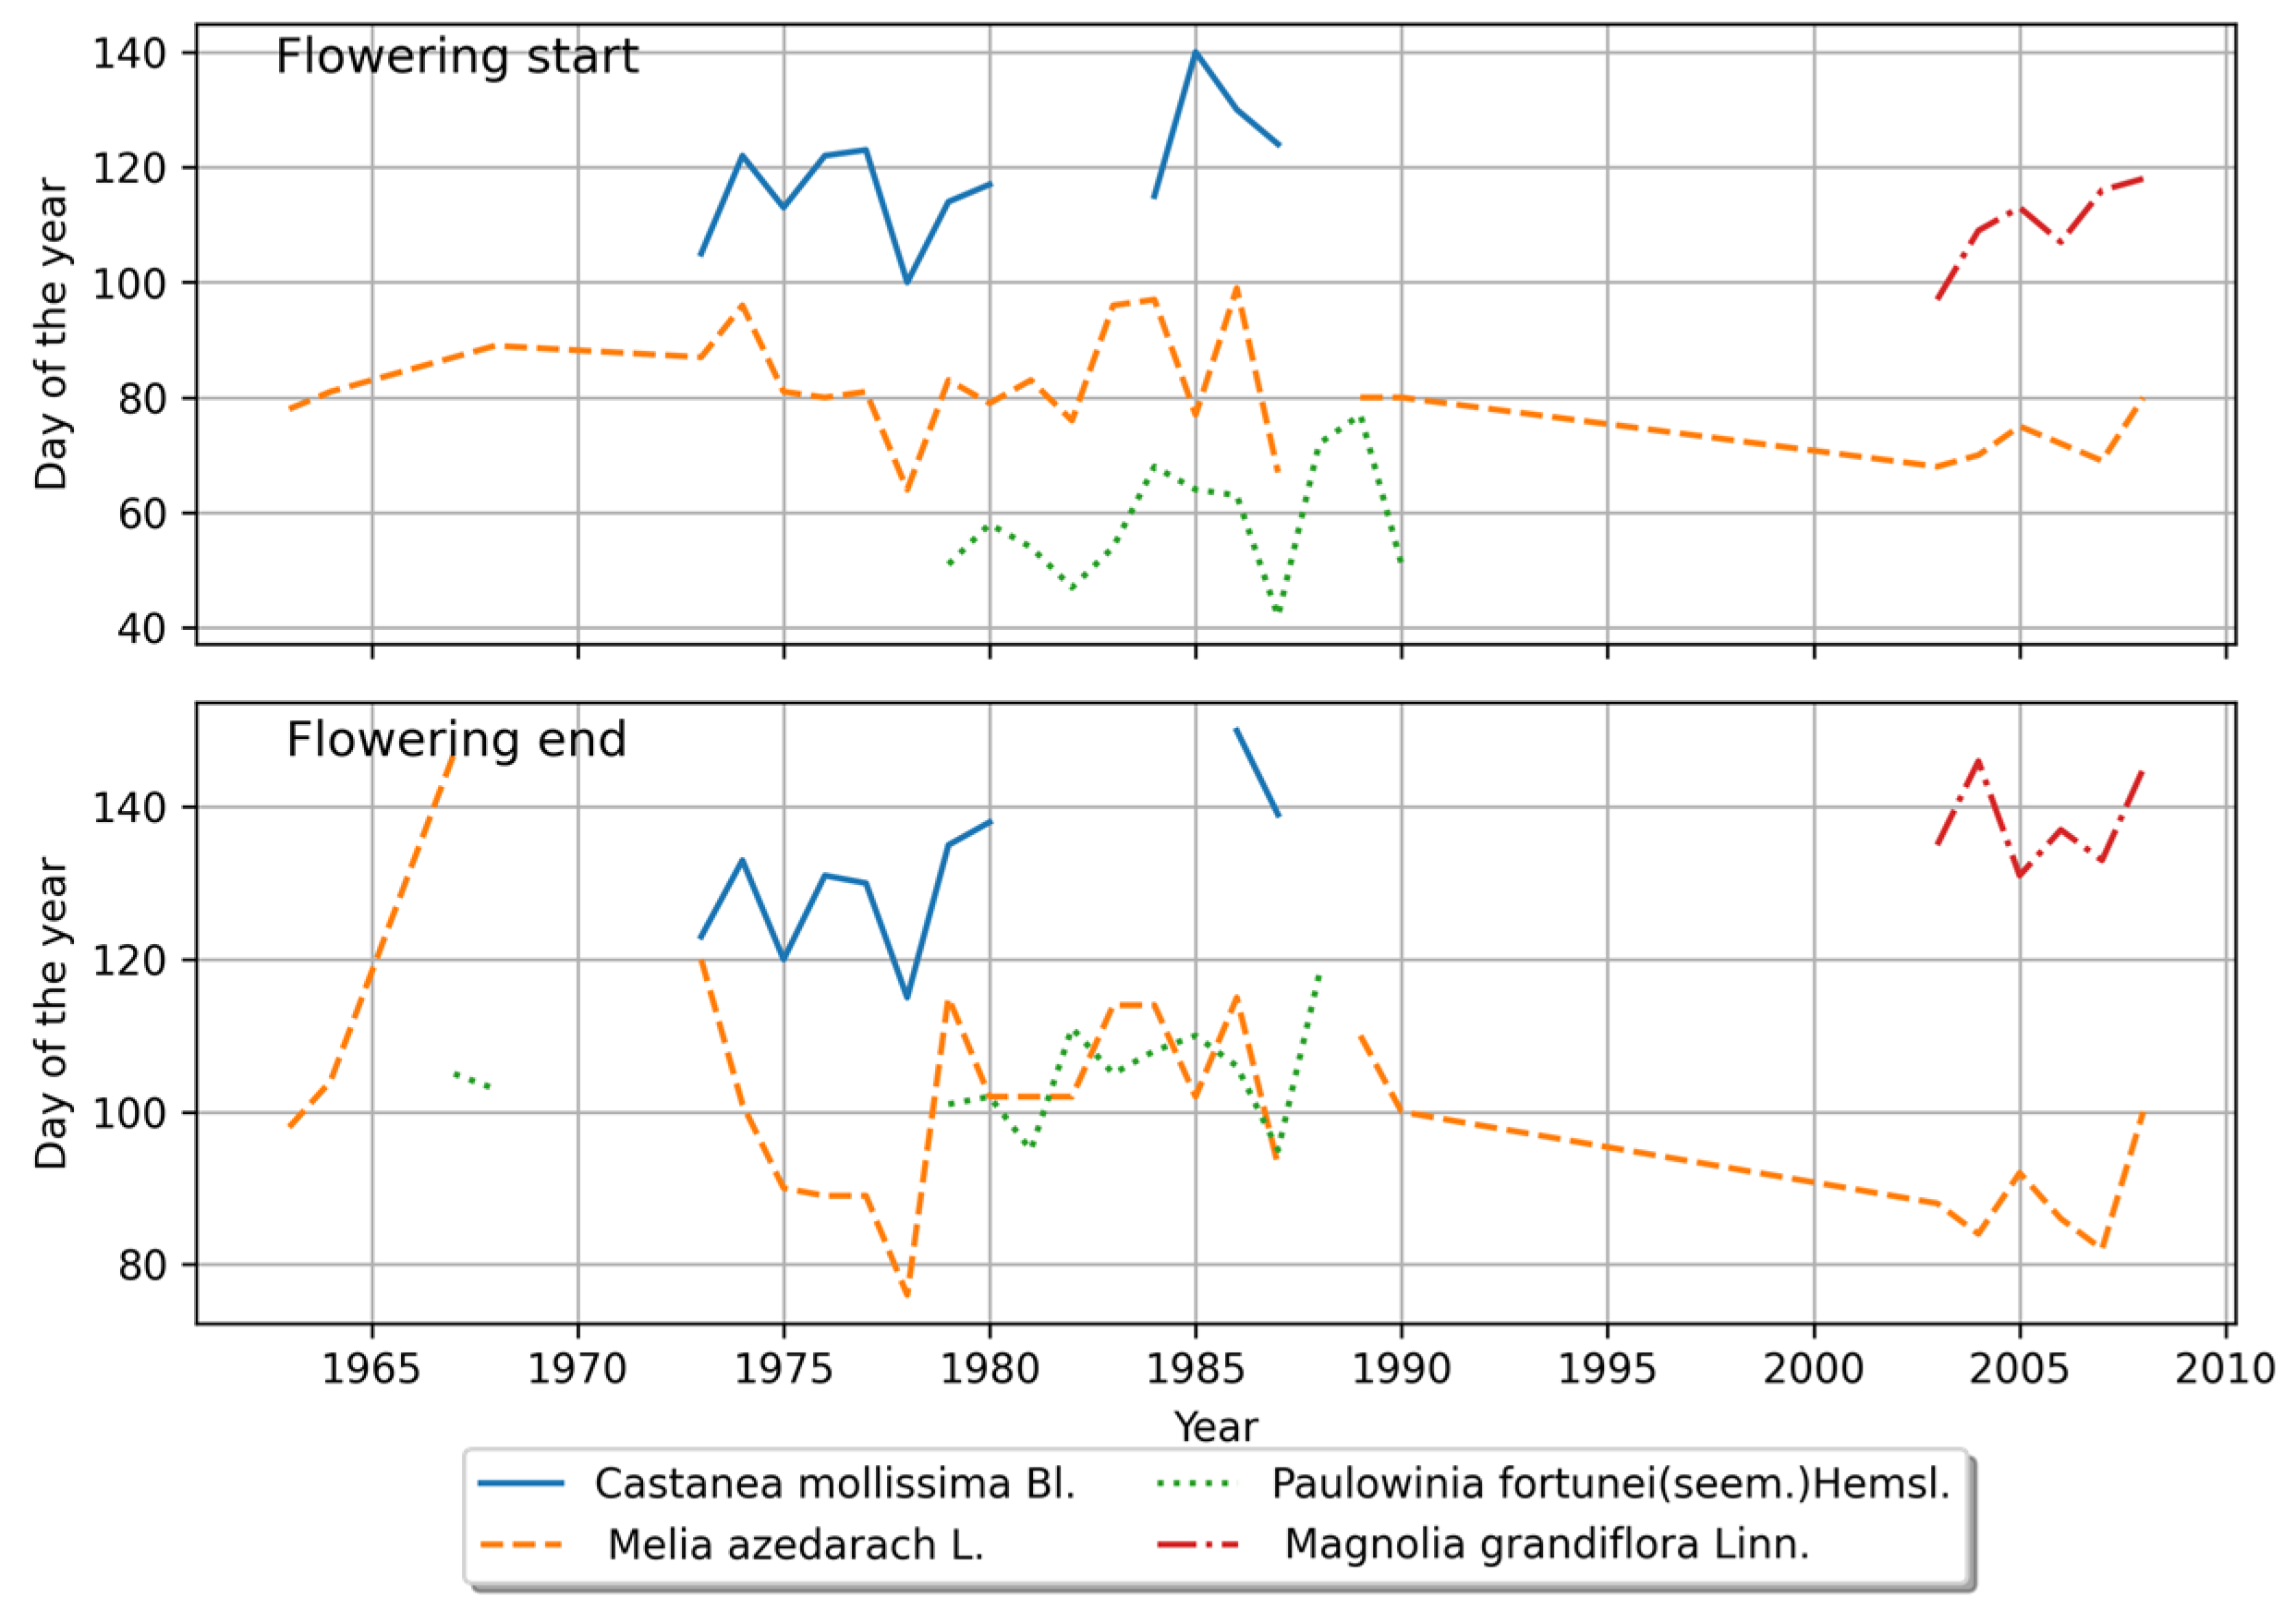
4.2.2. Phenological Stage Variations in the Southern Region
4.2.3. Comparison of Interannual Variations in Phenological Stages
4.3. Phenological Changes and Climatic Factors
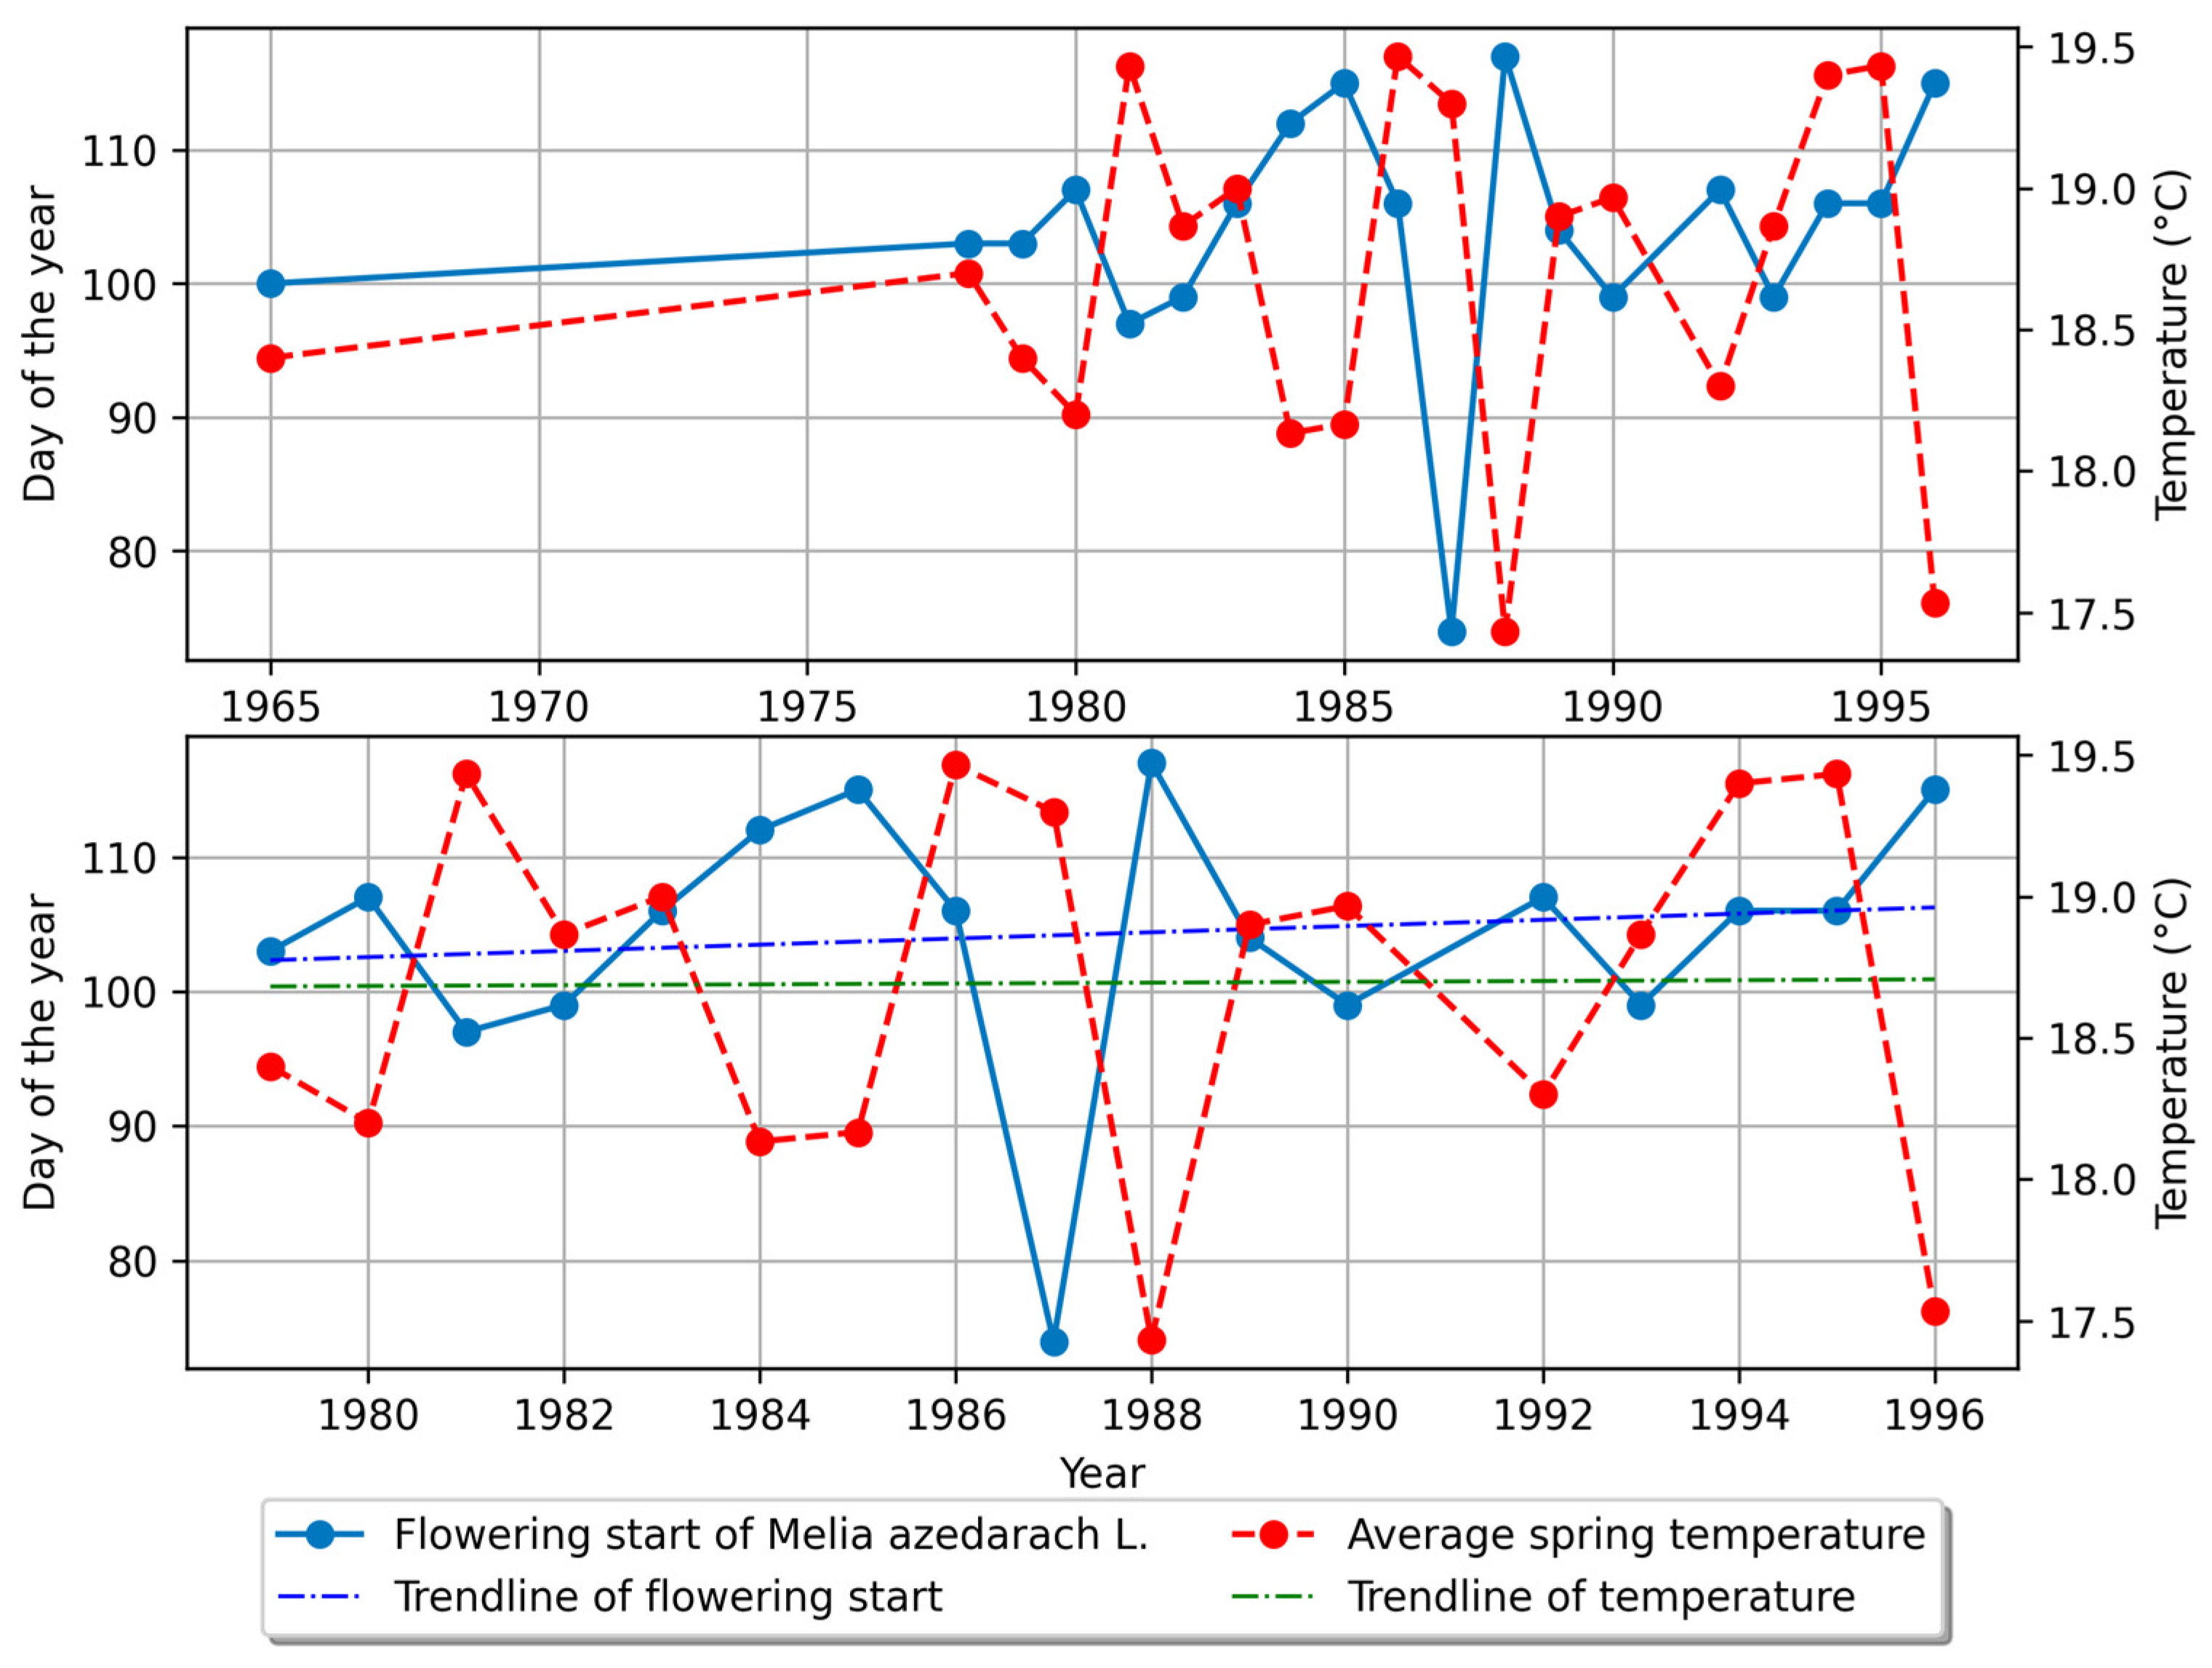
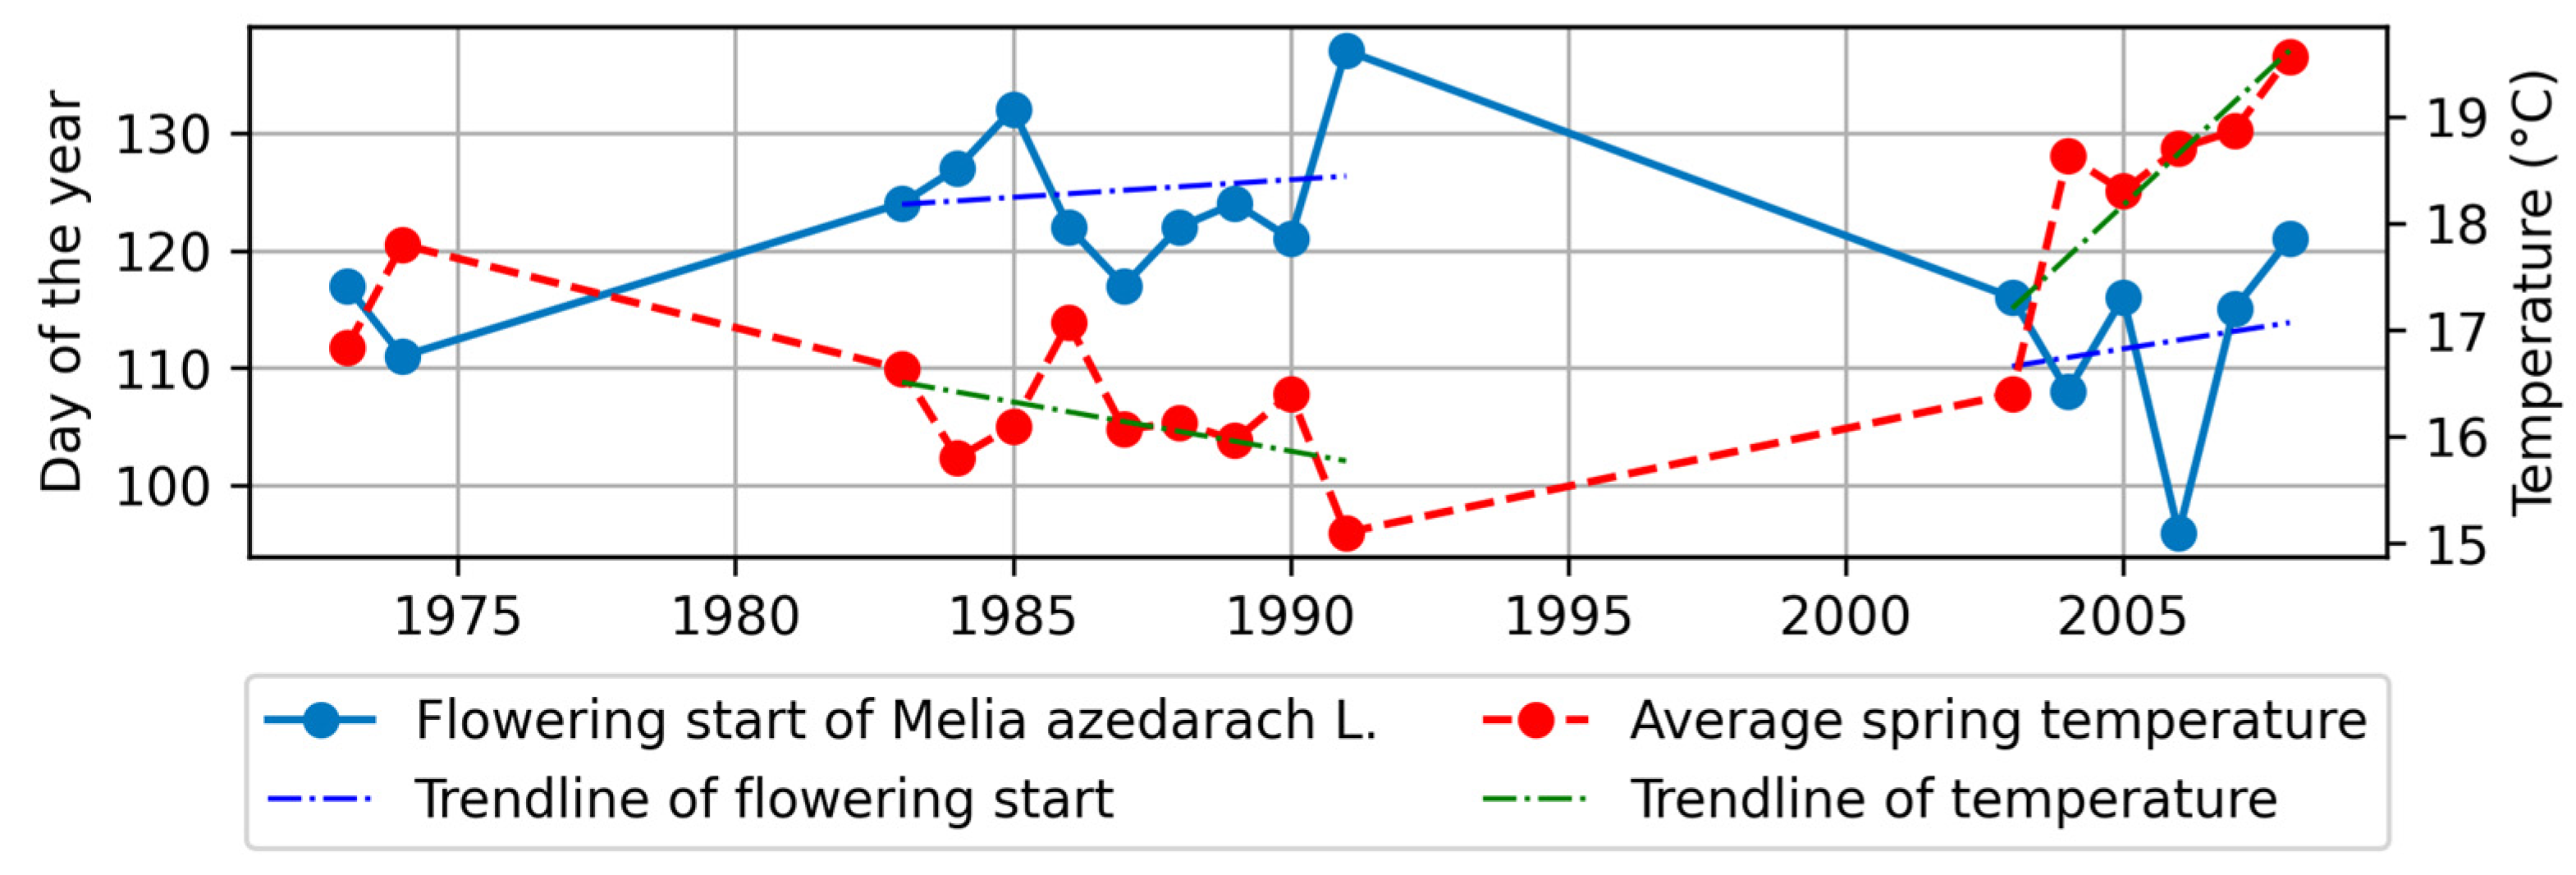
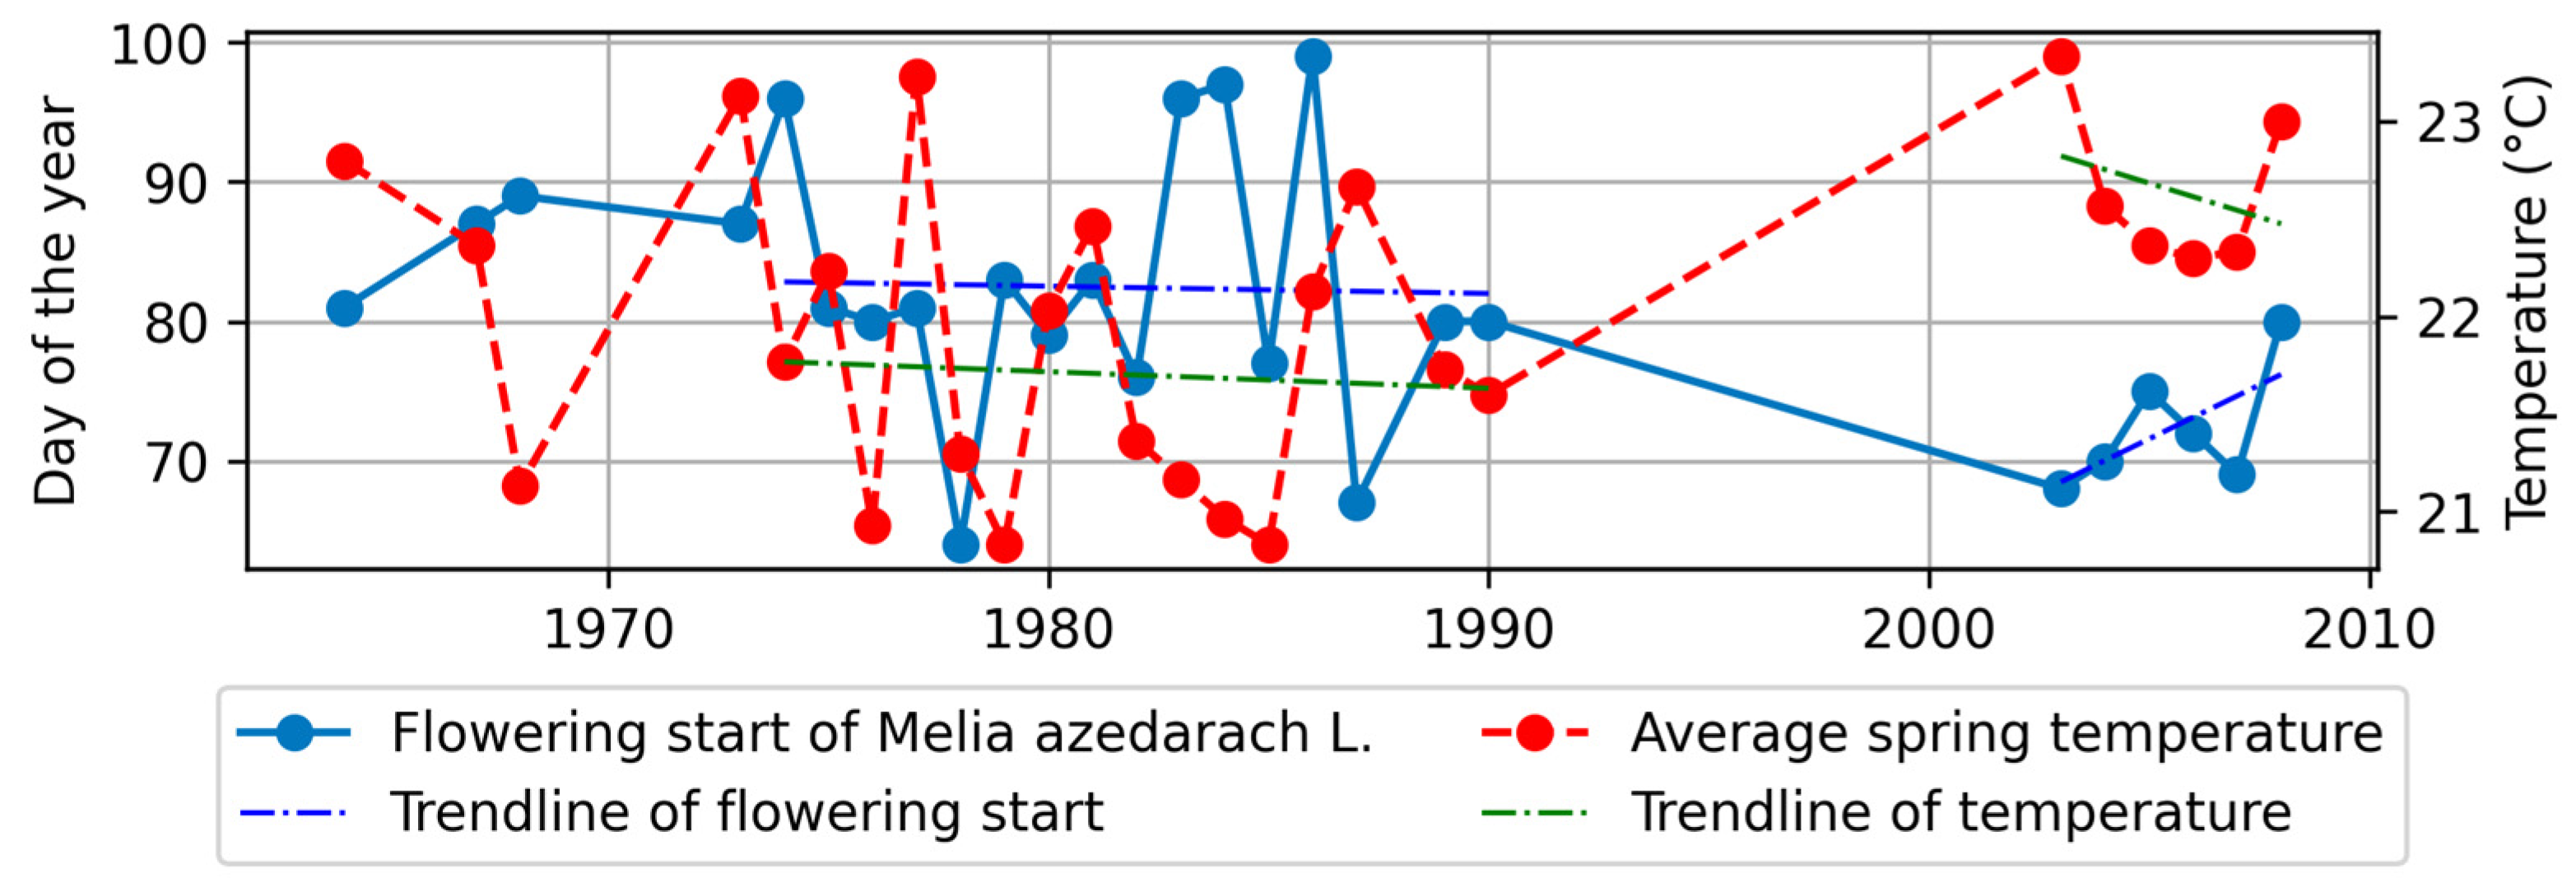
4.3.1. Flowering Start and Climatic Factors
- A.
- In the northern region
- B.
- In the southern region
4.3.2. Flowering End and Climate Factors
- A.
- In the northern region
- B.
- In the southern region
5. Discussion
6. Conclusions
- (1)
- During the study period, the studied phenological stages of woody plants in the southern region of the Nanling Mountains occurred 2–31 days earlier than those in the northern region. Moreover, a noticeable advancing trend of 0.1 to 2 days per decade was observed in the phenological stages of all plants in the southern region of the Nanling Mountains.
- (2)
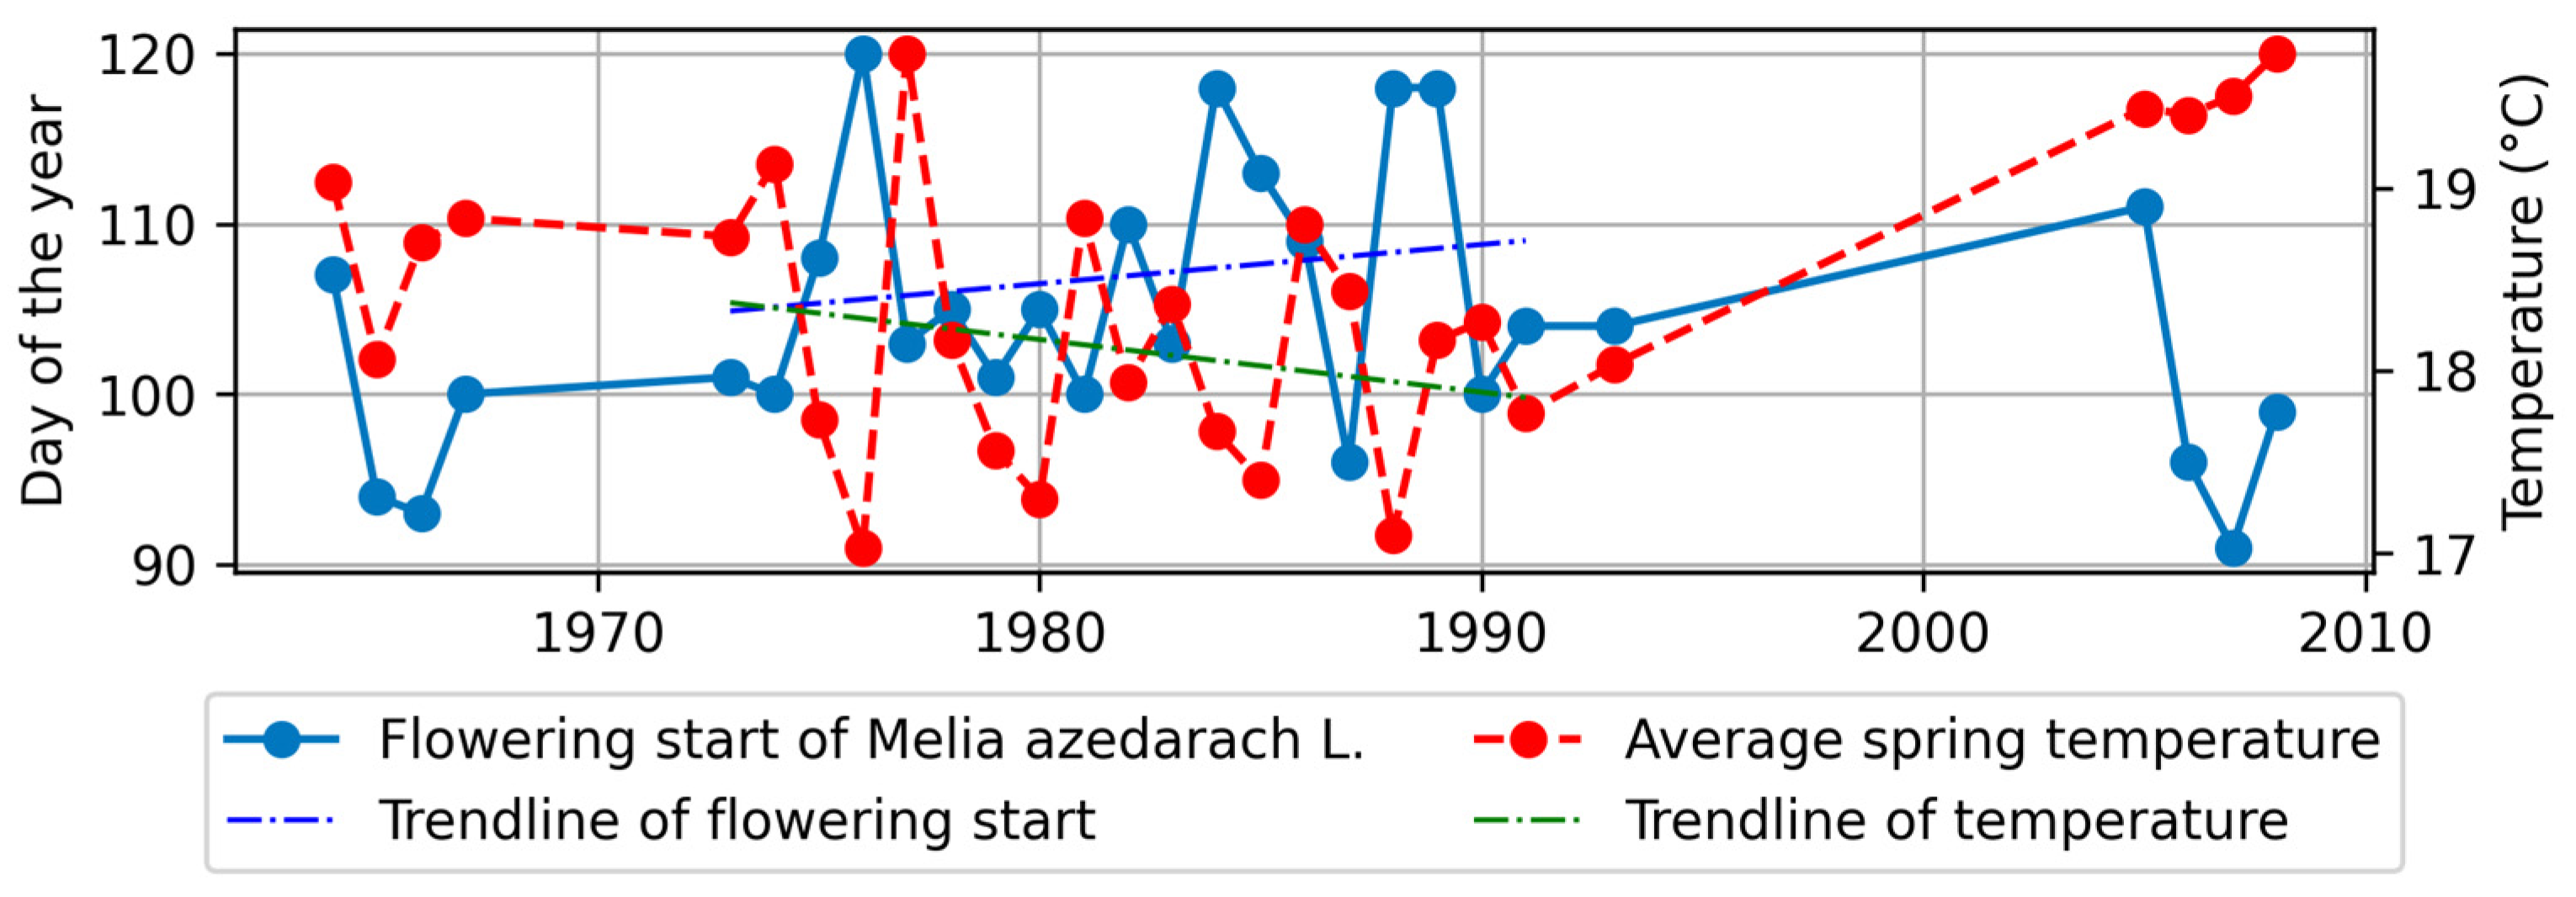
- Among the four stations, M. azedarach exhibited the highest sensitivity to climatic factor changes, specifically in terms of flowering start and flowering end. Notably, there was a significant negative correlation between the phenological stages of M. azedarach and spring temperatures, indicating that higher temperatures led to earlier phenological stages.
- (3)
- The influence of the same climatic factor on different phenological stages of the same plant species varied. For example, at Foshan, the flowering start of M. azedarach exhibited a significant correlation with the average temperature of February–March, whereas the flowering end of the same species did not show a clear correlation with average temperature. Similarly, the flowering end of P. fortunei exhibited a significant correlation with the average temperature of March–April, while the correlation with average temperature was less evident for the flowering start of the same species. Moreover, the flowering end of C. mollissima at Changsha exhibited a significant correlation with precipitation, whereas the correlation with precipitation was not significant for the flowering start.
- (4)
- Different regions displayed varying degrees of influence from climatic factors on plant phenology. For instance, the phenological stages of woody plants at Foshan and Ganxian were affected by the average temperature in May, while other climatic factors had less impact. On the other hand, the phenological stages of the plants at Changsha and Guilin were influenced by sunshine duration and precipitation. Specifically, the flowering end of C. mollissima at Changsha displayed a significant negative correlation with precipitation in May–June, the flowering start of M. grandiflora at Changsha exhibited a significant correlation with spring sunshine duration, and both phenological stages of M. grandiflora at Guilin showed a significant negative correlation with sunshine duration in March–April.
Author Contributions
Funding
Data Availability Statement
Acknowledgments
Conflicts of Interest
References
- Steffen, W.; Sanderson, R.A.; Tyson, P.D.; Jäger, J.; Matson, P.A.; Moore, B., III; Oldfield, F.; Richardson, K.; Schellnhuber, H.-J.; Turner, B.L. Global Change and the Earth System: A Planet under Pressure; Springer Science & Business Media: Berlin/Heidelberg, Germany, 2005. [Google Scholar]
- Gordo, O.; Sanz, J.J. Impact of climate change on plant phenology in Mediterranean ecosystems. Glob. Chang. Biol. 2010, 16, 1082–1106. [Google Scholar] [CrossRef]
- Peñuelas, J.; Filella, I. Responses to a warming world. Science 2001, 294, 793–795. [Google Scholar] [CrossRef] [PubMed]
- Partanen, J.; Koski, V.; Hänninen, H. Effects of photoperiod and temperature on the timing of bud burst in Norway spruce (Picea abies). Tree Physiol. 1998, 18, 811–816. [Google Scholar] [CrossRef]
- Walther, G.-R.; Post, E.; Convey, P.; Menzel, A.; Parmesan, C.; Beebee, T.J.; Fromentin, J.-M.; Hoegh-Guldberg, O.; Bairlein, F. Ecological responses to recent climate change. Nature 2002, 416, 389–395. [Google Scholar] [CrossRef] [PubMed]
- Cleland, E.E.; Chuine, I.; Menzel, A.; Mooney, H.A.; Schwartz, M.D. Shifting plant phenology in response to global change. Trends Ecol. Evol. 2007, 22, 357–365. [Google Scholar] [CrossRef] [PubMed]
- Vitasse, Y.; Delzon, S.; Dufrêne, E.; Pontailler, J.-Y.; Louvet, J.-M.; Kremer, A.; Michalet, R. Leaf phenology sensitivity to temperature in European trees: Do within-species populations exhibit similar responses? Agric. For. Meteorol. 2009, 149, 735–744. [Google Scholar] [CrossRef]
- Menzel, A. Plant phenological anomalies in Germany and their relation to air temperature and NAO. Clim. Chang. 2003, 57, 243–263. [Google Scholar] [CrossRef]
- Vitasse, Y.; Baumgarten, F.; Zohner, C.; Rutishauser, T.; Pietragalla, B.; Gehrig, R.; Dai, J.; Wang, H.; Aono, Y.; Sparks, T. The great acceleration of plant phenological shifts. Nat. Clim. Chang. 2022, 12, 300–302. [Google Scholar] [CrossRef]
- Fu, Y.H.; Zhao, H.; Piao, S.; Peaucelle, M.; Peng, S.; Zhou, G.; Ciais, P.; Huang, M.; Menzel, A.; Peñuelas, J. Declining global warming effects on the phenology of spring leaf unfolding. Nature 2015, 526, 104–107. [Google Scholar] [CrossRef]
- Wenden, B.; Mariadassou, M.; Chmielewski, F.M.; Vitasse, Y. Shifts in the temperature-sensitive periods for spring phenology in European beech and pedunculate oak clones across latitudes and over recent decades. Glob. Chang. Biol. 2020, 26, 1808–1819. [Google Scholar] [CrossRef]
- Piao, S.; Liu, Q.; Chen, A.; Janssens, I.A.; Fu, Y.; Dai, J.; Liu, L.; Lian, X.; Shen, M.; Zhu, X. Plant phenology and global climate change: Current progresses and challenges. Glob. Chang. Biol. 2019, 25, 1922–1940. [Google Scholar] [CrossRef] [PubMed]
- Asse, D.; Chuine, I.; Vitasse, Y.; Yoccoz, N.G.; Delpierre, N.; Badeau, V.; Delestrade, A.; Randin, C.F. Warmer winters reduce the advance of tree spring phenology induced by warmer springs in the Alps. Agric. For. Meteorol. 2018, 252, 220–230. [Google Scholar] [CrossRef]
- Liu, H.; Wang, H.; Li, N.; Shao, J.; Zhou, X.; Van Groenigen, K.J.; Thakur, M.P. Phenological mismatches between above- and belowground plant responses to climate warming. Nat. Clim. Chang. 2022, 12, 97–102. [Google Scholar] [CrossRef]
- Parmesan, C.; Yohe, G. A globally coherent fingerprint of climate change impacts across natural systems. Nature 2003, 421, 37–42. [Google Scholar] [CrossRef] [PubMed]
- Cao, F.; Qi, C.; Li, G.; Zhong, C.; Tang, D.; Xu, Y.; Peng, C. Climate change effects on Southern Subtropical and Tropical tree species in Ganzhou city, China. Br. J. Environ. Clim. Chang. 2012, 2, 163–179. [Google Scholar] [CrossRef]
- Yuan, Q.; Wu, S.; Dai, E.; Zhao, D.; Ren, P.; Zhang, X. NPP vulnerability of the potential vegetation of China to climate change in the past and future. J. Geogr. Sci. 2017, 27, 131–142. [Google Scholar] [CrossRef]
- Li, C.; Yu, S.-Y.; Yao, S.; Shen, J.; Ji, M.; Chen, R.; Sun, W.; Ling, C. Response of alpine vegetation to climate changes in the Nanling Mountains during the second half of the Holocene. Quat. Int. 2019, 522, 12–22. [Google Scholar] [CrossRef]
- Peng, H.; Xia, H.; Chen, H.; Zhi, P.; Xu, Z. Spatial variation characteristics of vegetation phenology and its influencing factors in the subtropical monsoon climate region of southern China. PLoS ONE 2021, 16, e0250825. [Google Scholar] [CrossRef]
- Hou, A.; Zhou, G.; Peng, S. Relationship between climatic factors and radial growth of Pinus massoniana in Dinghushan Mountain. Chin. J. Appl. Ecol. 2003, 14, 637–639. [Google Scholar]
- Wang, Y.; Dong, Y. Geographical Detection of Regional Demarcation in the Nanling Mountains. Trop. Geogr. 2018, 38, 337–346. [Google Scholar]
- Chen, T. Studies on the floraof nanling mountain range. Ecol. Sci. 1993, 1993, 166–170. [Google Scholar]
- IGSNRR. China Phenological Observation Guidelines; IGSNRR: Beijing, China, 2010; pp. 5–11. [Google Scholar]
- Hatcher, D. Simple formulae for Julian day numbers and calendar dates. Q. J. R. Astron. Soc. 1984, 25, 53. [Google Scholar]
- Sidney, S. Nonparametric statistics for the behavioral sciences. J. Nerv. Ment. Dis. 1957, 125, 497. [Google Scholar] [CrossRef]
- Stapleton, J.H. Linear Statistical Models; John Wiley & Sons: Hoboken, NJ, USA, 2009; Volume 719. [Google Scholar]
- Ding, C.; Huang, W.; Meng, Y.; Zhang, B. Satellite-Observed Spatio-Temporal Variation in Spring Leaf Phenology of Subtropical Forests across the Nanling Mountains in Southern China over 1999–2019. Forests 2022, 13, 1486. [Google Scholar] [CrossRef]
- Menzel, A.; Sparks, T.H.; Estrella, N.; Koch, E.; Aasa, A.; Ahas, R.; Alm-Kübler, K.; Bissolli, P.; Braslavská, O.g.; Briede, A. European phenological response to climate change matches the warming pattern. Glob. Chang. Biol. 2006, 12, 1969–1976. [Google Scholar] [CrossRef]
- Wang, X.; Liu, H.; Gu, M.B.; Boucek, R.; Wu, Z.M.; Zhou, G.Y. Greater impacts from an extreme cold spell on tropical than temperate butterflies in southern China. Ecosphere 2016, 7, e01315. [Google Scholar] [CrossRef]
- Wolkovich, E.M.; Cook, B.I.; McLauchlan, K.K.; Davies, T. Temporal ecology in the Anthropocene. Ecol. Lett. 2014, 17, 1365–1379. [Google Scholar] [CrossRef]
- Singh, N.; Ram, J.; Tewari, A.; Yadav, R. Phenological events along the elevation gradient and effect of climate change on Rhododendron arboreum Sm. in Kumaun Himalaya. Curr. Sci. 2015, 108, 106–110. [Google Scholar]
- Piao, S.; Tan, J.; Chen, A.; Fu, Y.H.; Ciais, P.; Liu, Q.; Janssens, I.A.; Vicca, S.; Zeng, Z.; Jeong, S.-J. Leaf onset in the northern hemisphere triggered by daytime temperature. Nat. Commun. 2015, 6, 6911. [Google Scholar] [CrossRef]
- Badeck, F.W.; Bondeau, A.; Böttcher, K.; Doktor, D.; Lucht, W.; Schaber, J.; Sitch, S. Responses of spring phenology to climate change. New Phytol. 2004, 162, 295–309. [Google Scholar] [CrossRef]


| Stations | Location | Elevation (m a.s.l) | Years with Missing Observation Records | ||||
|---|---|---|---|---|---|---|---|
| Latitude (N) | Longitude (E) | C. mollissima | M. azedarach | M. grandiflora | P. fortunei | ||
| Changsha | 28.2 | 112.9 | 82 | 1963–1964, 1973–1974 | - | 1964–1974, 2003–2005 | 1963–2004 |
| Ganzhou | 25.9 | 114.9 | 101 | 1963–1976, 1991, 1996–2008 | 1963–1976, 1991, 1996–2008 | 1963–1988, 1996–2008 | 1963–1976, 1990–1991, 1996–2008 |
| Guilin | 25.3 | 110.3 | 159 | 1963, 1968–1972, 1980, 1989, 1992, 1994–2002 | 1963, 1968–1972, 1992, 1994–2004 | 1963–1978, 1994–2002, 2007 | 1963–1976, 1990–1991, 1994–2002 |
| Foshan | 23 | 113.1 | 17 | 1963–1964, 1968, 1981–1983, 1988–1989, 1991–2002, 2003–2008 | 1988, 1991–2002 | 1963–2002 | 1963–1967, 1969–1972, 1972–1978, 1991–2008 |
| Phenological Stages | Species | Ganxian Average Date | Foshan Average Date | Differences in Days | Comparison Results |
|---|---|---|---|---|---|
| Flowering start | C. mollissima | 5/10 | 4/29 | 11 | Earlier in the south |
| M. azedarach | 4/13 | 3/21 | 23 | Earlier in the south | |
| M. grandiflora | 5/16 | 4/20 | 26 | Earlier in the south | |
| P. fortunei | 3/13 | 2/28 | 14 | Earlier in the south | |
| Flowering end | C. mollissima | 5/27 | 5/13 | 14 | Earlier in the south |
| M. azedarach | 4/19 | 4/10 | 9 | Earlier in the south | |
| M. grandiflora | 6/7 | 5/17 | 21 | Earlier in the south | |
| P. fortunei | 4/17 | 4/14 | 3 | Earlier in the south |
| Phenological Stages | Species | Changsha Average Date | Foshan Average Date | Differences in Days | Comparison Results |
|---|---|---|---|---|---|
| Flowering start | C. mollissima | 5/17 | 4/29 | 18 | Earlier in the south |
| M. azedarach | 4/28 | 3/21 | 38 | Earlier in the south | |
| M. grandiflora | 5/14 | 4/20 | 24 | Earlier in the south | |
| P. fortunei | 3/25 | 2/28 | 26 | Earlier in the south | |
| Flowering end | C. mollissima | 6/3 | 5/13 | 21 | Earlier in the south |
| M. azedarach | 5/11 | 4/10 | 31 | Earlier in the south | |
| M. grandiflora | 6/14 | 5/17 | 28 | Earlier in the south | |
| P. fortunei | 4/12 | 4/14 | 2 | Almost the same |
| Phenological Stages | Species | Linear Regression Equation (Where x Represents Days of the Year) |
|---|---|---|
| Flowering start | C. mollissima | y = 0.1501x − 167.85 |
| M. azedarach | y = 0.2051x − 303.38 | |
| M. grandiflora | y = 0.2103x − 282.76 | |
| P. fortunei | y = 0.2119x + 348.57 | |
| Flowering end | C. mollissima | y = 0.0339x + 79.65 |
| M. azedarach | y = 0.0684x − 16 | |
| M. grandiflora | y = 0.6948x − 1225.19 | |
| P. fortunei | y = 0.6712x − 1236.03 |
| Phenological Stages | Species | Linear Regression Equation (Where x Represents Days of the Year) |
|---|---|---|
| Flowering start | C. mollissima | y = −0.0626x + 262.28 |
| M. azedarach | y = −0.0136x + 143.866 | |
| M. grandiflora | y = −0.7758x + 1681.13 | |
| P. fortunei | - | |
| Flowering end | C. mollissima | y = −0.9024x + 1942.44 |
| M. azedarach | y = −0.034x + 190.84 | |
| M. grandiflora | y = −0.6773x + 1513.85 | |
| P. fortunei | - |
| Phenological Stages | Species | Linear Regression Equation (Where x Represents Days of the Year) |
|---|---|---|
| Flowering start | C. mollissima | y = 0.6253x − 1119.093 |
| M. azedarach | y = −0.2795x + 634.98 | |
| M. grandiflora | - | |
| P. fortunei | y = 0.0635x − 68.99 | |
| Flowering end | C. mollissima | y = 0.7537x − 1358.12 |
| M. azedarach | y = −0.4828x + 1058.91 | |
| M. grandiflora | - | |
| P. fortunei | y = 0.3064x − 502.499 |
| Phenological Stages | Species | Linear Regression Equation (Where x Represents Days of the Year) |
|---|---|---|
| Flowering start | C. mollissima | y = 0.0114x + 115.064 |
| M. azedarach | y = −0.00634x + 117.06 | |
| M. grandiflora | y = −0.6117x + 1347.71 | |
| P. fortunei | y = −0.229x + 529.12 | |
| Flowering end | C. mollissima | y = −0.10897x + 366.56 |
| M. azedarach | y = 0.0439x + 34.96 | |
| M. grandiflora | y = −0.0287x + 210.73 | |
| P. fortunei | y = −0.2326x + 564.96 |
| Phenological Stages | Species | Changsha | Guilin | ||
|---|---|---|---|---|---|
| Changes (d/a) | Trend | Changes (d/a) | Trend | ||
| Flowering start | C. mollissima | −0.0626 | Advancing | −0.188 | Advancing |
| M. azedarach | −0.412 | Advancing | −0.247 | Advancing | |
| P. fortunei | - | No trend | −0.339 | Advancing | |
| M. grandiflora | −0.776 | Advancing | −0.612 | Advancing | |
| Flowering end | C. mollissima | −0.902 | Advancing | −0.390 | Advancing |
| M. azedarach | −0.463 | Advancing | −0.01 | Advancing | |
| P. fortunei | - | No trend | −0.186 | Advancing | |
| M. grandiflora | −0.677 | Advancing | −0.029 | Advancing | |
| Phenological Stages | Species | Ganxian | Foshan | ||
|---|---|---|---|---|---|
| Changes (d/a) | Trend | Changes (d/a) | Trend | ||
| Flowering start | C. mollissima | 0.377 | Delaying | 1.387 | Delaying |
| M. azedarach | 0.253 | Delaying | −0.272 | Advancing | |
| P. fortunei | 0.212 | Delaying | −0.392 | Advancing | |
| M. grandiflora | 0.210 | No trend | - | No trend | |
| Flowering end | C. mollissima | −0.067 | Advancing | 0.261 | Delaying |
| M. azedarach | 0.242 | Delaying | −2.029 | Advancing | |
| P. fortunei | 0.671 | Delaying | −0.105 | Advancing | |
| M. grandiflora | 0.695 | Delaying | - | No trend | |
| Factors | Species | February | March | April | May | March–April | April–May | Spring (March–May) |
|---|---|---|---|---|---|---|---|---|
| Average temperature | C. mollissima | 0.694 ** | −0.356 | −0.451 | 0.185 | −0.560 * | −0.234 | −0.508 * |
| M. azedarach | −0.703 ** | −0.679 | −0.196 | 0.251 | −0.675 ** | −0.009 | −0.599 ** | |
| M. grandiflora | 0.274 | −0.068 | 0.133 | 0.253 | 0.024 | 0.212 | 0.11 | |
| P. fortunei | −0.345 | −0.031 | −0.025 | −0.092 | −0.039 | 0.033 | 0.001 | |
| Precipitation | C. mollissima | 0.082 | −0.224 | −0.202 | −0.353 | −0.073 | −0.096 | −0.222 |
| M. azedarach | 0.284 | 0.069 | 0.083 | −0.083 | 0.113 | 0.001 | 0.044 | |
| M. grandiflora | −0.058 | 0.261 | −0.672 * | −0.455 | 0.127 | −0.649 * | −0.161 | |
| P. fortunei | −0.039 | 0.67 | 0.181 | 0.043 | 0.18 | 0.158 | 0.158 | |
| Sunshine duration | C. mollissima | −0.393 | 0.271 | −0.221 | 0.213 | 0.085 | 0.056 | 0.235 |
| M. azedarach | −0.479 * | −0.163 | 0.06 | 0.046 | −0.106 | 0.086 | −0.042 | |
| M. grandiflora | 0.058 | 0.148 | 0.137 | 0.135 | 0.305 | 0.192 | 0.316 | |
| P. fortunei | −0.261 | 0.229 | 0.029 | 0.011 | 0.22 | 0.031 | 0.202 |
| Factors | Species | February | March | April | May | March–April | April–May | May–June | Spring (March–May) |
|---|---|---|---|---|---|---|---|---|---|
| Average temperature | C. mollissima | −0.167 | −0.373 | −0.495 | −0.38 | −0.499 | −0.510 | −0.366 | −0.503 |
| M. azedarach | −0.237 | −0.551 | −0.726 ** | −0.331 | −0.738 ** | −0.646 ** | - | −0.678 ** | |
| M. grandiflora | −0.223 | −0.869 ** | −0.648 * | −0.697 * | −0.908 ** | −0.765 ** | - | −0.918 ** | |
| P. fortunei | −0.479 | −0.994 | 0.817 | - | −0.372 | - | - | - | |
| Precipitation | C. mollissima | −0.125 | 0.511 | −0.475 | −0.022 | −0.70 | −0.325 | 0.029 | −0.066 |
| M. azedarach | −0.218 | 0.602 * | −0.219 | −0.148 | 0.218 | −0.245 | - | 0.038 | |
| M. grandiflora | −0.085 | 0.493 | 0.067 | −0.015 | 0.408 | 0.035 | - | 0.300 | |
| P. fortunei | 0.985 * | −0.741 | 0.027 | - | −0.329 | - | - | - | |
| Sunshine duration | C. mollissima | −0.409 | −0.341 | −0.195 | −0.238 | −0.373 | −0.329 | −0.091 | −0.414 |
| M. azedarach | −0.153 | −0.461 | −0.556 * | −0.164 | −0.686 ** | −0.513 * | - | −0.601 * | |
| M. grandiflora | −0.077 | −0.779 ** | −0.156 | −0.540 | −0.603 * | −0.603 * | - | −0.801 ** | |
| P. fortunei | −0.886 | −0.683 | 0.931 | - | −0.024 | - | - | - |
| Factors | Species | February | March | April | May | Feburary–March | March–April | April–May | Spring (March–May) |
|---|---|---|---|---|---|---|---|---|---|
| Average temperature | C. mollissima | −0.278 | −0.361 | −0.218 | 0.495 | −0.384 | −0.367 | 0.157 | −0.141 |
| M. azedarach | −0.535 ** | −0.301 | - | - | −0.554 ** | - | - | - | |
| M. grandiflora | −0.539 | 0.324 | −0.665 | - | −0.445 | −0.269 | - | - | |
| P. fortunei | −0.379 | −0.492 | - | - | −0.537 | - | - | - | |
| Precipitation | C. mollissima | 0.617 | 0.141 | −0.446 | −0.431 | 0.539 | −0.319 | −0.537 * | −0.452 |
| M. azedarach | 0.213 | 0.144 | - | - | 0.207 | - | - | - | |
| M. grandiflora | 0.169 | 0.022 | 0.556 | - | 0.12 | 0.445 | - | - | |
| P. fortunei | 0.213 | 0.144 | - | - | 0.207 | - | - | - | |
| Sunshine duration | C. mollissima | −0.197 | 0.186 | −0.177 | 0.371 | 0.004 | 0.034 | 0.163 | 0.183 |
| M. azedarach | 0.033 | 0.265 | - | - | 0.184 | - | - | - | |
| M. grandiflora | 0.033 | 0.265 | −0.716 | - | 0.184 | −0.47 | - | - | |
| P. fortunei | −0.031 | 0.19 | - | - | 0.079 | - | - | - |
| Factors | Species | February | March | April | May | March–April | April–May | May–June | Spring (March–May) |
|---|---|---|---|---|---|---|---|---|---|
| Average temperature | C. mollissima | −0.138 | −0.529 ** | −0.489 ** | −0.376 * | −0.635 ** | −0.589 ** | −0.150 | −0.734 ** |
| M. azedarach | −0.514 ** | −0.621 ** | −0.218 | - | −0.548 ** | - | - | −0.551 ** | |
| M. grandiflora | −0.161 | −0.207 | −0.524 * | −0.240 | −0.413 | −0.475 * | - | −0.471 * | |
| P. fortunei | −0.097 | 0.120 | 0.185 | - | 0.173 | - | - | 0.098 | |
| Precipitation | C. mollissima | 0.341 | 0.032 | −0.211 | 0.059 | −0.153 | −0.067 | −0.010 | −0.049 |
| M. azedarach | −0.029 | −0.199 | −0.198 | - | −0.257 | - | - | −0.024 | |
| M. grandiflora | 0.189 | 0.169 | 0.605 ** | −0.329 | 0.564 * | 0.170 | - | 0.213 | |
| P. fortunei | −0.190 | 0.210 | 0.074 | - | 0.146 | - | - | 0.291 | |
| Sunshine duration | C. mollissima | −0.298 | −0.465 * | −0.118 | −0.342 | −0.384 * | −0.307 | −0.089 | −0.437 * |
| M. azedarach | −0.370 | −0.408 * | −0.097 | - | −0.335 | - | - | −0.372 | |
| M. grandiflora | −0.192 | −0.504 * | −0.343 | 0.054 | −0.587 ** | −0.220 | - | −0.435 | |
| P. fortunei | −0.088 | 0.179 | −0.046 | - | 0.084 | - | - | 0.119 |
| Factors | Species | March | April | May | June | March–April | April–May | May–June | Spring (March–May) |
|---|---|---|---|---|---|---|---|---|---|
| Average temperature | C. mollissima | −0.312 | −0.334 | −0.067 | 0.013 | −0.455 | −0.284 | −0.027 | 0.512 * |
| M. azedarach | −0.558 * | −0.486 * | 0.158 | - | −0.748 ** | −0.275 | - | −0.719 ** | |
| M. grandiflora | 0.025 | 0.087 | −0.453 | −0.013 | 0.094 | −0.132 | −0.237 | −0.106 | |
| P. fortunei | −0.005 | −0.027 | - | - | 0.012 | 0.015 | - | 0.008 | |
| Precipitation | C. mollissima | −0.001 | −0.25 | −0.244 | −0.016 | −0.166 | −0.33 | −0.144 | −0.239 |
| M. azedarach | 0.006 | −0.218 | −0.259 | - | −0.139 | −0.319 | - | −0.227 | |
| M. grandiflora | 0.237 | −0.431 | −0.086 | 0.409 | 0.136 | −0.222 | 0.268 | 0.055 | |
| P. fortunei | −0.048 | −0.025 | - | - | −0.058 | −0.167 | - | −0.152 | |
| Sunshine duration | C. mollissima | 0.004 | 0.015 | −0.178 | −0.6 | 0.015 | −0.162 | −0.145 | −0.132 |
| M. azedarach | −0.066 | −0.028 | −0.125 | - | −0.083 | −0.14 | - | 0.163 | |
| M. grandiflora | 0.569 | −0.519 | −0.412 | −0.323 | 0.220 | −0.625 | −0.458 | −0.225 | |
| P. fortunei | 0.464 | −0.171 | - | - | 0.274 | −0.142 | - | 0.221 |
| Factors | Species | March | April | May | June | March–April | April–May | May–June | Spring (March–May) |
|---|---|---|---|---|---|---|---|---|---|
| Average temperature | C. mollissima | −0.079 | −0.572 * | −0.119 | −0.563 * | −0.366 | −0.428 | −0.345 | −0.316 |
| M. azedarach | −0.550 * | −0.734 ** | −0.345 | - | −0.742 ** | −0.658 ** | - | −0.686 ** | |
| M. grandiflora | −0.691 | −0.304 | −0.403 | −0.685 * | −0.619 | −0.391 | −0.597 | −0.586 | |
| P. fortunei | −0.922 | 0.237 | - | - | −0.893 | - | - | - | |
| Precipitation | C. mollissima | 0.194 | 0.262 | −0.691 ** | −0.356 | 0.374 | −0.381 | −0.695 ** | −0.275 |
| M. azedarach | 0.563 * | −0.209 | −0.212 | - | 0.2 | −0.286 | - | −0.02 | |
| M. grandiflora | 0.352 | 0.230 | 0.056 | −0.051 | 0.472 | 0.210 | −0.002 | 0.396 | |
| P. fortunei | −0.871 | 0.073 | - | - | −0.338 | - | - | - | |
| Sunshine duration | C. mollissima | −0.026 | −0.399 | 0.369 | 0.058 | −0.34 | 0.034 | 0.382 | 0.017 |
| M. azedarach | −0.45 | −0.504 * | −0.132 | - | −0.641 ** | −0.451 | - | −0.547 * | |
| M. grandiflora | −0.509 | −0.298 | −0.387 | −0.405 | −0.538 | −0.47 | −0.769 ** | −0.556 | |
| P. fortunei | −0.980 * | 0.553 | - | - | −0.680 | - | - | - |
| Factors | Species | March | April | May | March–April | April–May | May–June | Spring (March–May) |
|---|---|---|---|---|---|---|---|---|
| Average temperature | C. mollissima | 0.011 | −0.162 | 0.128 | −0.075 | −0.028 | - | −0.013 |
| M. azedarach | −0.02 | −0.173 | −0.061 | −0.11 | −0.159 | - | −0.125 | |
| M. grandiflora | 0.493 | 0.465 | −0.697 | 0.71 | −0.125 | - | 0.274 | |
| P. fortunei | −0.737 ** | −0.593 * | - | −0.808 ** | - | - | - | |
| Precipitation | C. mollissima | −0.288 | −0.197 | −0.548 | −0.293 | −0.536 | - | −0.523 |
| M. azedarach | −0.045 | 0.12 | −0.207 | 0.068 | −0.133 | - | −0.138 | |
| M. grandiflora | −0.478 | −0.241 | 0.034 | −0.398 | −0.039 | - | −0.104 | |
| P. fortunei | −0.478 | −0.241 | - | −0.398 | - | - | - | |
| Sunshine duration | C. mollissima | 0.235 | −0.592 * | 0.108 | −0.105 | −0.187 | - | −0.012 |
| M. azedarach | 0.204 | −0.166 | −0.001 | 0.031 | −0.085 | - | 0.019 | |
| M. grandiflora | 0.647 | −0.012 | −0.08 | 0.716 | −0.057 | - | 0.325 | |
| P. fortunei | −0.279 | −0.069 | - | −0.178 | - | - | - |
| Factors | Species | March | April | May | June | March–April | April–May | May–June | Spring (March–May) |
|---|---|---|---|---|---|---|---|---|---|
| Average temperature | C. mollissima | −0.462 * | −0.508 ** | −0.415 * | 0.188 | −0.585 ** | −0.639 ** | −0.219 | −0.713 ** |
| M. azedarach | −0.485 ** | −0.224 | 0.043 | - | −0.465 * | −0.137 | - | −0.399 * | |
| M. grandiflora | 0.172 | −0.246 | −0.204 | −0.192 | −0.001 | −0.273 | −0.262 | −0.079 | |
| P. fortunei | 0.286 | −0.084 | - | - | 0.166 | - | - | - | |
| Precipitation | C. mollissima | 0.121 | −0.024 | 0.119 | −0.110 | 0.039 | 0.082 | 0.012 | 0.106 |
| M. azedarach | −0.390 * | −0.208 | 0.115 | - | −0.360 | −0.019 | - | −0.129 | |
| M. grandiflora | 0.168 | 0.430 | −0.204 | 0.247 | 0.429 | 0.145 | 0.067 | 0.192 | |
| P. fortunei | 0.285 | 0.246 | - | - | 0.312 | - | - | - | |
| Sunshine duration | C. mollissima | −0.444 * | −0.156 | −0.237 | 0.210 | −0.391 * | −0.253 | −0.028 | −0.387 * |
| M. azedarach | −0.211 | 0.002 | −0.046 | - | −0.137 | −0.032 | - | −0.112 | |
| M. grandiflora | −0.504 * | −0.343 | 0.054 | 0.252 | −0.587 ** | −0.220 | 0.241 | −0.435 | |
| P. fortunei | 0.188 | −0.224 | - | - | −0.056 | - | - | - |
Disclaimer/Publisher’s Note: The statements, opinions and data contained in all publications are solely those of the individual author(s) and contributor(s) and not of MDPI and/or the editor(s). MDPI and/or the editor(s) disclaim responsibility for any injury to people or property resulting from any ideas, methods, instructions or products referred to in the content. |
© 2023 by the authors. Licensee MDPI, Basel, Switzerland. This article is an open access article distributed under the terms and conditions of the Creative Commons Attribution (CC BY) license (https://creativecommons.org/licenses/by/4.0/).
Share and Cite
Liu, G.; Xiang, A.; Wan, Z.; Lv, H.; Liu, H.; Hu, Z.; Chen, L. Phenological Changes of Woody Plants in the Southern and Northern Regions of Nanling Mountains and Their Relationship with Climatic Factors. Forests 2023, 14, 2363. https://doi.org/10.3390/f14122363
Liu G, Xiang A, Wan Z, Lv H, Liu H, Hu Z, Chen L. Phenological Changes of Woody Plants in the Southern and Northern Regions of Nanling Mountains and Their Relationship with Climatic Factors. Forests. 2023; 14(12):2363. https://doi.org/10.3390/f14122363
Chicago/Turabian StyleLiu, Guangxu, Aicun Xiang, Zhiwei Wan, Haihui Lv, Haolong Liu, Zhen Hu, and Lili Chen. 2023. "Phenological Changes of Woody Plants in the Southern and Northern Regions of Nanling Mountains and Their Relationship with Climatic Factors" Forests 14, no. 12: 2363. https://doi.org/10.3390/f14122363
APA StyleLiu, G., Xiang, A., Wan, Z., Lv, H., Liu, H., Hu, Z., & Chen, L. (2023). Phenological Changes of Woody Plants in the Southern and Northern Regions of Nanling Mountains and Their Relationship with Climatic Factors. Forests, 14(12), 2363. https://doi.org/10.3390/f14122363