Article

Effects of Different Afforestation Years on Soil Properties and Quality

1
State Key Laboratory of Grassland Agro-Ecosystems, College of Ecology, Lanzhou University, Lanzhou 730000, China
2
Yuzhong Mountain Ecosystems Observation and Research Station, Lanzhou University, Lanzhou 730000, China
3
Key Laboratory of Eco-Hydrology of Inland River Basin/Gansu Qilian Mountains Eco-Environment Research Center, Northwest Institute of Eco-Environment and Resources, Chinese Academy of Sciences, Lanzhou 730000, China
4
College of Geography and Environmental Science, Northwest Normal University, Lanzhou 730070, China
5
College of Agriculture or Tree Peony, Henan University of Science and Technology, Luoyang 471000, China
*
Authors to whom correspondence should be addressed.
Forests 2023, 14(2), 329; https://doi.org/10.3390/f14020329
Submission received: 4 January 2023 / Revised: 31 January 2023 / Accepted: 1 February 2023 / Published: 7 February 2023
(This article belongs to the Section Forest Soil)

Abstract

:
As an important means of curbing soil degradation, afforestation has a profound impact on regional soil properties and quality. However, it is still unclear regarding how to conduct a systematic assessment of soil properties and soil quality and the impact of vegetation characteristics and plant functional traits in leguminous plantations with different afforestation years in drylands. Therefore, we investigated the vegetation characteristics and determined the functional traits of leaves and roots and the soil physicochemical properties of Caragana korshinskii plantations with 13, 35, and 55 years. The results showed that tree height; crown diameter (CD); root dry matter content; root water content; soil clay, silt, and sand contents; bulk density (BD); soil water content; soil organic carbon (SOC); total nitrogen (TN); available nitrogen; total phosphorus (TP); available phosphorus (AP); and soil quality index (SQI) changed significantly with an increase in afforestation years. Although the specific leaf area did not show a significant variation, it had a significant negative effect on soil properties and SQI, except for soil sand and BD. Soil sand and BD decreased with the afforestation succession, but the succession pattern of soil clay, silt, SOC, TN, TP, and AP was 13 years < 35 years < 55 years, and SQI increased from 0.20 (13 years) to 0.77 (55 years). This indicated that long-term legume afforestation led to the transformation of soil texture from silty loam to silt and significantly improved the soil properties and quality in the study area.

1. Introduction

Soil is a key and a limited resource that provides many direct and indirect functions of regulation (e.g., water retention and carbon storage), provision (e.g., food and shelter), and cultural services (e.g., cultural heritage and ancient ruins) [1,2,3]. Most of these functions have been altered by human activity in the form of changes in land-use patterns. Therefore, there is an urgent need to raise awareness of the importance of soil resources and management practices. Among these, soil quality, as an important aspect of understanding ecosystem service functions, is influenced by a combination of soil physical properties (e.g., bulk density (BD), water content, and texture), chemical properties (soil organic carbon (SOC), total nitrogen (TN), total phosphorus (TP), and available components), and plant characteristics [4,5]. Furthermore, soil quality is also closely related to microbial properties. Therefore, the study of soil quality characteristics and their changing trends plays an important role in understanding and assessing regional habitat quality and ecological service functions.
Soil quality first appeared on the radar of researchers in the early 1970s [6]. In the 1980s, researchers identified declining soil quality as the cause of declining food production in developing countries, such as Asia and Africa [7]. By the 1990s, land resources and environmental protection received more attention due to rapid population growth, increased intensity of land development and use, land degradation, soil pollution, and other problems; thus, evaluation of soil quality was formally proposed [8,9]. More attention has been paid to the evaluation of soil quality conditions in the 21st century. In the early days, soil quality assessments were mostly focused on agro-ecosystems. For example, Karlen et al. [10] assessed the effect of different residues on long-term soil quality in maize fields and concluded that crop residues had a positive effect on soil quality. Mairura et al. [11] proposed soil color, soil texture, tillage quality, and crop yield and performance as the composite indicators for the evaluation of soil quality indices (SQI) in a study in Kenya. Similarly, Stavi et al. [12] explored the effects of moderate stubble grazing on soil quality and found that moderate stubble grazing had a positive effect on soil quality and carbon pools. In recent years, researchers have extended SQI from agro-ecosystems to applications in woodland, grassland, and urban ecosystems. For example, Mishra et al. [13] compared the differences in soil quality between forested and shifting cultivation areas in the Wokha district of Nagaland and found that soil quality was significantly higher in forested areas than in shifting cultivation areas. Koga et al. [14] studied soil quality in 46 areas in Japan, where forest land was converted to farmland or grassland, and found that all soil quality indicators declined significantly after the conversion of forest land to grassland. Hyun et al. [15] developed a SQI based on ecosystem services that were specifically designed for metropolitan environmental volumes. In summary, it can be seen that the research on soil quality has always focused on the variability in soil quality under different land-use types or management practices and has generally been measured by using a SQI.
Chinese authorities have adopted a series of engineering and management measures in order to improve soil quality and to actively combat climate change. These measures include afforestation, which aims to restore degraded ecosystems by changing land-use types and increasing vegetation cover, ultimately improving the quality of regional habitats and ecosystem services. Jiao et al. [16] showed that afforestation significantly improved regional vegetation structure, species diversity, soil nutrients, and soil erosion resistance indicators in the Loess Plateau. Li et al. [17] found that afforestation significantly increased soil NH4+-N concentrations and soil ammonification rates in central China. Shao et al. [18] discovered that long-term afforestation significantly increased regional soil carbon pools and mitigated climate change by sequestering soil carbon in the subsurface. However, it has also been found that afforestation has reduced regional soil moisture and that natural recovery may be a better option for curbing soil degradation [19]. Therefore, afforestation can strongly affect soil properties, but comprehensive assessment of long-term afforestation on soil quality is relatively lacking, and the influence of vegetation communities and plant functional traits on soil properties and soil quality is also unclear, especially for the succession sequence of legume plantations with more than 50 years on drylands. Thus, it is necessary to carry out an experiment to systematically evaluate soil quality after long-term afforestation and to analyze the factors affecting soil quality. We selected three plantations with different afforestation years, which have the same tree species (Caragana korshinskii) and are located in the same area, to avoid mistaken results due to environmental heterogeneity and tree species with different nutrient utilization strategies.

2. Materials and Methods

2.1. Study Area

The study area is located in the Gongjing Observation Field (104°18′ E, 35°54′ N), belonging to the Yuzhong Mountain Ecosystems Observation and Research Station, in the west of the Loess Plateau, China. The size of the observation field is 85.73 km2, and the average altitude is 2250 m. This region is located in a typical semi-arid loess hilly area, with a climate belonging to the temperate continental monsoon climate type. During the past 35 years, the average annual total precipitation and the average annual temperature are 381 mm and 7.2 °C, respectively. Precipitation occurs with large inter-annual variation and uneven distribution during the year, mainly concentrated in May–September [20]. The soil type is loessial soil (Calcaric Cambisol, FAO classification) and is free of gravel. Since 1964, this area has been planted with plantation forests, mainly Caragana korshinskii and Platycladus orientalis, covering an area of about 39.07 km2. Among them, C. korshinskii has been planted three times as a widely used forest type for revegetation, and it can be divided into 55, 35, and 13 years according to the age of afforestation (Figure 1).

2.2. Vegetation Survey and Soil Sampling

In July 2019, five plots were randomly selected for each forest age, and the size of the plots was 20 × 20 m. The three sample plots have the same climate and soil type, and the distance between them is very close (<6 km) to eliminate the impact of site effects on forest development. Each sample plot was sampled using the diagonal method, and three samples from the same plot were mixed into one sample. Firstly, the height and crown diameter (CD) of C. korshinskii in each sample plot were surveyed using a steel tape, and the leaves of these trees were collected. Secondly, before collecting the soil samples, the litter from the soil surface were removed. At a distance of 50 cm from the tree, a soil drill with a diameter of 5 cm was used to collect the surface soil (0–20 cm), and the fine roots were collected by an excavation method. After completed sampling, the leaves and roots were washed with deionized water. For the reconditioned sampling profiles, the soil samples were collected using a cutting ring (100 cm3 volume) and a sterile homogeneous bag. The soil bulk density (BD) samples were weighed fresh in the field, and all samples were then taken back to the laboratory for subsequent determination.

2.3. Vegetation and Soil Physicochemical Analyses

The area of the leaves and the length and specific surface area of the fine roots were scanned and analyzed using a WinRHIZO (Régent Instruments, Quebec, QC, Canada). The scanned leaves and roots were dried in an oven at 65 °C to a constant weight, and then the weights of the leaves and roots were determined. After this, the specific leaf area (SLA), specific root length (SRL), root dry matter content (RDMC), specific root area (SRA), and root water content (RWC) could be obtained. The BD samples were taken back to the laboratory and dried in an oven at 105 °C for 10 h to a constant weight to obtain the value of BD and the soil water content (SWC) [21]. The soil samples, in self-sealing bags, were brought back to the laboratory and left to dry for 2 months, and then the soil sample were ground through 2 mm sieves. After this, the coarse fragments and the roots were removed by hand and then tested. Soil texture was measured using a MS2000 laser particle size analyzer via the Malvin method, including the % of sand content (0.05–2 mm), % of silt content (0.002–0.05 mm), and % of clay content (0–0.002 mm). For a description of the determination methods of soil organic carbon (SOC), total nitrogen (TN), available nitrogen (AN), total phosphorus (TP), and available phosphorus (AP) contents, refer to [22]. The data on soil chemical properties have been published in [23].

2.4. Soil Quality Index

Soil quality index (SQI) was calculated according to Cao [9]. The principal component analysis method (PCA) was used to select the principal components with a latent root greater than 1, and then the soil properties with a greater contribution among the designated principal components were selected. If there were multiple soil properties with relatively large contributions from the same principal component, they were filtered using the correlation coefficients between the soil properties. Finally, the soil properties with a correlation coefficient <0.75 in absolute value were retained as the selected soil properties within the same principal component.
Based on the method of calculating soil property scores, the selected soil properties were classified as positively or negatively correlated with the SQI. The soil properties were normalized to values between 0 and 1 (positively correlated soil properties, Equation (1); negatively correlated soil indicators, Equation (2)). For this study, all of the 10 factors associated with the evaluation of soil quality were positively correlated, with the exception of BD and sand content, which were negatively correlated.
S i = X i X m i n X m a x X m i n
S i = 1 X i X m i n X m a x X m i n
where Si is the normalized score for the soil properties, and Xi, Xmin, and Xmax are the measured value, the minimum value, and the maximum value for the soil properties, respectively.
Similarly, the weight of different soil properties (Equation (3)) was determined from the ratio of the contribution of each principal component to the cumulative contribution of the results of the principal component analysis.
W i = P i i = 1 n P i
where Wi is the weight of soil properties, and Pi is the contribution of the i-th principal component.
Finally, the SQI (Equation (4)) was obtained by multiplying the normalized scores of the principal components with their weights and summed them.
SQI = i = 1 n S i × W i

2.5. Statistical Analyses

This study used the SPSS 25.0 (SPSS Inc., Chicago, IL, USA) software for statistical analysis of the data. One-way ANOVA was used to investigate the variability in vegetation, root, and soil properties among C. korshinskii of different forest years, and the LSD method was used to test the significance of differences. Pearson correlation analysis and PCA were used to derive the main factors representing soil quality and their contribution. All the above mapping was performed in Origin 2021b.

3. Results

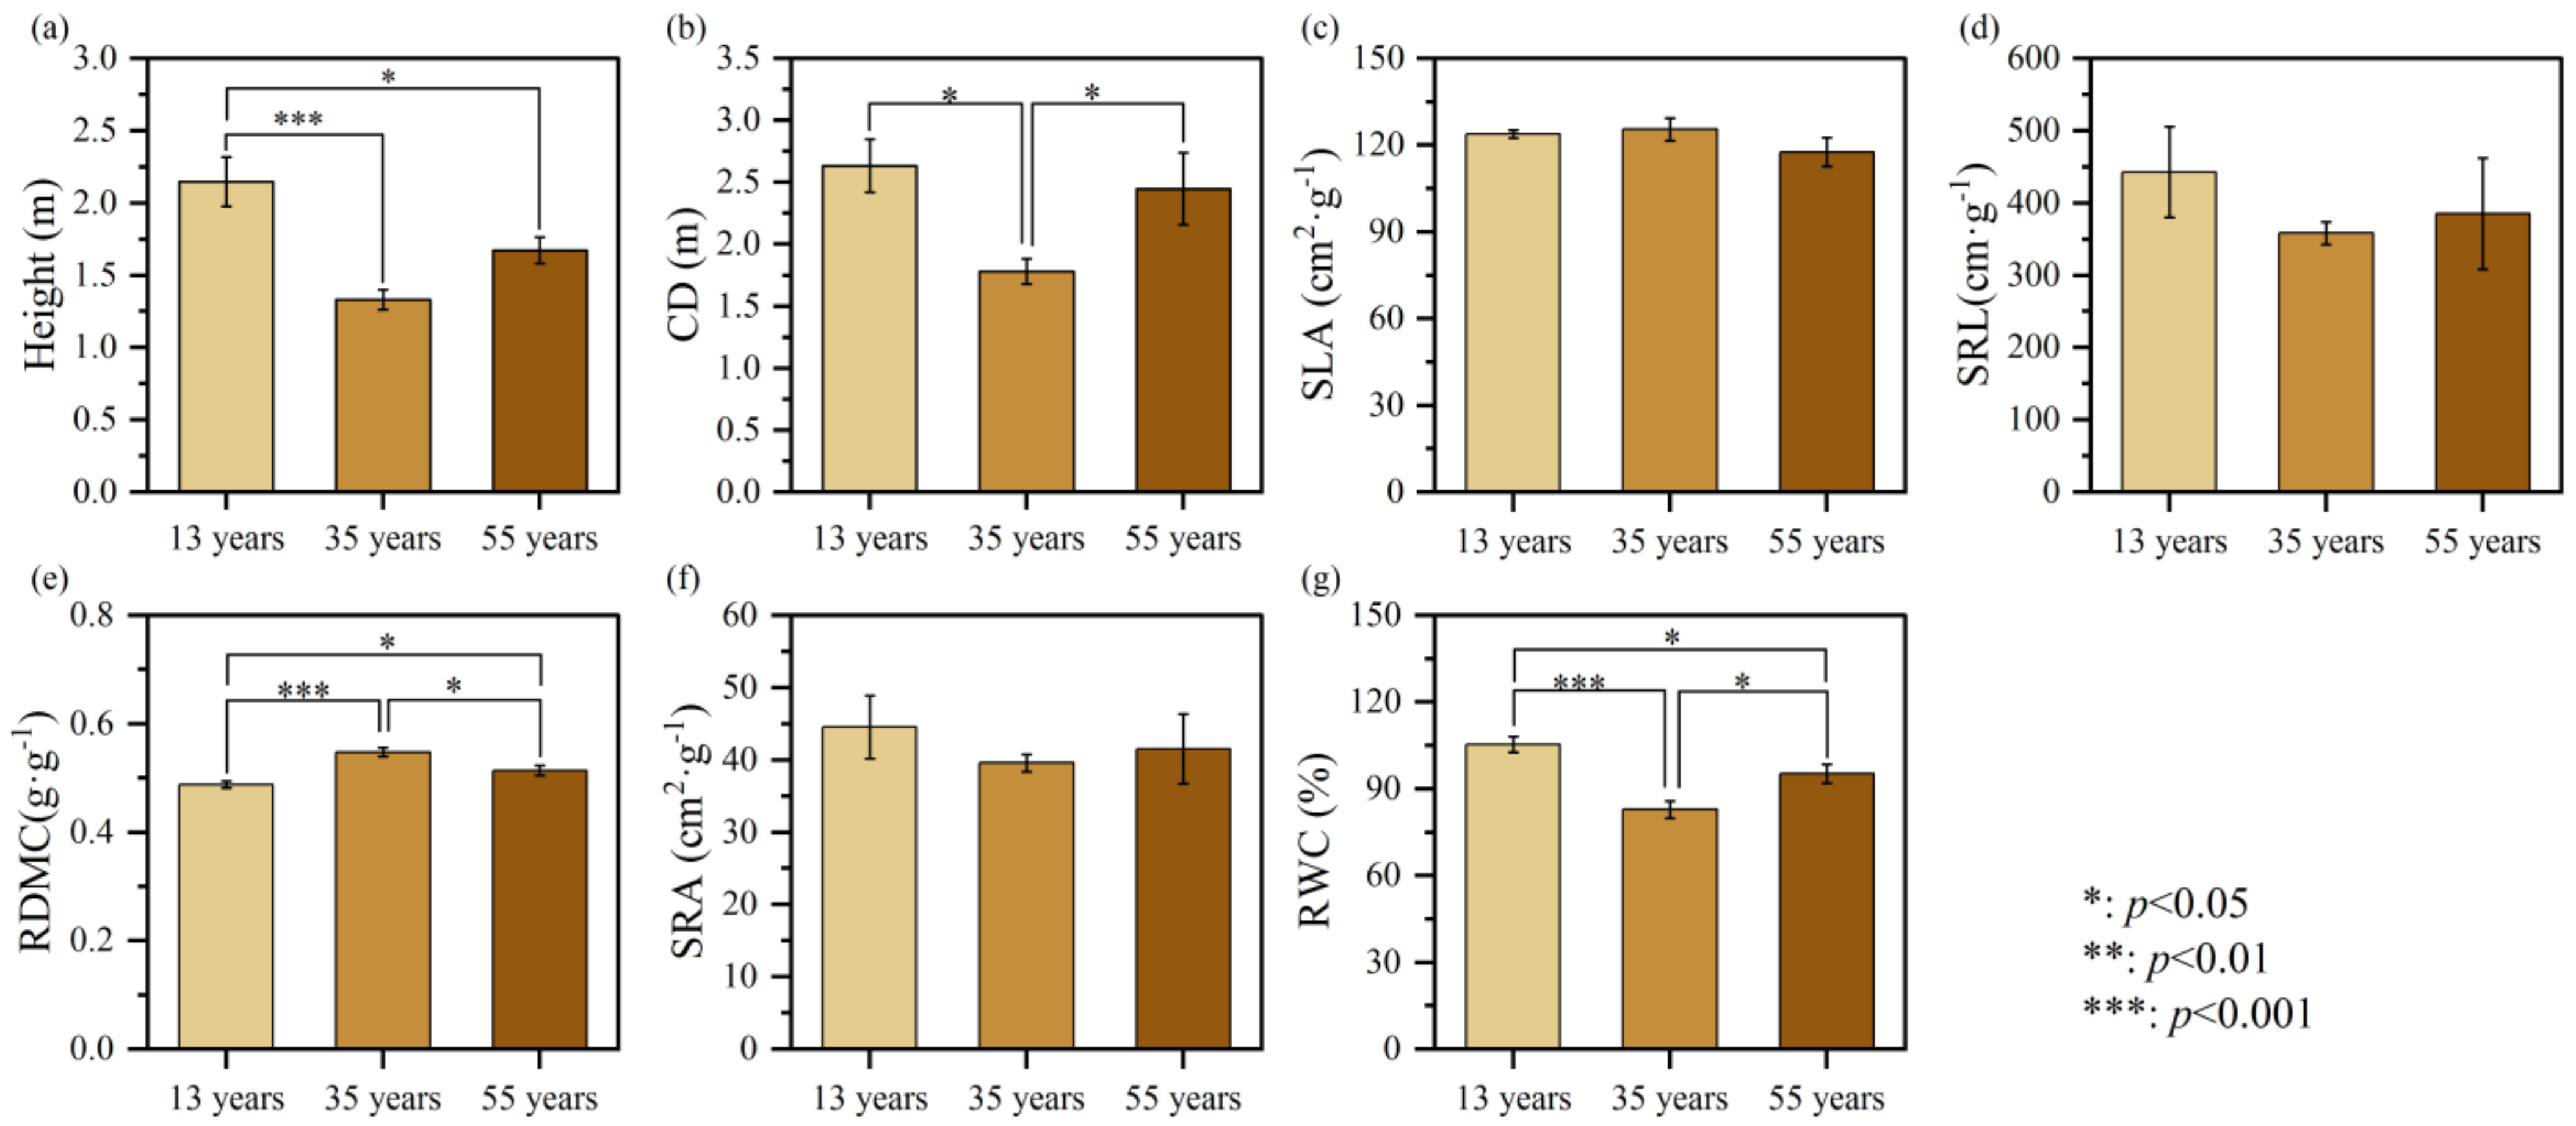
3.1. Vegetation, Leaf, and Root Characteristics

It was found that the vegetation, leaf, and root characteristics changed in a ‘V’ or inverted ‘V’ pattern with increasing afforestation years (Figure 2). Specifically, the height and CD of C. korshinskii showed a significant trend of decreasing first and then increasing. The height was significantly higher after 13 years (2.15 ± 0.17 m) of afforestation than 35 years (1.33 ± 0.06 m, p < 0.001) and 55 years (1.33 ± 0.06 m, p < 0.05) (Figure 2a). The CD was significantly higher after 13 years (2.63 ± 0.21 m) and 55 years (2.45 ± 0.29 m) of afforestation than 35 years (1.78 ± 0.10 m, p < 0.05) (Figure 2b). This indicated that the growth of C. korshinskii tended to get worse first and then better as the afforestation years increased. It was also found that the SLA showed an opposite trend to the height of C. korshinskii, but there was no statistically significant difference among the three afforestation years (Figure 2c), indicating that the degree of barrenness of the regional environment changed with an increase in afforestation years, but this change was not significant. The SRL and SRA showed the same trend as the height and CD (Figure 2d,f). The maximum values of SRL and SRA were found after 13 years, which were 442.73 ± 62.65 cm·g−1 and 44.55 ± 4.33 cm2·g−1, respectively, while their minimum values were found after 35 years, which were 358.16 ± 15.74 cm·g−1 and 39.59 ± 1.18 cm2·g−1, respectively. On the contrary, the RDMC was significantly different among the three afforestation years, with 35 years of RDMC (0.55 ± 0.01 g·g−1) being significantly higher than 13 years (0.51 ± 0.01 g·g−1, p < 0.05) and 55 years (0.49 ± 0.01 g·g−1, p < 0.001), and 55 years of RDMC was also significantly higher than 13 years (p < 0.05) (Figure 2e). The RWC also differed significantly among the three afforestation years, but this difference was in contrast to the trend for the RDMC.

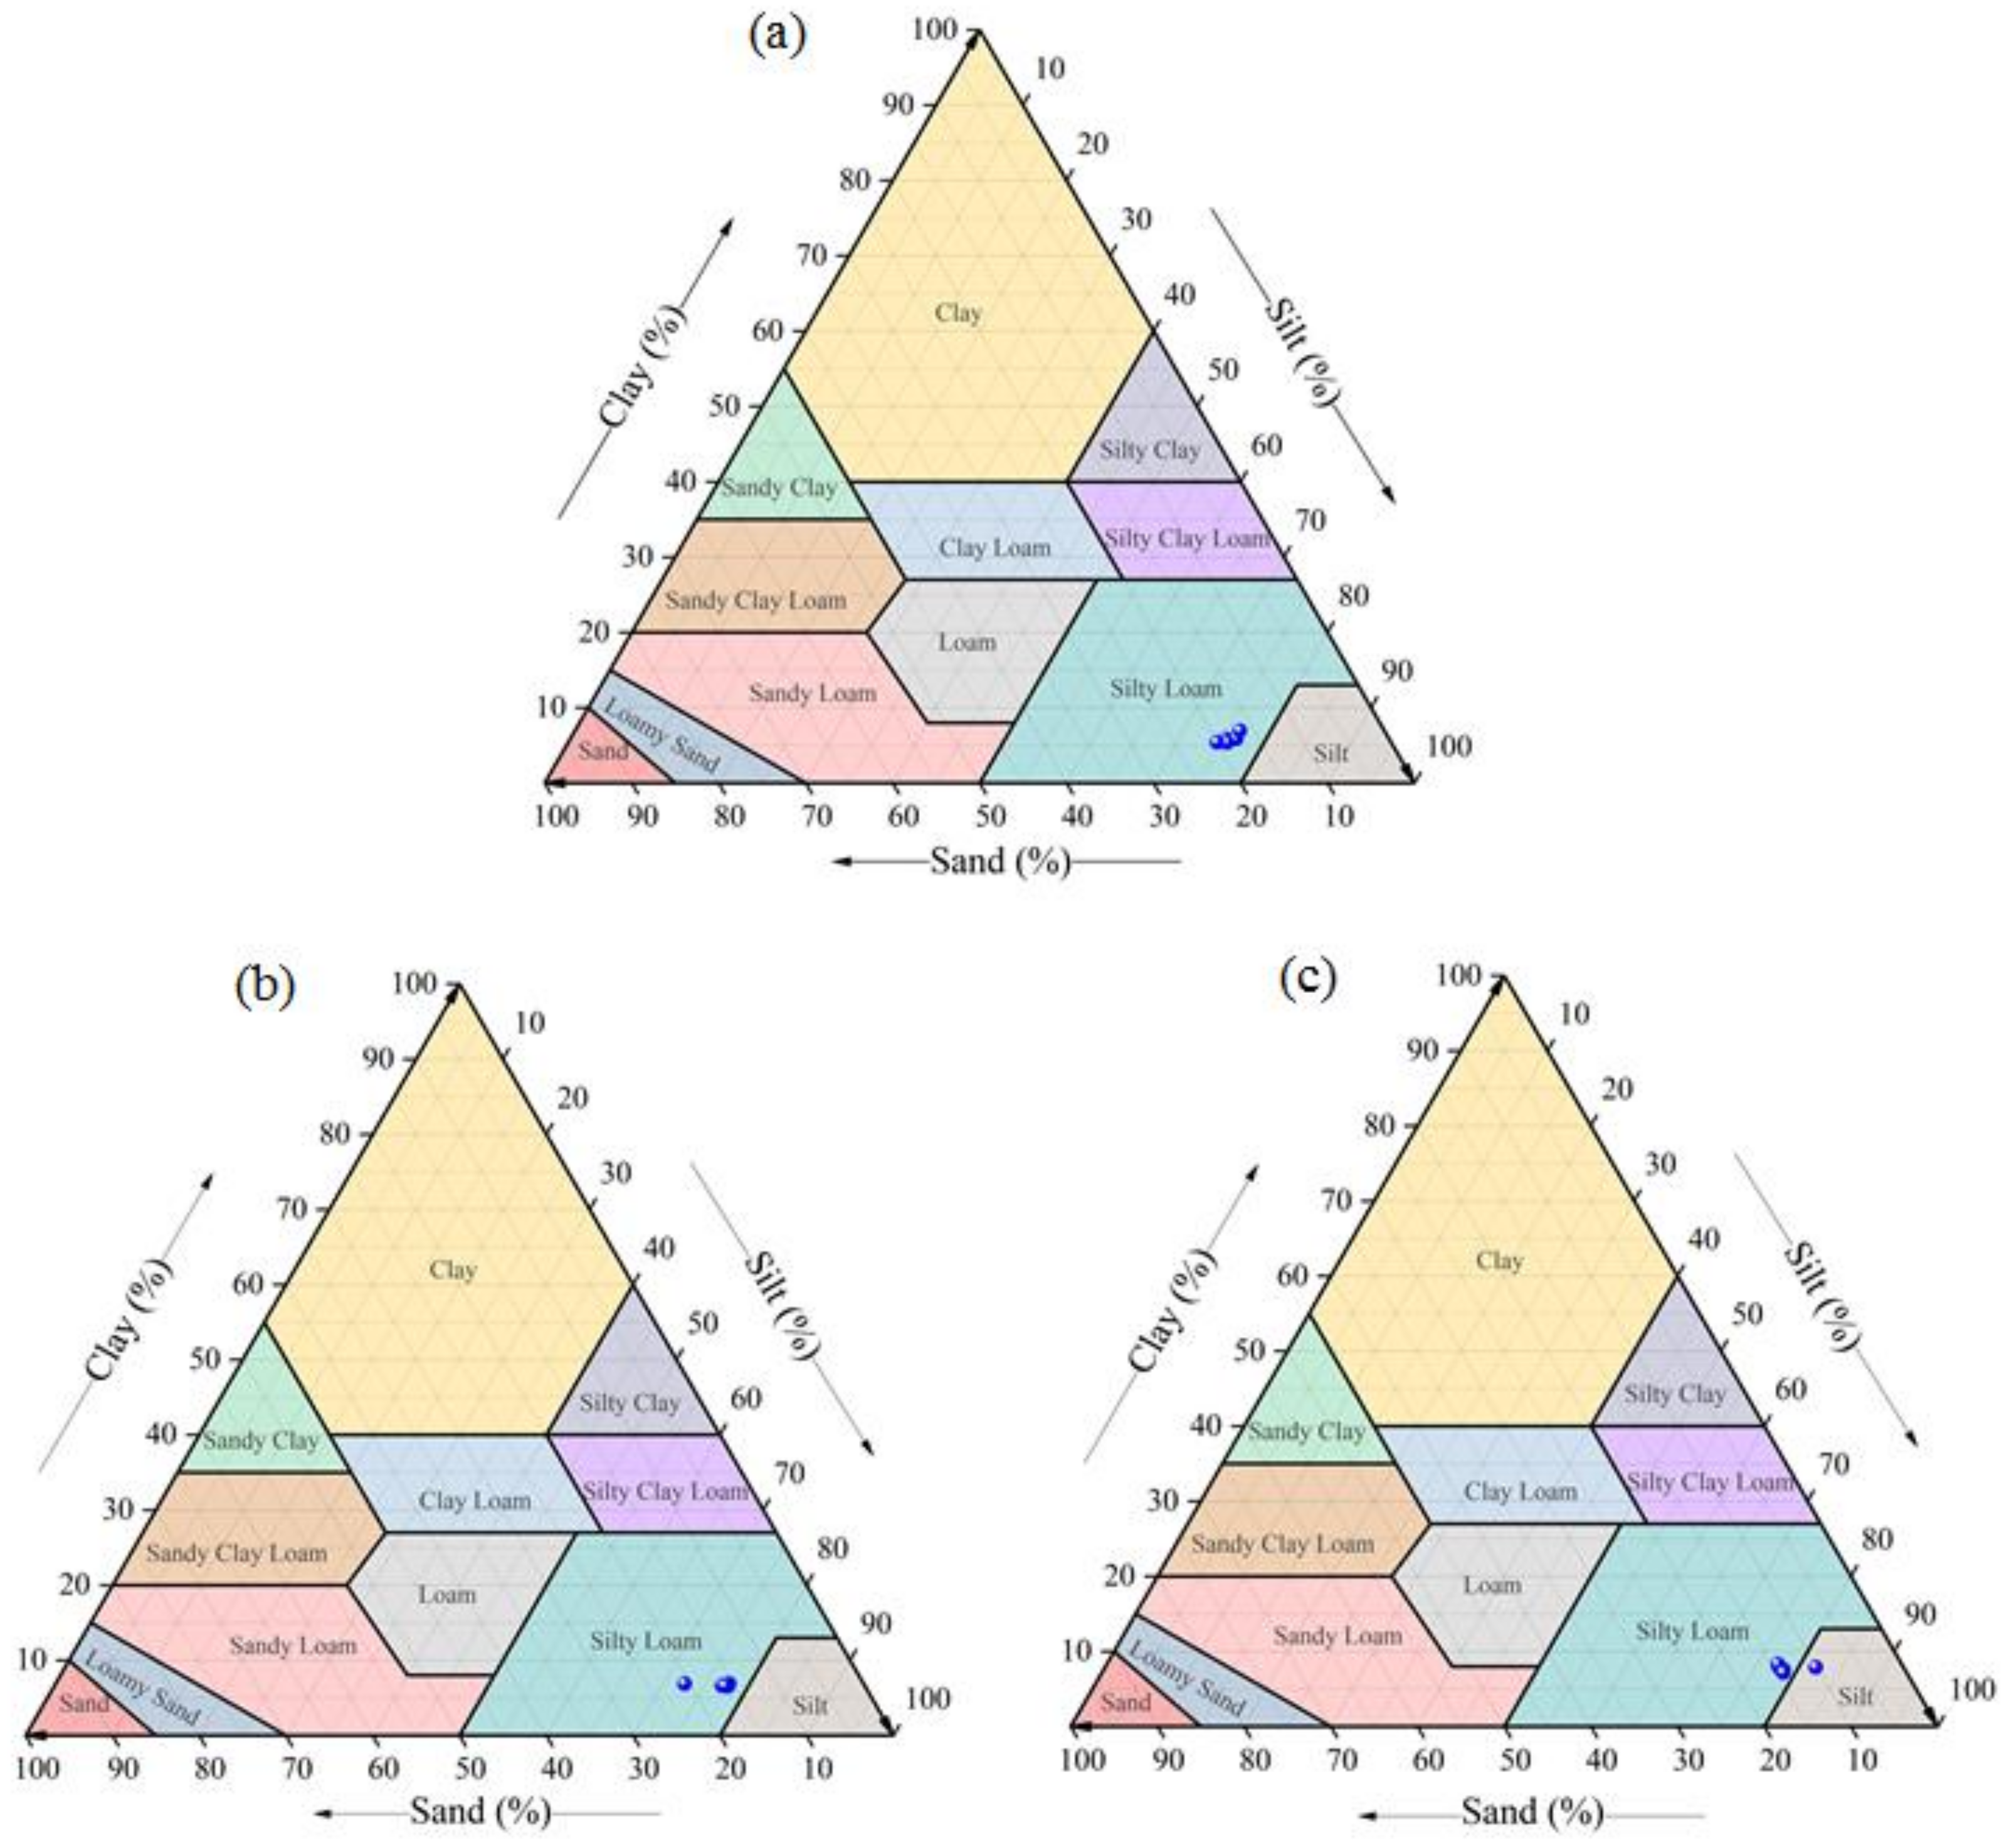
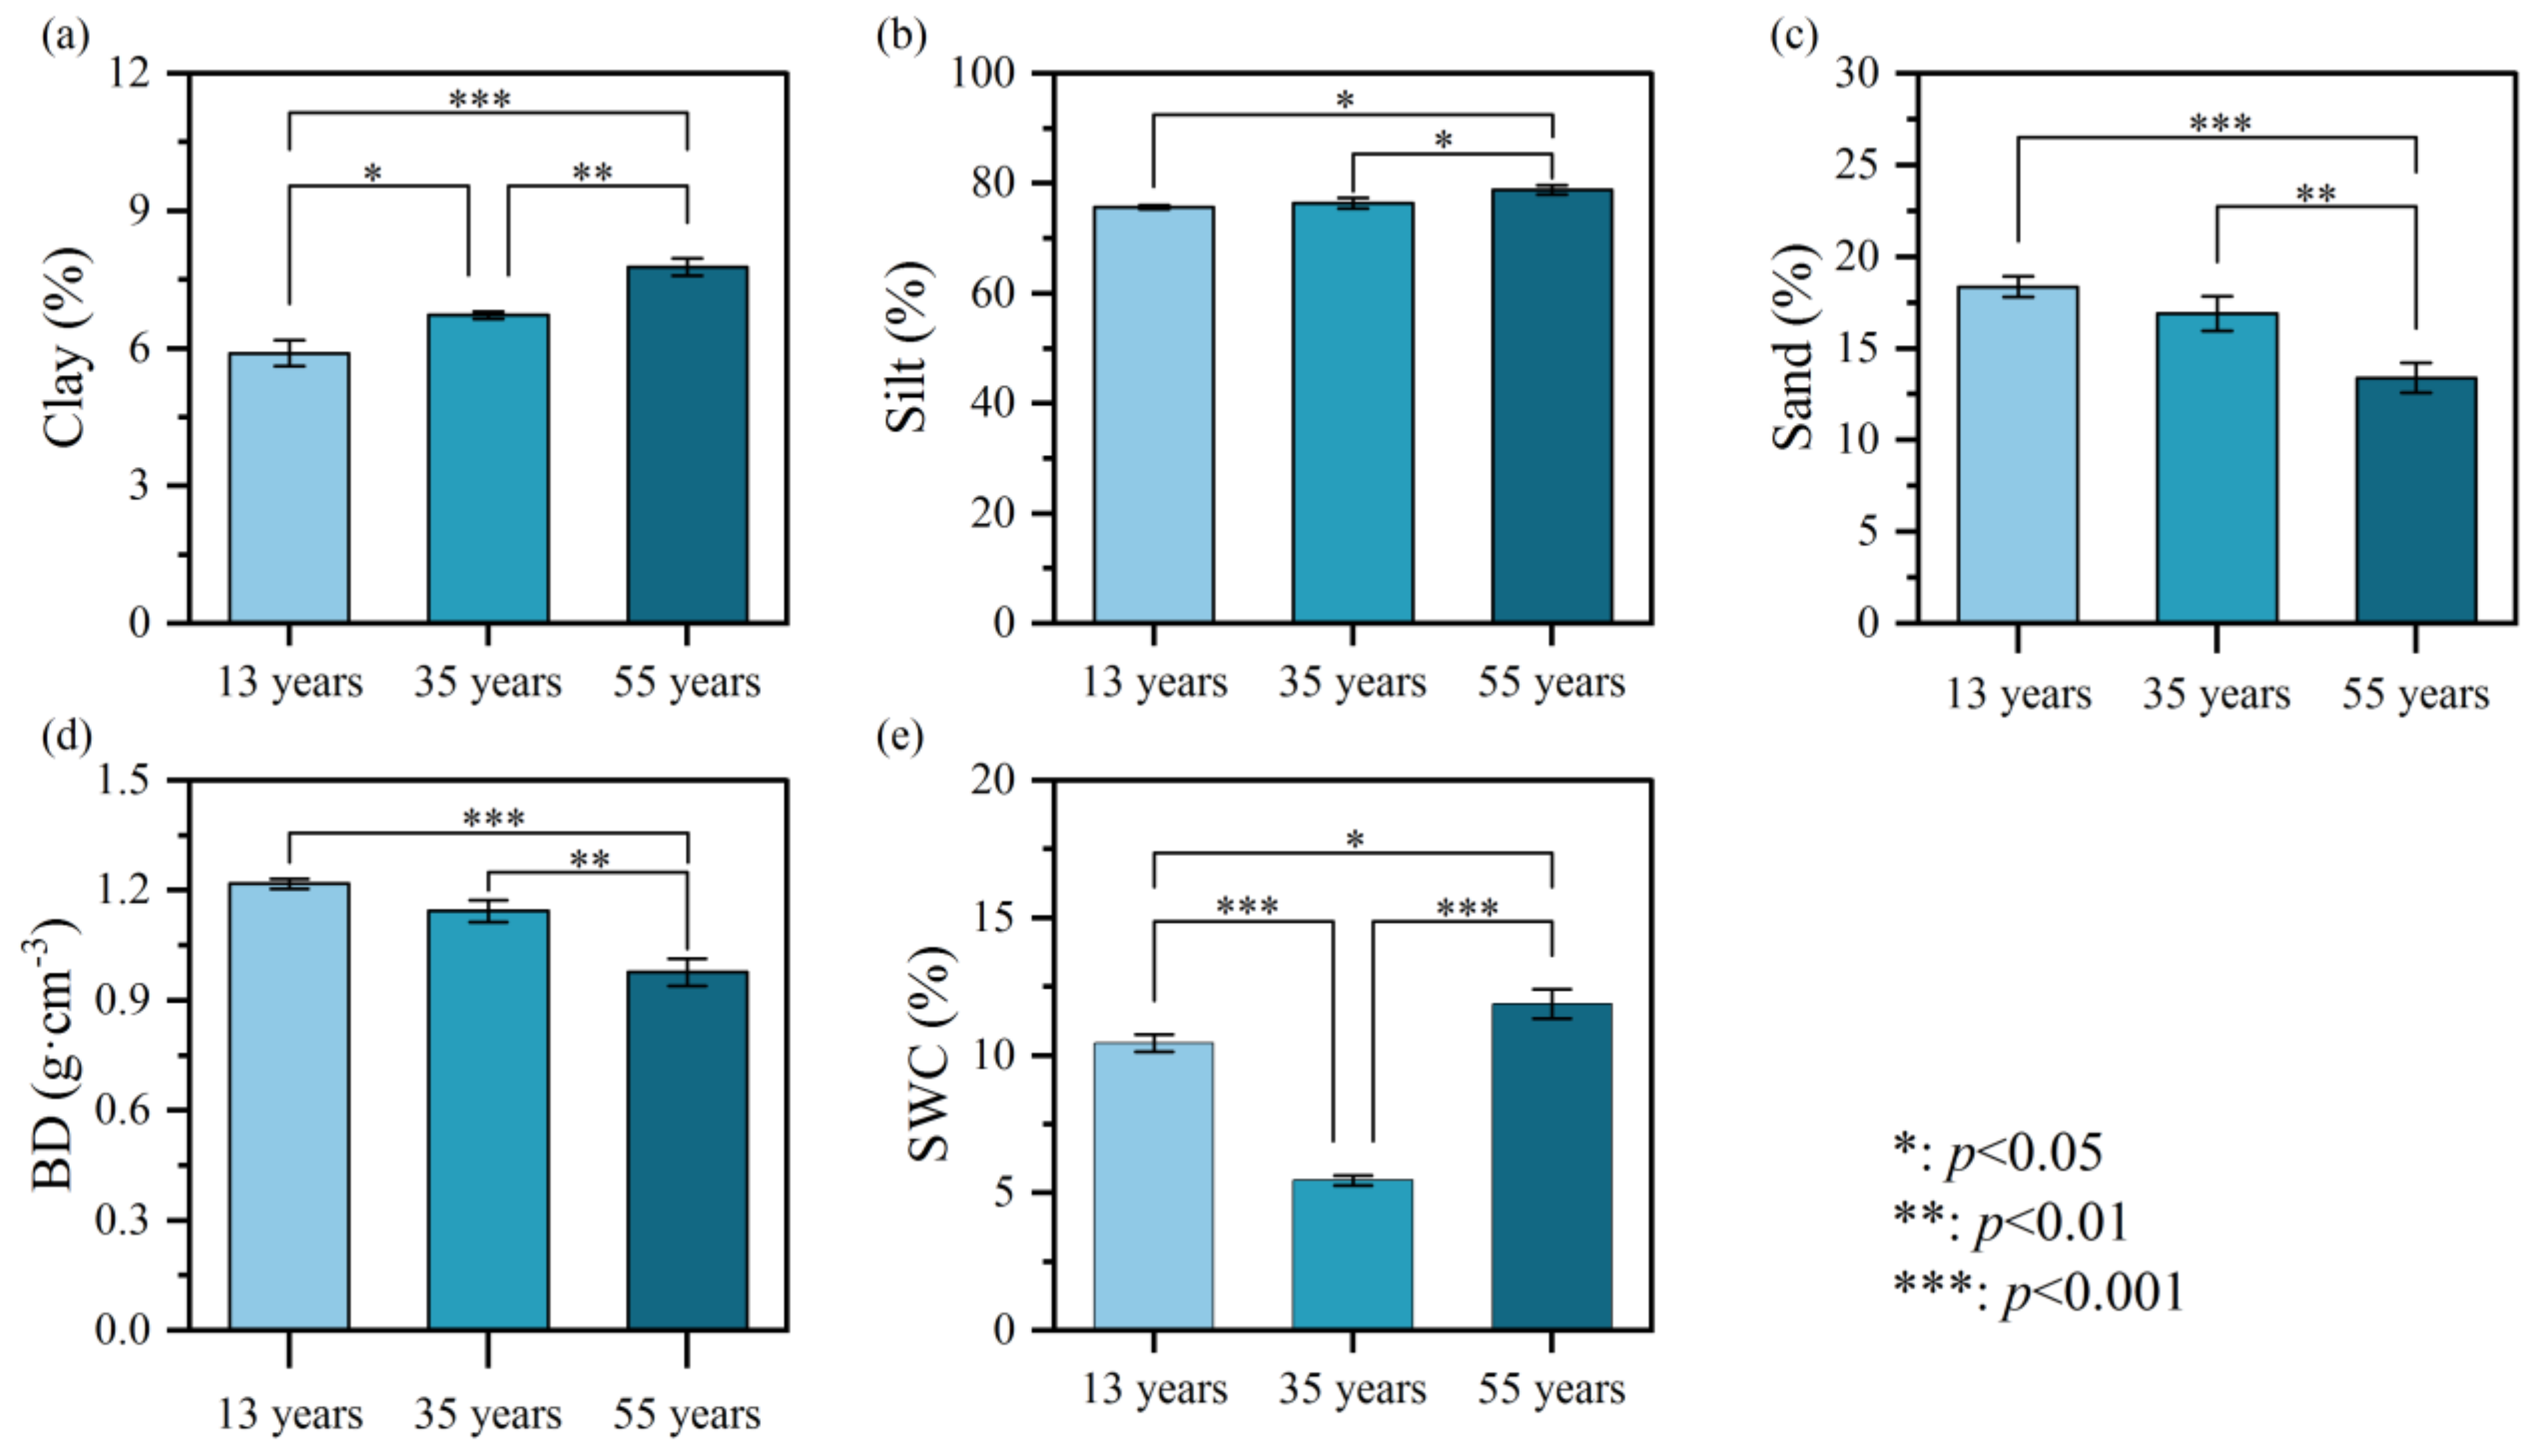
3.2. Soil Physical Properties

The soil texture of C. korshinskii was mainly silty loam and gradually tended to the change from silty loam to silt as the afforestation years increased (Figure 3). It was found that the clay and silt content increased significantly with increasing afforestation years, while the sand content decreased significantly (Figure 4). Specifically, the clay content after 55 years reached 7.77 ± 0.19%, which was significantly higher than after 35 years (6.73 ± 0.08%, p < 0.01) and 13 years (5.90 ± 0.28%, p < 0.001), and the clay contents after 35 years was also significantly higher than that after 13 years (p < 0.05) (Figure 4a). Likewise, the silt content after 55 years reached 78.83 ± 0.81%, which was significantly higher than after 35 years (76.38 ± 0.98%, p < 0.05) and 13 years (75.73 ± 0.36%, p < 0.05) (Figure 4b), while there was no significant difference in the silt content between 35 years and 13 years. Conversely, the sand content after 13 years, 35 years and 55 years was 18.37 ± 0.58%, 16.89 ± 0.94%, and 13.39 ± 0.82%, respectively, and the sand content after 55 years was significantly lower than after 13 years (p < 0.001) and 35 years (p < 0.01) (Figure 4c). Generally speaking, soil texture is difficult to change. If there are changes, it may be due to the effects of site and/or forest maturity.
We also analyzed the trends in BD and SWC of the three afforestation years and found that their trends were different (Figure 4). Specifically, the BD gradually decreased with increasing afforestation years, and the BD after 55 years (0.98 ± 0.04) was significantly smaller than after 35 years (1.14 ± 0.03, p < 0.01) and 13 years (1.22 ± 0.01, p < 0.001) (Figure 4d). The SWC tended to decrease first and then increase as the afforestation years increased, with the SWC after 55 years (11.87 ± 0.53%) being significantly higher than after 35 years (5.46 ± 0.19%, p < 0.001) and 13 years (10.44 ± 0.32%, p < 0.05), and the SWC after 13 years was significantly higher than after 35 years (p < 0.001) (Figure 4e).

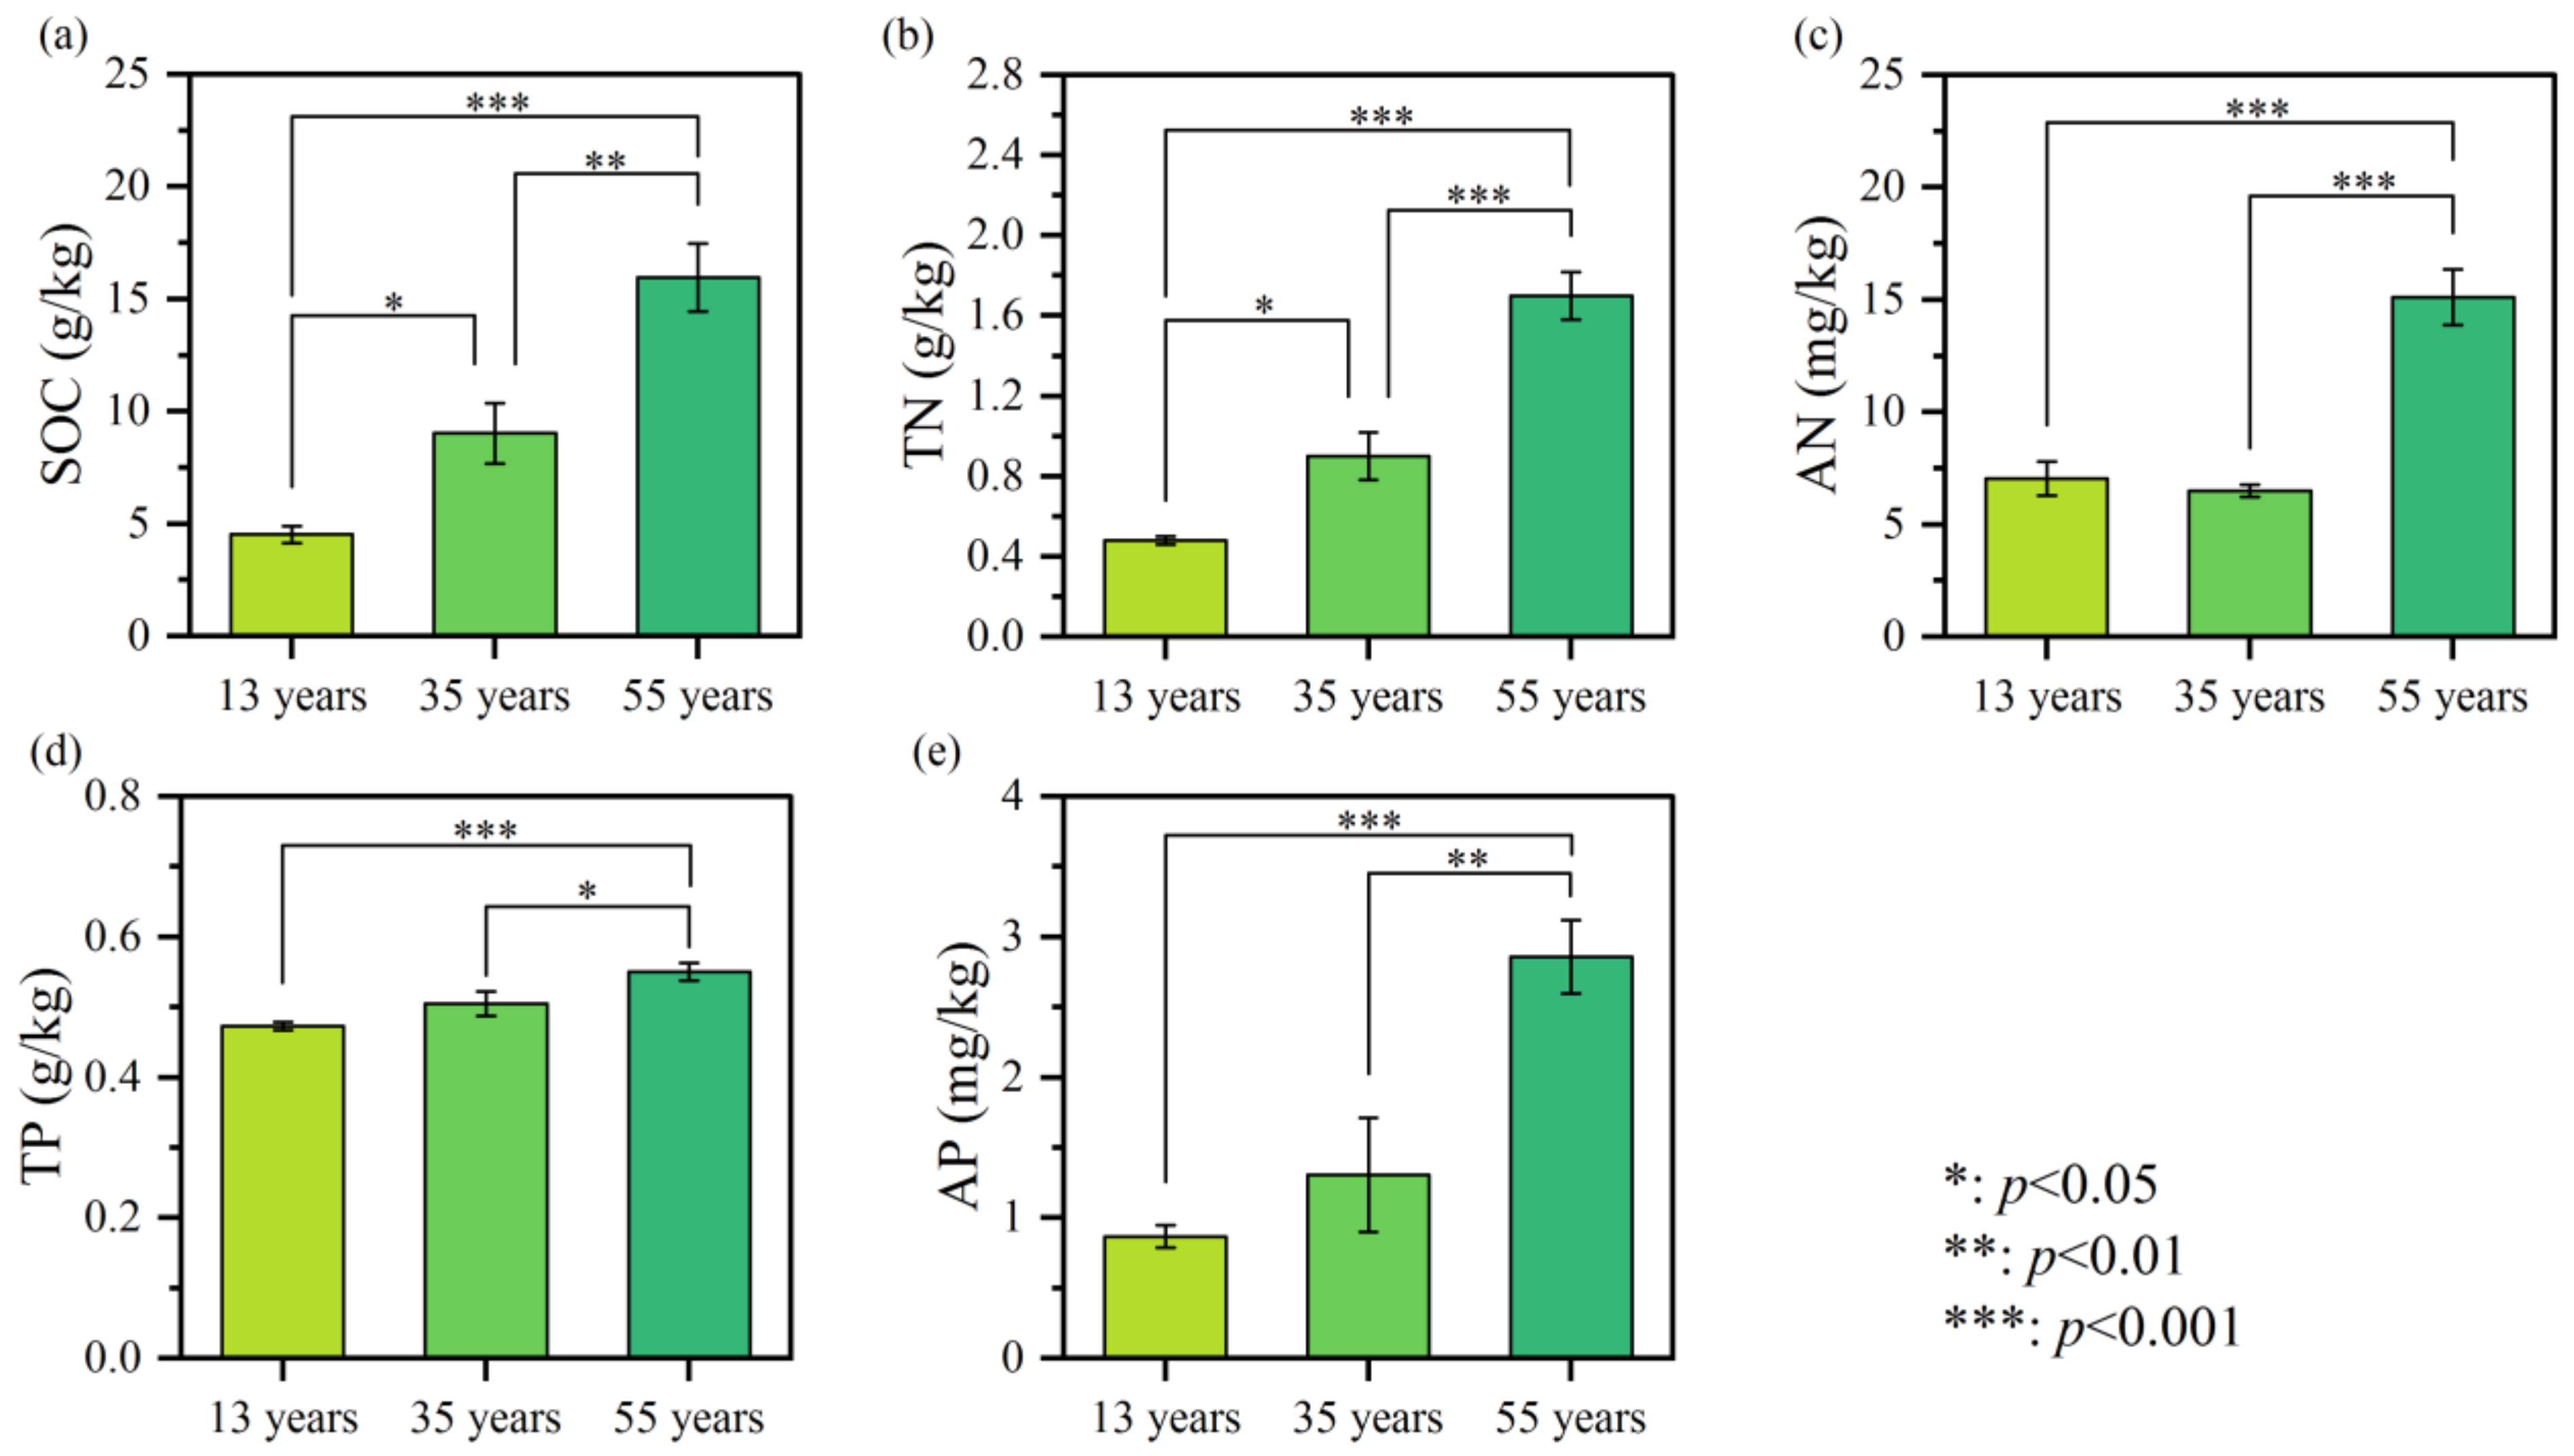
3.3. Soil Chemical Properties

As shown in Figure 5, soil chemical properties increase significantly to varying degrees as afforestation years increase, except for soil AN. The SOC after 55 years (15.96 ± 1.51 g·kg−1) was significantly higher than after 35 years (9.03 ± 1.34 g·kg−1, p < 0.01) and 13 years (4.53 ± 0.85 g·kg−1, p < 0.001), with the value after 35 years also being higher than after 13 years (p < 0.05) (Figure 5a). TN showed a trend consistent with SOC (Figure 5b), and the TN after 55 years, 35 years, and 13 years was 1.70 ± 0.12 g·kg−1, 0.90 ± 0.12 g·kg−1, and 0.48 ± 0.02 g·kg−1, respectively. Compared to SOC and TN, AN decreased first and then increased with increasing afforestation years, and the AN after 55 years (15.12 ± 2.75 mg·kg−1) was significantly higher than after 13 years (7.04 ± 1.70 mg·kg−1) and 35 years (6.49 ± 0.61 mg·kg−1) (p < 0.001). The highest TP and AP were observed after 55 years, which were significantly higher than after 35 years (p < 0.01 or 0.05) and 13 years (p < 0.001). It could be seen from the above results that afforestation for a longer time had a stronger positive impact on soil chemical properties. Certainly, the variation in TP was also influenced by the site effect.

3.4. Soil Quality Index

Three principal components were extracted to evaluate soil quality based on the principle of the characteristic roots having value greater than 1 (Table S1). The selection of the indicators in the three principal components was based on the magnitude of the coefficients of the principal component matrix of soil properties (Table S2). According to the coefficients >0.70, clay, sand, BD, SOC, TN, AN, TP, and AP were screened for the first principal component. Similarly, the second principal component covered silt, and the third principal component was SWC. On this basis, the indicators with an absolute value of correlation coefficient less than 0.75 were retained (Figure S1). Considering that the sample plots were selected to avoid site effects as much as possible, a soil quality evaluation dataset was constructed using TN, TP, silt, and SWC. In addition, the weights of the first, second, and third principal components were calculated using the contribution of each principal component (Table S3). SQI were calculated by the weight values of the principal components and the normalized scores of soil properties for the three afforestation years of C. korshinskii. As shown in Figure 6, the SQI after 55 years (0.77 ± 0.05) was significantly larger than that after 35 years (0.34 ± 0.04, p < 0.001) and after 13 years (0.20 ± 0.02, p < 0.001), with the SQI after 35 years being also higher than that after 13 years (p < 0.05). This indicated that the soil quality of the study area gradually improved with increasing afforestation years, and the longer the afforestation years, the more obvious the improvement in soil quality.

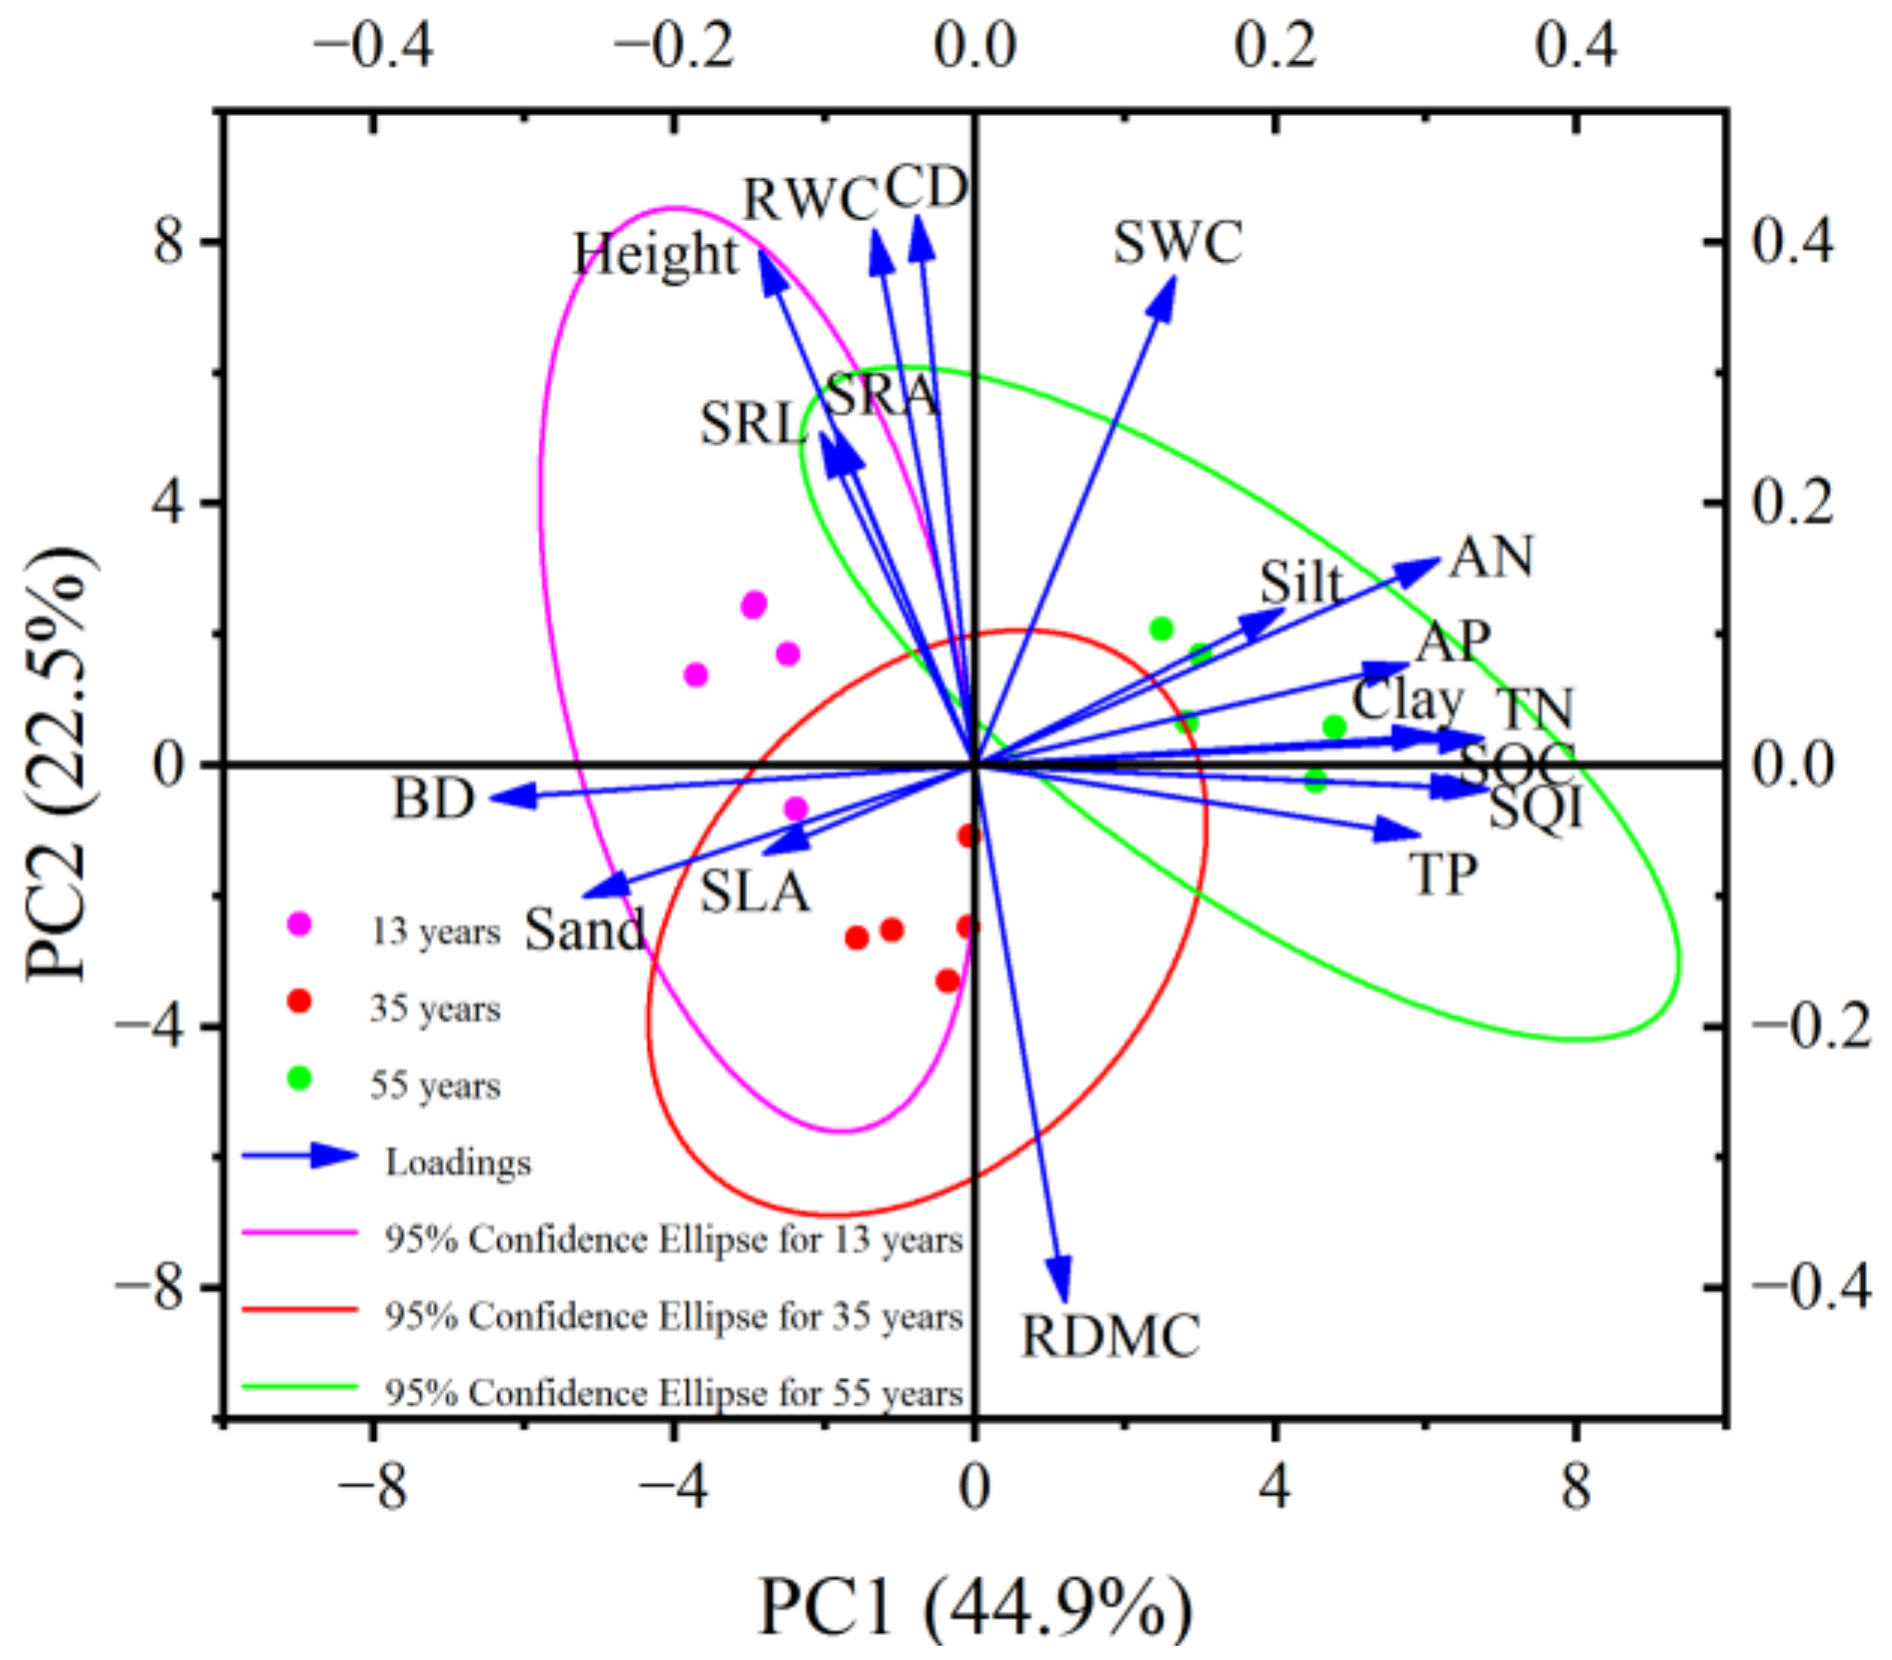
3.5. Principal Component Analysis

The results of the principal component analysis (PCA) of soil properties, vegetation characteristics, root characteristics, and SQI are shown in Figure 7. Factor 1 explains 44.9% of the variance, and factor 2 explains 22.5%, reaching 67.4% in total. The relationship between soil properties, vegetation characteristics, SLA, root characteristics, and SQI changes among the three afforestation years. The process has a clear pattern of differentiation in soil properties, vegetation characteristics, SLA, and root characteristics. As afforestation years increase, the confidence ellipse of the distribution of the three afforestation years gradually separates and shows a leftward trend, and this pattern of divergence is particularly evident after 55 years. The correlation between SQI and vegetation or root characteristics weaken with an increase in afforestation years. SQI is significantly positively related to clay, silt, SOC, TN, AN, TP, and AP, while it is significantly negatively correlated with SLA, sand, and BD.

4. Discussion

4.1. Effects of Afforestation Years on Vegetation and Root Characteristics

It was found that the vegetation and root characteristics of C. korshinskii plantations did not change linearly with increasing afforestation years; instead, they showed a “V” or inverted “V” shape. This trend was particularly evident in the height, CD, RDMC, and RWC of C. korshinskii. We speculated that the differences in soil nutrient use strategies among the different years of C. korshinskii were responsible for this result. At the same time, some studies suggested that a change in nutrient utilization strategy was actually due to a change in the capacity of soil water supply [2]. Chen et al. [24] also found that water absorbed by C. korshinskii was mainly from 0 to 20 cm depth in May–July and from 20 to 80 cm depth in September. This indicated that C. korshinskii mainly consumed shallow soil moisture, which was generally replenished by precipitation. However, with increasing afforestation years, precipitation was unable to meet the demand for soil moisture in C. korshinskii, which caused soil moisture deficit and inhibited the normal growth and development of C. korshinskii [25]. This was supported by our results, which showed a reduction in height, CD, and RWC after 35 years compared to 13 years and a relative increase in RDMC. In the case of persistent water deficit, soil moisture would be replenished from the deeper layers to the top for a new equilibrium [19]. The growth of C. korshinskii was gradually improved, as evidenced by the increase in height, CD, and RWC after 55 years compared to after 35 years and the reduction in RDMC.

4.2. Effects of Afforestation Years on Soil Physical Properties

In general, afforestation can effectively inhibit soil degradation and improve soil texture composition [26]. It was found that as afforestation years increased, soil texture type tended to change from silty loam soil to silt soil because of a significant increase in soil clay and silt contents and a significant decrease in soil sand contents. The reason for this was that afforestation provided more roots to the soil system, which was consistent with previous works [27,28,29]. On the one hand, these roots provided the exudate that was conductive to the formation of clay and silt [30] and improved soil infiltration properties [19]. On the other hand, more roots increased soil cohesion and reduced the transport of soil particles and the sand content, resulting in a change in soil texture from coarse to fine [2]. Additionally, litter and dead roots can be detrimental to sand formation and promote the formation of silt and clay [31]. Meanwhile, the original difference in soil texture between different sites might also contribute to this finding, which needs further study. BD gradually decreased with increasing afforestation years, while SWC first decreased and then increased, and their trends were inconsistent. This was because the decomposition of tree litter by microbes increased soil organic matter (SOM), and higher SOM increased soil infiltration properties, thereby reducing BD [32]. In addition, although increasing the availability of clay and silt particles could improve soil water storage [33], the stored water was mainly from precipitation, and its supply was limited. With an increase in afforestation years and areas, the demand for SWC for tree growth gradually increased, leading to water deficit; thus, SWC decreased and tree height became shorter. As this trend increased further, the deep soil water and groundwater replenished the shallow soil to reach a new equilibrium state, which was accompanied by an increasing trend in SWC [19].

4.3. Effects of Afforestation Years on Soil Chemical Properties

Except for AN, soil chemical properties showed a regular increase with increasing afforestation years compared to vegetation, leaf, root, and soil physical characteristics, although the magnitude of the increase varied, which was in agreement with previous studies [18,34,35,36]. This was because afforestation significantly increased the input of tree litter [37]. Secondly, as afforestation years increased, the fine root system of C. korshinskii became more developed. Fine roots can consume photosynthetic products through respiration [38] and input organic matter into soil, which significantly increases soil TN and AN through the input of SOM and its mineralization [2]. AN can be consumed by the growth of C. korshinskii, which is why the increase rate of AN is less than that of TN [2]. Contrary to the results of Deng et al. [39], we found that an increase in afforestation years contributed to an increase in soil TP and AP. This might be because the warm climate in the region promoted microbial phosphorus mineralization and increased the availability of phosphorus. Soil texture was also the main factor that mediated phosphorus chemisorption. Soil clay and silt provided more phosphorus binding sites compared to sand [40]. In addition, reduced precipitation in arid climates leads to reduced TP consumption and leaching [41]. As the afforestation years increased, the soil clay and silt contents increased, which ultimately increased soil TP.

4.4. Effects of Afforestation Years on Soil Quality

This study found that afforestation significantly improved the regional SQI, and the improvement in SQI became more pronounced as the afforestation years increased, which was consistent with previous studies in other areas [2,42,43,44,45]. Soil clay, silt, SOC, TN, TP, AN, and AP gradually increased, and BD gradually decreased with an increase in afforestation years. The reason for this was that soil silt, TN, and TP were the decisive factors affecting the SQI, and although SWC also had an important effect, its weighting was smaller than that of TN and TP.

4.5. Relations between Vegetation, Soil Properties, and Quality

It was found that there was a clear pattern of differentiation in soil properties among different afforestation years. The relationship between SQI and soil properties also changed slightly, which confirmed the different effects of different afforestation years on soil properties and SQI. In this study, SQI had significant positive correlations with clay, silt, SOC, TN, AN, TP, and AP, and significant negative correlations with SLA, sand, and BD; these results were similar to the results of previous studies [2,46]. This was because the roots of C. korshinskii became more developed with increasing afforestation years, and although this process was influenced by SWC, it provided more exudates, promoting the formation of clay and silt and reducing the content of sand [30]. Meanwhile, a good soil environment can provide plants with more nutrients [47], as shown by the higher available nutrients. In this study, they were soil AN and AP, which significantly increased with increasing afforestation years. Similarly, TN and TP, as the key soil properties for assessing regional soil quality, could represent the regional soil quality to a certain extent [2], and BD represented the degree of compaction of soil [48]. In general, the larger the soil BD, the lower the soil quality, which will be detrimental to plant growth and nutrient cycling [49].

5. Conclusions

This study analyzed the characteristics of vegetation, leaf, root, and soil quality and properties in different afforestation years. The results of this study showed that vegetation and root characteristics of C. korshinskii showed a “V” or inverted “V” pattern with increasing afforestation years, in which height, CD, and RWC showed a significant trend of “first decreasing and then increasing”, while RDMC showed a significant trend of first increasing and then decreasing. In terms of soil physical characteristics, the soil texture type of C. korshinskii undergrowth gradually changed from silty loam soil to silt soil with increasing afforestation years. Among the properties, clay and silt contents were ranked from largest to smallest as 55 years > 35 years > 13 years, with the opposite being observed for sand grains and BD. SWC tended to show the “decreasing first and then increasing” trend with increasing afforestation years. In terms of soil chemical characteristics, SOC, TN, TP, and AP changed in the descending order of 55 years > 35 years > 13 years, while AN changed in the descending order of 55 years > 13 years > 35 years. Meanwhile, the descending order of SQI was 55 years (0.77 ± 0.05) > 35 years (0.34 ± 0.04) > 13 years (0.20 ± 0.02). This study proved that afforestation significantly improved regional soil properties and quality, and the longer the afforestation years, the more significant the improvement in soil properties and quality, which was significantly affected by SLA. In addition, although the site effect was minimized in this study, the impacts of site effect on forest development might still exist. Therefore, the implications of different afforestation years on soil quality under the influence of site effect need to be further clarified in subsequent studies.

Supplementary Materials

The following supporting information can be downloaded at https://www.mdpi.com/article/10.3390/f14020329/s1, Figure S1: Correlation between vegetation, root, and soil physical and soil chemical characteristics; Table S1: Contribution rate and cumulative contribution rate of each principal component; Table S2: Principal component coefficient matrix for soil properties; Table S3: The weight of different soil properties.

Author Contributions

Conceptualization, W.Y. and F.N.; methodology, F.N.; software, F.N.; validation, W.Y. and Y.L. (Yage Li); formal analysis, F.N.; investigation, W.Y. and Y.L. (Yage Li); resources, C.Z.; data curation, Y.L. (Yuchen Li); writing—original draft preparation, F.N.; writing—review and editing, C.Z.; visualization, F.N.; supervision, P.L.; project administration, C.Z.; funding acquisition, C.Z. All authors have read and agreed to the published version of the manuscript.

Funding

This research was funded by National Natural Science Foundation of China (NSFC), grant number 32125028 and 32192431; the Second Tibetan Plateau Scientific Expedition and Research Program (STEP), grant number 2019QZKK0301; and the Science and Technology Planning Project of Gansu Province, grant number 18JR2RA009.

Institutional Review Board Statement

Not applicable.

Informed Consent Statement

Not applicable.

Data Availability Statement

The data included in this study are available from the corresponding author upon request.

Acknowledgments

We are grateful to the staff at the Lanzhou University and the Northwest Institute of Eco-Environment and Resources (CAS) for providing experimental facilities and guidance.

Conflicts of Interest

The authors declare no conflict of interest and personal relationships that could have influenced the work reported in this paper.

References

  1. Orwin, K.H.; Stevenson, B.A.; Smaill, S.J.; Kirschbaum, M.U.; Dickie, I.A.; Clothier, B.E.; Garrett, L.G.; van der Weerden, T.J.; Beare, M.H.; Curtin, D.; et al. Effects of climate change on the delivery of soil-mediated ecosystem services within the primary sector in temperate ecosystems: A review and New Zealand case study. Glob. Change Biol. 2015, 21, 2844–2860. [Google Scholar] [CrossRef] [PubMed]
  2. Wang, J.; Zhao, W.; Wang, G.; Yang, S.; Pereira, P. Effects of long-term afforestation and natural grassland recovery on soil properties and quality in Loess Plateau (China). Sci. Total Environ. 2021, 770, 144833. [Google Scholar] [CrossRef] [PubMed]
  3. Xue, J.; Li, Z.; Feng, Q.; Gui, J.; Zhang, B. Spatiotemporal variations of water conservation and its influencing factors in ecological barrier region, Qinghai-Tibet Plateau. J. Hydrol. Reg. Stud. 2022, 42, 101164. [Google Scholar] [CrossRef]
  4. Bastida, F.; Zsolnay, A.; Hernandez, T.; Garcia, C. Past, present and future of soil quality indices; a biological perspective. Geoderma 2008, 147, 159–171. [Google Scholar] [CrossRef]
  5. Hofman, J.; Dušek, L. Biochemical analysis of soil organic matter and microbial biomass composition—A pilot study. Eur. J. Soil Biol. 2003, 39, 217–224. [Google Scholar] [CrossRef]
  6. John, R.; Dalling, J.W.; Harms, K.E.; Yavitt, J.B.; Stallard, R.F.; Mirabello, M.; Hubbell, S.P.; Valencia, R.; Navarrete, H.; Vallejo, M.; et al. Soil nutrients influence spatial distributions of tropical tree species. Proc. Natl. Acad. Sci. USA. 2007, 104, 864–869. [Google Scholar] [CrossRef]
  7. Zhang, H.L. Soil quality and sustainable of soil management. J. Soil Water. Conserv. 2002, 16, 119–122. [Google Scholar] [CrossRef]
  8. Karlen, D.L.; Ditzler, C.A.; Andrews, S.S.; Sposito, G.; Zabel, A. Soil quality; why and how? Geoderma 2003, 114, 145–156. [Google Scholar] [CrossRef]
  9. Cao, Q.Q. The evolution of soil properties and its influencing factors during the oasis-making processes in the northeastern part of Ulanbuh desert. Ph.D. Thesis, Beijing Forestry University, Beijing, China, 2021; pp. 1–148. (In Chinese). [Google Scholar] [CrossRef]
  10. Karlen, D.L.; Wollenhaupt, N.C.; Erbach, D.C.; Berry, E.C.; Swan, J.B.; Eash, N.S.; Jordahl, J.L. Crop residue effects on soil quality following 10-years of no-till corn. Soil Till. Res. 1994, 31, 149–167. [Google Scholar] [CrossRef]
  11. Mairura, F.S.; Mugendi, D.N.; Mwanje, J.I.; Ramisch, J.J.; Mbugua, P.K.; Chianu, J.N. Integrating scientific and farmers’ evaluation of soil quality indicators in central Kenya. Geoderma 2007, 139, 134–143. [Google Scholar] [CrossRef]
  12. Stavi, I.; Barkai, D.; Islam, K.R.; Zaady, E. No adverse effect of moderate stubble grazing on soil quality and organic carbon pool in dryland wheat agro-ecosystems. Agron. Sustain. Dev. 2015, 35, 1117–1125. [Google Scholar] [CrossRef]
  13. Mishra, G.; Marzaioli, R.; Giri, K.; Borah, R.; Dutta, A. Soil quality assessment under shifting cultivation and forests in North Eastern Himalaya of India. Arch. Agron. Soil. Sci. 2017, 63, 1355–1368. [Google Scholar] [CrossRef]
  14. Koga, N.; Shimoda, S.; Shirato, Y.; Kusaba, T.; Shima, T.; Niimi, H.; Yamane, T.; Wakabayashi, K.; Niwa, K.; Kohyama, K.; et al. Assessing changes in soil carbon stocks after land use conversion from forest land to agricultural land in Japan. Geoderma 2020, 377, 114487. [Google Scholar] [CrossRef]
  15. Hyun, J.; Kim, Y.J.; Kim, A.; Plante, A.F.; Yoo, G. Ecosystem services-based soil quality index tailored to the metropolitan environment for soil assessment and management. Sci. Total Environ. 2022, 820, 153301. [Google Scholar] [CrossRef]
  16. Jiao, J.; Zhang, Z.; Bai, W.; Jia, Y.; Wang, N. Assessing the Ecological Success of Restoration by Afforestation on the Chinese Loess Plateau. Restor. Ecol. 2012, 20, 240–249. [Google Scholar] [CrossRef]
  17. Li, M.; Zhou, X.; Zhang, Q.; Cheng, X. Consequences of afforestation for soil nitrogen dynamics in central China. Agric. Ecosyst. Environ. 2014, 183, 40–46. [Google Scholar] [CrossRef]
  18. Shao, P.; Liang, C.; Lynch, L.; Xie, H.; Bao, X. Reforestation accelerates soil organic carbon accumulation: Evidence from microbial biomarkers. Soil Biol. Biochem. 2019, 131, 182–190. [Google Scholar] [CrossRef]
  19. Liang, H.; Xue, Y.; Li, Z.; Gao, G.; Liu, G. Afforestation may accelerate the depletion of deep soil moisture on the Loess Plateau: Evidence from a meta-analysis. Land Degrad. Dev. 2022, 33, 3829–3840. [Google Scholar] [CrossRef]
  20. Li, Y.; Han, C.; Dong, X.; Sun, S.; Zhao, C. Soil microbial communities of dryland legume plantations are more complex than non-legumes. Sci. Total Environ. 2022, 822, 153560. [Google Scholar] [CrossRef]
  21. Nan, F.; Li, Z.; Zhang, X.; Cui, Q.; Li, Y.; Yang, A.; Xiong, X. Spatial variation of ecological stoichiometry characteristics of hilly soil in Lanzhou section of Yellow River north shore. J. Desert. Res. 2022, 42, 187–196. (In Chinese) [Google Scholar] [CrossRef]
  22. Li, Y.; Han, C.; Sun, S.; Zhao, C. Effects of Tree Species and Soil Enzyme Activities on Soil Nutrients in Dryland Plantations. Forests 2021, 12, 1153. [Google Scholar] [CrossRef]
  23. Li, Y.; Dong, X.; Yao, W.; Han, C.; Sun, S.; Zhao, C. C, N, P, K stoichiometric characteristics of the “leaf-root-litter-soil” system in dryland plantations. Ecol. Indic. 2022, 143, 109371. [Google Scholar] [CrossRef]
  24. Chen, Z.; Wang, G.; Pan, Y.; Yang, X.; Shen, Y. Water use patterns differed notably with season and slope aspect for Caragana korshinskii on the Loess Plateau of China. Catena 2021, 198, 105028. [Google Scholar] [CrossRef]
  25. Jia, H.K.; Liu, Y.H.; Xu, X.; Wang, K.; Gao, Q. Simulation of soil water dynamics in a caragana intermedia woodland in HuangFuChuan watershed: Relationships among slope, aspect, plant density and soil water content. Chin. J. Plant. Ecol. 2005, 29, 910–917. (In Chinese) [Google Scholar]
  26. Jia, X.; Wang, X.; Hou, L.; Wei, X.; Zhang, Y.; Shao, M.; Zhao, X. Variable response of inorganic carbon and consistent increase of organic carbon as a consequence of afforestation in areas with semiarid soils. Land Degrad. Dev. 2019, 30, 1345–1356. [Google Scholar] [CrossRef]
  27. Yang, X.Y.; Li, P.R.; Zhang, S.L.; Sun, B.H.; Chen, X.P. Long-term-fertilization effects on soil organic carbon, physical properties, and wheat yield of a loess soil. J. Plant Nutr. Soil Sci. 2011, 174, 775–784. [Google Scholar] [CrossRef]
  28. Bryk, M.; Kołodziej, B.; Słowińska-Jurkiewicz, A.; Jaroszuk-Sierocińska, M. Evaluation of soil structure and physical properties influenced by weather conditions during autumn-winter-spring season. Soil Till. Res. 2017, 170, 66–76. [Google Scholar] [CrossRef]
  29. Li, Q.; Liu, G.B.; Zhang, Z.; Tuo, D.F.; Bai, R.R.; Qiao, F.F. Relative contribution of root physical enlacing and biochemistrical exudates to soil erosion resistance in the Loess soil. Catena 2017, 153, 61–65. [Google Scholar] [CrossRef]
  30. Biesgen, D.; Frindte, K.; Maarastawi, S.; Knief, C. Clay content modulates differences in bacterial community structure in soil aggregates of different size. Geoderma 2020, 376, 114544. [Google Scholar] [CrossRef]
  31. Liu, J.X.; Liu, G.B.; Flanagan, D.C.; Wang, B.; Wang, Z.Y.; Xiao, J. Effects of soil-incorporated plant litter morphological characteristics on the soil detachment process in grassland on the Loess Plateau of China. Sci. Total Environ. 2019, 705, 134651. [Google Scholar] [CrossRef]
  32. Zhang, X.; Zhao, W.; Liu, Y.; Fang, X.; Feng, Q.; Chen, Z. Spatial variations and impact factors of soil water content in typical natural and artificial grasslands: A case study in the Loess Plateau of China. J. Soil Sediment. 2017, 17, 157–171. [Google Scholar] [CrossRef]
  33. English, N.B.; Weltzin, J.F.; Fravolini, A.; Thomas, L.; Williams, D.G. The influence of soil texture and vegetation on soil moisture under rainout shelters in a semi-desert grassland. J. Arid. Environ. 2005, 63, 324–343. [Google Scholar] [CrossRef]
  34. Bashkin, M.A.; Binkley, D. Changes in soil carbon following afforestation in Hawaii. Ecology 1998, 79, 828–833. [Google Scholar] [CrossRef]
  35. Segura, C.; Navarro, F.B.; Jiménez, M.N.; Fernández-Ondoño, E. Implications of afforestation vs. secondary succession for soil properties under a semiarid climate. Sci. Total. Environ. 2020, 704, 135393. [Google Scholar] [CrossRef]
  36. Li, K.; Ni, R.; Lv, C.; Xue, L.; Zhang, C.; Li, C.; Shen, W.; Guo, H.; Zhang, Y. The effect of Robinia Pseudoacacia expansion on the soil particle size distribution on Mount Tai, China. Catena 2022, 208, 105774. [Google Scholar] [CrossRef]
  37. Naldini, M.B.; Harguindeguy, N.P.; Kowaljow, E. Soil carbon release enhanced by increased litter input in a degraded semi-arid forest soil. J. Arid. Environ. 2021, 186, 104400. [Google Scholar] [CrossRef]
  38. Desrochers, A.; Landhausser, S.M.; Lieffers, V.J. Coarse and fine root respiration in aspen (Populus tremuloides). Tree Physiol. 2002, 22, 725–732. [Google Scholar] [CrossRef]
  39. Deng, Q.; McMahon, D.E.; Xiang, Y.; Yu, C.L.; Jackson, R.B.; Hui, D. A global meta-analysis of soil phosphorus dynamics after afforestation. New Phytol. 2017, 213, 181–192. [Google Scholar] [CrossRef]
  40. Hussain, S.I.; Phillips, L.A.; Hu, Y.; Frey, S.K.; Geuder, D.S.; Edwards, M.; Lapen, D.R.; Ptacek, C.J.; Blowes, D.W. Differences in phosphorus biogeochemistry and mediating microorganisms in the matrix and macropores of an agricultural clay loam soil. Soil Biol. Biochem. 2021, 161, 108365. [Google Scholar] [CrossRef]
  41. Li, J.; Xin, Z.; Yan, J.; Li, H.; Chen, J.; Ding, G. Physicochemical and microbiological assessment of soil quality on a chronosequence of a mine reclamation site. Eur. J. Soil Sci. 2018, 69, 1056–1067. [Google Scholar] [CrossRef]
  42. Zhao, X.; Wu, P.; Gao, X.; Persaud, N. Soil quality indicators in relation to land use and topography in a small catchment on the Loess Plateau of China. Land Degrad. Dev. 2015, 26, 54–61. [Google Scholar] [CrossRef]
  43. Hunziker, M.; Arnalds, O.; Kuhn, N.J. Evaluating the carbon sequestration potential of volcanic soils in southern Iceland after birch afforestation. Soil 2019, 5, 223–238. [Google Scholar] [CrossRef]
  44. Segura, C.; Jiménez, M.N.; Fernández-Ondoño, E.; Navarro, F.B. Effects of Afforestation on Plant Diversity and Soil Quality in Semiarid SE Spain. Forests 2021, 12, 1730. [Google Scholar] [CrossRef]
  45. Liu, L.J.; Gou, G.L.; Liu, J.X.; Zhang, X.B.; Zhu, Q.L.; Mou, J.X.; Yang, R.Y.; Wan, Y.X.; Meng, L.; Tang, S.R.; et al. Effects of Dodonaea viscosa Afforestation on Soil Nutrients and Aggregate Stability in Karst Graben Basin. Land 2022, 11, 1140. [Google Scholar] [CrossRef]
  46. Raiesi, F.; Kabiri, V. Identification of soil quality indicators for assessing the effect of different tillage practices through a soil quality index in a semi-arid environment. Ecol. Indic. 2016, 71, 198–207. [Google Scholar] [CrossRef]
  47. Klinerová, T.; Dostál, P. Nutrient-demanding species face less negative competition and plant–soil feedback effects in a nutrient-rich environment. New Phytol. 2020, 225, 1343–1354. [Google Scholar] [CrossRef]
  48. Håkansson, I.; Lipiec, J. A review of the usefulness of relative bulk density values in studies of soil structure and compaction. Soil Till. Res. 2000, 53, 71–85. [Google Scholar] [CrossRef]
  49. Mora, J.L.; Lázaro, R. Seasonal changes in bulk density under semiarid patchy vegetation: The soil beats. Geoderma 2014, 235–236, 30–38. [Google Scholar] [CrossRef]
Figure 1. Map of the study area and plantation distribution.
Forests 14 00329 g001
Figure 2. Change characteristics of height (a), crown diameter (CD) (b), specific leaf area (SLA) (c), specific root length (SRL) (d), root dry matter content (RDMC) (e), specific root area (SRA) (f), and root water content (RWC) (g) in different afforestation years. The changes in SLA, SRL, and SRA are not significant.
Forests 14 00329 g002
Figure 3. Characteristics of soil texture in different afforestation years: (a) 13 years; (b) 35 years; and (c) 55 years.
Forests 14 00329 g003
Figure 4. Change characteristics of clay (a), silt (b), and sand (c) contents in soil, soil bulk density (BD) (d), and soil water content (SWC) (e) in different afforestation years.
Forests 14 00329 g004
Figure 5. Change characteristics of soil organic carbon (SOC) (a), total nitrogen (TN) (b), available soil nitrogen (AN) (c), total phosphorus (TP) (d), and available phosphorus (AP) (e) in different afforestation years.
Forests 14 00329 g005
Figure 6. Soil quality index (SQI) of different afforestation years.
Forests 14 00329 g006
Figure 7. PCA ordination diagram for soil quality index (SQI), soil properties, vegetation characteristics, and leaf and root characteristics.
Forests 14 00329 g007
Disclaimer/Publisher’s Note: The statements, opinions and data contained in all publications are solely those of the individual author(s) and contributor(s) and not of MDPI and/or the editor(s). MDPI and/or the editor(s) disclaim responsibility for any injury to people or property resulting from any ideas, methods, instructions or products referred to in the content.

